
Abstract
The present study aimed to examine whether positron emission tomography (PET) could evaluate cerebral angiogenesis. Mice were housed in a hypoxic chamber with 8–9% oxygen for 4, 7, and 14 days, and the angiogenic responses were evaluated with a radiotracer, 64Cu-cyclam-RAFT-c(-RGDfK-)4, which targeted αVβ3 integrin and was imaged with PET. The PET imaging results showed little uptake during all of the hypoxic periods. Immunofluorescence staining of the β3 integrin, CD61, revealed weak expression, while the microvessel density assessed by CD31 staining increased with the hypoxic duration. These observations suggest that the increased vascular density originated from other types of vascular remodeling, unlike angiogenic sprouting. We then searched for any signs of vascular remodeling that could be detected using PET. PET imaging of 11C-PK11195, a marker of the 18-kDa translocator protein (TSPO), revealed a transient increase at day 4 of hypoxia. Because the immunofluorescence of glial markers showed unchanged staining over the early phase of hypoxia, the observed upregulation of TSPO expression probably originated from non-glial cells (e.g. vascular cells). In conclusion, a transient increase in TSPO probe uptake was detected with PET at only the early phase of hypoxia, which indicates an early sign of vascular remodeling induced by hypoxia.
Keywords
Introduction
Cerebrovascular remodeling is an important adaptive response to cerebral hypoxia10,17,18,20 and ischemia.1,9,16 The response of the vasculature includes increased expression of transcription factors (e.g. hypoxia inducible factors) and growth factors (e.g. vascular endothelial growth factor and angiopoietins),19,37 indicating the involvement of cerebral angiogenesis in vascular remodeling.5,10,21,23,32,40 Angiogenesis involves the sprouting of new capillaries from pre-existing blood vessels, 5 whereas vascular remodeling is a broad definition of vascular modifications consisting of vasculogenesis, angiogenesis, and the enlargement of pre-existing vessels. 31
We recently characterized the time-dependent effects of chronic hypoxia on vascular remodeling by repeatedly observing three-dimensional microvascular structures in living mouse brains with two-photon microscopy. Our results showed significant dilation of the parenchymal capillaries at seven days after the induction of chronic hypoxia, 41 and there were new capillary sprouts from existing vessels within 7–14 days of hypoxia. 28 Other reports have shown that brain endothelial cell (BEC) proliferation, αVβ1 integrin expression by BECs, and the extracellular matrix fibronectin expression reach maximal levels after four days of hypoxia,23,29 and α5β1 and αVβ3 integrin expression is increased in cerebral ischemia.1,25
The communication between microglial cells and angiogenic sprouts has been described in aortic ring cultures, suggesting that microglia promote vascular network formation. 34 In cerebral hypoxia, endothelial cell proliferation is followed by astrocyte activation. 24 It has also been observed that, in the developing retina, in vivo microglial cells stimulate angiogenesis. 38 Furthermore, recent studies have pointed to the importance of microglia in shaping the central nervous system (CNS) vasculature during development, as well as in re-shaping these vessels during pathological insults. 2 Although both cerebrovascular remodeling and glial activation have been investigated in detail, the relationship between glial activation and cerebrovascular remodeling, with details such as the temporal sequence, has not been systematically investigated.
The aim of the present study was to examine whether cerebral angiogenesis could be detected using positron emission tomography (PET), which may enable the direct imaging of angiogenesis with high sensitivity and improved spatial coverage of the brain. To address this aim, we used an established mouse model of cerebral angiogenesis induced by chronic hypoxia 23 and a recently developed peptide-based PET probe, 64Cu-cyclam-RAFT-c(-RGDfK-)4 (64Cu-RAFT-RGD), 13 which was used to target the αVβ3 integrin. The αVβ3 integrin is highly expressed on activated endothelial cells during angiogenesis and is widely accepted as an angiogenesis biomarker in tumor models.11,36 Next, we used PET to search for any early signs of the vascular remodeling induced by cerebral hypoxia. We selected an 18 kDa translocator protein (TSPO) marker, 11C-PK11195, which is commonly used to evaluate glial activation in hypoxic cerebral ischemia in preclinical and clinical studies.
Materials and methods
Animals and hypoxia model
The mice used in this study were male C57BL/6 J (20–30 g; Japan SLC Inc., Shizuoka, Japan) aged 8–12 weeks. We used a total of 52 mice for the following experiments: 14, 22, 8, and 8 mice for the angiogenesis PET, TSPO-PET, TSPO-autoradiography (ARG), and immunofluorescent (IF) studies, respectively. For hypoxic exposures, the animals were housed in a hypoxic chamber in which the oxygen concentration was maintained at 8–9% (refer to Yoshihara et al. 41 ). The hypoxic periods were either control (D0) or 4 (D4), 7 (D7), and 14 (D14) days of hypoxia. For those PET studies, each animal experiment was terminated at a single hypoxic time-point. This was due to an institutional regulation that prevented animals administered with the 64Cu tracer from returning to the hypoxic chamber. In addition, multiple 90 min dynamic scans with 11C-PK11195 likely produced substantial stress for the animals. The numbers of animals used for the angiogenesis PET studies were 3, 2(2), 5, and 4 for D0, D4, D7, and D14, respectively, and for the TSPO PET studies, they were 7, 4, 7(2), and 4(1) for D0, D4, D7, and D14, respectively. Of these animals, the numbers in the parenthesis indicated the number of animals that were not used due to an accidental death of the animals during PET scans. Animal use and the experimental protocols were approved by the Institutional Animal Ethics Committee of the National Institute of Radiological Sciences, and all experimental procedures were in accordance with the guidelines set by the institute for the humane care and use of laboratory animals in compliance with ARRIVE guidelines.
PET studies to evaluate angiogenesis
To evaluate the anatomical distribution of angiogenesis, we used PET and a specific radiotracer for αVβ3 integrin, 64Cu-RAFT-RGD, that was synthesized in our institute. 13 We chose this tracer because of (1) the availability of 64Cu-RAFT-RGD, which was developed by our group, 13 (2) a high specificity for the αVβ3 and high biostability, 15 and (3) the establishment of this tracer in detecting angiogenesis in tumors 13 and in myocardial infarction models with its 99mTc-labeled radio-analog. 8 Additionally, it was shown that 64Cu-RAFT-RDG did not have to be permeable through the blood–brain barrier because this ligand binds with integrins of the vascular endothelial cells. 14
PET was performed using an INVEON (Siemens, Knoxville, USA) with a static scan from 180 to 210 min after the injection of the tracer. Within this time period, the tracer 64Cu-RAFT-RGD was shown to be stable in the blood of living mice.14,15 The dose and volume of the injected tracer were 26.4 ± 9.0 MBq and 100–150 µL, respectively. The radioactivity was corrected for a physical decay of 64Cu (half-time 12.7 h) from the time of tracer injection. Because the brain signal was very low, the average standardized uptake value (SUV) of the entire brain was calculated instead of relying on the regional SUV.
After angiogenesis PET scanning, a total of five mice (2, 2, and 1 animals for D0, D7, and D14, respectively) were decapitated to further obtain ex vivo ARG. The brains were rapidly removed from the skulls and frozen in powdered dry ice. Frozen brain samples were sliced to 20-µm thickness using a cryostat (HM560, Zeiss, Germany). The brain sections were mounted on glass slides (Matsunami Glass, Osaka, Japan) and set on an imaging plate (BAS IP SR 2025E, GE Healthcare). These slices were exposed to air for 24 h and scanned with a BAS-5000 (Fuji Film Co. Ltd). ARG images were analyzed with multi gauge software (Fuji Film Co. Ltd).
PET studies to evaluate TSPO expression
To evaluate TSPO expression, we used a PET scanner (FOCUS 220, Siemens Medical Solutions, Malvern, PA, USA) and a TSPO marker (11C-PK11195 synthesized in our institute). Mice were anesthetized with isoflurane (3–4% for induction and 1.2–1.5% for maintenance) and a 32-gauge needle (Terumo, Tokyo, Japan) connected to a polyethylene catheter (SP10, Natsume Seisakusho Co. Ltd, Tokyo, Japan) was inserted into the tail vein for tracer injection before PET scanning. A 90-min list-mode PET scan was started upon injection of the tracer into the tail vein. The dose and volume of the injected tracers were 36.7 ± 4.9 MBq and 100–150 µL, respectively. The body temperature was maintained at 37℃ using a heating pad during scanning.
List-mode data were sorted and Fourier-rebinned into two-dimensional sinograms (4 one-min, 8 two-min and 14 five-min; a total of 26 frames for 90 min). Then, the images were reconstructed using a two-dimensional filtered back projection with a 0.5-mm Hanning filter. The radioactivity was corrected for the physical decay of 11C (half-life of 20.4 min). Dynamic PET images were fused to our custom MRI (T2WI) template for the C57BL/6 J strain using PMOD (v3.2, PMOD Technologies, Switzerland), then applied using the common three-dimensional volumes of interest (VOIs) for cortices (ctx), striatums (str), thalami (thl), hippocampi (hpc), and cerebellums (cbl). The time-activity curve (TAC) was obtained for each VOI. Data tainted by head motion during scanning were omitted from the analysis. Because of a lack of a reference area for analyzing this tracer, kinetic analysis was not performed. Instead, the average SUV was calculated for the periods between 30 and 60 min.
To confirm whether a change in the SUV was indicative of a specific binding in 11C-PK11195-PET, an in vitro ARG of 11C-PK11195 was performed in the different sets of the animals (N = 8; 2 for each of the D0, D4, D7, and D14 groups). A pair of adjacent fresh-frozen brain slices containing the thalamus and hippocampus from each hypoxic period group (D0, D4, D7 and D14) were selected. Two incubation buffers with 2 nM of 11C-PK11195 in a 50 mM Tris-HCl buffer (pH = 7.4) were prepared: one with non-radioactive PK11195 (10 µM) for blocking and the other without non-radioactive PK11195. A pair of the adjustment brain sections was incubated in each buffer at room temperature for 60 min. After incubation with 11C-PK11195, the sections were immersed twice in ice-cold Tris-HCl buffer for 2 min; then, they were rinsed with ice-cold distilled water for 10 s and air-dried. The sections were then mounted onto an imaging plate (BAS IP SR 2025E, GE Healthcare), exposed for 60 min and scanned with a BAS5000 system (Fuji Film Co. Ltd). The ARG images were analyzed with multi gauge software (Fuji Film Co. Ltd). Two sets of 11C-PK11195 ARG images were obtained, i.e. (a) without cold PK11195 blocking and (b) with cold blocking. The specific binding of 11C-PK11195 was obtained by subtracting (b) from (a).
Immunofluorescence studies
The animals (N = 8; 2 each for the D0, D4, D7, and D14 groups) for IF studies were anesthetized with an intraperitoneal injection of pentobarbital (50 mg/kg), perfused transcardially with normal saline, and sacrificed. Their brain tissues were then removed, frozen in dry ice, sliced into coronal sections (20 µm thick), and maintained at −80℃ until use.
The microvessels and angiogenesis were evaluated based on our published protocols. 14 In brief, the sections were air-dried overnight at room temperature (RT) and fixed in acetone at 4℃ for 20 min. The sections were then doubly stained with a rat anti-mouse CD31 monoclonal antibody (1:1500 dilution; BD Biosciences, Bedford, MA) to evaluate the vascular endothelium and an Armenian hamster anti-mouse CD61 antibody (1:50 dilution; BD Biosciences) to evaluate the integrin β3 chain, which were visualized using secondary antibodies of Alexa Fluor 594-conjugated goat anti-rat antibody (1:200 dilution; Invitrogen, Camarillo, CA) and Alexa Fluor 488-conjugated goat anti-Armenian hamster antibody (1:100 dilution; Jackson ImmunoResearch, West Grove, PA). IF images of the CD31 and the CD61 staining were separately acquired using a fluorescence microscope system (BIOREVO BZ-9000, Keyence Corp, Tokyo). CD31 images were analyzed using ImageJ (NIH, USA) to evaluate the microvessel density (microvessels/mm2).
To identify a possible origin of TSPO expression, the sections were fixed in 4% paraformaldehyde (4PHA) overnight at 4℃ and incubated with the TNB solution (0.1 M Tris-HCl (pH 7.5), 0.1 M NaCl, and 0.5% blocking reagent (FP1020, ParkinElmer, Inc., Waltham, MA, USA)) at RT for 1 h for non-specific blocking. The sections were then reacted overnight at 4℃ with primary antibodies, which was followed by incubation with the fluorescent-probe-conjugated secondary antibodies at RT for 60 min. The primary antibodies were rabbit polyclonal antibody against ionized calcium binding adapter molecule-1 (Iba1; diluted 1:500; Wako Pure Chemicals, Tokyo, Japan) as the microglial marker and a rat monoclonal antibody against glial fibrillary acidic protein (GFAP; diluted 1:200) (2.2B10; Zymed/Invitrogen) as the astrocyte marker. IF images were analyzed using ImageJ.
Statistical analysis
The statistical significance of PET SUV data with 64Cu-RAFT-RDG and 11C-PK11195 was analyzed based on ANOVA. The correlation between PET and in vitro ARG of 11C-PK11195 was analyzed using region of interest (ROI) based data because of the different image modalities. The ROIs were selected in the bilateral cortices and thalami in both the PET and ARG at D0, D4, D7 and D14, and the obtained values of the left and right ROIs were averaged. Pearson’s correlation coefficient was then calculated.
Results
Angiogenesis evaluation
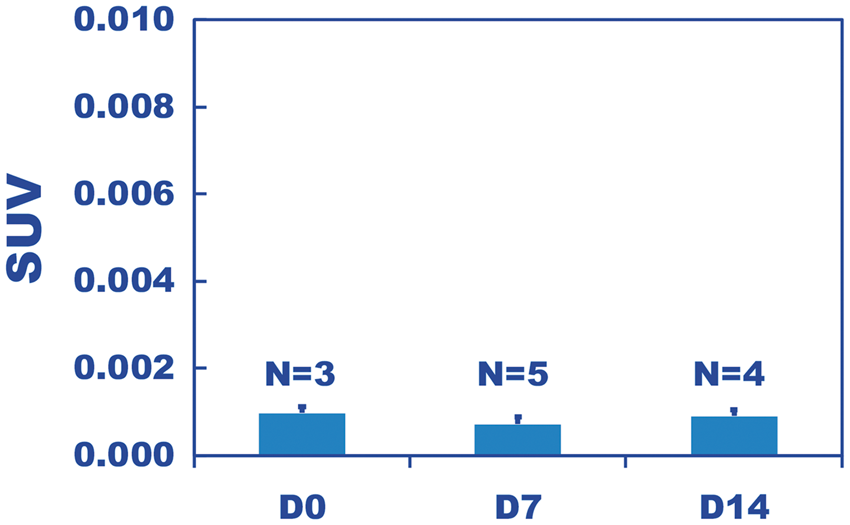
PET scanning of the integrin αVβ3 marker 64Cu-RAFT-RGD resulted in very little brain signal at 3 h after intravenous injection (Figure 1). The SUVs at D0, D7, and D14 were negligibly low (SUV ∼ 0.001) (Figure 2), excluding D4 because the animal died before PET scanning due to accidental hyperthermia caused by strong light irradiation during 2.5 hours of pre-scanning waiting time. In addition, ex vivo ARG revealed negligible radioactivity in the brain tissue areas with the exception of the CSF area, where the tracer leaked through the CSF-brain barrier during the early stage following the injection, or the tracer was absorbed into the choroid plexus (Supplementary Figure 1).
PET image (top) of 64Cu-RAFT-RGD co-registered with a custom MRI (T2WI) template using PMOD (bottom). Each image set includes a coronal (left), sagittal (middle) and axial (right) section. PET was performed for a D7 hypoxia mouse with 30 min of scanning at 3 h after tracer injection. Whole brain-averaged standardized uptake value (SUV) at 3 h after intravenous injection of 64Cu-RAFT-RGD for the D0, D7 and D14 hypoxia periods. The low SUV suggests there was negligible binding of αVβ3 integrin in the brain tissue.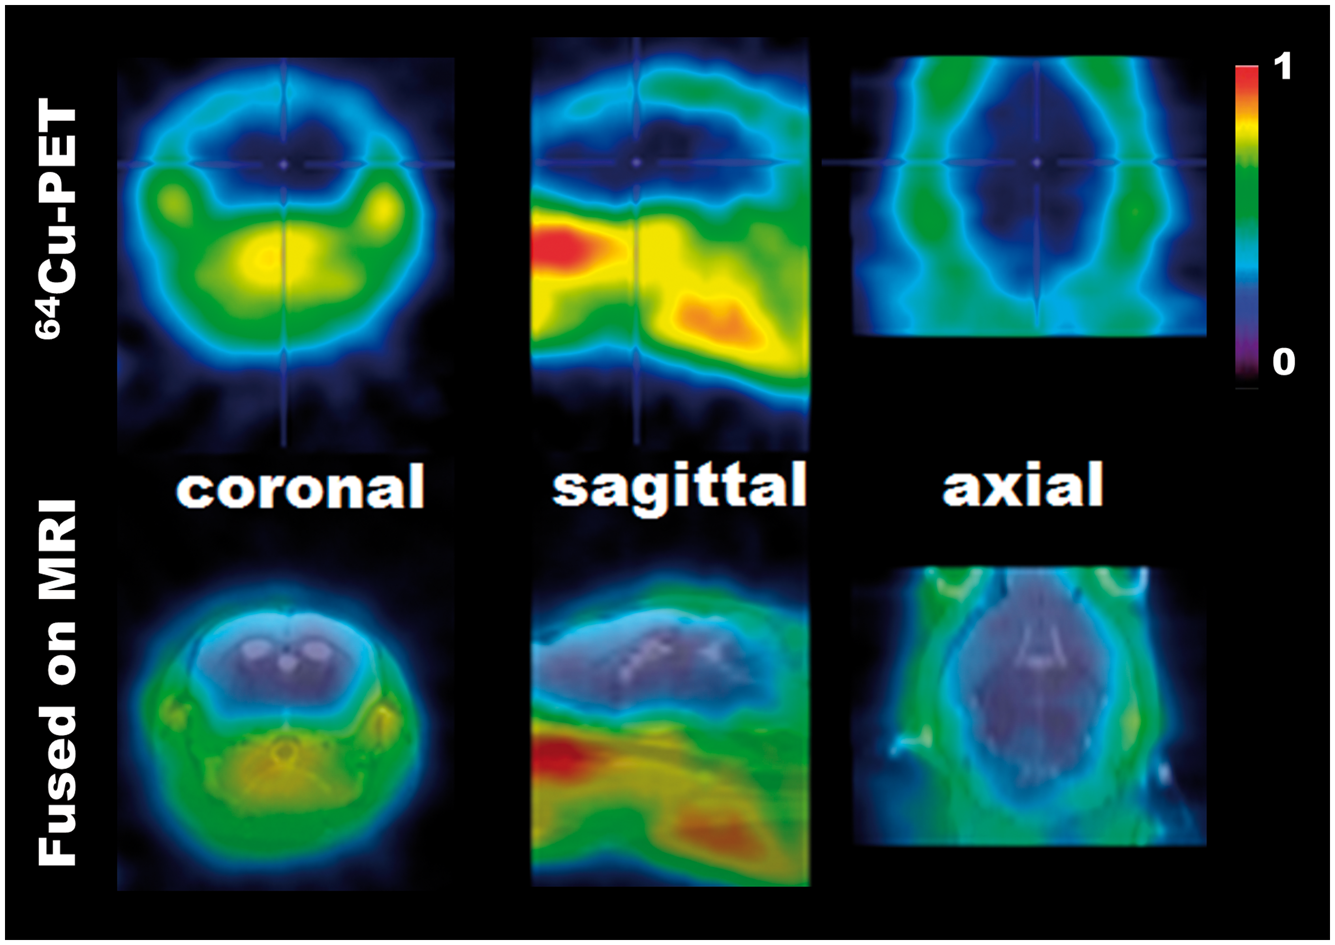
In the IF study, CD61 staining, which reacts with the integrin β3 chain that is associated with the integrin αV chain, exhibited weak co-staining with CD31 staining of the endothelium (Supplementary Figure 2). Thus, CD61 staining supported that there was little uptake of the αVβ3 marker in the PET and ARG imaging experiments. On the other hand, the endothelium density, as determined by the CD31 staining density, increased in parallel with the hypoxic duration (Figure 3(a)). The area of the CD31 staining density showed a higher vascular density in the D7 and D14 hypoxic periods compared to the D0 and D4 periods (p > 0.05; Figure 3(b)).
(a) Immunofluorescence (IF) of CD31 staining of the cortex (ctx), hippocampus (hpc) and midbrain (mid) observed in mice after D0, D4, D7, and D14 hypoxic periods. The signals corresponded to the endothelial density and increased with longer hypoxic periods. (b) The endothelium density evaluated based on the CD31 staining of the average of the three brain regions. The density was gradually increased from the D0 to D7 hypoxic periods (p > 0.05).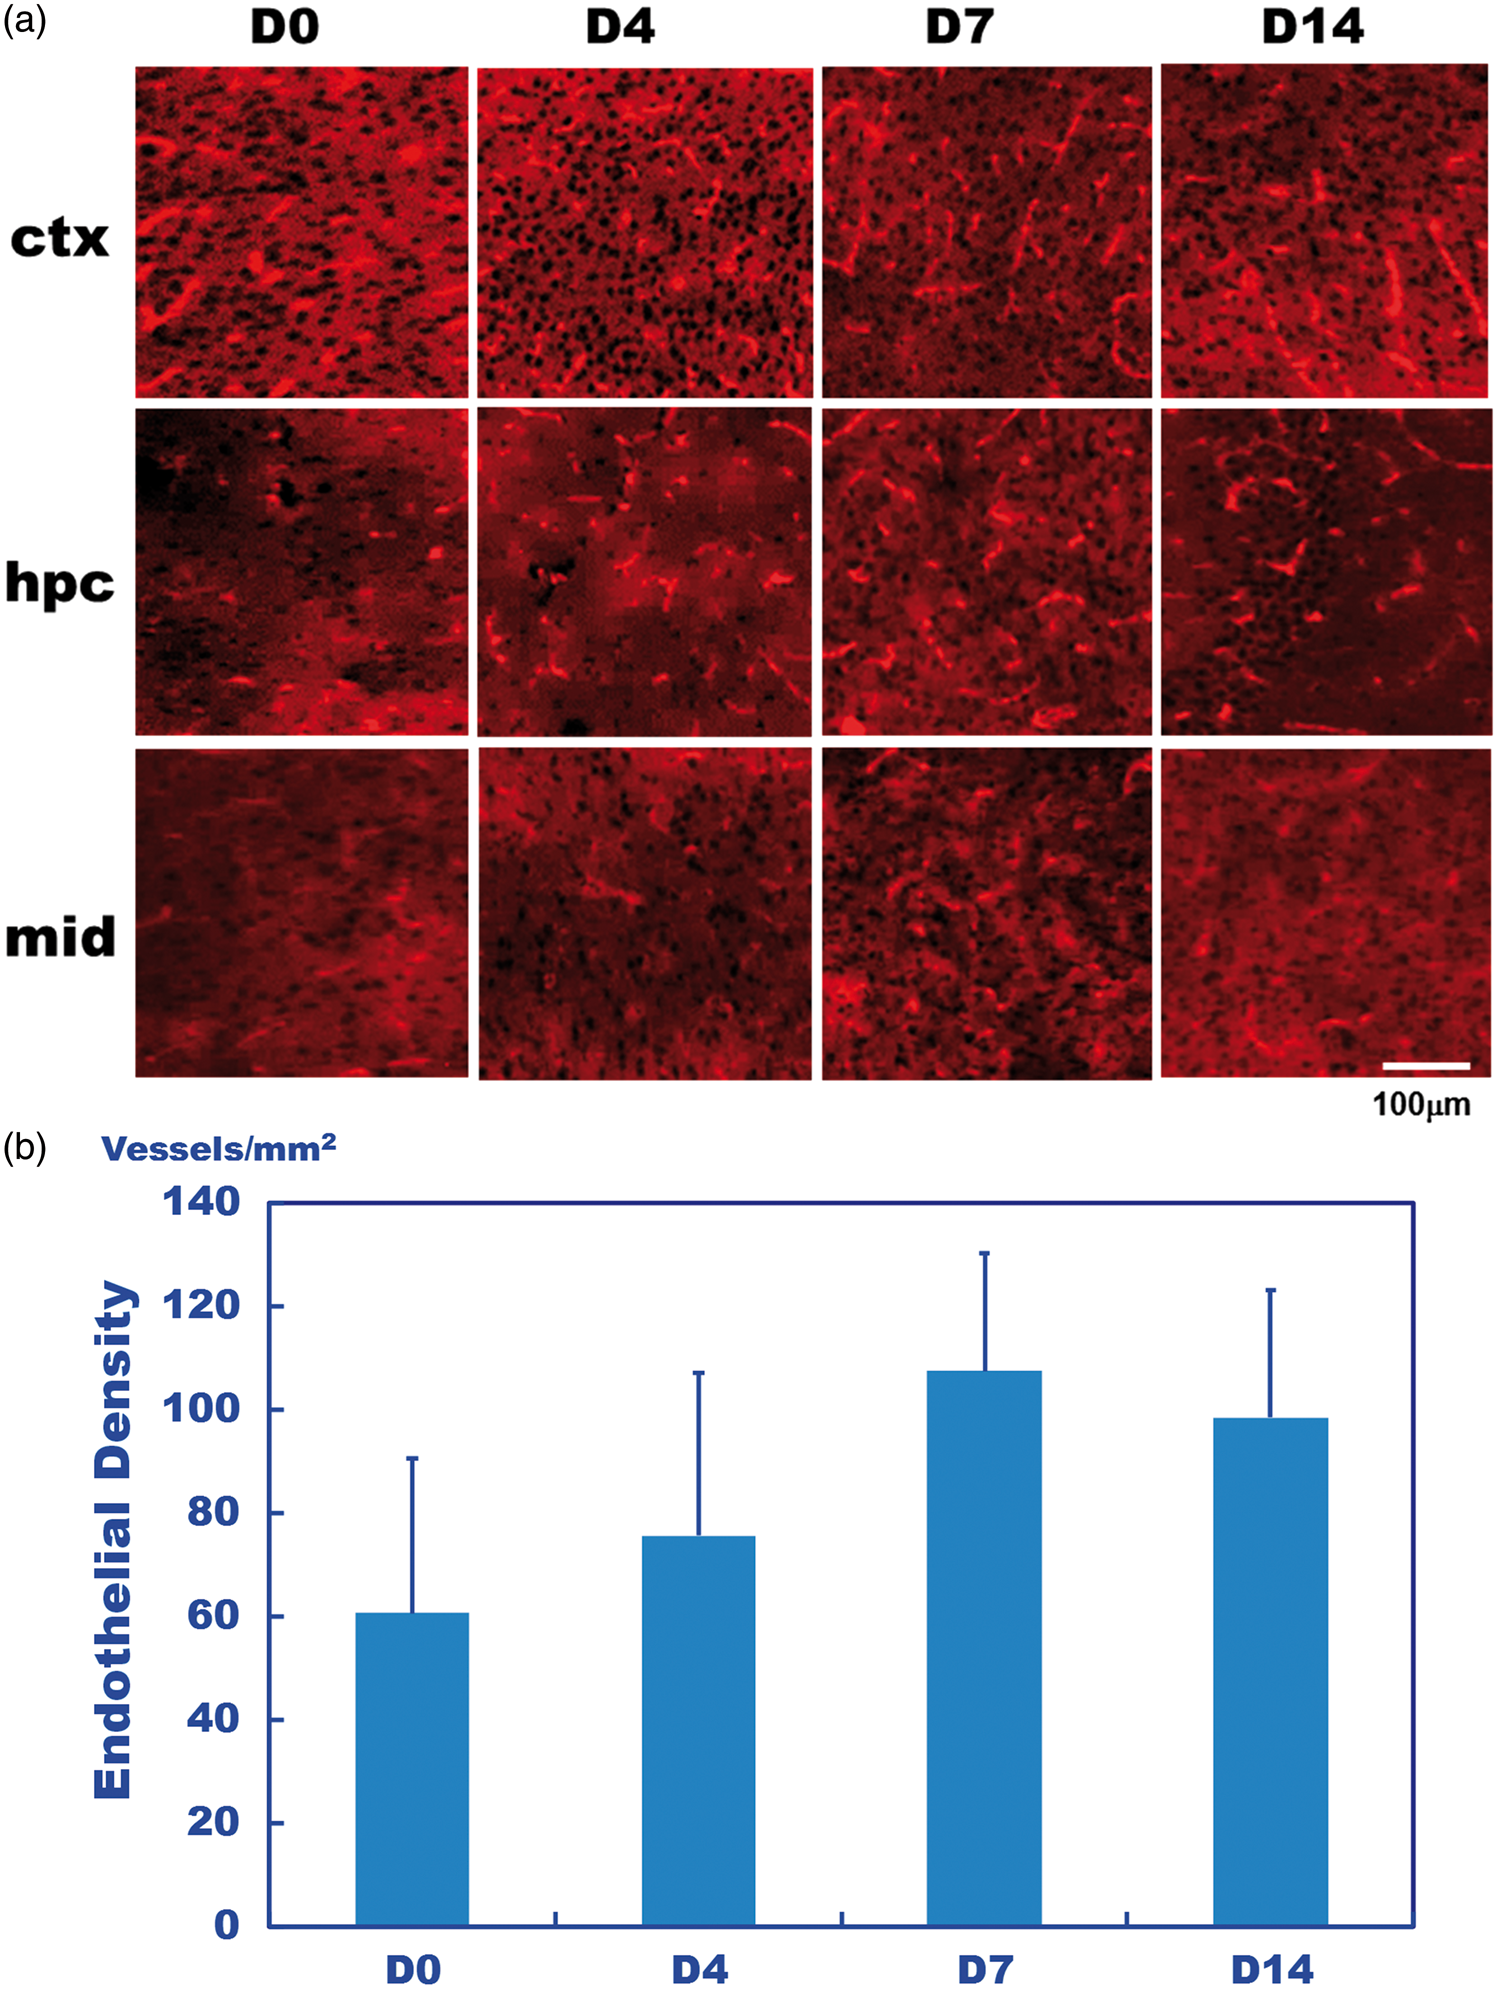
TSPO expression
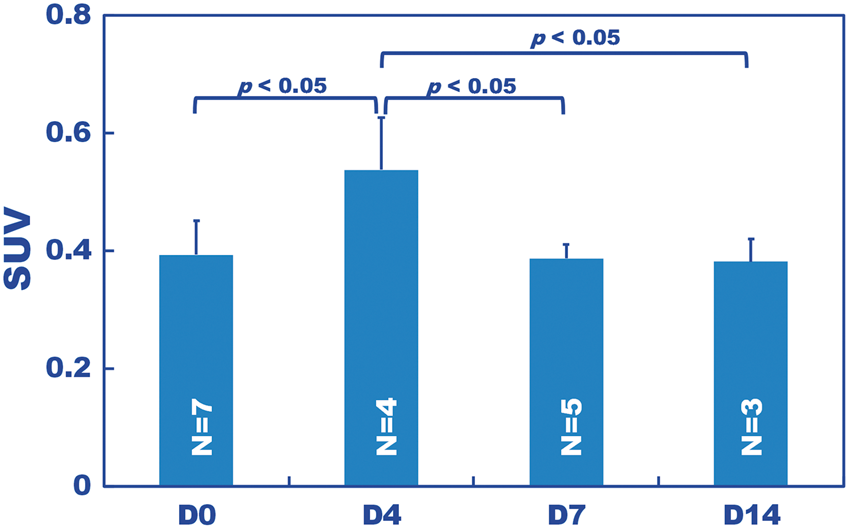
The 11C-PK11195 uptake distribution was almost uniform across all evaluated brain regions, with the exception of the slightly higher expression in the cerebellum compared to the other regions (Figure 4(a) and (b)). This increased expression was probably due to the lower partial volume effects than in the other regions. The regional SUVs were averaged for each hypoxic period (Figure 5). The SUV of D4 was significantly higher (p < 0.05), by approximately 40–50%, than those of D0, D7, and D14 (Figure 5, Supplementary Table 1).
(a) Typical PET images of 11C-PK11195 captured from a mouse exposed to 14 days of hypoxia. Sagittal (left) and axial (right) sections are shown. Custom MRI template (top), co-registered PET (middle) and fused images analyzed by PMOD are shown. (b) Standardized uptake value (SUV) obtained for the D0, D4, D7, and D14 hypoxic durations at each volume of interest (VOI), which was predefined on an MRI template of the cortices (ctx), striatums (str), thalami (thl), hippocampi (hpc) and cerebellums (cbl). The tracer uptake was nearly uniform over the brain with the exception of the cerebellum. Standardized uptake value (SUV) of 11C-PK11195 over the entire brain averaged over all VOIs shown in Figure 4(b). Each bar represents the average for each hypoxic period. The number of mice used is shown on each bar. Of all hypoxic periods, D4 had the highest SUV, which was 1.4-fold higher than the control (D0) (p < 0.05), and D7 and D14 decreased to the D0 level.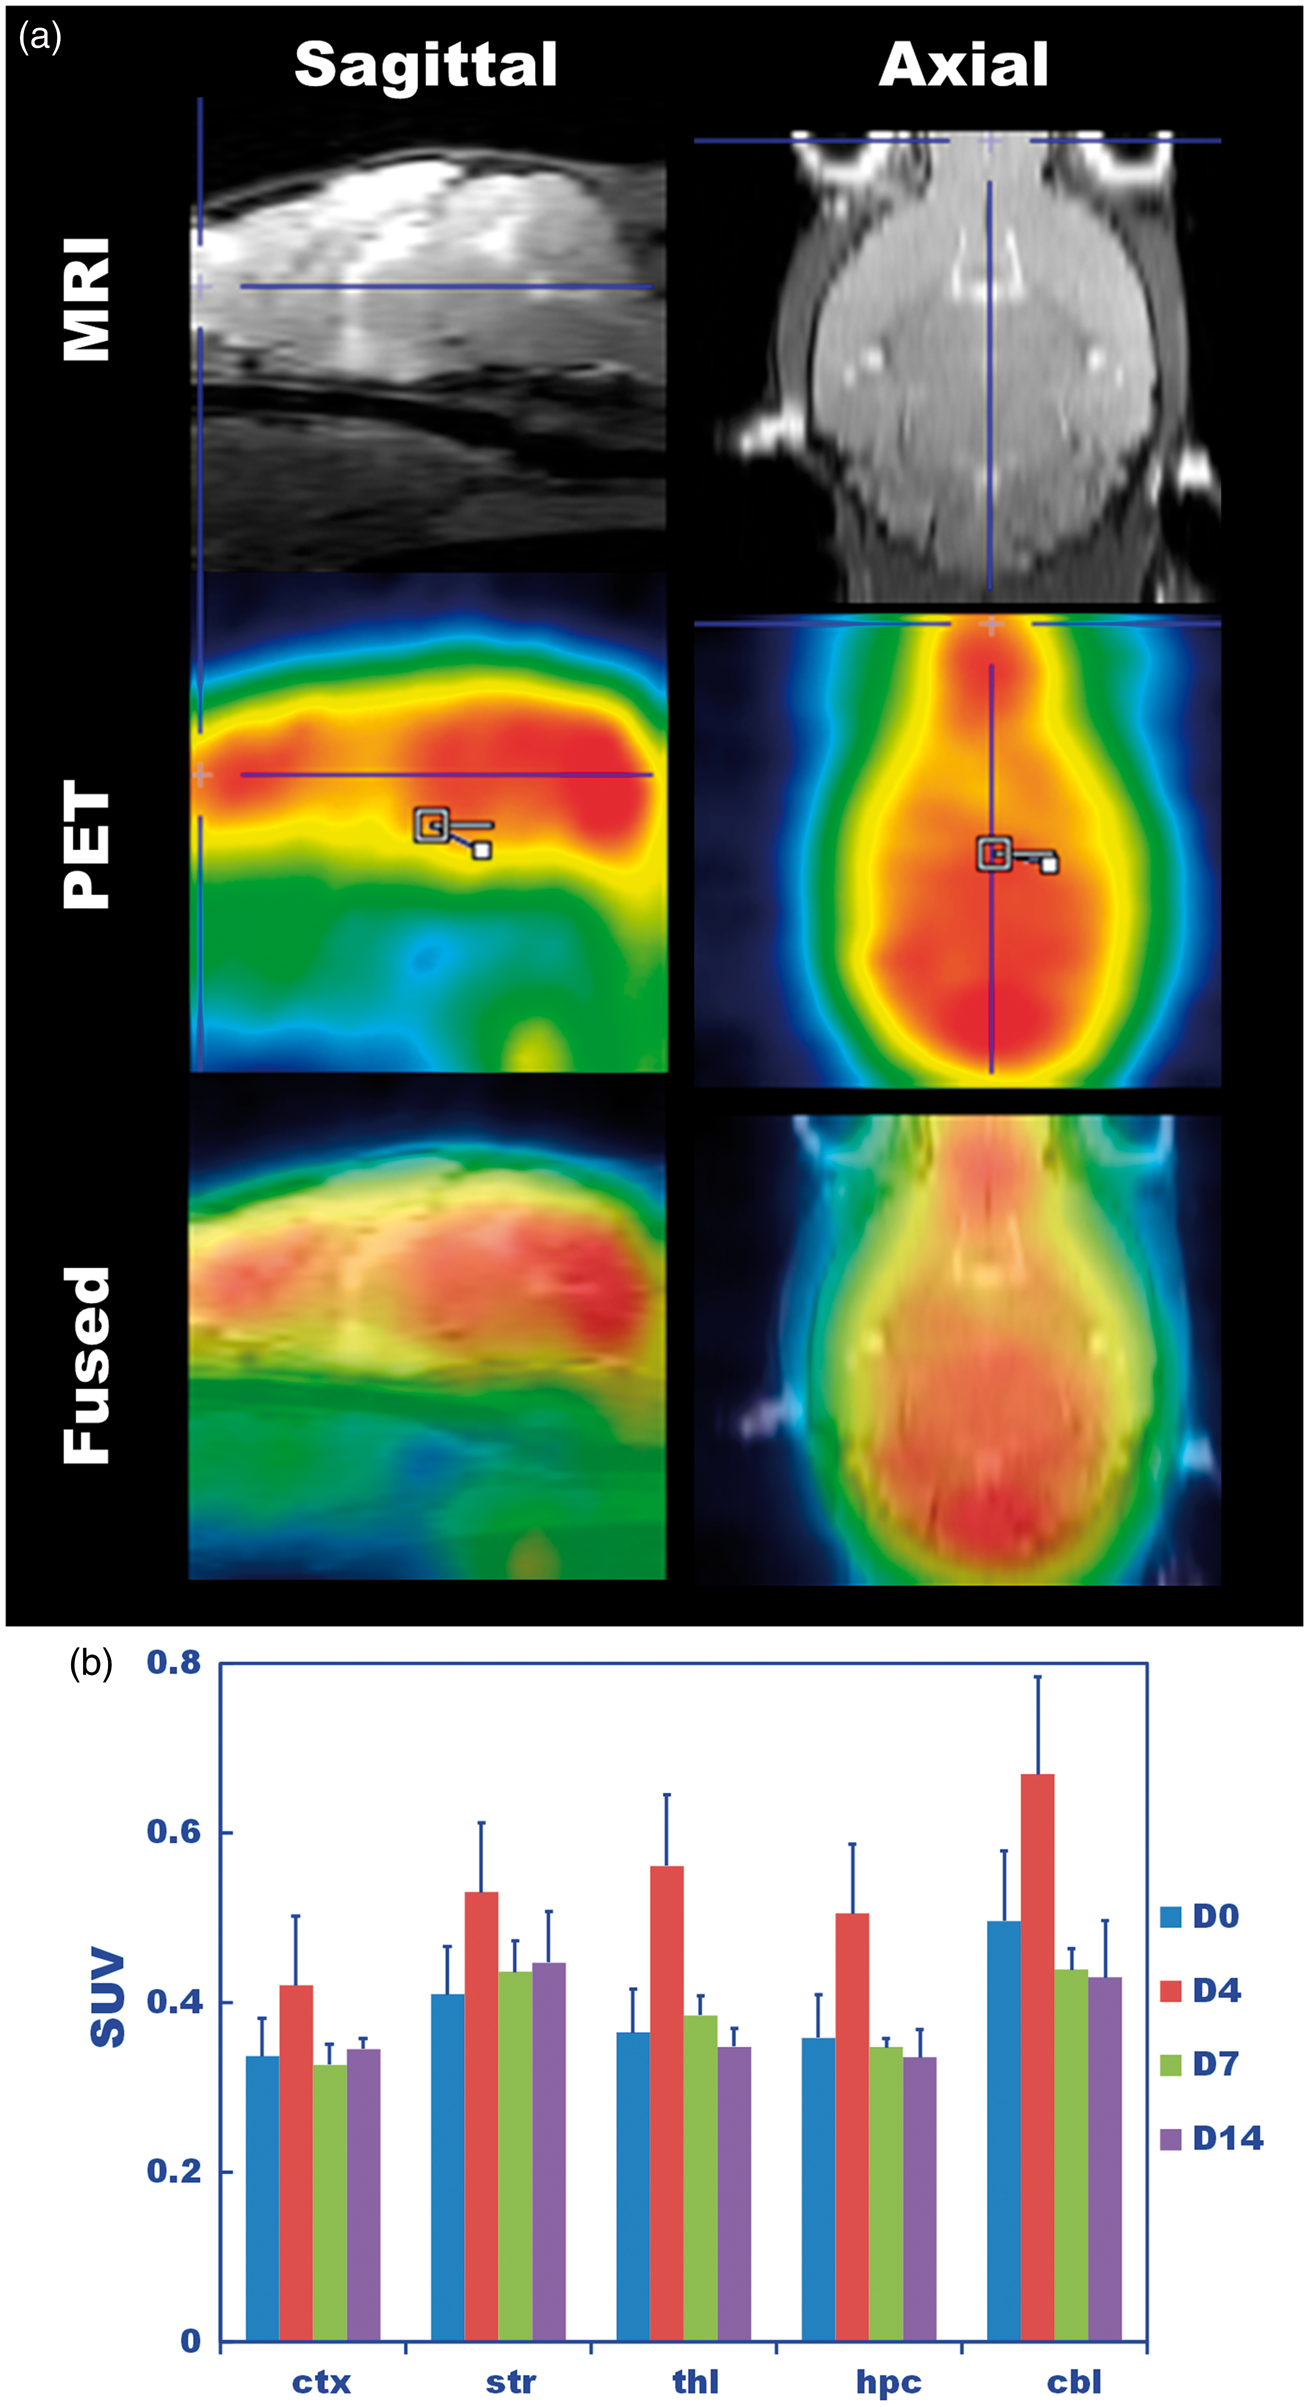
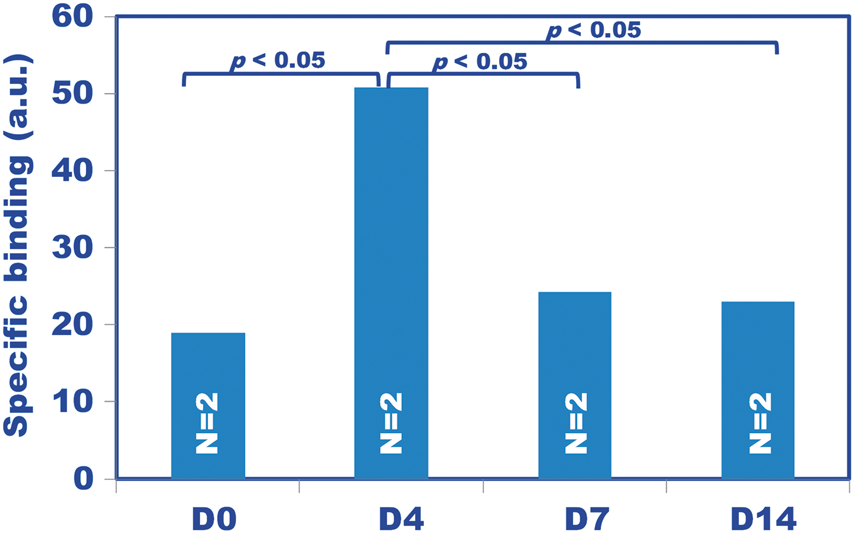
In the in vitro ARG, a slice image without blocking (Figure 6(a)) exhibited higher radioactivity than a slice image with blocking using cold PK11195 (Figure 6(b)). The subtraction of these, (a) minus (b), corresponding to the specific binding of 11C-PK11195, demonstrated the highest uptake in D4 compared to the other hypoxic periods (p < 0.05, Figure 7). The difference between D0 and D4 was larger in the in vitro ARG (Figure 7) than in PET (Figure 5). This increase may have been observed because in vitro ARG corresponds to specific binding, while the PET SUV was measured uniformly for a mix of non-specific and specific binding. Further analysis of ROI-based correlation between in vivo PET-SUV and in vitro ARG showed a significant positive correlation between the PET and ARG data (r = 0.892, p < 0.01; Supplementary Table 2, Supplementary Figure 3).
An in vitro autoradiography (ARG) of 11C-PK11195 incubated with samples that were (B) and were not (A) blocked with cold PK11195. These ARGs were made from adjacent sections of the mouse coronal slice at D4. Because the radioactivity density of the non-blocked sample (A) included specific plus non-specific binding and that of the blocked sample (B) only included non-specific binding, the result of (A) minus (B) corresponds to the density of the specific binding with 11C-PK11195. Specific binding obtained from the subtraction of the in vitro 11C-PK11195 ARG as described in the legend of Figure 6. The graph (arbitrary unit) for each hypoxic period represents the mean of two mice evaluated for each hypoxic period. The D4 hypoxic period had the highest specific binding compared to the other hypoxic periods (p < 0.05). Note that the specific binding was higher than for the PET SUV values (see Figure 5), which included specific plus non-specific binding.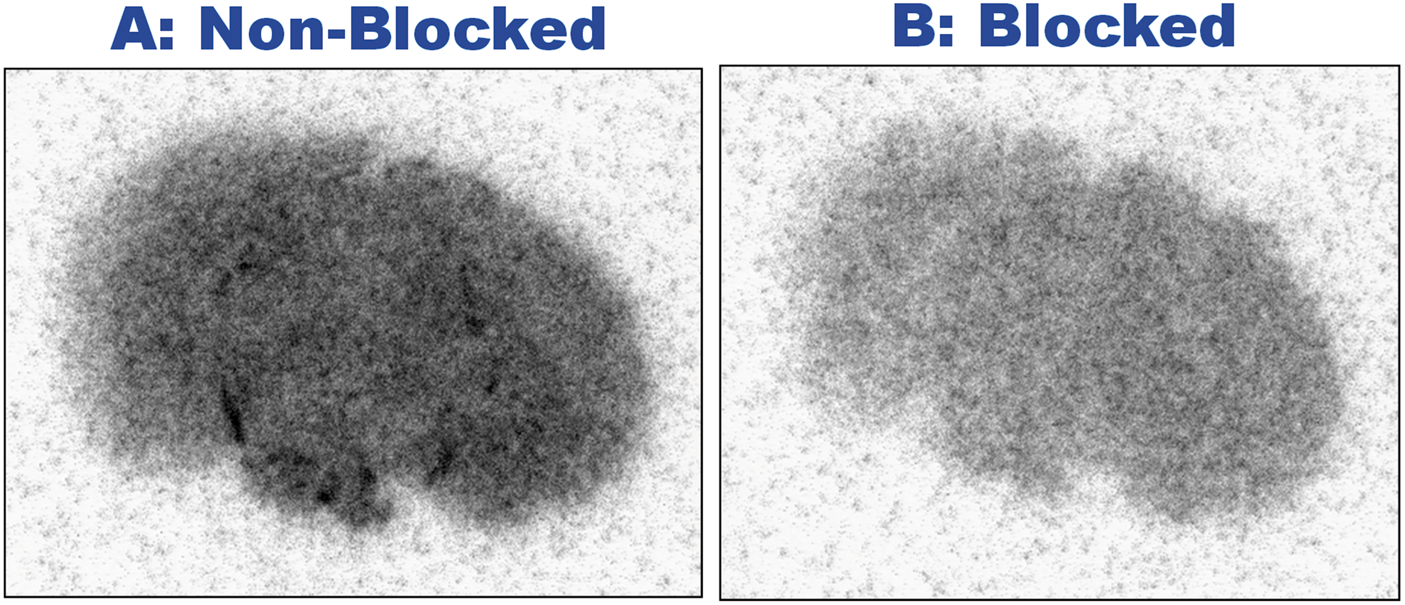
In IF, Iba1 staining, corresponding to the microglia, did not show any intensity changes throughout the hypoxic periods, D0, D4, D7, and D14 (NS) (Supplementary Figure 4). Additionally, GFAP staining, corresponding to the astrocytes, did not reveal any specific intensity changes throughout the hypoxic periods examined (NS) (Supplementary Figure 5). Both Iba1 and GFAP staining along hypoxic periods resulted in no correlation with time points of PK11195 ARG. However, enhanced IF of TSPO using 4PFA fixed slices of D0 and D4 revealed significant staining at the endothelium with much stronger staining in D4 than D0 (Supplementary Figure 6).
Discussion
It has been reported that chronic hypoxia, used as part of the pre-clinical model of cerebral ischemia, induces the vascular dilation of parenchymal capillaries and veins, 10 increases the density of parenchymal capillaries, 20 and sprouts new capillaries in the cortex. 28 Consistent with previous reports, the parenchymal capillary density was observed to increase according to the duration of the chronic hypoxia (Figure 3(b)). However, our PET results with 64Cu-RAFT-RGD, a recently established tracer for αVβ3 integrin in tumors, 14 failed to show clear uptake in the hypoxic periods up to 14 days (D14) (Figures 1 and 2). The PET results were consistent with the ex vivo ARG results (Supplementary Figure 1). Furthermore, the PET and ARG results were supported by the IF study with a marker of integrin β3, i.e. CD61 staining (Supplementary Figure 2), which showed weak co-staining with endothelial marker, CD31. These results strongly indicate that the αVβ3 integrin expression induced by cerebral hypoxia was too low to be detected as PET uptake.
The findings partly agreed with our direct in vivo observations using repeated long term two-photon microscopy for capillary sprouts induced by chronic hypoxia.27,28 In those studies, the formation of new capillary sprouts in the mouse cerebral cortex was found to be as low as 15 vessels per mm3 during 7–14 days of hypoxia. In contrast, the 64Cu-RAFT-RGD uptake and CD61 staining were clearly demonstrated in the tumor model in which the present angiogenesis probe was established. 14 A possible interpretation of the differences in the detection of angiogenesis between the current cerebral hypoxia models and the previous tumor models using PET might be due to a different occurrence of angiogenesis itself or caused by different tracer permeability to the angiogenic endothelial cells in those models. This should be clarified in future works.
Another possibility could be due to a different degree or role of the integrin subunits stimulated during the vascular remodeling depending on experimental models used. The literature has shown the increased expression of the integrins, e.g. α5β1, αVβ3, and α6β4 in chronic hypoxia,23,24,26,29 α5β1 and αVβ3 in ischemia,1,25 and αVβ3, αVβ5 and αVβ6 in tumors. 4 Those changes could affect the detectability of the angiogenesis PET imaging in different experimental models (i.e. hypoxia vs. tumors). Comparison with other types of the ligand, e.g. DOTA-VEGF121, which targets VEGF expression for angiogenesis and shows an increased level of expression in brain stroke mouse models, 6 will be future topics.
On the other hand, the CD31 staining area increased with the hypoxic periods (Figure 3), indicating an increase in the endothelial density. According to the CD61 staining, the increased CD31 staining results from morphological changes in the endothelium rather than from proliferation. Therefore, when imaging cerebral angiogenesis, it is important to use a proper biomarker that allows for the separation of proliferative angiogenesis from other types of vascular remodeling. This caution of the need to specifically detect the angiogenesis is also applicable to other experimental models, such as those for cerebral ischemia and/or brain tumors.
Alternatively, we searched for any early signs of the vascular remodeling allowed for PET imaging and found that the SUV of 11C-PK11195 transiently increased on D4 and shortly returned to control levels on D7 and D14 (Figure 5). This result suggests that TSPO expression increased in the early phase of chronic hypoxia that preceded vascular remodeling. Although the biological mechanism for triggering the increase in TSPO expression during hypoxia remains unclear, there are several possibilities for the upregulation of TSPO expression. 3 It was originally shown that the 11C-PK11195 PET signal represents microglial activation. 30 An increased level of the activated microglia is well documented in a brain ischemia model, 39 while an increase in the TSPO signal in the ischemic brain has been consistently demonstrated using 3H-PK11195 for ARG 30 and 11C-PK11195 for PET. 35 In contrast to these reports, other studies have suggested a potential contribution of astrocytes, 22 but it was recently shown that astrocytes contribute very little to the in vivo TSPO-PET signal compared to microglial activation in an acute ischemic model. 12 It should be noted that TSPO expression is not always associated with the progression of lesions, but with tissue remodeling and repairing instead, 7 which could include non-negligible constitutive components of the vascular TSPO as well. 33
In the present study, IF studies showed undetectable changes in the Iba1 and GFAP staining over the early phase of hypoxic exposures, and the quantitative evaluation confirmed that there were no significant differences in the areas of the cells positively stained for either Iba1 or GFAP (Supplementary Figures 4 and 5, respectively). These results indicate that the transient increases in TSPO expression on D4 may not originate from the activation of microglia or astrocytes. As shown in Supplementary Figure 6, our preliminary experiments confirmed that the distribution of TSPO was confined in the vessels and that the vascular TSPO signal was significantly stronger in D4 than D0 (Supplementary Figure 6). The finding is in good agreement with the relationship observed in the TSPO-PET for PK11195 uptake on D4 and D0. Those studies suggest that the early increase in TSPO expression observed at D4 during chronic hypoxia originates from the increased expression level of vascular TSPO.
Conclusion
We evaluated whether PET can be used to directly image cerebral angiogenesis using a newly established radiotracer for αVβ3 integrin. Unexpectedly, the PET imaging of chronic hypoxia in a mouse model demonstrated too little probe uptake despite the marked increase in endothelial density. Instead, PET imaging demonstrated a transient increase in the TSPO probe uptake in the early phase of hypoxia, which could be an early sign of subsequent vascular remodeling.
Footnotes
Funding
The study was partly supported by MEXT Kakenhi 24659578 and JSPS Kakenhi JP16K01944.
Acknowledgements
We thank Drs. Haruki Toriumi and Taeko Ebine, Department of Neurology at Keio University School of Medicine, and Drs. Maiko Ono and Bin Ji, Molecular Neuroimaging Program at National Institute of Radiological Sciences, for valuable support with the interpretation of the IF staining. We also thank Drs. Katsushi Kumata and Ming-Rong Zhang for supplying the PET radioligands.
Declaration of conflicting interests
The author(s) declared no potential conflicts of interest with respect to the research, authorship, and/or publication of this article.
Authors’ contributions
IK, CS, HT, and KM designed and performed the experiments. IK, CS, and ZHJ analyzed and interpreted the data. IK, CS, ZHJ, and KM wrote, reviewed and edited the manuscript. CS, ZHJ, DB, and PD interpreted the data. TF, TS, and HI supervised the study.
References
Supplementary Material
Please find the following supplemental material available below.
For Open Access articles published under a Creative Commons License, all supplemental material carries the same license as the article it is associated with.
For non-Open Access articles published, all supplemental material carries a non-exclusive license, and permission requests for re-use of supplemental material or any part of supplemental material shall be sent directly to the copyright owner as specified in the copyright notice associated with the article.