
Abstract
Although near-infrared spectroscopy is increasingly being used to monitor cerebral oxygenation in neonates, it has a limited penetration depth. The T2-prepared Blood Imaging of Oxygen Saturation (T2-BIOS) magnetic resonance sequence provides an oxygen saturation estimate on a voxel-by-voxel basis, without needing a respiratory calibration experiment. In 15 neonates, oxygen saturation measured by T2-prepared blood imaging of oxygen saturation and near-infrared spectroscopy were compared. In addition, these measures were compared to cerebral blood flow and venous oxygen saturation in the sagittal sinus. A strong linear relation was found between the oxygen saturation measured by magnetic resonance imaging and the oxygen saturation measured by near-infrared spectroscopy (R2 = 0.64, p < 0.001). Strong linear correlations were found between near-infrared spectroscopy oxygen saturation, and magnetic resonance imaging measures of frontal cerebral blood flow, whole brain cerebral blood flow and venous oxygen saturation in the sagittal sinus (R2 = 0.71, 0.50, 0.65; p < 0.01). The oxygen saturation obtained by T2-prepared blood imaging of oxygen saturation correlated with venous oxygen saturation in the sagittal sinus (R2 = 0.49, p = 0.023), but no significant correlations could be demonstrated with frontal and whole brain cerebral blood flow. These results suggest that measuring oxygen saturation by T2-prepared blood imaging of oxygen saturation is feasible, even in neonates. Strong correlations between the various methods work as a cross validation for near-infrared spectroscopy and T2-prepared blood imaging of oxygen saturation, confirming the validity of using of these techniques for determining cerebral oxygenation.
Keywords
Introduction
In neonates, brain injury is often related to disturbances in cerebral blood flow (CBF) and/or cerebral oxygenation. Examples are hypoxic–ischemic encephalopathy following perinatal asphyxia, perinatal arterial ischemic stroke (PAIS), peri-intraventricular hemorrhages, and periventricular leukomalacia.1–6 Near-infrared spectroscopy (NIRS) is increasingly being used on the neonatal intensive care unit (NICU) to monitor the balance between the oxygen supply and oxygen consumption of the brain. In addition, it can be used as a surrogate for CBF. 7 NIRS exploits the relative permeability of biological tissue to NIR light. The combination of multiple wavelengths and multiple emitter–receiver distances enables the estimation of relative concentrations of oxygenated (O2Hb) and deoxygenated hemoglobin (HHb), which can subsequently be converted into a regional cerebral oxygen saturation (rScO2-NIRS). 8 The rScO2-NIRS is an absolute value that represents the weighted average of O2Hb as a ratio of total Hb (O2Hb + HHb) concentration in a mixed vascular bed (i.e. arterial–capillary–venous). For the brain, the distribution between the arterial and a combined capillary–venous compartment is generally assumed to be approximately 25/75%.9,10 The obtained information depends on sensor location, in infants this usually means uni- or bilateral frontoparietal regions. 7 Although regional information is sufficient for monitoring the trend of oxygenation and CBF in the clinical setting, knowledge of oxygen saturation (SO2) in different regions of the brain, including deep brain matter, can be invaluable in monitoring disease progress and can possibly provide new insights into the pathophysiology of diseases.
In the neonatal population, magnetic resonance imaging (MRI) seems to be the designated tool to provide a whole brain SO2 estimate, as MRI is noninvasive and does not require the use of ionizing radiation. Recent advances in MRI have brought forward multiple techniques to measure SO2 in the brain. These techniques can roughly be divided into two approaches: the first is respiratory-calibration of the blood oxygen level dependent (BOLD) signal, the second approach is modeling the decay of transverse magnetization following spin-spin relaxation only (T2) or in combination with magnetic field inhomogeneity (T2*).11–14 The former is far less feasible in neonates as a respiratory challenge has both ethical and practical limitations in this population. In the latter, SO2 quantification is based on modeling T2 and T2* in a two-compartment model, in which extravascular and intravascular compartments correspond to brain tissue and blood vessels, respectively. A method that could measure blood T2 (T2b) more directly would reduce sensitivity to field inhomogeneity, and model assumptions needed for the estimation of Y could be limited. With appropriate knowledge of T2b, SO2 can be derived by using previously determined relationships between T2 and SO2.13,15–17
In this work, we present a method which combines “intravoxel incoherent motion imaging” (IVIM) to yield blood volume-weighted images with a standard Malcolm Levitt (MLEV) T2 preparation.18–20 These two techniques are combined in the “T2-prepared blood imaging of oxygen saturation” (T2-BIOS) sequence, which enables the estimation of T2b on a voxel-by-voxel basis in a single slice of brain tissue.21,22 The SO2-T2-BIOS derived from T2b should in theory correspond to SO2 in a mixed (arterial–capillary–venous) vascular bed, comparable to the rScO2-NIRS obtained by NIRS. For example, the quantitative imaging of extraction of oxygen and tissue consumption (QUIXOTIC) technique would be less suitable for the comparison with NIRS, as it is mostly targeted at postcapillary venular blood and thus provides a pure venous estimate. 23 In addition, it suffers from low SNR, which is particularly a concern in neonates. Inclusion of the entire vasculature as proposed here could significantly improve SNR.
The primary aim of this study was to assess feasibility of measuring SO2 in neonates by means of T2-BIOS and subsequently investigate its association with rScO2-NIRS obtained by using a commercially available NIRS device.
Methods
Basic clinical characteristics.
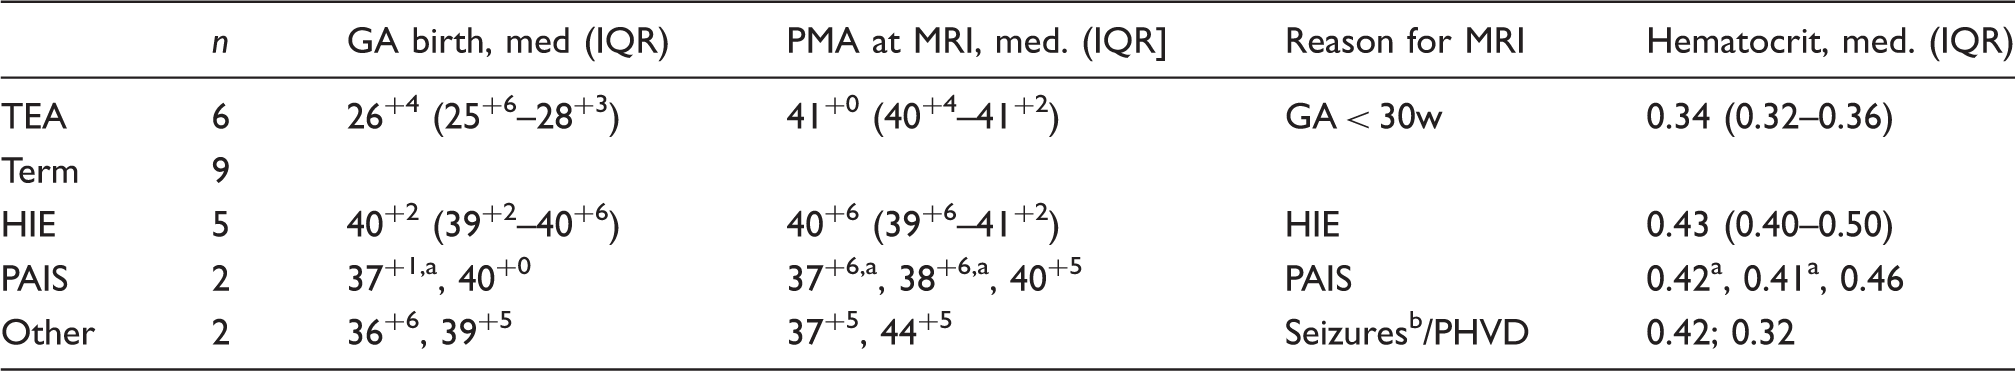
Infant was scanned twice.
Clinical seizures (not during MRI).
Abbreviations: GA: gestational age in weeks+days, HIE: hypoxic–ischemic encephalopathy, IQR: interquartile range, PAIS: perinatal arterial ischemic stroke; PHVD: posthemorrhagic ventricular dilatation, PMA: postmenstrual age at scan in weeks+days, TEA: preterms scanned at term-equivalent age.
NIRS measurements
Monitoring was performed by using a commercial NIRS device (INVOS 5100c; Covidien, Mansfield, MA, USA) that uses prefabricated sensors (SAFB-SM; Covidien) to calculate the rScO2-NIRS. These sensors combine a single light-emitting diode (LED) and two detectors (i.e. at 30 and 40 mm from the LED) into a single sensor and use two wavelengths (i.e. 730 and 810 nm). The placement of this sensor has been indicated schematically in Figure 1(a). Two sensors, one placed on the left and one placed on the right frontoparietal region of the head, were fixated by using an elastic bandage. The sensors were removed before the MR examination, and the position was marked with a vitamin D capsule to visualize the sensor position on structural MR images and to assure a comparable sensor placement after return on the NICU. The exact algorithm by which this device calculates the rScO2 from the light attenuation measured by the two detectors in each sensor has not been published and remains corporate knowledge. The rScO2-NIRS was recorded continuously, and at least 30 min of rScO2-NIRS data, obtained directly before and directly after the MR examination, was used for analysis.
Neonate with an infarction of the left medial cerebral artery: (a) Conventional T2 weighted image with schematic of the two NIRS sensors. The blue arrows indicate the light emitter (Tx1) and two detectors (Rx1 + Rx2). The orange arches indicated the presumed path that light travels through the brain; (b) SO2-T2-BIOS (indicated by Y in %) map with ROIs and blue arrows indicating the center of the NIRS sensors; (c) a CBF map with blue arrows indicating the center of the NIRS sensors.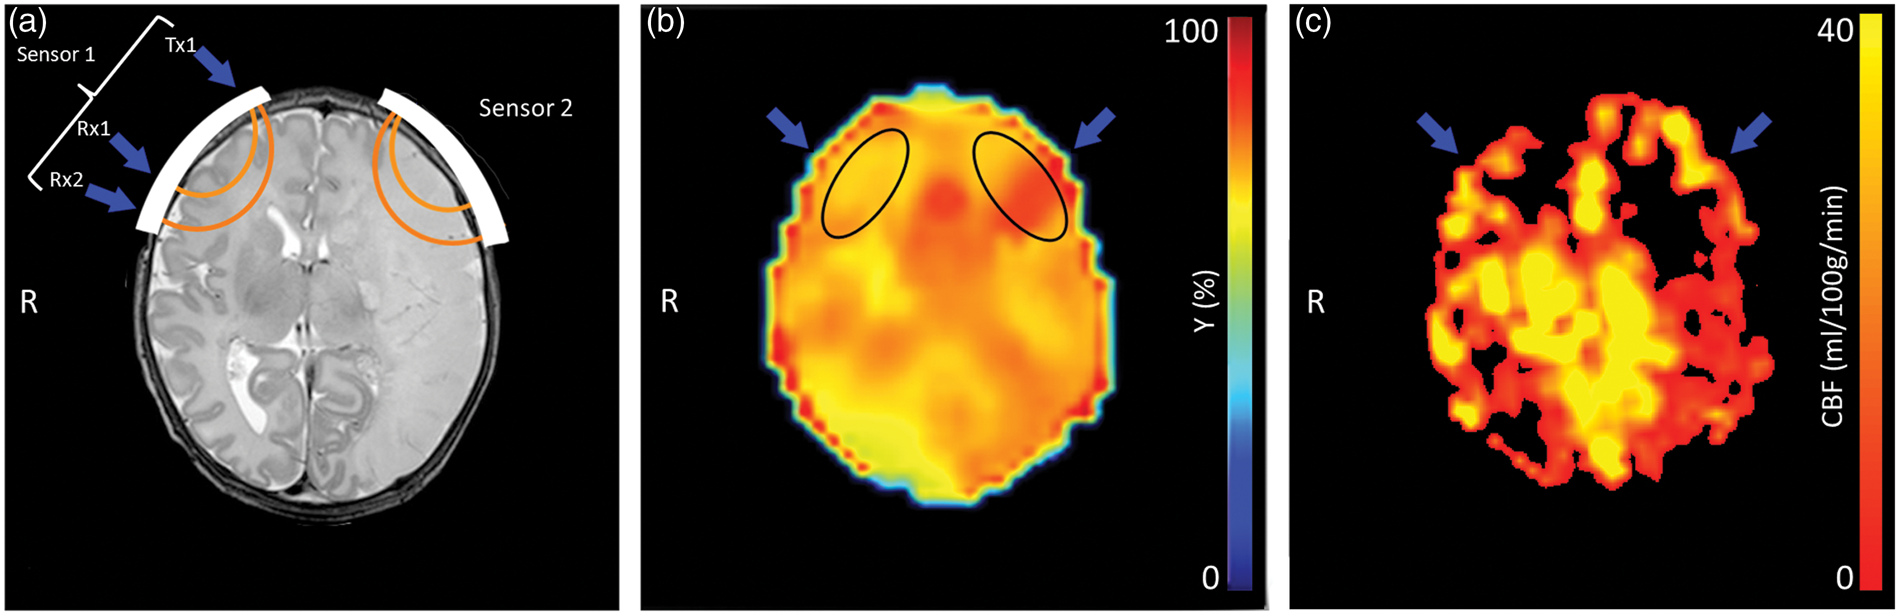
MR imaging
All MRI was performed on a 3.0-T system (Philips Healthcare, Best, The Netherlands) with a quadrature body coil for transmission and an eight-element phased-array SENSE head coil as a signal receiver. Preterm born infants scanned at term-equivalent age (TEA) were sedated by chloralhydrate (50–60 mg/kg, oral). Term infants were sedated by an intramuscular injection which combines pethidine (2 mg/kg), chlorpromazine (0.5 mg/kg), and promethazine (0.5 mg/kg). This injection was given after local application of lidocaine/prilocaine cream for 45 min to anesthetize the skin and while giving some oral sucrose for comfort. A vacuum cushion was used to provide comfort and to minimize motion during imaging. MiniMuffs (Natus Europe, Münich, Germany), and closed headphones (Philips Healthcare) were used for noise insulation. Heart rate and arterial SO2 were monitored by pulse oximetry (Nonin Medical, Plymouth, MN, USA) and respiratory rate by an abdominal transducer (Philips Healthcare). A neonatologist was always present throughout the examination.
Conventional MR imaging included a sagittal T1-weighted, and either coronal (i.e. preterm infants at TEA) or axial (term infants) T1- and T2-weighted sequences. Thereafter, T2-BIOS, pulsed arterial spin labeling (PASL), and “T2-prepared tissue relaxation inversion recovery” (T2-TRIR) sequences were performed.16,21,22
In the T2-BIOS sequence, blood volume-weighted images are obtained by exploiting IVIM effects. Perfusion-related parameters obtained by IVIM imaging have previously been compared with cerebral blood volume (CBV) and CBF, and showed reasonable agreement with each other.18,19 The key element for reliable fitting of T2b on the blood volume weighted images is T2 preparation of the longitudinal magnetization by using a MLEV preparation.15,20 Two schemes were applied to minimize imperfections in the T2-preparation pulses: composite pulses were used for both the 180° (i.e. 90°
x
180°
y
90°
x
) and −90° (i.e. 270°
x
–360°
x
) pulses, and the signs of the pulses were then arranged in a MLEV pattern (i.e. 1 1 −1 −1). This preparation is repeated in groups of four (Figure 2), corresponding to 0, 4, 8, or 16 refocusing pulses with an interpulse time (τCPMG) of 10 ms. These groups of refocusing pulses translate into effective MLEV TE (eTE) preparations of 0, 40, 80, or 160 ms. After T2-preparation, a standard Stejskal–Tanner diffusion sequence is played out in one of x, y, or z directions, and low and higher b-value (i.e. 0 and 50 s/mm2) images are acquired in all desired directions for each eTE. Magnetization is allowed to fully recover between repetitions. Scan parameters were TR 8000 ms, TE 41 ms, 64 × 64 matrix, FOV = 240 × 240 mm2, flip-angle = 90°, 6 mm slice thickness, SENSE = 2.5, eTE = 0, 40, 80, and 160 ms, b = 0 and b = 50 s/mm2 in x, y, and z directions. A single slice was prescribed and positioned based on the vitamin D capsules placed on the forehead. Total scan time was 4:32 min.
MR sequence chart of the T2-BIOS sequence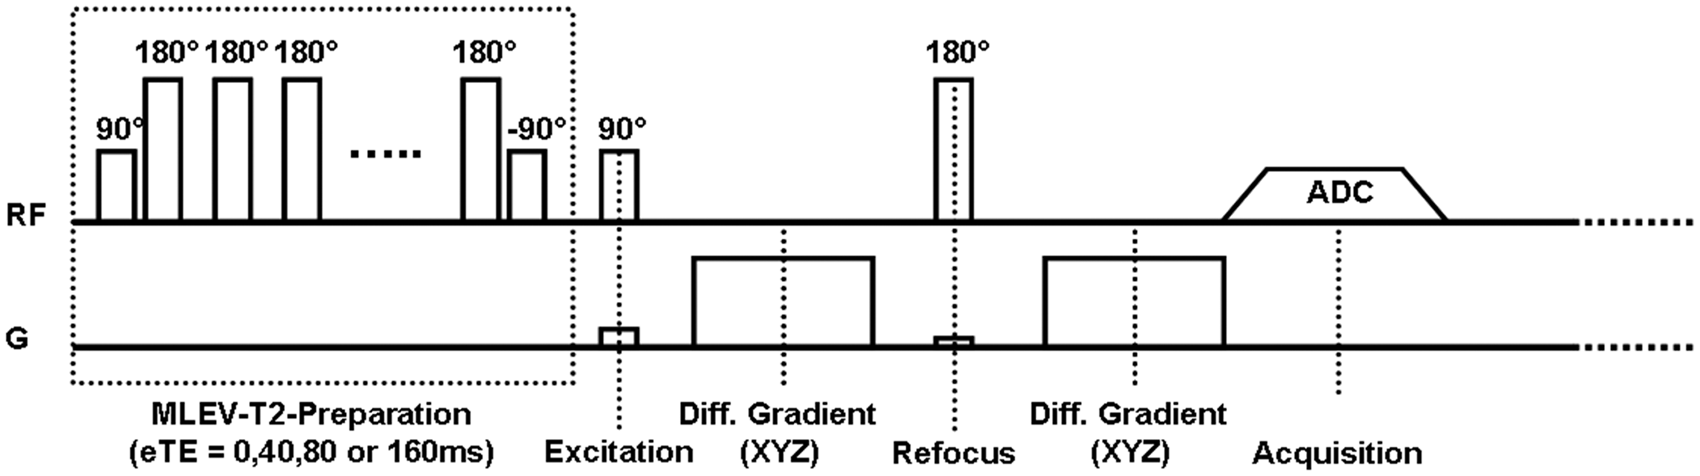
The T2-TRIR sequence enables simultaneous measurement of T1b and T2b of venous blood in the sagittal sinus. 16 It uses a presaturation pulse with subsequently a MLEV T2-preparation scheme and a nonselective inversion pulse thereafter. Scan parameters were TR 15 s, TE 20 ms, ΔTI 140 ms, TI1 20 ms, scan matrix 128 × 128, FOV 160 × 160 mm2, flip angle 95°, slice thickness 3 mm, SENSE = 2.5, eTE = 0, 40, 80, and 160 ms, and total scan time was 1:30 min. A sagittal 2D phase contrast MR angiography was used to make sure that the imaging plane was planned perpendicular to the sagittal sinus.
For PASL, a PULSAR pulse sequence was used. 24 Scan parameters were TR 2500, TE 20 ms, matrix 64 × 64, FOV 240 × 240 mm2, SENSE 2.5, slice thickness 6 mm, 1 mm slice gap, inversion delay (TI) 1500 ms, 70 averages, EPI factor 35, Q2TIPS 600 ms, labeling slab of 150 mm, and the total scan time was 3:05 min. 25 The number of slices varied from 8 to 11 according to the head size of the infant, and the labeling slab was aligned parallel to the imaging plane with a gap of 10 mm.
Data analysis
Data analysis was performed by using IDL 6.1 for Windows (ITT Visual Information Solutions, Boulder, CO, USA). For the rScO2-NIRS, all tracings were inspected and segments suspected for having artifacts (e.g. absolute values <40% and segments with fluctuations >30% between subsequent data points) were excluded from analysis. Thereafter, the average rScO2 was calculated separately for the tracings obtained from sensors placed on the left and right frontal parietal scalp. In all cases, averages were calculated using a window length of 30 min.
For T2-BIOS, the signal from the high b-value scans was first subtracted from the low b-value scans (i.e. b = 0 and b = 50 s/mm2), then the individual diffusion directions were averaged, essentially forming a Δb image per eTE. These images are strongly vascular weighted as long as the higher b-value is chosen within the IVIM regime (i.e. < b ≈ 150 s/mm2). The higher b-value of 50 s/mm2 was chosen as a compromise between SNR and inclusion of static tissue in the Δb images. As the blood flow velocity is in general lower in neonates than in adults, a higher b-value ensures inclusion of the entire blood pool (including the smallest capillaries) in neonates and thereby yields a higher SNR. A b-value higher than 50 s/mm2 was considered undesirable because of increasing signal contributions coming from static tissue.
The relationship between T2b and the eTE of every Δb image can be described as follows:

Here, eTE is the effective MLEV echo time, T2b the T2 of blood, and Vb × M0b is a pseudo blood volume times bloods equilibrium magnetization, which can be considered as a single constant for this purpose. Alternatively, with appropriate knowledge of M0b, a pseudo blood volume can be obtained.
19
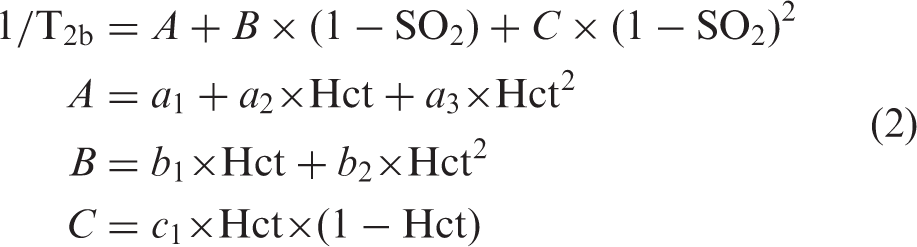
The four eTE’s allow robust fitting of T2b on a voxel-by-voxel basis. Earlier work determined the relationship between T2b, Hct, and SO2 by fitting data to a two-compartment exchange model proposed by Wright et al. and Golay et al.13,26,27:
When using the characterized relationship between T2b, Hct, and SO2, the SO2 can be estimated by combining T2b from T2-BIOS with Hct obtained either by T2-TRIR or from a recent blood sample in case T2-TRIR data was unavailable.13,16,17,28 Two regions-of-interest (ROI), one in the left and one in the right frontal lobe, were drawn manually (MRIcro version 1.4, www.mricro.com) for the comparison with rScO2-NIRS (Figure 1(b)). A line drawn from the vitamin D capsule to the lateral edge of the anterior horn of the lateral ventricle served as the “midline” of the ROI, with 50% of selected voxels on either side of this line. The ROIs were restricted to cerebral tissue based on coregistered anatomical images, avoiding inclusion of central (i.e. anterior horn of the lateral ventricles) and peripheral CSF in the ROI as much as possible. The ROIs were medially restricted by the cingulate region and never crossed the midline. In the posterior direction, the ROIs never included more than the inferior frontal gyrus. Figure 3 shows the four Δb(eTE) images and corresponding curve fit for a single ROI in a representative subject.
Δb images for each eTE (i.e. 0, 40, 80, and 160 ms), with a single ROI and corresponding curve fit for an exemplary subject.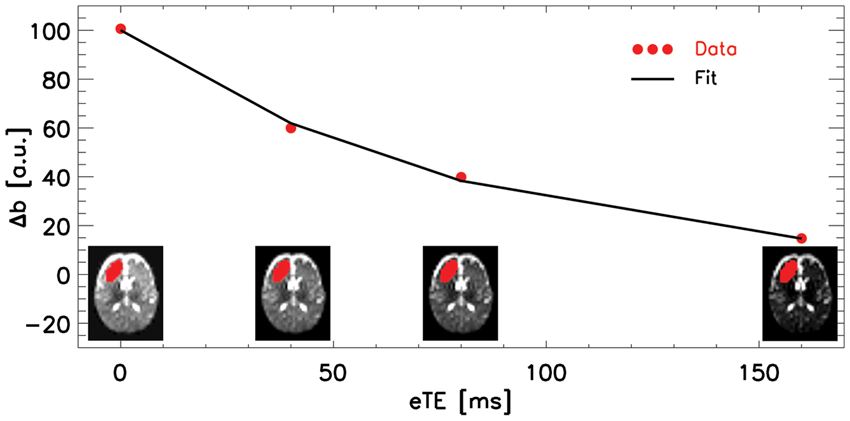
For the T2-TRIR an automated localizer tool was used to identify the blood signal in the sagittal sinus. From this signal four different inversion recovery curves were fitted, one for each eTE, from which T1b and T2b were fitted simultaneously. 16 The T1b can be used to obtain hematocrit (Hct), and in a way similar to the T2-BIOS, the T2b can then be converted into venous oxygen saturation (SvO2-T2-TRIR), see equation (2). 28
To calculate CBF, ASL images were motion corrected by using a 6-parameter affine transformation between (control label) image pairs followed by a 12-parameter affine transformation to align all control-label volumes. The ASL imaging pairs were subtracted to generate ΔM images. The mean and standard deviation of the difference signal over the subtracted images pairs were calculated, and image pairs with a difference signal larger than 2 standard deviations were automatically discarded. 29 Finally, CBF was quantified on the average ΔM images.25,30 The inversion efficiency (α) was assumed to be 0.95, and the brain–blood partition coefficient (λ) 1.1 ml/g. 31 The T1b was obtained by T2-TRIR or derived from a recent blood sample when T2-TRIR data were unavailable.16,28 Subsequently, CBF was calculated using both a whole brain mask (wbCBF) and averaged over several ROIs drawn in the frontal lobes (fCBF). 32
For statistical analysis, IBM SPSS Statistics (version 22; SPSS Inc., Chicago, IL, USA) was used. Linear regression and Bland–Altman plots were used for comparison of left and right rScO2-NIRS values with left and right SO2-T2-BIOS.33,34 For the comparison with SvO2-T2-TRIR in the sagittal sinus, wbCBF, and fCBF, the left and right rScO2-NIRS values were averaged. For comparison of SO2-T2-BIOS with SvO2-T2-TRIR, values obtained from left and right ROI’s on T2-BIOS images were averaged. A p-value < 0.05 was considered statistically significant.
As both SO2 estimates are influenced by Hct to a different degree, the influence of Hct on the bias between the two methods was investigated.13,17,35 The actual bias between the two methods was corrected for variations in Hct, thereby it was avoided to confer that status of a gold standard on either one of the two methods. The slope derived from linear regression analysis between Hct and the bias (Figure 4(d)) was used to calculate a correction factor per subject. This was accomplished by subtracting the reference Hct (set at a common value of 0.4) from the patient’s actual Hct, the difference was then multiplied by the earlier derived slope, and the product was subsequently deducted from the actual bias between the two methods in that patient. Thereafter, a conventional Bland–Altman plot was created.
(a) Linear regression plot between SO2-T2-BIOS and rScO2-NIRS, (b) Bland–Altman plot with regression line between the average and difference between the two methods, (c) Bland–Altman plot of log-transformed data as mean vs. ratio, (d) Linear regression plot between hematocrit (Hct) and the observed difference bias between SO2-T2-BIOS and rScO2-NIRS, (e) Bland–Altman plot where bias data was corrected for Hct variation, and (f) Bland–Altman plot of log-transformed data where the bias was corrected for Hct variation.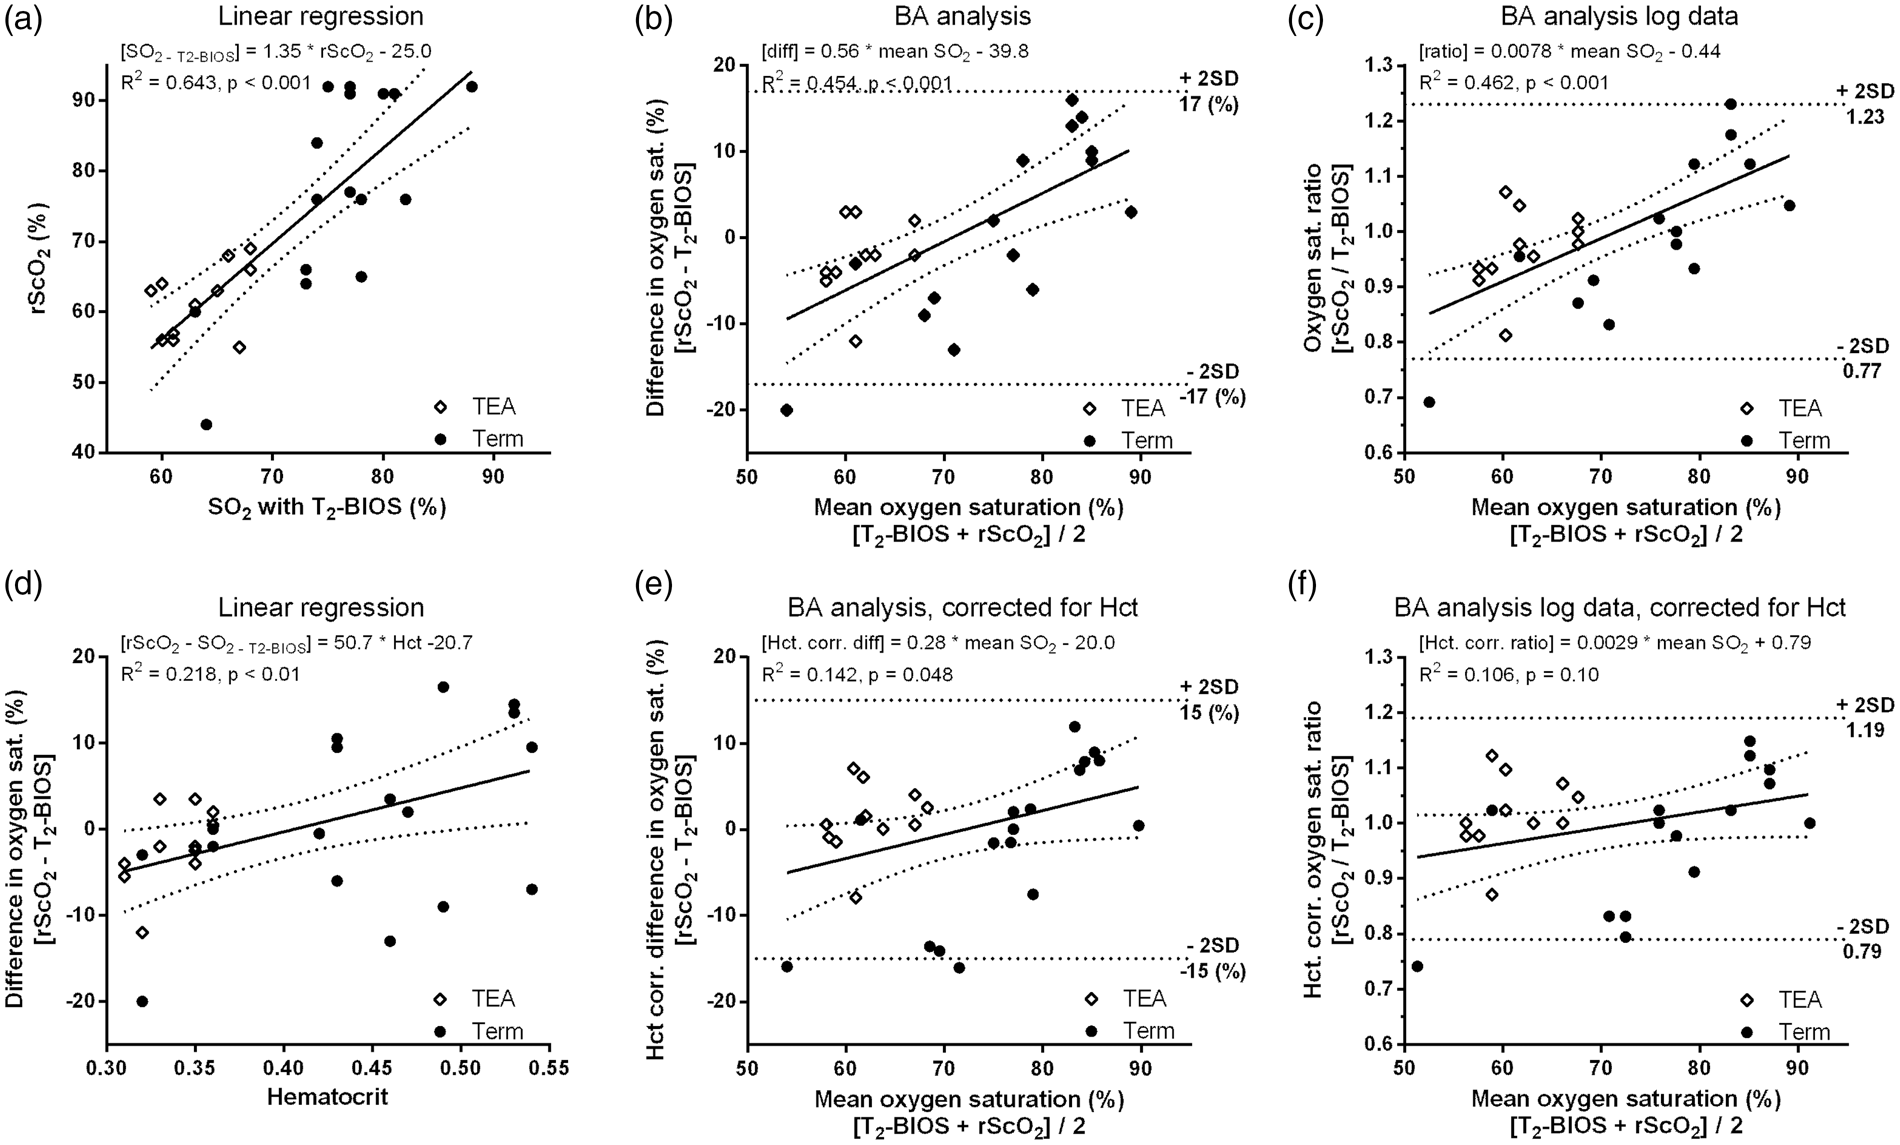
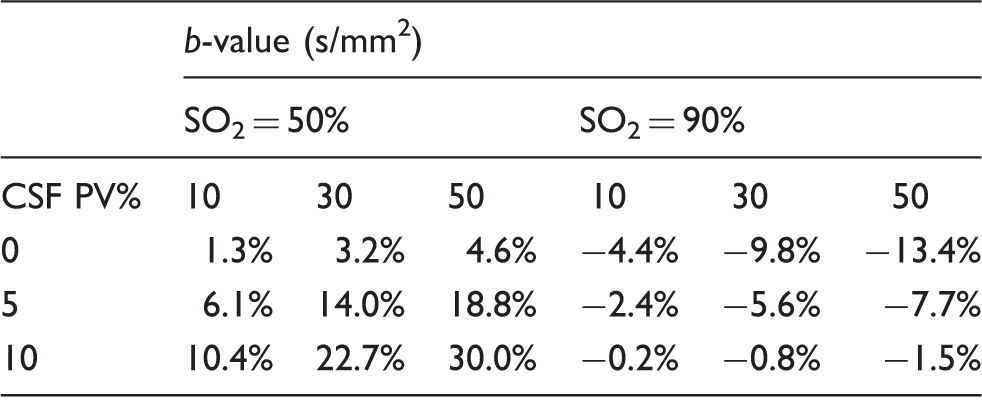
On top of the influence of Hct, simulations were run to investigate the possible error in SO2-T2-BIOS arising from the height of the upper b-value, and possible partial volume inclusion of CSF in the ROI.
Results
Hct was significantly different between preterm infants scanned at TEA and term infants (med 0.34, IQR (0.32–0.36) vs. 0.47 (0.43–0.52), p < 0.0001). Left and right SO2-T2-BIOS were obtained in 15 infants during 16 examinations (1 infant was examined twice). In addition, SvO2-T2-TRIR data were successfully obtained in 10, and CBF data also in 10 examinations. The rScO2-NIRS values obtained before and after the MRI were comparable (mean pre-MRI 68.4%, SD ± 12.9% vs. post-MRI 70.3% ± 15.8%, p = 0.167) and there was an excellent correlation between values obtained before and after the MRI (R2 = 0.857, p < 0.0001). Therefore, values obtained before and after the MRI were averaged. Figure 1 shows a schematic of the sensor placement, a representative SO2-T2-BIOS map, and a CBF map in an infant with PAIS. In this infant, NIRS revealed asymmetric SO2 with a rScO2-NIRS of 91% on the left and 67% on the right, and SO2-T2-BIOS of 86% and 71%, respectively
Figure 4(a) displays the correlation between rScO2-NIRS and SO2-T2-BIOS (R2 = 0.643, p < 0.001). Bland–Altman analysis between rScO2-NIRS and SO2-T2-BIOS revealed a bias of 0.3 % (Figure 4(b), 95% limits of agreement−17 to 17%), which was found to be significantly different between preterm infants scanned at TEA and term infants (median bias TEA −4% (−7; 1) vs. term 2% (−4; 7), p = 0.03). There was a linear association (Figure 4(b), R2 = 0.454, p < 0.001) between the difference and the average of the two methods. Log-transformation of the data did not remove this association (Figure 4(c); R2 = 0.462, p < 0.001).33,34 The average ratio between rScO2-NIRS and SO2-T2-BIOS was 1.0 (95% limits of agreement 0.77 to 1.23), indicating that bias varies between 23% under and 23% overestimation (Figure 4(c)). The highest discrepancy (i.e. absolute difference −20%) was observed in an infant who had a unilateral enlarged ventricle on that side, this infant also had a low Hct of 0.32.
Both rScO2-NIRS (R2 = 0.492, p < 0.001) and SO2-T2-BIOS (R2 = 0.470, p < 0.001) were significantly related to Hct. The difference between the two methods correlated positively with Hct (Figure 4(d), R2 = 0.218, p < 0.01). The correlation between this difference and Hct showed a positive trend when evaluating preterm infants scanned at TEA (R2 = 0.304, p = 0.08) and term infants (R2 = 0.226, p = 0.05) separately. The bias after correcting for Hct was 0.2% (Figure 4(e), 95% limits of agreement −15 to + 15%). Although less, there was still a significant linear association between the difference and the average of the two methods (Figure 4(e), R2 = 0.142, p = 0.048). After log-transformation the mean ratio between the two was 1.0 (Figure 4(f), 95% limits 0.79–1.19) and there was no significant relation anymore between the mean and the ratio of the two methods (Figure 4(f), R2 = 0.106, p = 0.10). The results of the error analysis on the effect of potential CSF inclusion in the ROI and the effect of the chosen higher b-value are presented in Table 2. This is done for two different SO2 levels while fixing Hct at 0.4. Figure 5 displays the results of linear regression analysis between SO2-T2-BIOS (a–c) or rScO2-NIRS (d–f) on one end and SvO2-T2-TRIR, wbCBF, and fCBF on the other end.
Scatter plots with regression lines between SO2-T2-BIOS and (a) SvO2-T2-TRIR, (b) whole brain CBF and (c) frontal brain CBF, and scatter plots between rScO2 and (d) SvO2-T2-TRIR, (e) whole brain CBF, and (f) frontal brain CBF. Results of the error analysis on % partial volume inclusion of CSF and chosen b-value at two levels of oxygenation. Abbreviations: PV%: percentage of CSF included in the region-of-interest, SO2: oxygen saturation.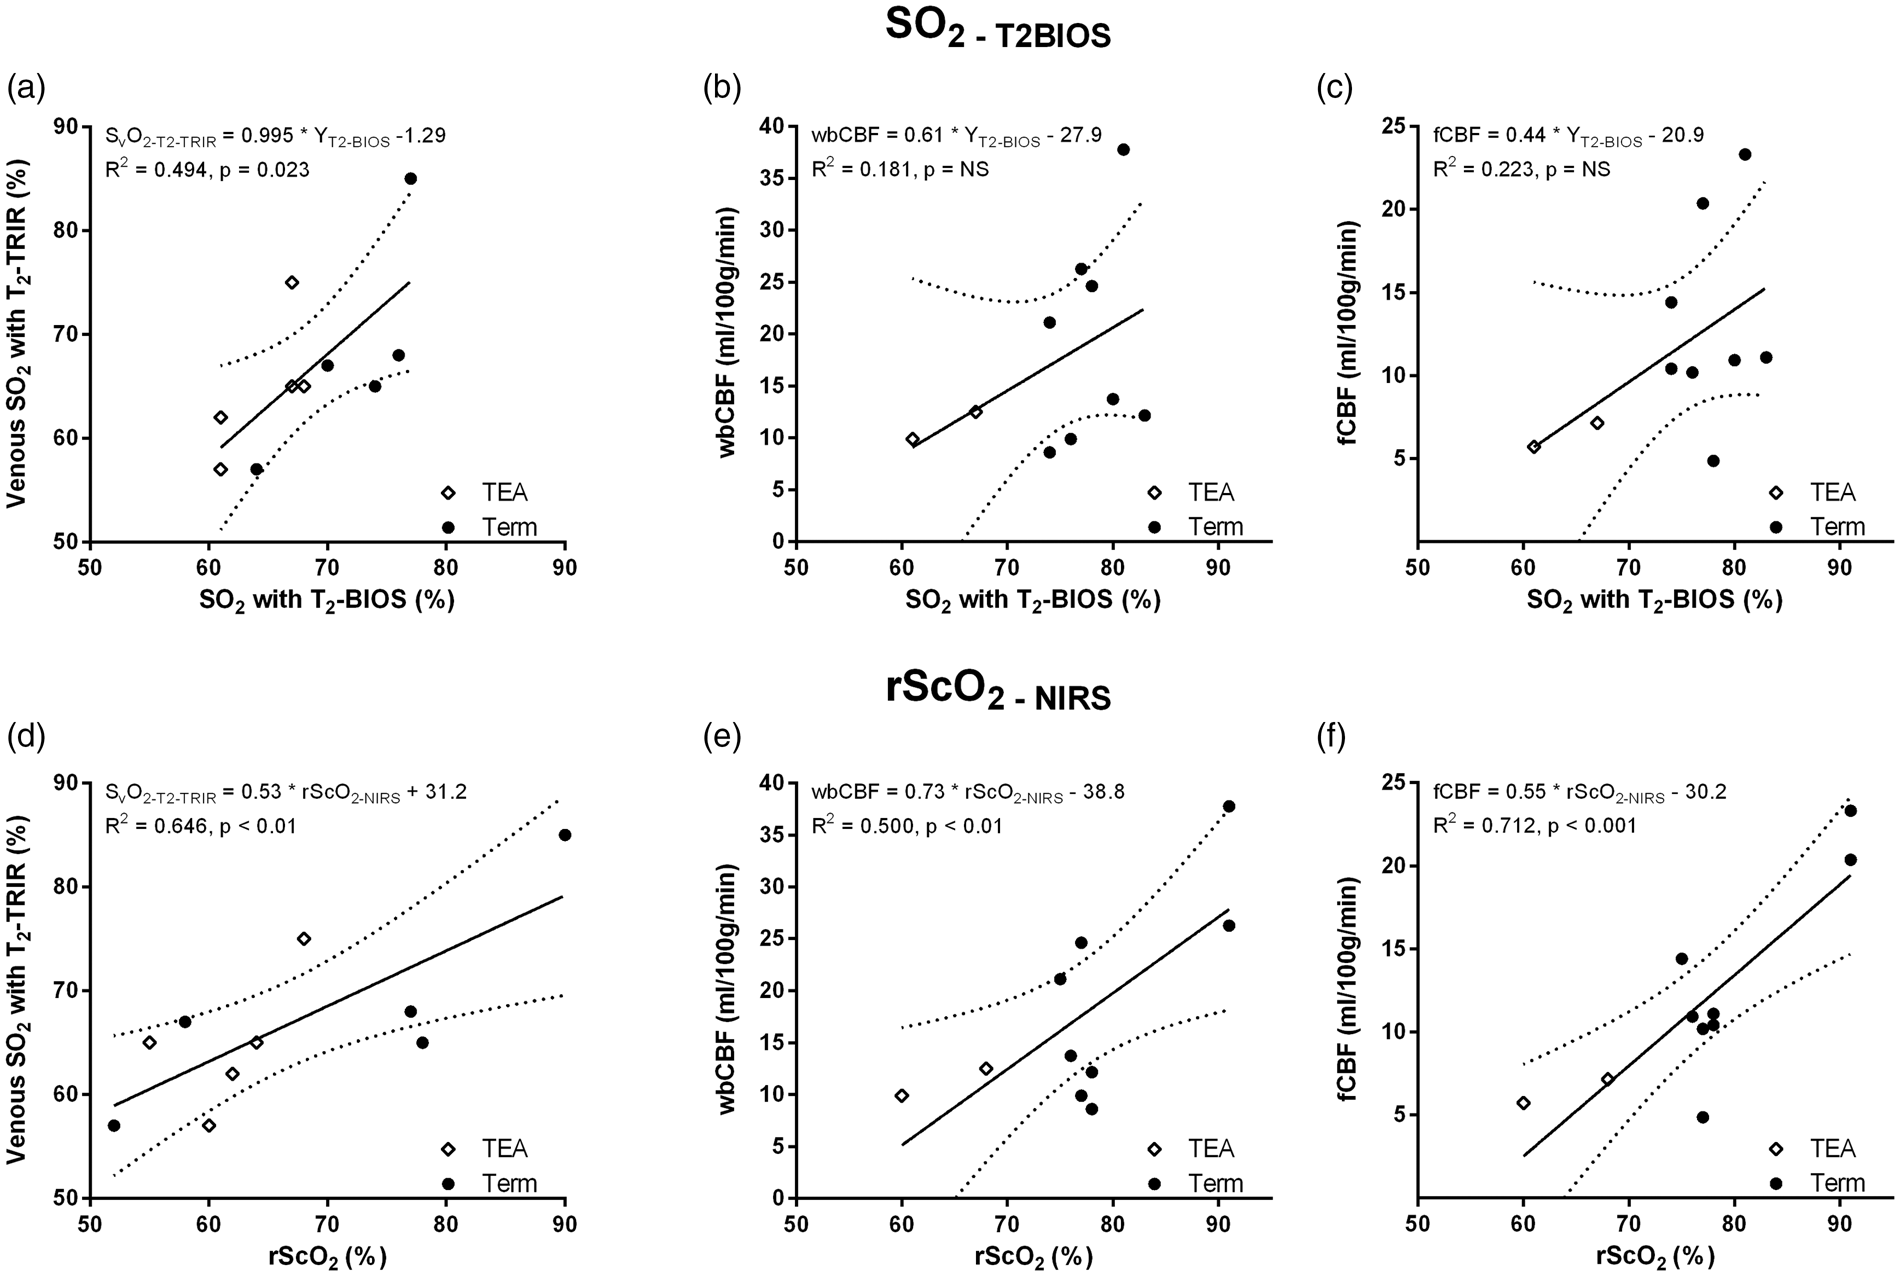
Discussion
We present results obtained with a MR sequence that enables estimation of cerebral SO2 on a voxel-by-voxel basis in a full slice of brain tissue. Although NIRS and T2-BIOS are clearly two completely different techniques, the results show that frontal cerebral SO2 measured by NIRS and T2-BIOS are strongly correlated. This shows that estimating SO2 by MRI is feasible in neonates and to a limited extent also works as a two-way validation that confirms that both NIRS and T2-BIOS can be used as a measure of cerebral oxygenation.
There is, however, bias between the methods for which there are several possible explanations. It is striking that there is a linear association between the bias (i.e. rScO2-NIRS − SO2 T2-BIOS) and the average SO2 (i.e. (rScO2-NIRS + SO2-T2-BIOS)/2) of both methods (Figure 4(b)). This persisted after log-transformation of the data.33,34 The three most likely explanations for this linear association seem to be related to: Hct/Hb, partial volume inclusion of CSF in the ROI, and the selected upper b-value. First of all, Hct is known to be quite variable in neonates. After birth neonates experience a physiological decrease in Hct, partly because the production of adult Hb cannot keep up with the degradation of fetal Hb. 36 This decline is even more pronounced in preterm neonates due to hemodilution following rapid body growth, smaller iron reserves, the liver being the main erythropoietin producing organ, and a shorter erythrocyte lifespan.37,38 The rScO2-NIRS is known to be associated with Hb and thereby Hct. 35 Likewise, the very framework that forms the foundation for estimating SO2-T2-BIOS also depends on Hct, for example overestimation of Hct would result in underestimation of T2b.13,17 Interestingly, correction for Hct of the data removed the statistical significance of the linear association after log-transformation (Figure 4(c) vs. (f)), but it only marginally decreased the limits of agreement (Figure 4(b) and (c) vs. (e) and (f). In this study, the adult calibration curve was used as opposed to the published curve for fetal blood.13,17 This was done because many infants were examined multiple weeks after birth and because all infants received multiple erythrocyte transfusions before the MR examination. Neonates have a circulating volume of approximately 80 ml/kg, and a single transfusion (i.e. 20 ml/kg) already introduces significant amounts of adult Hb on top of the physiological breakdown of fetal Hb. It is unlikely that the neonates still had a significant amount of fetal type hemoglobin present in their circulation during the MR examination and therefore the use of the curve based on the adult hemoglobin is warranted. Nevertheless, we do recommend the use of the fetal curve in relatively healthy neonates who are examined shortly after birth. Other explanations for the linear relation between the bias and the average SO2 could be CSF inclusion in the ROIs and the selection of the upper b-value.
The error analysis (Table 2) indeed demonstrates that these two factors could very well explain the bias and the linear trend association with SO2. The initial T2-BIOS implementation presented in this paper does not include CSF suppression pulses. Despite the chosen b-values (i.e. 0 and 50 s/mm2), CSF still shows up on the Δb images (Figure 3) as it has a high diffusion coefficient. Therefore, a partial volume effect of CSF cannot be excluded and would cause overestimation of SO2 at lower levels of oxygenation, while it compensates the negative bias at higher levels of oxygenation. However, it seems unlikely to be a major source of bias, as great care was taken to avoid CSF while drawing the ROIs. The ventricles were avoided at all times and when we purposely included as much peripheral CSF as possible in the ROI, the %CSF in the ROI was 7.8% at most. Please note that the deliberate inclusion of CSF was only done to estimate the absolute worst case scenario and these ROIs were not used in analysis. Finally, the chosen b-values (i.e. 0 and 50) should ensure vascular-weighting to be based on all but the capillaries with the lowest flow (mostly the smallest capillaries on the venous side). The upper b-value is a compromise between obtaining adequate SNR and avoiding static tissue contributions. A higher b-value will include more static tissue in the Δb images. As tissue T2 is relatively constant between individuals, a larger inclusion of tissue would result in decreased variation in T2, and thus SO2-T2-BIOS, arising from actual oxygenation differences. Reduction of the upper b-value (Table 2), combined with an improved readout to boost SNR, could reduce the bias that is theoretically present due to the currently implemented upper b-value of 50 s/mm2.
A less likely source of bias is the variation in CBF, which could potentially influence SO2-T2-BIOS estimates as vascular weighting is based on flow velocity. A low CBF, either global or regional, would result in lower SNR and could bias the SO2-T2-BIOS estimates. This is important when comparing data obtained in preterm infants to data obtained at term/TEA, as CBF is known to increase with age. 32 In the current study, all infants were either examined near term or at TEA, making bias arising from age-related variations in CBF unlikely. We did not find a clear relation between postmenstrual age at scan and CBF in the current population (data not shown). We can, however, not exclude pathological conditions associated with differences in CBF, such as hypoxic–ischemic encephalopathy and PAIS, from influencing the results.1,39,40
The largest bias (i.e. rScO2-NIRS − SO2-T2-BIOS = −20%) was shown on the affected side in the infant with unilateral ventricular dilatation. We can only speculate on the actual cause of this bias. Although the selected upper b-value should ensure adequate vascular weighting even in pathological conditions, one explanation could be that increased intraventricular pressure reduced the overall/regional blood pool and thereby SNR.41,42 Unfortunately, no CBF data are available due to severe motion during the PASL sequence. In terms of actual flow velocity, the venous flow will suffer the most in case of increased intraventricular pressure, as the venous system has a lower pressure and lower flow velocity to begin with. A change in blood volume should be picked up by NIRS and T2-BIOS in a similar way.43,44 However, an impact on actual flow velocity theoretically affects the contribution of venous blood to the T2-BIOS signal and therefore could yield a higher SO2-T2-BIOS estimate. NIRS on the other hand, is not influenced by the actual flow velocity of the blood. That being said, NIRS can by no means be seen as a gold standard and the large bias could just as well have arisen from there. It has been shown that the extent of ventricular dilatation affects the rScO2-NIRS estimate.45,46 Thus far it remains unresolved if this reflects real changes in oxygenation, or if this is a measurement error. An increased CSF fraction on the dilated side is another possible explanation. However, review of all available data (e.g. T1, DWI, potential partial volume inclusion of CSF in the ROIs) did not reveal any apparent differences between the left and right hemisphere, except for the dilated ventricle.
The approach for vascular weighting chosen here is the strength of the proposed method, as it reduces sensitivity to field inhomogeneity, requires relatively few assumptions, and increases SNR by using the entire blood pool. Moreover, the rScO2-NIRS and SO2-T2-BIOS should be very comparable in terms of vascular compartments as both methods will include arterial and venous compartments in their estimates. NIRS most likely includes more of the smallest capillaries, and a bit less of the larger vessels as light gets trapped in them. 47 NIRS is also slightly biased due to scalp contributions, which should have minimal effect in neonates as the scalp is still thin.48–50 The T2-BIOS does not suffer from scalp contributions at all, but on the other hand might lack some sensitivity to the smallest venous capillaries (i.e. lowest flow velocity), as discussed in the previous paragraphs. The ROIs that were selected during data processing do not necessarily represent the actual source of NIRS signal. The actual signal source can be pinpointed by using more complex arrays of emitting and detecting optodes of which the data can be used for source reconstruction. 48 This paper reports on a setup that is relatively straightforward in terms of geometry with just two NIRS sensors, each providing a single processed rScO2-NIRS value straight out of the box, which makes source reconstruction unfeasible. Along these lines it would have been interesting to investigate correlations with ROIs of varying depths. The current T2-BIOS implementation has some SNR constraints that prohibit investigation of varying ROI depths (i.e. smaller ROIs and thus lower SNR). Nevertheless, the neonatal population (i.e. low scalp contribution) and the fact that data were acquired during baseline (i.e. not task related) make bias arising from regional differences unlikely. Although we believe that differences in vascular compartments and the ROI selection are minimal sources of bias altogether, it would be interesting to acquire data with a more complex array of NIRS optodes.
Besides the correlation with rScO2-NIRS, SO2-T2-BIOS was also found to be strongly correlated with SvO2-T2-TRIR, which is based on the same principle of estimating SO2 from T2b.51,52 In a way, the T2-TRIR uses a less complicated approach as it relies on selection of a ROI in the sagittal sinus instead of vascular weighting to obtain T2b. The fact that SO2-T2-BIOS has a good relation with SvO2-T2-TRIR strengthens the confidence in the more complicated approach of the T2-BIOS even further. As expected, the SvO2-T2-TRIR values are slightly lower than SO2-T2-BIOS, as T2-TRIR is strictly venous because of the ROI selection in the sagittal sinus.
As far as NIRS is concerned, the strong correlations between rScO2-NIRS on one hand, and SO2-T2-BIOS, SvO2-T2-TRIR, fCBF and wbCBF obtained by MRI on the other hand, enforces the use of NIRS both as a measure of cerebral oxygenation and as a surrogate measure for CBF. The correlation between rScO2-NIRS and CBF has been demonstrated in neonates before. 40 The rScO2-NIRS has also been shown to correlate with SO2 obtained by means of a respiratory-calibrated MRI experiment. 11 However, a direct comparison with cerebral oxygenation obtained by MRI without requiring a respiratory calibration, as reported here, is novel.
Despite possible sources of bias, results of NIRS and SO2-T2-BIOS are strongly correlated, which strengthens confidence in both techniques. Knowing SO2 in the brain on a voxel-by-voxel basis can have both technical and clinical applications. From a technical point of view, T2-BIOS might be used to validate NIRS in neonates. Currently, a true gold standard for cerebral SO2 measurements in neonates is lacking. NIRS devices intended for neonatal use have mostly been validated against values obtained from extra-corporal membrane oxygenation machines, or against jugular bulb saturations during cardiac procedures.53,54 A different research area where the T2-BIOS sequence could be of use is fMRI, as fMRI results are modulated not only by CBF but also by SO2.55,56 From a clinical point of view, the T2-BIOS sequence provides an oxygenation parameter without the need for a respiratory-calibration experiment, which makes it feasible to use in neonates. This could yield additional insight into the pathophysiology of certain diseases/types of brain injury. In addition, the T2-BIOS might be used for prognostic purposes and help to decide whether or not to start additional treatment to try and save potentially viable tissue. In PAIS, for example, it is very relevant to know if there is tissue that has been injured but is still potentially viable (i.e. the penumbra). 1 For this purpose, the SO2-T2-BIOS could be overlaid on diffusion weighted images. Regions with restricted diffusion but low SO2-T2-BIOS (i.e. high oxygen extraction) would suggest potentially viable tissue, whereas regions with actual dead tissue would show restricted diffusion and high SO2-T2-BIOS as a consequence of decreased O2 utilization. 57 In the former, efforts to save the still viable tissue might be helpful, while it might not be worthwhile in the latter.
Conclusion
We demonstrate the feasibility of measuring cerebral SO2 on a voxel-by-voxel basis in a mixed vascular bed by using a new MRI sequence, the T2-BIOS. The great advantages are that it has relatively high SNR as takes the entire blood pool into account, and it does not require a respiratory-calibration experiment, which makes the technique also applicable in neonates. The good correlation between estimates obtained by NIRS and MRI confirms the use of both techniques for determining cerebral oxygenation, as the different underlying frameworks yield comparable results. Future research will focus on the exploration of clinical applications of the T2-BIOS, as well as on the implementation of CSF suppression pulses and full brain coverage into the sequence.
Footnotes
Funding
The author(s) disclosed receipt of the following financial support for the research, authorship, and/or publication of this article: This research is supported by the Dutch Technology Foundation STW, applied science division of NOW, the Technology Program of the Ministry of Economic Affairs and ZonMW Electromagnetic Fields and Health program.
Declaration of conflicting interests
The author(s) declared no potential conflicts of interest with respect to the research, authorship, and/or publication of this article.
Authors’ contributions
TA, JBV, and ETP conceptualized and designed this study, acquired, analyzed and interpreted the data, and drafted and revised the article. FG and MJB acquired and interpreted the data and revised the article. PML, JH and FB designed the study, interpreted the data, and revised the article. All authors (TA, JBV, PML, JH, FG, FB, MJB, and ETP) gave final approval for this version of the manuscript to be published.