
Abstract
The aim of this study was to investigate side-to-side differences of simultaneously measured middle cerebral artery (MCA) blood flow velocities during various hemisphere-specific tasks. Using a transcranial Doppler device, flow velocity changes of 24 healthy, right-handed subjects were monitored simultaneously in the left and right MCA during different hemisphere-specific tasks. Mean flow velocity (MFV) curves were averaged for each individual subject and task. Simultaneously, heart rate, blood pressure and end-tidal carbon dioxide (CO2) were measured in a subgroup of six subjects. When compared with the resting state, all stimuli produced significant (p < 0.001) bilateral MFV increases, ranging from 2.5–9.2%. A lateralization of MFV increases with a significantly (p < 0.001) more pronounced increase in MFV in the hemisphere contralateral to the performing hand was observed both during simple sequential finger movements and a complex spatial task. During the complex spatial task, consistently higher MFV increases were observed in the right MCA (p < 0.001), regardless of the side of task performance. Recognition of pictorial material presented as part of a memory task, also resulted in a side-to-side difference of respective MFV increases (right > left, p < 0.001), whereas memorization did not. Whereas bilateral MFV elevations observed during stimulation with white noise were only discrete and not lateralized, exposure to overt speech produced significantly higher (p < 0.001) MFV increases in the left MCA. The time course of the MFV reaction showed a rapid increase with an initial maximum after 4–5 s. Heart rate, blood pressure, and end-tidal CO2 showed only subtle changes during the stimulation periods. In conclusion, the observed side-to-side differences of MFV reaction in the left and right MCA concur with current functional imaging data. Bilateral simultaneous repetitive transcranial Doppler monitoring is a sensitive method to detect cerebral perfusion asymmetries caused by hemisphere-specific activation, and thus may be helpful for noninvasive assessment of hemispheric dominance for language.
Keywords
A close coupling of neuronal activity and regional cerebral blood flow (rCBF) has been shown by several authors. Neuronal activity is tightly coupled to local changes in rCBF (Woolsey and Rovainen, 1991). The first to report a direct connection between brain activity and rCBF was Fulton in 1928. He described an increased blood flow murmur over a patient's occipital angioma while the patient was reading. Today, a variety of tracer techniques are available for in vivo rCBF measurements, including Xenon-133 inhalation or injection techniques, single photon emission computed tomography and positron emission tomography. These methods have been used to evaluate changes in rCBF during different functional activities such as visual stimulation, speech, reading, and cognitive tasks (Risberg and Ingvar, 1973; Ingvar and Schwartz, 1974; Risberg et al., 1975; Gur and Reivich, 1980; Nishizawa et al., 1982; Gur et al., 1982; Phelps et al., 1982; Gur et al., 1987; Demonet et al., 1994; Sergent J, 1994; Roland and Gulyas, 1995). These and other functional-imaging studies indicate task-specific and often hemisphere-specific patterns of rCBF increases. In recent years it has also become possible to study the functional anatomy of the human brain noninvasively by functional magnetic resonance imaging (Ogawa et al., 1990; Kwong et al., 1992; Frahm et al., 1992; Ogawa et al., 1992; Frahm et al., 1993). Together, these imaging techniques, in particular functional magnetic resonance imaging, have the advantage of a high-spatial resolution. However, they do not possess a temporal resolution high enough to detect fast changes (within seconds) of cerebral perfusion, and thus do not provide information on the dynamics of the adjustment of rCBF to rapid alterations of the functional state. A better understanding of the qualitative and quantitative details of the time course of local cerebral perfusion changes may help to clarify the coupling mechanisms that link neuronal activity, regional cerebral perfusion, and metabolism (Lou et al. 1987; Iadecola, 1993).
Transcranial Doppler ultrasonography (TCD) allows for the continuous measurement of flow velocity (FV) in the large basal arteries. The high-temporal resolution of this technique provides data on the dynamic adjustment of the cerebral perfusion in relation to functional neuronal changes. Meanwhile, the reactive FV changes of several vessels were studied with a number of newly developed stimuli and improved methodological procedures (Silvestrini et al., 1994). Technical limitations have restricted most previous studies to successive analyses of different vessels. Hence, true side-to-side comparisons were not possible until the recent development of TCD devices that permit the simultaneous insonation of two different vessels (Rihs et al., 1995). The aim of this study was to evaluate bilateral rapid perfusion changes in the middle cerebral artery (MCA) territory related to hemisphere-specific stimulation. Furthermore, our intention was to analyze the dynamic aspects of task-dependent FV changes and to understand the impact of vegetative factors (blood pressure, partial carbon dioxide [pCO2], heart rate) on FV changes.
METHODS
Using a 2 MHz-pulsed Doppler device (Multi Dop X, DWL, Sipplingen, Germany), the intracranial flow patterns of both MCA were investigated simultaneously in healthy subjects during various hemisphere-specific tasks. In addition, arterial blood pressure, according to the Penaz method (Finapres, Ohmeda, Englewood, CO, U.S.A.), and end-tidal CO2 (Datex Normocap, Helsinki, Finland) were monitored continuously and noninvasively in a subgroup of six subjects.
Subjects
Twenty-four (12 men, 12 women) healthy subjects (mean age 26.3 years, range 23–32 years) were enrolled in the study. None were on medication and there was no evidence of cardiovascular or any other chronic disease. Hemodynamically significant stenoses of the major intracranial or extracranial vessels were ruled out by Doppler examination. All of our subjects were right-handed as determined by the Edinburgh Handedness Inventory (Oldfield, 1971).
Procedures
A single trial was composed of three 30 s phases: an initial resting phase, a stimulation phase, and another resting phase. The stimulation phase of the memory test lasted 50 s. A complete test session consisted of a series of several repetitions of each task (four sequential finger movement trials, four complex spatial task trials, three acoustic stimulation trials, two memorization trials, five recognition trials). To reduce the influence of random FV fluctuations, respective trials of each task were averaged for each subject. The stimuli were applied to all subjects in the following sequence: finger movement, memory test, spatial task, acoustic stimulation.
Before the experiment, all subjects were given instructions to relax, to refrain from external and internal speech, and to avoid any movements during the resting phase. During the entire test session (resting phase and activation phase) the subjects were seated comfortably in a chair. The pictures were presented as slides projected onto a screen inside a black box. An opaque, fitted curtain was used to eliminate other external light sources during picture presentation. The one end of this curtain was tightly connected with the front of the black box, the other end was put over the head and upper part of the body of the respective subject. The actual recording was always preceded by a test run in which the subject was familiarized with the task.
Stimuli
Sequential finger movement task.
The task was to touch the thumb first with the index finger, then with the middle finger, ring finger, little finger, and then back in reverse order for 30 s. The investigator indicated the start and finish of the test by saying “start” and “stop”. During stimulation, the subject's eyes were open and focussed on the performing hand. The finger movements were paced by a metronome at a frequency of 2 Hz.
Complex spatial task.
This task was designed according to Witelson's dichaptic stimulation test (Witelson, 1974). The subjects had to identify a visually presented wooden figure by tactile exploration. Initially a slide, depicting one of four figures, was presented during stimulation. The subject had to blindly search for the depicted figure in a box containing 20 figures (4 different shapes, 5 identical figures of each shape). When the figure selected was identical to the one on the slide it was placed to the right of the box and otherwise to the left. Similar tactile tasks have been described in other studies (Roland and Mortensen, 1987; Seitz et al., 1991; Boecker et al., 1994). The figures used in this study differed in shape, but were identical for both, left- and right hand tasks. Because our main objective was to detect hemisphere-specific FV changes, the variability of this factor should have no effect on our data.
Memory test.
Subjects were instructed to memorize 10 different line drawings, later to be identified from a pool of 50 drawings. During the learning interval, two sets of five different drawings were presented consecutively on slides, 10 s for each picture. During the recall phase, 10 drawings were presented, 5 s each. Subjects were instructed to signalize the recognition of any one of the previously presented pictures with the right hand. This memory task was designed according to the “recognition-memory” test by Warrington (1984); the test procedure was similar to the one described by Kesner and Fineman, 1994. To control for nonspecific perfusion changes in the MCA territory, subjects were also exposed to isolated visual stimulation (with the original line drawings).
Acoustic stimulation.
Two qualitatively different stimuli were used: white noise, which included all frequencies within the hearing range of the human ear, and speech, presented as a narrated short story on tape. Both stimuli were presented over earphones with commercially available equipment.
Data recording and analysis
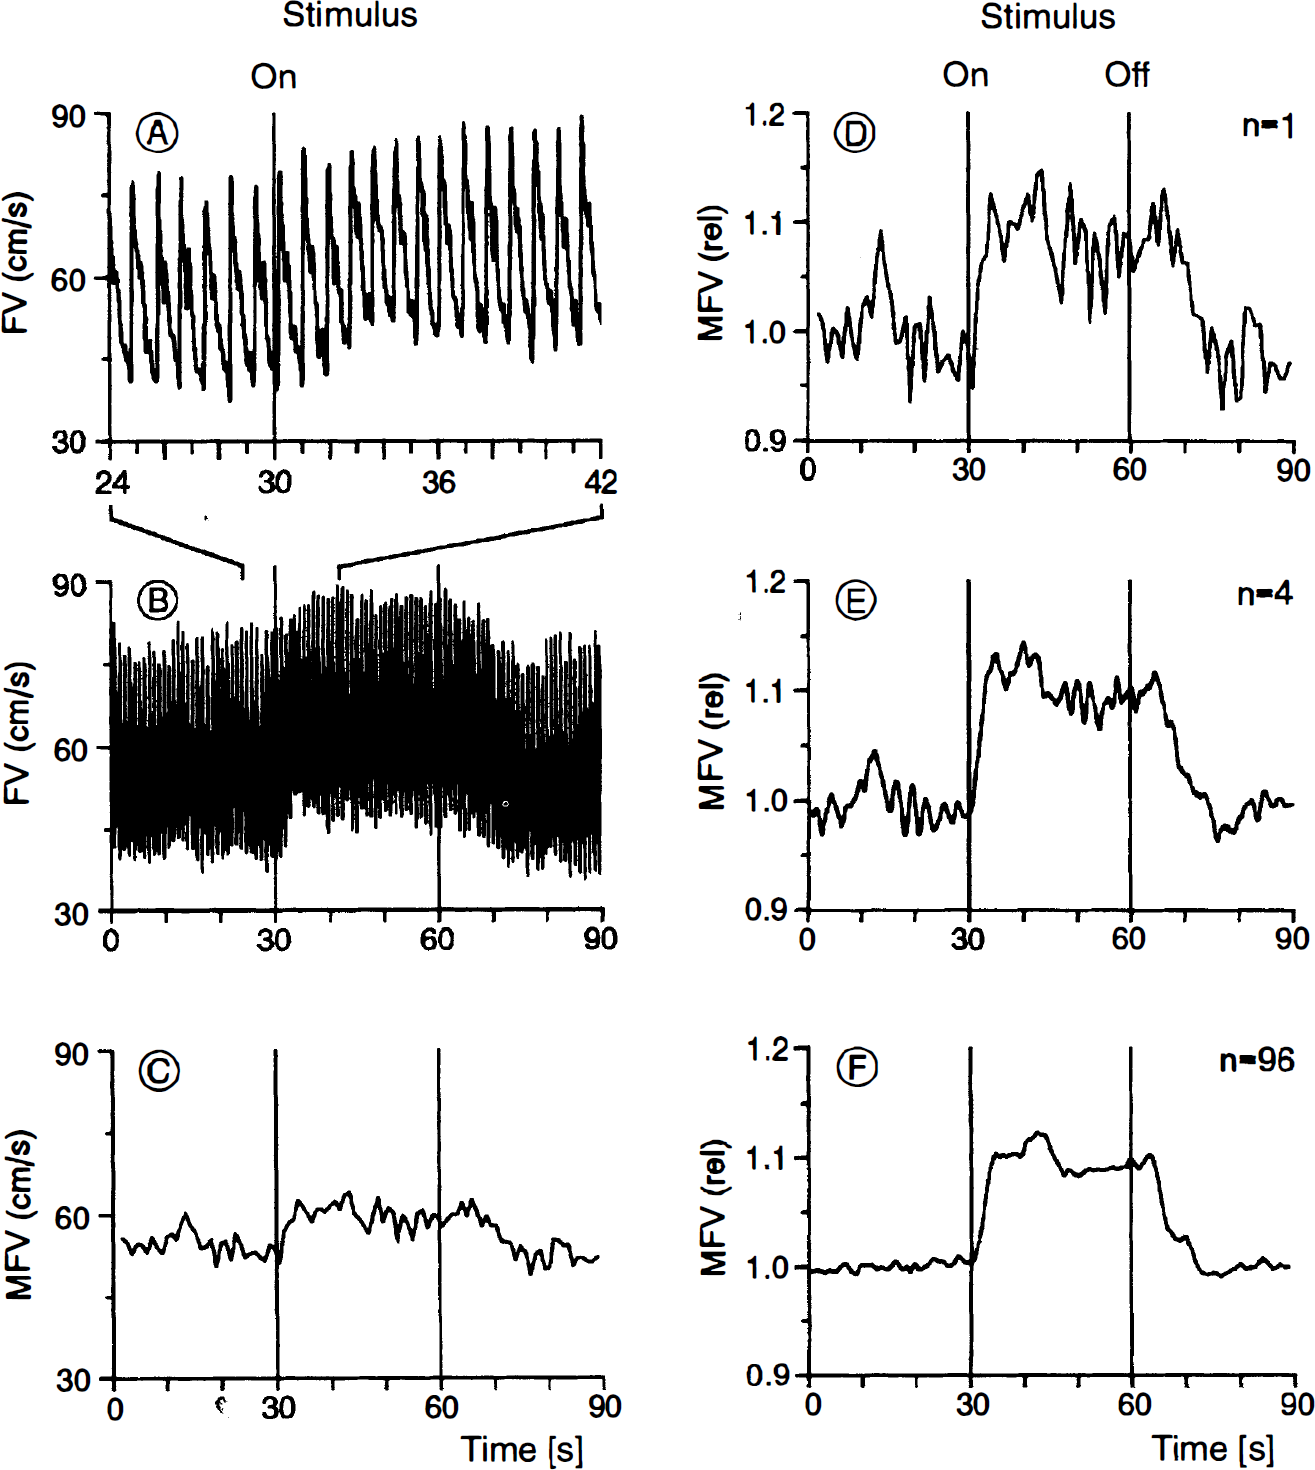
All data were recorded on a computerized system. With a specially designed, computer-aided integration procedure, the mean flow velocity (MFV) was calculated on-line for each heart cycle from the original TCD envelope curve. The MFV curves during the initial resting phase, which were defined as baseline, were normalized to 1; the trials of each task were averaged separately for each subject. Mean flow velocity changes were then related to the corresponding baseline values. The average curves of each subject were later used for statistical analysis. The purpose of our averaging procedure was to systematically amplify event-dependent changes and to eliminate random variations (Fig. 1). In a subgroup of six subjects, percentage changes of heart rate (calculated from the original TCD envelope curve), blood pressure, and end-tidal CO2 during the stimulation phase were also averaged for each individual subject and test condition.
(
Statistical analysis
The data were tested for normal distribution (Kolmogoroff-Smirnov-Test) and similar variance (F-Test). Then the data were analyzed with an analysis of variance procedure using gender as a grouping factor and condition and hemisphere (ipsilateral vs contralateral) as within group factors. A calculated difference of p < 0.05 was considered to be statistically significant.
RESULTS
None of the tasks revealed a gender effect (Fig. 2; finger movement: F(1.22) = 0.04, p = 0.851; complex spatial task: F(1.22) = 0.28, p = 0.603; memory task: F(1.22) = 2.83, p = 0.195; acoustic stimulation: F(1.22) = 1.78, p = 0.195).
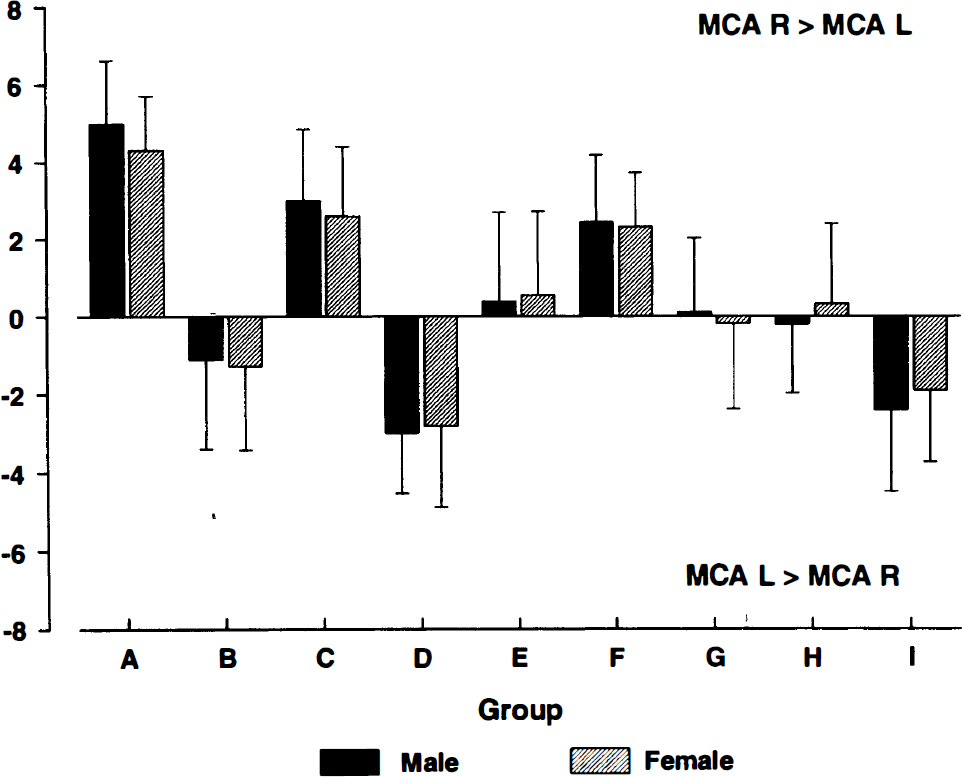
Side-to-side differences of the reactive MFV changes in the left and right MCA for each type of stimulation, separately for female (n = 12) and male (n = 12) subjects. There was no significant gender difference for all tasks (analysis of variance). (A) complex spatial task, left hand. (B) complex spatial task, right hand. (C) finger movement, left hand. (D) finger movement, right hand. (E) memory test, visual learning. (F) memory test, recognition. (G) visual stimulation. (H) acoustic stimulation, white noise. (I) acoustic stimulation, speech. MCA R > MCA L: reactive MFV changes of the right MCA exceeded those of the left MCA. MCA L > MCA R: reactive MFV changes of the left MCA exceeded those of the right MCA.
Sequential finger movement task
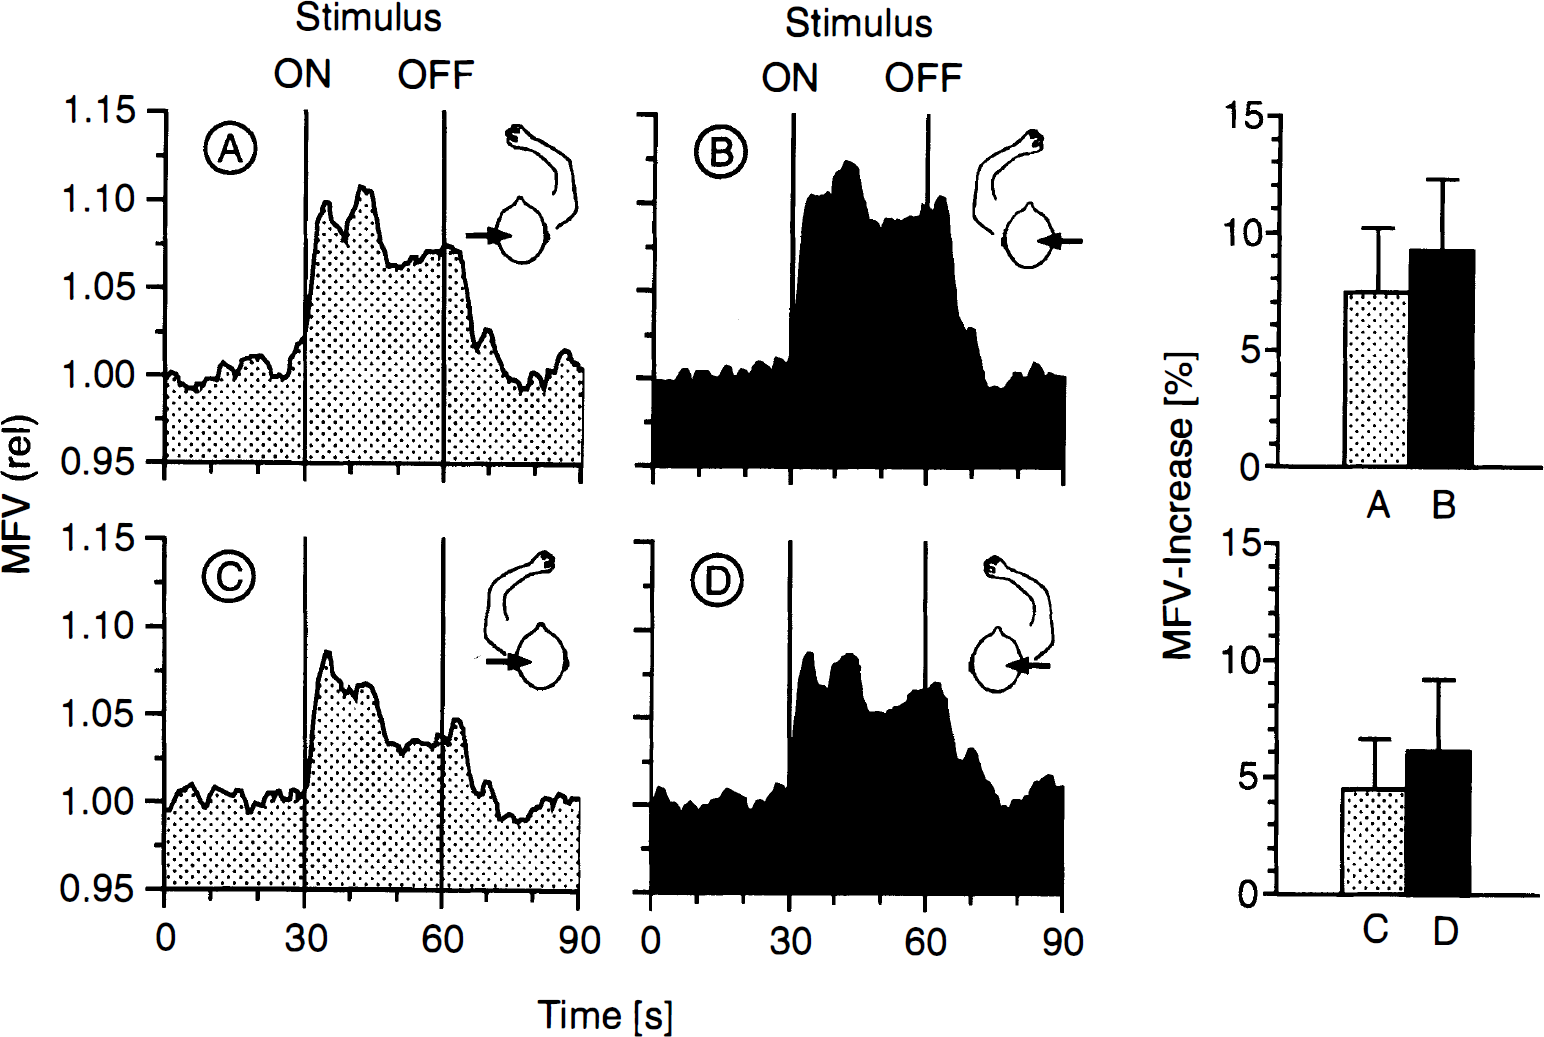
Activation of the contralateral hand (Fig. 3) was associated with a higher MFV increase than activation of the ipsilateral hand (F(1.22) = 58.8, p < 0.001). The side-to-side difference of 3.0 ± 2.4% (right hand) and 2.7 ± 2.4% (left hand) was significant (p < 0.001) for both sides. No significant hand × hemisphere interaction could be found (F(2.44) = 0.79, p = 0.383).
Mean flow velocity changes in the left (
Complex spatial task
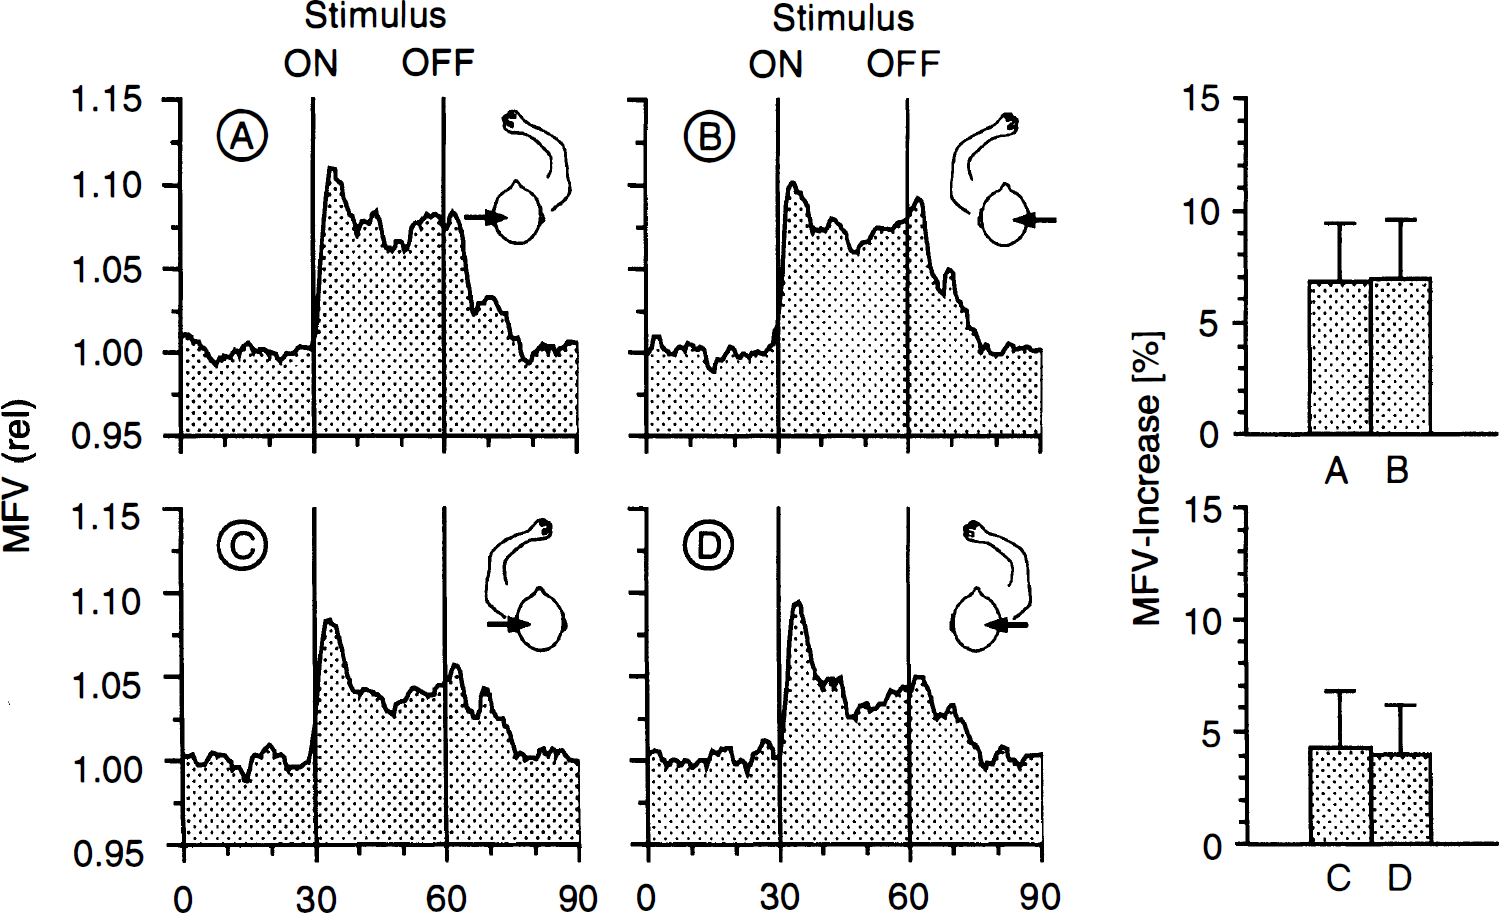
When performing the task with the left hand, the MFV increased by 9.2 ± 3.0% in the right MCA and by 4.5 ± 2.2% in the left MCA (side-to-side difference 4.7 ± 1.5%; p < 0.001) (Fig. 4). During task performance with the right hand, the MFV increased by 7.4 ± 2.8% in the left MCA and by 6.2 ± 3.0% in the right MCA (side-to-side difference 1.2 ± 2.0%; p < 0.05). When performing the task with the contralateral hand, MFV increases were significantly higher than during performance with the ipsilateral hand (right MCA: 3.0 ± 1.9%, p < 0.001; left MCA: 2.9 ± 1.7%, F(1.22) = 68.9, p < 0.001). In addition, there was a significant hemispheric effect of (F(1.22) = 22.9, p < 0.001) with higher MFV values in the right MCA (Fig. 4).
Mean flow velocity changes in the left (
Memory task
During memorization of the presented pictures, MFV increases of 5.8 ± 3.1% in the right and 5.3 ± 2.9% in the left MCA were observed (Fig. 5). Recognition resulted in an increase of MFV in both MCA (right: 7.4 ± 3.0%; left: 5.0 ± 2.6%). There were significant hemisphere effects during recognition with higher MFV increases in the right MCA (F(1.22) = 19.8, p < 0.001). A significant stimulus × hemisphere interaction (F(2.44) = 13.9, p < 0.001) indicated that the difference of right versus left MFV increase was only present during recognition. Visual stimulation alone (with the same line drawings) caused only minor MFV increases (right 3.5 ± 2.2%, left 3.6 ± 2.1%) without significant side-to-side differences (Fig. 2).
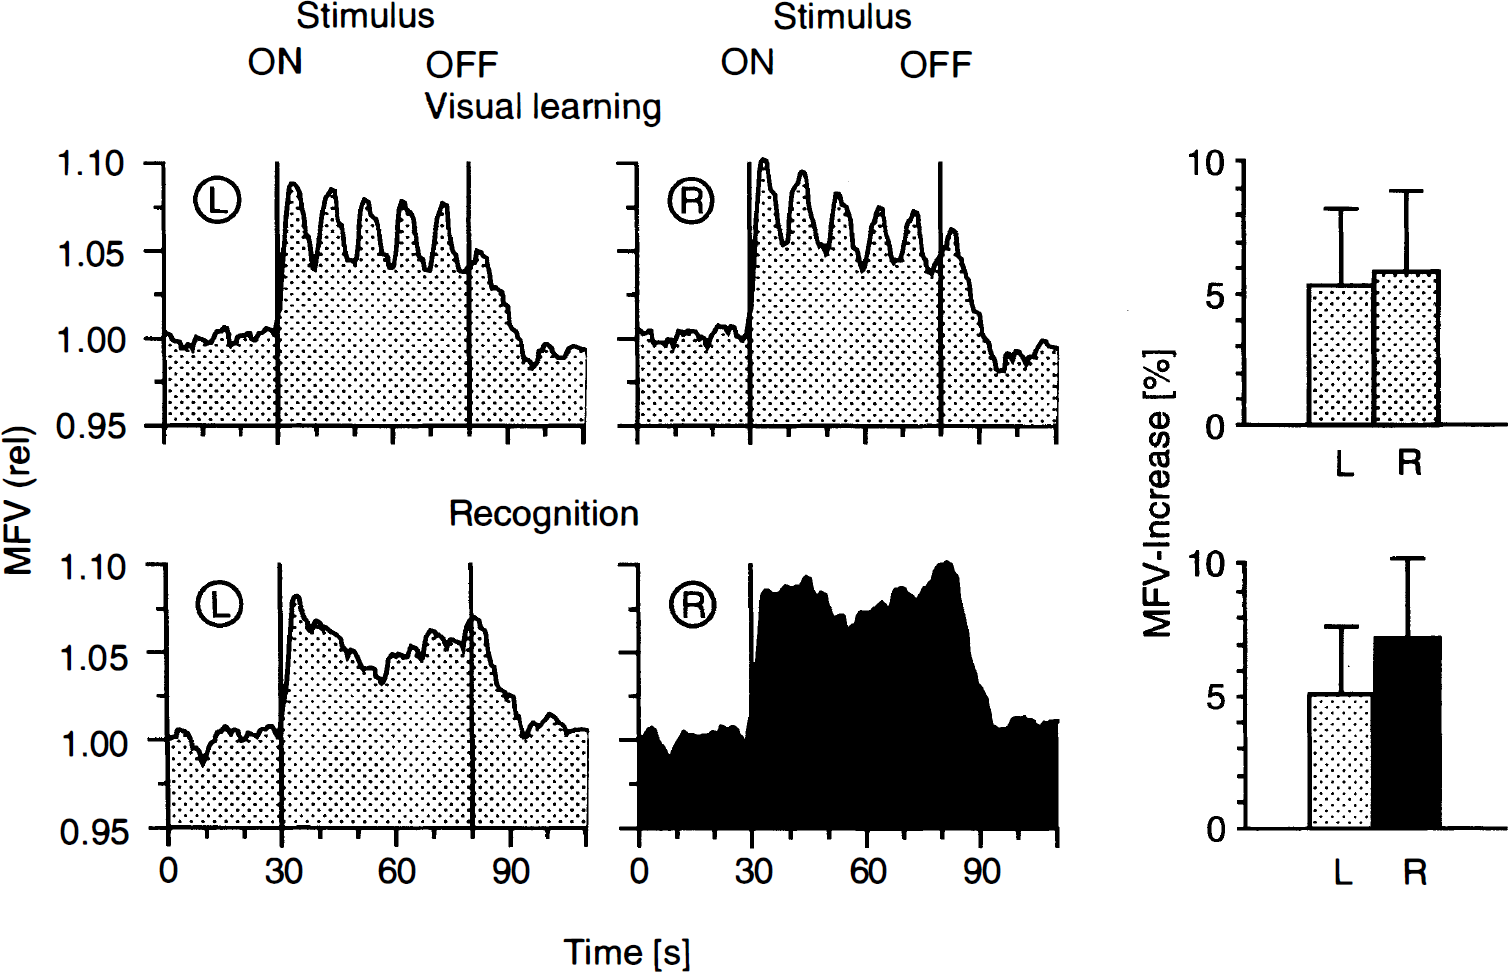
Mean flow velocity changes in the left (L) and right (R) MCA (continuous and bilateral simultaneous monitoring) during performance of a memory task with a series of 50 line drawings. The memorization phase (24 subjects, two sweeps) entailed exposure to five line drawings (10 s per drawing), and the recognition phase (24 subjects, five sweeps), 10 drawings per sweep (5 s per drawing). The curves were computed as follows: Each subject's sweeps were averaged to determine the MFV changes of one individual. The resulting 24 mean curves were then averaged together to determine the overall FV changes of this particular test. The reference point for the summation (“averaging”) of the curves was the start of the test, indicated with “ON”.
Acoustic stimulation
The white-noise stimulation (Fig. 6) caused only minor MFV increases (right 2.5 ± 1.5%, left 2.5 ± 1.9%) without side-to-side differences. In contrast, stimulation with speech (Fig. 6) was associated with a significantly (p < 0.001) higher MFV increase in the left MCA (5.2 ± 1.8%) as compared with the right MCA (3.0 ± 1.8%). There was a significant effect of stimulus (F(1.22) = 21.2, p < 0.001) and hemisphere (F(1.22) = 17.8, p < 0.001). The significant stimulus × hemisphere interaction (F(2.44) = 16.2, p < 0.001) indicated a significant larger MFV increase of the left MCA during the speech task.
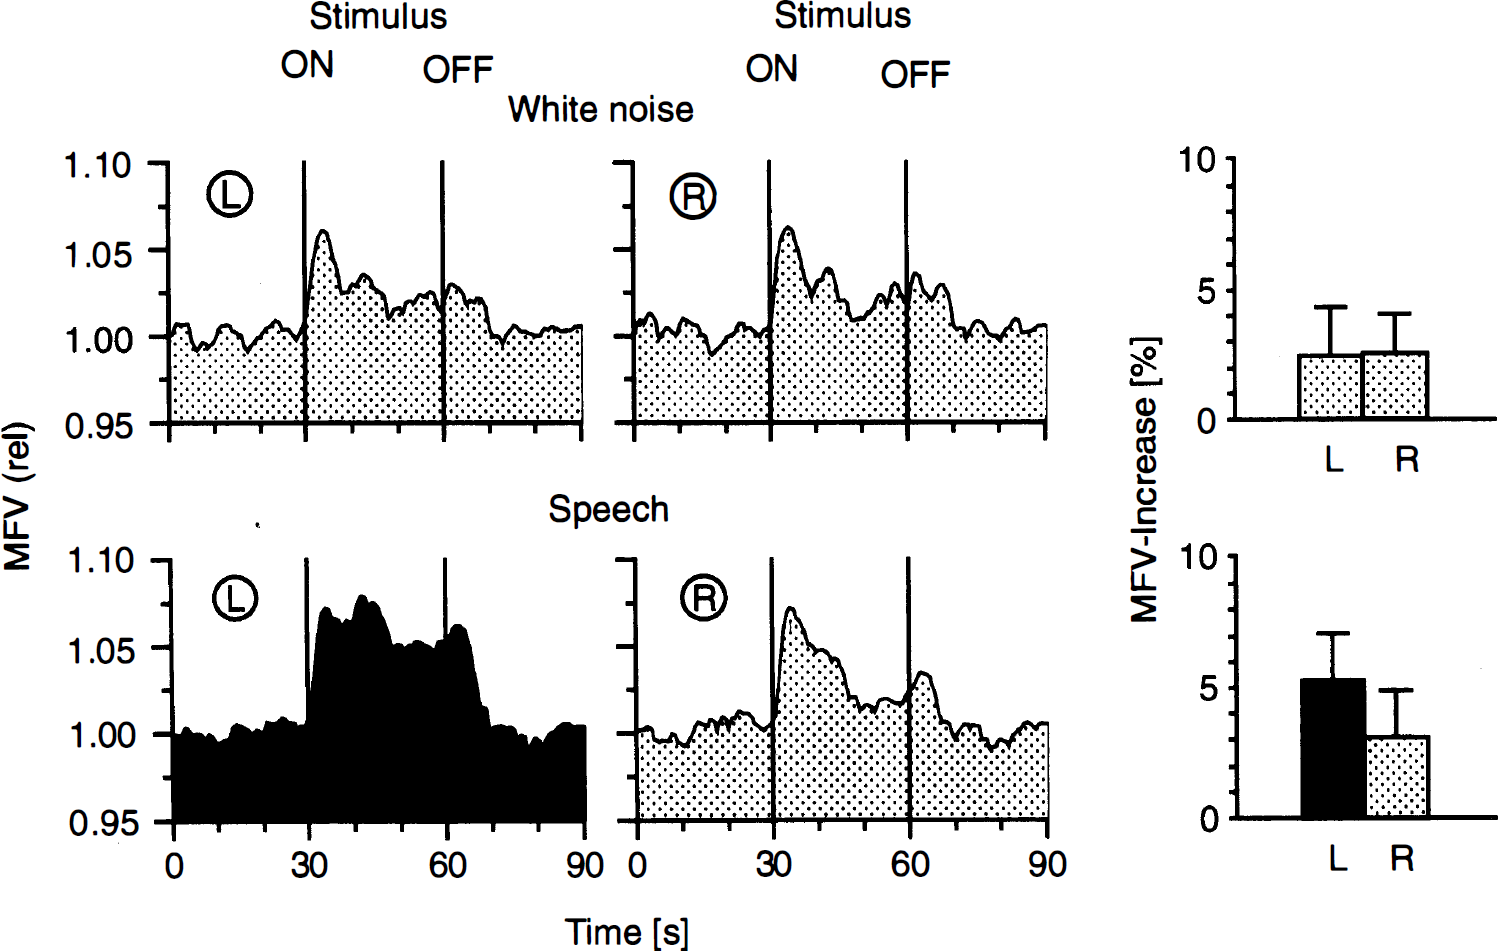
Mean flow velocity changes in the left (L) and right (R) MCA (continuous and bilateral simultaneous monitoring) during acoustic stimulation (white noise and speech) (24 subjects, three sweeps). The curves were computed as follows: Each subject's three sweeps were averaged to determine the MFV changes of one individual. The resulting 24 mean curves were then averaged together to determine the overall FV changes of this particular test. The reference point for the summation (“averaging”) of the curves was the start of the test, indicated with “ON”.
Dynamics of reactive MFV changes
During the complex spatial task, the first peak of the MFV increase was reached simultaneously 4.7 s after stimulus onset in both MCA (Fig. 4). Ten, 50 and 90% of the maximal increase were reached after 1.3 s/1.2 s (right/left), 2.6 s/2.3 s, and 3.9 s/3.7 s respectively. In 19 subjects (79%) a second smaller peak followed the first one 12.7 s after stimulus onset. Overall, the MFV remained relatively constant at the increased level throughout the stimulation in the right MCA, but declined in the left MCA. Eighteen seconds after the initiation of the task the MFV in both MCA stabilized, and both MFV curves followed a horizontal path until the end of the task. However, the side-to-side differences of the flow velocities in the right and left MCA revealed their own dynamics. The difference increased on stimulation and continued to build up until 11 s after stimulation. Then a steady-state phase ensued during which we observed on average a 5.5 ± 1.8% higher MFV in the right MCA. On termination of stimulation, the FV decreased with a latency of 4.1 ± 3.3 s on the right and 4.2 ± 3.2 s on the left. The MFV of both MCA reached baseline values again after 11.0 ± 4.0 s. Similar changes in MFV after the initiation of stimulation could be shown for other stimuli as well (Figs. 3, 6). A unique feature was observed during the memory task. During slide presentation, MFV fluctuations occurred with the same frequency as the pictures were changed (10 s per slide), i.e. every slide change was accompanied by a MFV increase during the memorization phase. However, during the recognition phase when a new slide was presented every 5 s, the MFV curves remained stable (Fig. 5).
Influence of vegetative/autonomic parameters
End-tidal CO2-concentration (pCO2), peripheral arterial blood pressure and heart rate showed only subtle changes during the stimulation periods. The heart rate increased by 3.0 ± 2.6%, and the arterial blood pressure by 2.2 ± 1.8% when the left hand was performing the complex spatial task. The end-tidal CO2-concentration decreased by 1.0 ± 0.9%, due to a slightly increased respiratory rate. Changes similar to those were also observed during the stimulation interval of the finger movement and the memory task, whereas the changes during acoustic stimulation were only minimal (heart rate and arterial blood pressure < 1.0%; pCO2 < 0.3%).
DISCUSSION
Effects of stimulation
All stimuli caused significant bilateral MFV increases compared with the resting state as evidenced by simultaneous Doppler monitoring of both MCA. During sequential finger movements, significant increases were found in the contralateral hemisphere in addition to more discrete, but still significant MFV changes in the ipsilateral hemisphere. These findings of bihemispheric rCBF increases during a sequential motor task concur with different positron emission tomography studies (Fox et al., 1985; Colebatch et al., 1991; Shibasaki et al., 1993; Kawashima et al., 1993; Remy et al., 1994) and functional magnetic resonance imaging studies (Kim et al., 1993; Rao et al., 1993; Boecker et al., 1994) which have shown activity changes in the ipsilateral motor—and premotor cortices depending on task complexity, i.e. simple repetitive versus complex sequential. Thus, the observed ipsilateral FV increases may reflect the importance of ipsilateral motor cortical structures in the control of sequential finger movements with either the left or right hand. Moreover, a recent study showed bilateral increases of MFV after unilateral hemispheric repetitive magnetic brain stimulation, indicating transcallosal activation of inhibitory neuronal areas that may act to suppress the occurrence of mirror movements (Sander et al., 1995). Similar mechanisms may also contribute to the observed ipsilateral MFV increase during finger movements in our study.
In contrast to sequential finger movements, the complex spatial task required additional activation of visual, sensory, motor, and associative areas. The visual input involved both hemispheres to the same extent, whereas the sensory input and motor control of the performing hand are largely functions of the contralateral hemisphere. Whereas the MFV increase in the left MCA was comparable to those during simple finger movements, the higher MFV increases in the right MCA during activity of the contralateral as well as the ipsilateral hand corroborate with the concept of right hemispheric dominance for spatial tasks in right-handed subjects (Shepard and Metzler, 1971; Gur et al., 1982; Benton, 1982; Cohen and Levy, 1986; Skolnick et al., 1993; Silvestrini et al., 1994; Hartje et al., 1994; Rihs et al., 1995).
Side-to-side differences were also observed during the recognition phase of the memory task. In contrast, there was no lateralization of MFV increases during the memorization phase of the same task. These results indicate different cortical activation patterns during learning and memorizing (Deutsch et al., 1986; Roland et al., 1990). Moreover, the relatively higher velocity increases of the right MCA during recognition may be attributed to a specific function of the right hemisphere during visual memory tasks (Deutsch et al., 1986; Squire et al., 1992). The relatively small MCA velocity increase during isolated visual stimulation (with the original 10 line drawings) indicates the specificity of the chosen memory task. The nonspecific bilateral MFV increase may result from the bilateral activation of the frontal eye fields and the visual association cortex (Melamed and Larsen, 1979; Fox et al., 1985).
The small bilateral MCA velocity increase during white noise stimulation reflects the bilateral activation of the primary auditory regions in both temporal lobes (Le Scao et al., 1991). The velocity response after speech stimulation indicates the dominance of the left hemisphere during language processing in right-handed subjects (Carmon et al., 1975; Larsen et al., 1977; Nishizawa et al., 1982; Petersen et al., 1988; Price et al., 1994; Demonet et al., 1994). Two recently published Doppler studies (Hartje et al., 1994; Rihs et al., 1995) also showed left hemisphere dominance in right-handed subjects on verbal tasks.
Dynamic Aspects
The dynamics of flow velocity changes were similar for all stimuli used in our study. The increase in MFV started 0.9 s after the onset of stimulation, and peaked on average after 4.3 s, regardless of its magnitude. Interestingly, the latency of the remission phase with 3.9 s was more than four times as high as the initial delay and the baseline was reached only after another 8 s. Other studies have found a similar time course of FV dynamics in the posterior cerebral artery during visual stimulation (Aaslid, 1987; Conrad and Klingelhöfer, 1989). In animal studies investigating the time course of reactive rCBF after functional brain activation, the first detectable response was delayed by 400 ms and after approximately 2 s the rCBF upsurge was completed (Ngai et al., 1988; Frostig et al., 1990; Dirnagl et al., 1993). The short latency between stimulation onset and significant MFV increase of less than 1 s showed that the coupling between neuronal activity changes and reactive perfusion changes as well as the control of cerebral vascular resistance must be regulated by rapidly acting mechanisms (Iadecola, 1993). In our present study, the MFV increase revealed a “two peak” pattern. We postulate that the first MFV upsurge reflects a general nonspecific activation. However, the second peak may represent an oscillatory adaptation mechanism of cerebral perfusion related to the changes in neuronal activity. This is consistent with the observation that any side-to-side MFV difference is not distinguishable until after the second peak.
Additional factors influencing the MFV responses
In contrast to other imaging studies (Levy and Reid, 1976; H&Écaen et al., 1981; Gur et al., 1982) gender effects were not observed in the present investigation when spatial and verbal tasks were performed. These different findings may be attributable to the limited spatial resolution of TCD that can only reflect the cerebral perfusion of the entire MCA territory.
The influence of factors like blood pressure, heart rate, or pCO2, which may partly account for the observed velocity responses, have been analyzed in only a few studies (Kelley et al., 1992; Jorgensen et al., 1993; Kelley et al., 1993). In the present investigation, there were only minor changes of these parameters during stimulation. Although the relationship between MFV increase during stimulation and heart rate and blood pressure changes was not very strong (heart rate: r = 0.27, blood pressure: r = 0.35), it cannot be ruled out that the increase of both factors may have enhanced the MFV increase during stimulation. However, the observed CO2 reduction during stimulation should result in a slight MFV decrease, assuming a normal CO2 reactivity. In light of this, it may be presumed that the influence of these three factors on the MFV is only minor. These findings and the hemispheric differences in reactive MFV increases indicate that the perfusion changes reflect functional neuronal activation and are not caused by changes of cardiovascular or respiratory factors. This notion is also supported by studies of other authors (Aaslid, 1987; Kelly et al., 1992; Jorgensen et al., 1993).
A further distinct influencing factor seems to be the sequential recording of the vessels. Until recently, simultaneous measurements of both MCA were not possible because of technical limitations. Therefore, in most of the previous studies (Droste et al., 1989; Bruneau et al., 1992; Markus and Boland, 1992; O'Dell et al., 1992; Kelley et al., 1993), subjects were divided into two groups and the investigation proceeded by measuring the right MCA first in one group and the left MCA first in the other group. In some studies, MFV responses of the first measured MCA were higher than on the subsequently examined side (Droste et al., 1989). Higher MFV responses of the first measured MCA were ascribed to various factors (e.g. loss of motivation, habituation), which could play a role especially at the beginning of the stimulation, but which lose their importance in the course of examination. The influence of these factors may explain some discrepant TCD results, especially in the analysis of the side-to-side difference in studies with hemisphere-specific tasks (Droste et al., 1989; Markus and Boland, 1992; O'Dell et al., 1992). We suggest that continuous and bilateral monitoring may be preferred to avoid interactions caused by sequential measurements. Additionally, a stimulus-triggered averaging technique should be applied to better distinguish between random alterations of FV during the resting phase and task-specific velocity increase caused by neuronal activity.