
Abstract
Cerebral blood flow (CBF) was measured by 133Xe clearance simultaneously with the velocity of blood flow through the left middle cerebral artery (MCA) over a wide range of arterial PCO2 in eight normal men. Average arterial PCO2, which was varied by giving 4% and 6% CO2 in O2 and by controlled hyperventilation on O2, ranged from 25.3 to 49.9 mm Hg. Corresponding average values of global CBF15 were 27.2 and 65.0 ml 100 g min−1, respectively, whereas MCA blood-flow velocity ranged from 42.8 to 94.2 cm/s. The relationship of CBF to MCA blood-flow velocity over the imposed range of arterial PCO2 was described analytically by a parabola with the equation:

The observed data indicate that MCA blood-flow velocity is a useful index of CBF response to change in arterial PCO2 during O2 breathing at rest. With respect to baseline values measured while breathing 100% O2 spontaneously, percent changes in velocity were significantly smaller than corresponding percent changes in CBF at increased levels of arterial PCO2 and larger than CBF changes at the lower arterial PCO2. These observed relative changes are consistent with MCA vasodilation at the site of measurement during exposure to progressive hypercapnia and also during extreme hyperventilation hypocapnia.
Keywords
Transcranial Doppler (TCD) ultrasonography, developed as a noninvasive technique for measuring blood-flow velocity in major cerebral vessels (Aaslid et al., 1982), provides a quantitative index of cerebral blood flow (CBF) that can be measured continuously under conditions in which more direct methods (e.g., that require bulky instrumentation or administration of radioactive isotopes) are not useful. Changes in blood-flow velocity through basal cerebral arteries are stated to be closely proportional to concurrent changes in CBF (Aaslid, 1987, 1989; Lindegaard et al., 1987), based on the assumption that the diameters of basal cerebral vessels do not change in response to physiological stimuli that affect the brain microcirculation. In support of this assumption, angiographic measurements of human cerebral vessels (Huber and Handa, 1967) showed that vessels greater than 2.5 mm in diameter did not dilate significantly during hypercapnia, whereas another study (Krapf et al., 1987) showed that vasopressin administration failed to constrict either the internal carotid or middle cerebral arteries. Other studies, however, indicate that basal cerebral vessels do contribute to alterations in cerebral hemodynamics (Kontos et al., 1978; Wei et al., 1980). Referring to these apparently contradictory findings, Werner (1991) concluded that any representation of changes in CBF by TCD measurements of blood velocity must be supported by direct correlation of TCD data with classic measurements of CBF for each physiological condition.
If appropriately validated, TCD ultrasonography would be useful for quantitative investigation of the interrelationships among arterial PCO2, CBF, brain oxygen dose, and risk of oxygen convulsions in divers exposed to extreme respiratory environments and in patients who breathe oxygen therapeutically at increased ambient pressures in hyperbaric chambers (Kindwall, 1994). In military, commercial, and scientific diving operations, hyperoxia is used to enhance the safety and efficiency of decompression procedures (Lambertsen, 1967). When arterial hypercapnia occurs during exposure to hyperoxia, the risk of oxygen convulsions is increased by associated increments in brain blood flow and oxygen pressure (Lambertsen et al., 1955). In medical applications of hyperbaric oxygenation, hypoventilation imposed by pharmacologic interventions with narcotic drugs or other respiratory depressants also causes concurrent increments in arterial PCO2, brain oxygen dose, and risk of convulsions. Quantitative definition of the interactions among these parameters would be greatly aided by the availability of a reliable CBF index that can be measured noninvasively under both steady-state and dynamic conditions.
To evaluate the use of middle cerebral artery (MCA) blood-flow velocity as an index of CBF while breathing O2 at increased ambient pressures, we concurrently measured blood-flow velocity by TCD ultrasonography and CBF by 133Xe clearance in normal young men at rest breathing O2 at 1.0 atmosphere absolute (ATA), with spontaneous and altered arterial PCO2 levels. Clearance of 133Xe with administration of the tracer by inhalation was selected as the CBF method because it is widely used (Skolnick, 1991; Young et al., 1995), noninvasive (Skolnick, 1991), and highly reproducible in normal young adults (Warach et al., 1988). Prominent changes in both CBF and blood-flow velocity were assured by voluntary hyperventilation and by CO2 administration to provide the desired wide range of arterial PCO2. Oxygen was used as the background gas to provide the highest possible arterial PO2 values at normal atmospheric pressure. An air-breathing CBF control was not included because previous studies indicated that CBF reductions associated with O2 breathing could be explained by concurrent decrements in arterial PCO2 (Kety and Schmidt, 1948; Lambertsen et al., 1953; Lambertsen, 1965; Busija et al., 1980).
METHODS
All experiments were performed in the Cerebral Blood Flow Laboratory of the Cerebrovascular Research Center at the University of Pennsylvania Medical Center. Subjects were normal men ranging in age from 21 to 40 years (mean, 25.8). All subjects gave informed consent to a research protocol approved by the Human Studies Committee of the University of Pennsylvania.
The protocol of the experiment is summarized in Fig. 1. Arterial PCO2 was varied by administration of 4 and 6% CO2 in O2 and by voluntary controlled hyperventilation while breathing 100% O2. Before breathing O2 for the first time, the subjects' arterial blood was sampled, and MCA blood-flow velocity was measured over a 2-min period while breathing room air. The order of gas administration then proceeded as indicated in Fig. 1. Each gas mixture was breathed for 30 min. After the first 10 min, the arterial circulation was loaded with inhaled radioactive xenon (133Xe) over a 1-min rebreathing period. Arterial blood sampling, CBF determination, and TCD measurement periods are as indicated. As part of the pre-experiment preparations, each subject breathed 6% CO2 in O2 for 30 min to become familiar with the subjective stresses induced by hypercapnia.
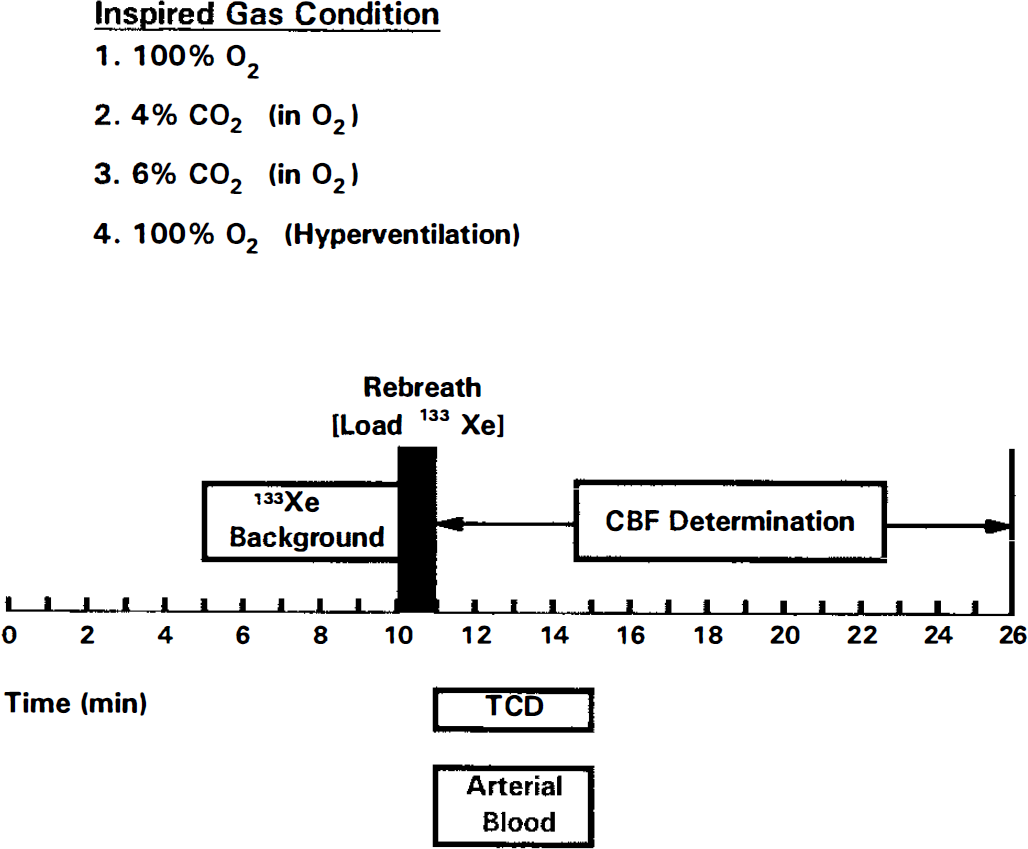
Experiment protocol for concurrent measurements of CBF and middle cerebral artery blood-flow velocity. Inspired gas mixtures were administered in the order shown. Sampling periods are indicated. Background 133Xe counts were monitored for 5 min before each period of 133Xe loading to correct subsequent clearance values for the small amount of 133Xe remaining from the previous CBF determination.
CBF measurement by 133Xe clearance
The noninvasive 133Xe clearance method for measuring regional CBF (rCBF) was performed in a standard manner (Skolnick, 1991). Briefly, a trace amount of 133Xe, a highly diffusible gamma-emitting inert gas, was inhaled during a 1-min period of rebreathing and passed by alveolar-capillary diffusion into the systemic circulation. On reaching the brain via the arterial circulation, 133Xe diffused into the brain parenchyma in accord with its concentration gradient and partition coefficients. Clearance of the tracer was monitored for 15 min with collimated scintillation detectors (NaI crystals). The Novo Cerebrograph system (Model 32B, Helmet upgrade) used for the CBF measurement contained 32 detectors placed over 16 homotopic regions of the two hemispheres.
Estimates of CBF that were calculated from the measured rate of 133Xe clearance (Obrist and Wilkinson, 1990) included CBF15, F1, and initial slope (IS). CBF15, representing the averaged CBF of both gray and white matter, was calculated as the height-over-area for the entire 15 min of clearance. The F1 tissue compartment, which has fast clearance characteristics and primarily represents CBF in gray matter, was calculated by using the biexponential least-squares method. The relative weight of the F1 compartment (w1) was also calculated because it was considered that the imposed range of arterial PCO2 was wide enough to cause “slippage” between compartments in a two-compartment analysis of the clearance curves. The IS was defined as the derived slope of the equivalent unit-impulse curve at time zero.
TCD measurement of MCA blood-flow velocity
The MCA blood-flow velocity was measured as a moving average of the mean velocity for each cardiac cycle by using an Eden Medical Electronics TC 2000S Multifrequency Transcranial Doppler System according to the technique of Aaslid et al. (1982). A standard transtemporal window and a 2 MHz probe stabilized with a probe head holder were used. Acquired data were continuously stored, and average values over specific periods (Fig. 1) were identified and extracted.
Arterial blood sampling and analysis
Arterial blood was sampled anaerobically via an indwelling radial artery catheter into a precision-bored 10-ml glass syringe with heparin solution lining the walls and filling the dead space. The syringe was sealed and immersed immediately in a mixture of water and ice. Blood samples were analyzed within 30 min for pH, PCO2, and PO2 on an Instrumentation Laboratory System 1304 pH/blood gas analyzer. All analyses were performed at least twice, with additional analyses if duplicate measurements did not agree within 0.005 U for pH or 1.0% of the absolute value for PCO2 or PO2. Measured blood gas and pH values were corrected for the difference between body temperature and the measurement temperature of 37.0°C by using a computer program based on previously established correction factors (Severinghaus, 1966). Rectal temperature was measured with a Yellow Springs model 43TF thermistor thermometer.
Cardiovascular function
The electrocardiogram was monitored continuously on a Spacelabs Alpha 14 patient monitor. The same system was used to monitor blood pressure with an Abbott Critical Care Systems disposable blood pressure transducer connected to the indwelling arterial catheter. Heart rate and blood pressure were recorded during or immediately after each period of arterial blood sampling.
Statistical analysis
Regression lines and 95% confidence limits were calculated by standard methods. Effects on the cardiovascular data were tested using analysis of variance (ANOVA) with repeated measures followed by t tests comparing each condition with the 100% O2 data when the overall F was significant. The critical value of t was adjusted to account for the fact that four comparisons were made. The level of significance was considered p ≥ 0.05.
RESULTS
Table 1 contains, for all measurement conditions, average values of PCO2, pH, and PO2, blood pressure, heart rate, MCA flow velocity, and CBF15, IS, and F1 for all 32 probes (global). Average arterial PCO2 ranged from a low value of 25.3 mm Hg during hyperventilation to a high value of 49.9 mm Hg while breathing 6% CO2 in O2. Corresponding values of MCA blood-flow velocity were 42.8 and 94.2 cm/s, respectively. Average CBF15, IS, and F1 had low values of 27.2, 32.1, and 35.0 ml/100 g/min, respectively, and corresponding high values of 65.0, 93.1, and 91.8 ml/100 g/min. Average w1 values were 45.5, 47.2, 46.6, and 50.0, respectively, at arterial PCO2 levels of 25.3, 38.5,43.6, and 49.9 mm Hg. All four w1 values were quantitatively similar, but w1 for the highest PCO2 level was significantly higher than the other three values (ANOVA: F = 4.98; df = 3,21; p = 0.009). Although the observed small increment in w1 may not be physiologically significant, it adds further justification to the reason given below for the use of a height-over-area rather than a compartmental analysis of our CBF data.
Cerebral blood flow and flow velocity, arterial oxygenation and acid-base state, and hemodynamic responses during exposure to oxygen, carbon dioxide, and hyperventilation a
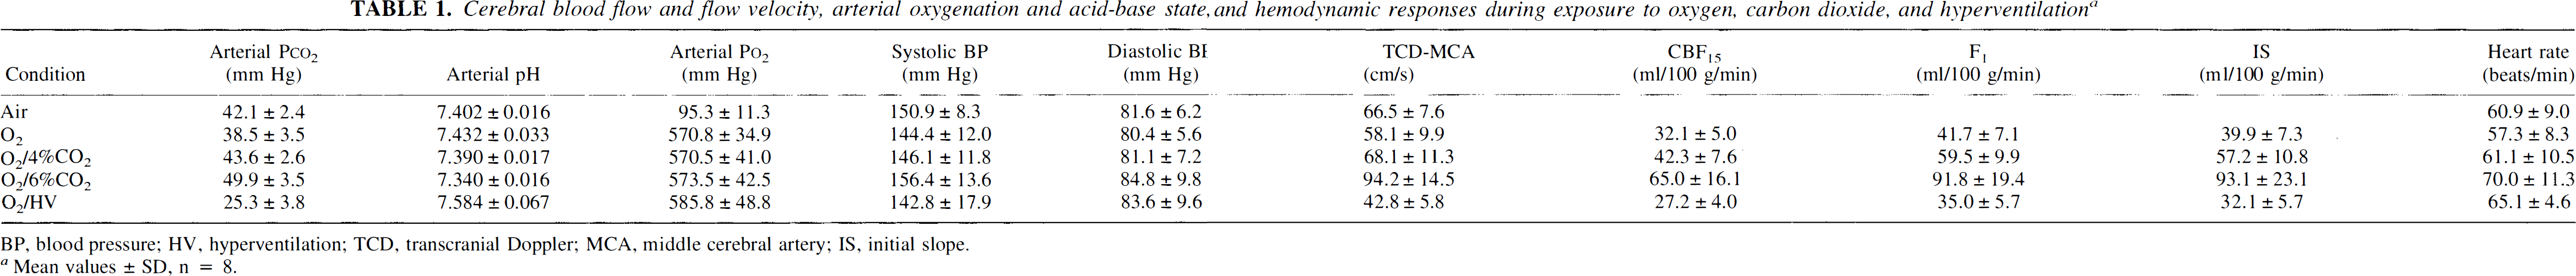
BP, blood pressure; HV, hyperventilation; TCD, transcranial Doppler; MCA, middle cerebral artery; IS, initial slope.
Mean values ± SD, n = 8.
Figure 2 shows the average values for MCA blood-flow velocity and CBF15 plotted against arterial PCO2. The two cerebral circulatory indices are expressed in different units of measurement, but they have similar absolute values and can be compared on the same graph. The slope of the CBF curve is nearly parallel to corresponding segments of the velocity curve in the hypercapnic region of the arterial PCO2 range and flatter during hyperventilation hypercapnia.
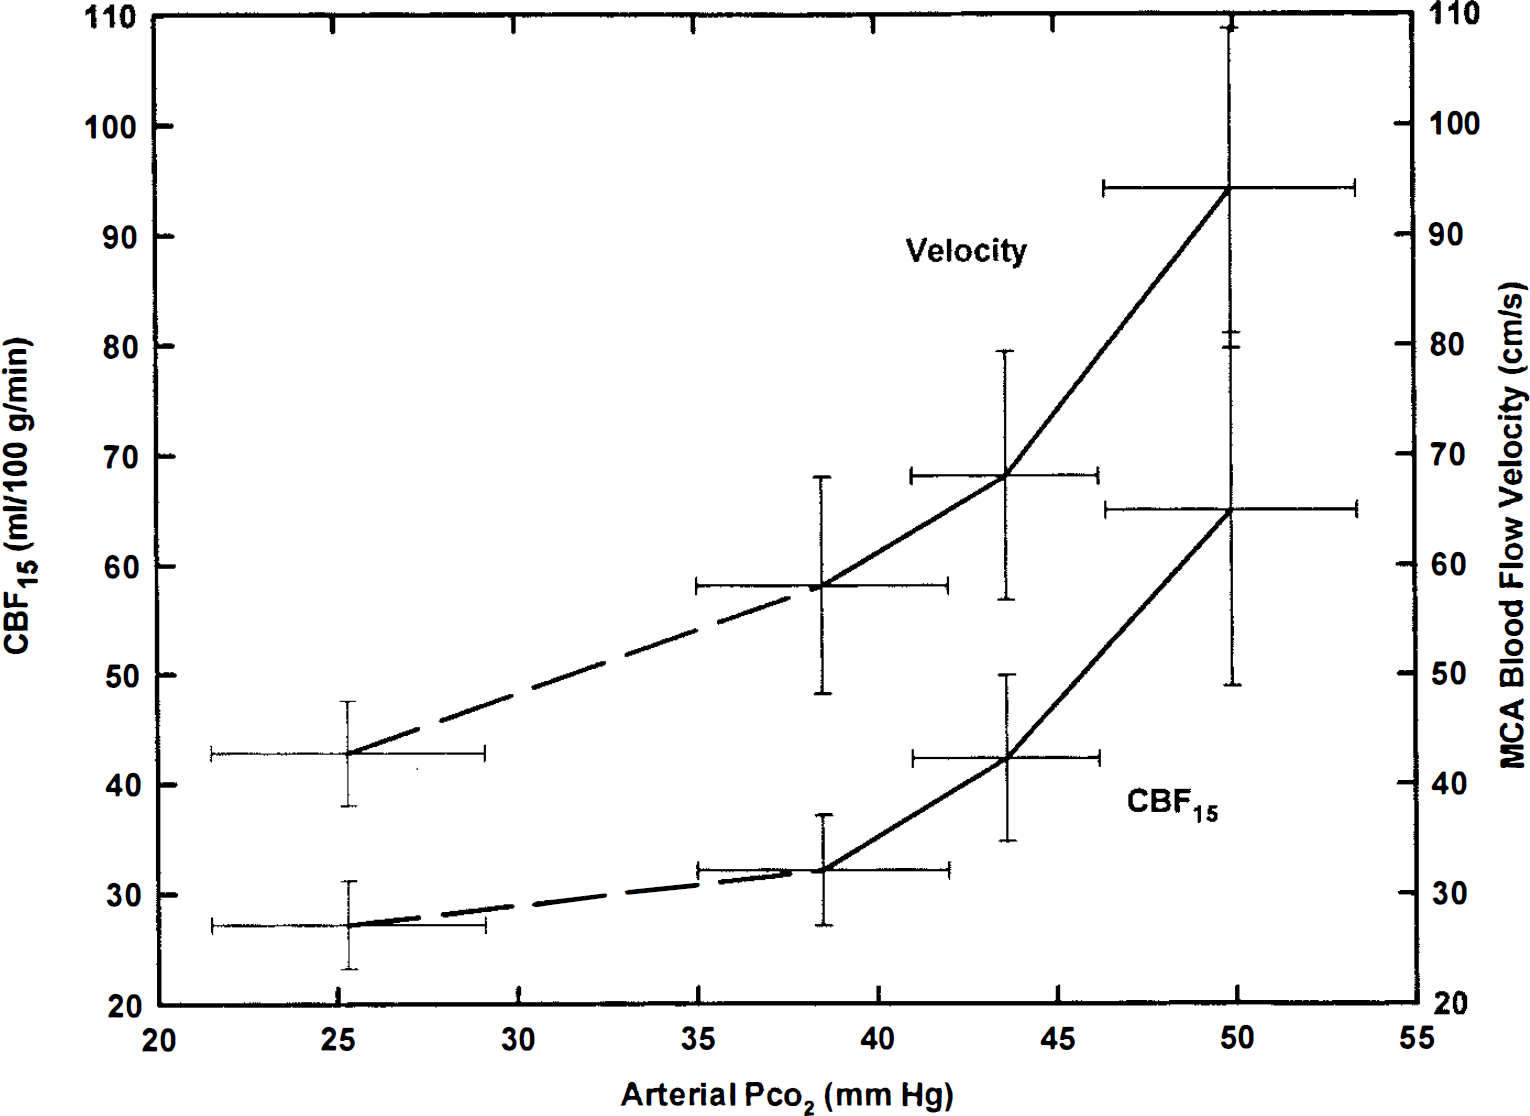
Average relationships of CBF15 index and middle cerebral artery (MCA) blood-flow velocity to arterial PCO2 during O2 breathing at 1.0 atmosphere absolute (ATA). Mean values ± SD for eight subjects are shown. Note that units of flow and velocity (on opposite sides of the figure) are identical. Absolute values have not been shifted to make measured average values coincide at any level of arterial PCO2. Dashed lines on left sides of both curves indicate uncertainty regarding accuracy of interpolated values within hypocapnic range of arterial PCO2. See text for discussion.
In our analysis of MCA blood-flow velocity as a CBF index to be used in subsequent investigations of the interrelationships between arterial PCO2, CBF, and brain oxygenation, we focused on CBF15 rather than IS or F1 as the more appropriate measure of overall brain blood flow. In Fig. 3, individual CBF15 values are plotted against corresponding values for MCA blood-flow velocity. All eight subjects had a linear or nearly linear flow-velocity relationship at arterial PCO2 levels that were above normal, with a variable reduction in slope in the hypocapnic region of the curve corresponding to the points for breathing 100% O2 at rest and during hyperventilation. Therefore, both linear and parabolic expressions were used to describe the observed data analytically. The linear description of the overall flow-velocity relationship from hypercapnia through hypocapnia has the following equation:

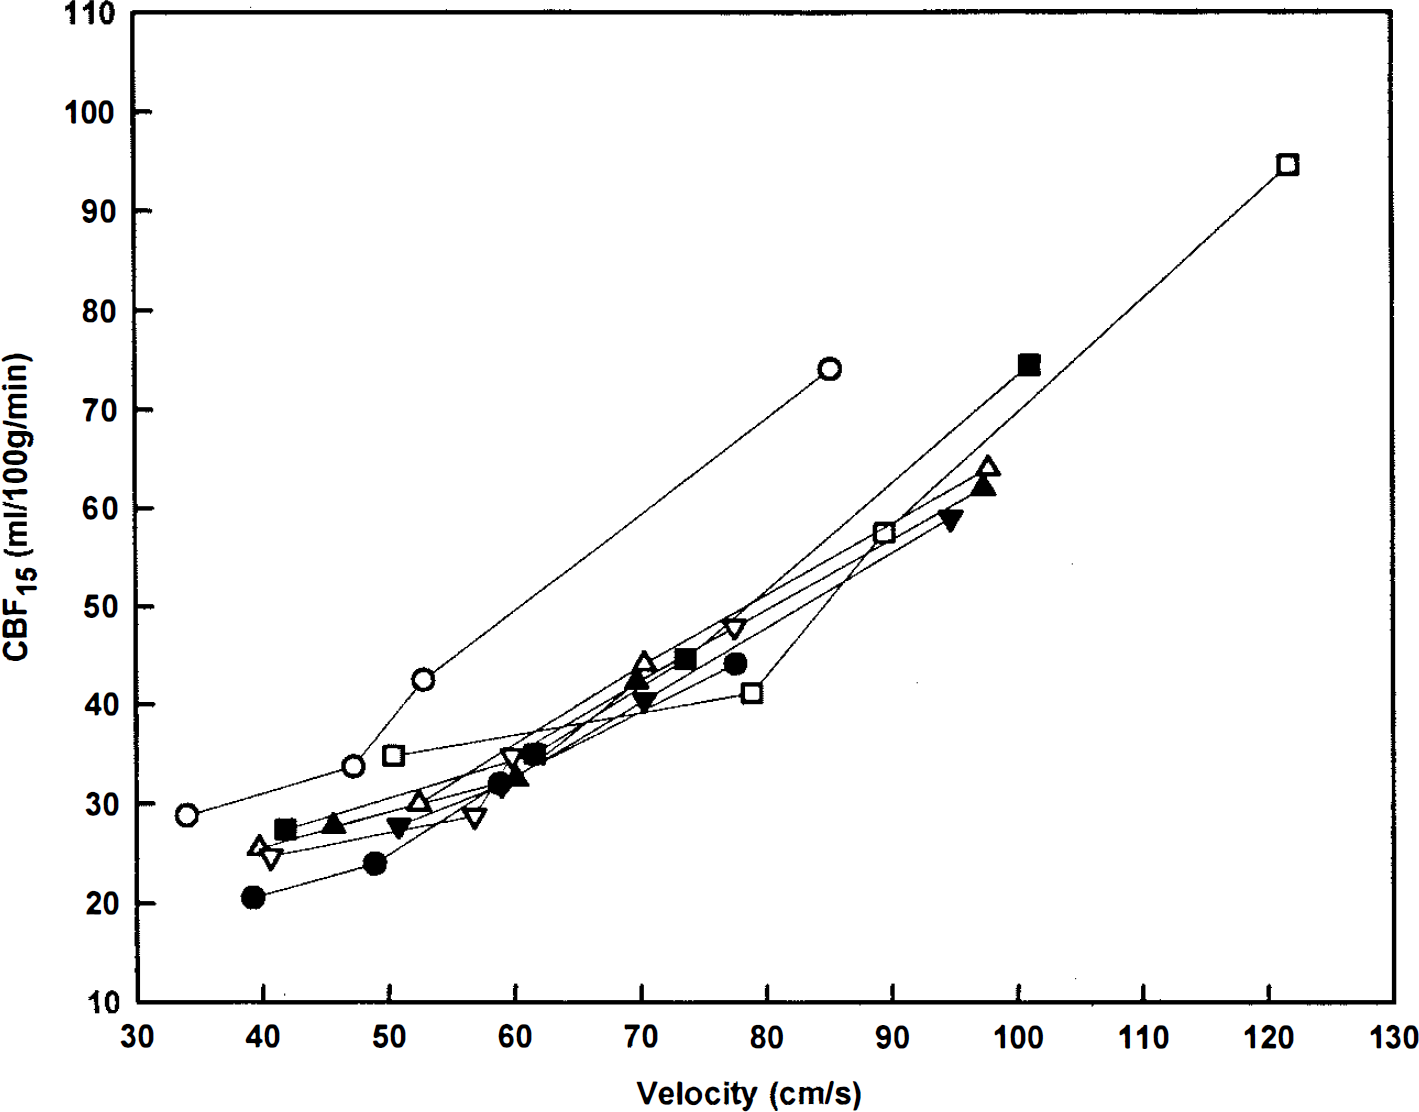
Individual relationships of CBF15 to middle cerebral artery (MCA) blood-flow velocity in eight subjects over arterial PCO2 range of 25 to 50 mm Hg. The individual curves are nearly superimposed for all but one of the eight subjects. This subject had an average CBF-PCO2 relationship, but his MCA blood-flow velocities were the lowest of all subjects across the entire range of arterial PCO2. His velocity-PCO2 relationship was otherwise typical and could be consistent with either an unusually large MCA diameter or an unusually large angle of insonation between transducer probe and MCA axis.
The standard error of estimate (SEest) is 6.3 ml/100 g/min, and the squared correlation coefficient (R2) is 0.87. The simplest nonlinear description of the observed overall flow-velocity relationship is a parabola with the following equation:

For comparison with the linear expression, SEest is 5.4 ml/100 g/min and R2 is 0.91. The parabolic description of the data provides a slightly better fit than the linear expression. Based on the empirical observation that the lower portion of the flow-velocity relationship is definitely nonlinear in most of the subjects (Fig. 3), the parabolic expression was selected for further analysis. The same individual data points that are plotted in Fig. 3 are shown in Fig. 4 with the parabola whose equation is given above. The inner pair of curves enclosing the parabola represents the 95% confidence limits for calculating an average CBF15 from an average value of MCA blood-flow velocity for a group of subjects. The outer pair of curves represents 95% confidence limits for calculating an individual CBF15 value from a determination of MCA blood-flow velocity in one subject.
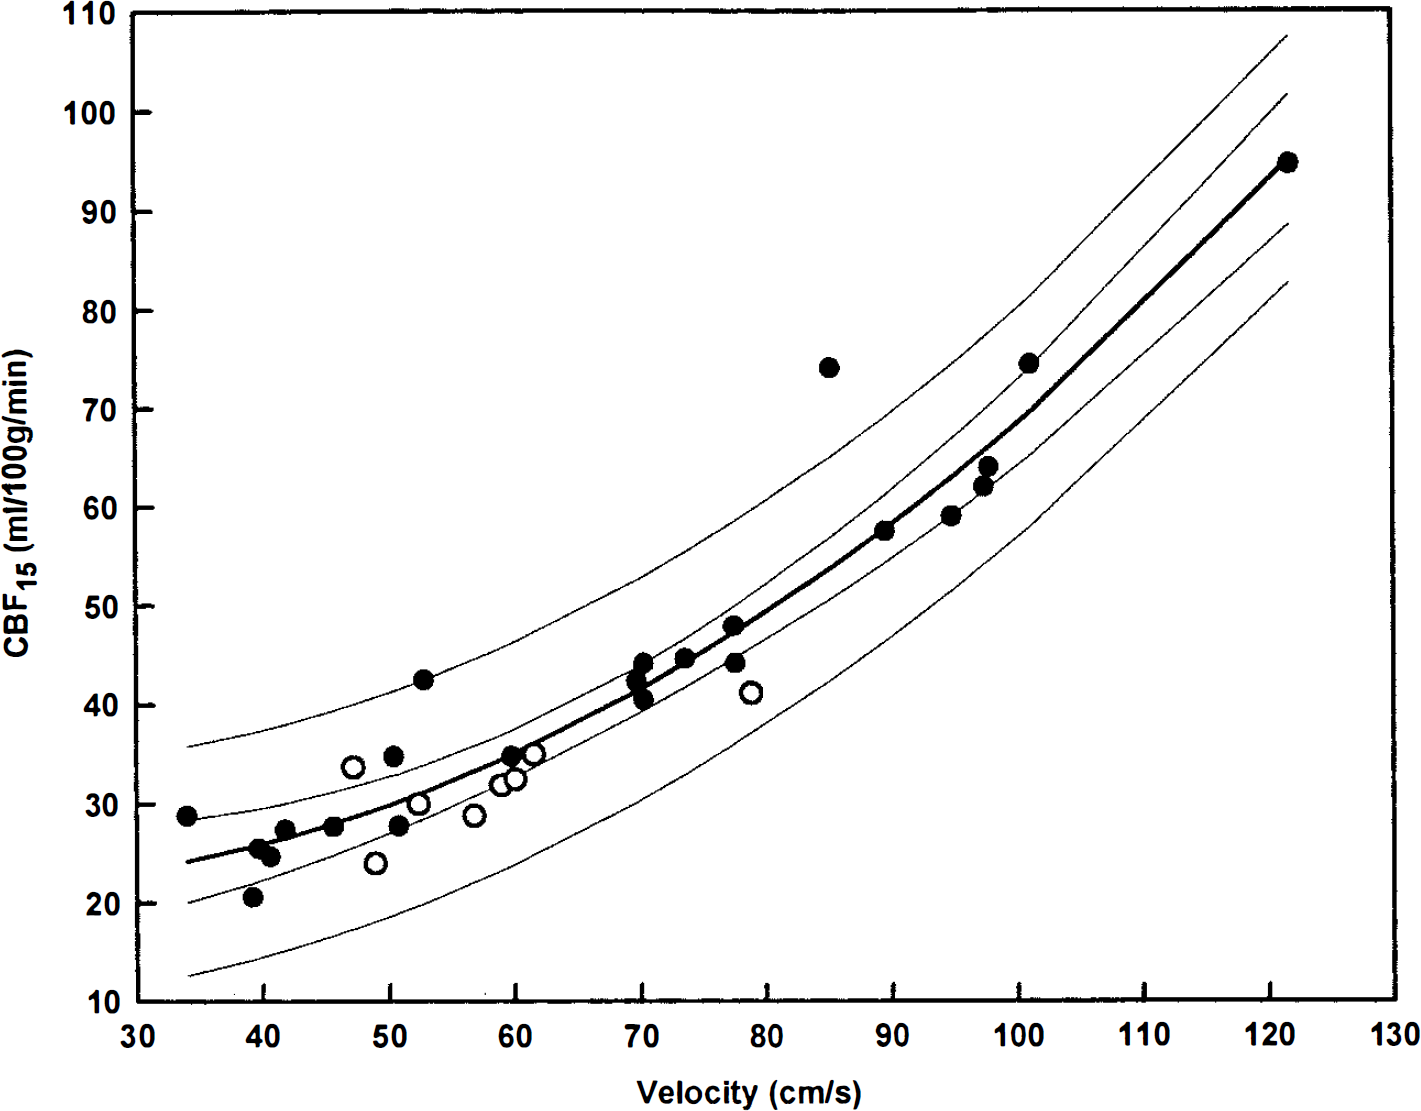
Parabolic relationship of CBF15 to middle cerebral artery blood-flow velocity with 95% confidence limits for average and individual data. Data points are identical to those shown in Fig. 3. Open circles indicate individual values for spontaneous 100% O2 breathing. See text for equation of the curve.
The hemodynamic responses to the selected exposure conditions are summarized in Table 1. Average heart rate decreased slightly from 60.9 to 57.3 beats/min during the transition from air to O2 breathing, rose progressively to 70.0 beats/min while breathing 6% CO2 in O2, and fell to 65.1 beats/min during hyperventilation on O2 (F = 5.16; df = 4,28; p = 0.003). The pattern of change in average systolic blood pressure was similar to that of heart rate (F = 7.46; df = 4,28; p = 0.0003). Diastolic blood pressure also showed a similar trend, but these changes were not statistically significant (F = 1.06; df = 4,28; p = 0.39).
All subjects were able to tolerate exposure to the four experiment conditions with no significant adverse effects. A few experienced mild headaches either during or immediately after breathing 6% CO2 in O2 for 30 min.
DISCUSSION
The present study examined the relationship of CBF to MCA blood-flow velocity in normal young men breathing oxygen over an arterial PCO2 range of 25 to 50 mm Hg. Previously published comparisons of these blood-flow parameters were limited to smaller ranges of arterial PCO2 with only one or two different levels (Bishop et al., 1986; Sorteberg et al., 1989; Hartmann et al., 1991) and have yielded discordant results. In a study in which the measurement conditions included only normocapnia and hyperventilation hypocapnia, Hartmann et al. (1991) concluded that MCA blood-flow velocity correlated poorly with CBF. In contrast, Bishop et al. (1986) found a statistically significant correlation between concurrent responses of both flow parameters to inhalation of 5% CO2 in air, and Sorteberg et al (1989) found a similar positive correlation in normal subjects between sequential measurements of MCA blood-flow velocity and rCBF when the data were normalized to the same end-tidal PCO2. Sugimori et al. (1995) also observed that rCBF correlated significantly with MCA flow velocity in hypertensive and diabetic patients who had varying degrees of cerebrovascular disease.
Unique features of the present study are that it includes concurrent measurements of CBF and MCA blood-flow velocity in four different conditions, over a wide range of both increased and decreased levels of arterial PCO2, and in the same group of subjects. It is also the only such comparison at hyperoxic levels of arterial PO2. Previous investigators (Kety and Schmidt, 1948; Wasserman and Patterson, 1961) measured CBF in normal men over wide ranges of arterial PCO2 in an air background and found curves similar to that in Fig. 2, with a progressively increasing slope in the transition from hypocapnic to hypercapnic levels of arterial PCO2. Ramsay et al. (1993) also observed similar responses over a wide arterial PCO2 range for rCBF in both gray and white matter, with consistently steeper slopes in the gray matter.
Estimation of CBF from MCA blood-flow velocity
The parabolic flow-velocity relationship shown in Fig. 4 can be used to estimate CBF from values of mean MCA blood-flow velocity obtained under dynamic or steady-state conditions. The confidence limits about this estimate vary slightly with the absolute value of the mean velocity measurement and more prominently with respect to whether the velocity measurement represents an average value for a group of subjects or an individual value for one subject. For example, at an average velocity measurement of 42.8 cm/s, obtained during hyperventilation while breathing O2, the calculated CBF value is 26.9 ml/100 g/min with 95% confidence limits of ±3.4 ml/100 g/min. An identical velocity measurement for one subject would predict the same CBF value, but the 95% confidence limits would widen to ±11.4 ml/100 g/min. At an MCA blood-flow velocity of 94.2 cm/s, obtained while breathing 6% CO2 in O2, the calculated CBF value would be 62.4 ml/100 g/min with 95% confidence limits of ±3.8 ml/100 g/min for an average measurement in several subjects and ±11.5 ml/100 g/min for an individual measurement in one subject.
Relative changes in CBF and MCA blood-flow velocity during hypercapnia and hypocapnia in an oxygen background
Using as a baseline the measured values of CBF and flow velocity obtained while breathing 100% O2 at rest, percent changes in both parameters for each subject in the three remaining respiratory conditions are shown in Fig. 5. Percent changes in CBF exceeded corresponding velocity changes for all eight subjects at both of the increased levels of arterial PCO2. During exposure to hyperventilation hypocapnia, CBF percent decrements were smaller than velocity decrements in seven subjects, whereas both decrements were nearly equal in one subject. At increased levels of arterial PCO2, the larger CBF percent increments are consistent with MCA vasodilation in response to hypercapnia (Fig. 5). During exposure to hyperventilation hypocapnia, however, equivalent percent decrements in CBF and velocity would be expected if the MCA diameter remained constant, and CBF decrements would be relatively larger in the case of MCA vasoconstriction.
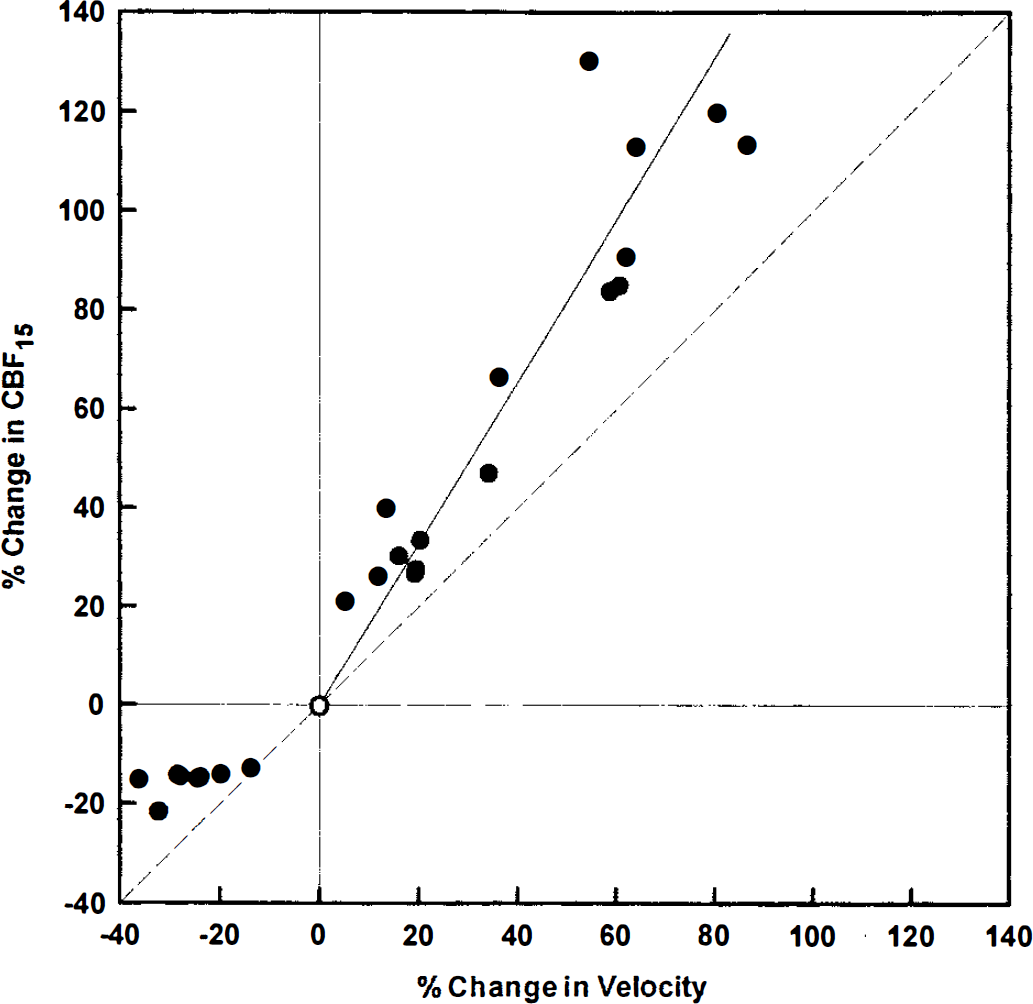
Individual relationships of percent change in CBF15 to percent change in middle cerebral artery blood-flow velocity. Values obtained while breathing 100% O2 at rest (open circles in Fig. 4) were used to calculate percent changes in CBF and blood-flow velocity (normalized values) for each subject in each of the three remaining conditions. The dashed diagonal represents the line of equal changes for both parameters. The solid line is a regression line through all 16 points obtained at increased levels of arterial PCO2 with the intercept set at zero. See text for equation of the line. Average percent changes in CBF are significantly larger than corresponding flow velocity changes at both increased levels of arterial PCO2, and are significantly smaller than percent changes in velocity during exposure to hyperventilation hypocapnia.
The observation that velocity percent decrements significantly exceeded corresponding CBF decrements during hyperventilation hypocapnia is consistent with earlier associations of cerebral vasodilation with extreme hypocapnic alkalosis (Wollman et al., 1968; Du Boulay and Symon, 1971). In three groups of patients who had undergone carotid angiography under general anesthesia, Du Boulay and Symon (1971) measured the diameters of major cerebral vessels under nearly identical conditions except for the level of controlled ventilation. Reducing arterial PCO2 from 45 to 29 mm Hg (corresponding to midportion of CBF curve in Fig. 2) caused the expected arterial vasoconstriction; however, further arterial PCO2 reduction to 21 mm Hg was associated with significant MCA vasodilation from 2.83 to 3.21 mm in diameter. This unexpected vasodilation during extreme hypocapnia was later confirmed in baboons under more tightly controlled conditions (Du Boulay and Symon, 1971). Wollman et al. (1968) also studied the CBF effects of extreme respiratory and metabolic alkalosis in anesthetized young men. Intravenous infusion of sodium bicarbonate with arterial PCO2 controlled at 19 mm Hg significantly increased CBF by 17% from the preinfusion hypocapnic control level. The mechanism for the paradoxical CBF effects of extreme alkalosis is not known (Wollman et al., 1968; Heistad and Kontos, 1983).
The relationship of MCA diameter to arterial PCO2 observed by Du Boulay and Symon (1971) can be used to examine the internal consistency of the relative changes in CBF and flow velocity found in the present study. With the aid of a regression equation that describes the stated relationship, MCA diameters of 3.08 and 3.29 mm, respectively, are obtained for the arterial PCO2 levels of 38.5 and 49.9 mm Hg from the present study (Table 1). Over the same range of arterial PCO2, MCA blood-flow velocity increased by an average value of about 63%, whereas CBF15 for the left MCA distribution more than doubled. These relative changes in flow velocity and volume are consistent with an 11% increment in MCA diameter. Starting from a baseline value of 3.08 mm, the calculated MCA diameter at an arterial PCO2 of 49.9 mm Hg is 3.42 mm, similar to the 3.29 mm value obtained from the data of Du Boulay and Symon. During hyperventilation to an arterial PCO2 of 25.3 mm Hg, the relative decrements in flow velocity and CBF15 of about 26 and 16%, respectively, are consistent with MCA vasodilation from a diameter of 3.08 to 3.28 mm, which also agrees favorably with the value of 3.21 mm obtained by Du Boulay and Symon at an average arterial PCO2 of 21.1 mmHg.
In contrast to the uncertainty regarding the relationship of CBF to arterial PCO2 during extreme hyperventilation hypocapnia, the CBF response to arterial hypercapnia is well defined (Kety and Schmidt, 1948; Heistad and Kontos, 1983). Using baseline values obtained in the present experiments while the subjects were breathing 100% O2 at rest, the relationship of percent change in CBF to percent change in blood-flow velocity for increased levels of arterial PCO2 is defined by a regression line (Fig. 5) with the following equation:

This equation, for which SEest is 12.6% and R2 is 0.92, should be used to estimate relative CBF increments from measured percent changes in MCA blood-flow velocity over an arterial PCO2 range of about 35 to at least 50 mm Hg. The useful range of this relationship should not be extended to more extreme levels of hypocapnia.
The curve shown in Fig. 4 represents CBF and flow-velocity data obtained over an arterial PCO2 range of 25 to 50 mm Hg. Empirically, the eight points obtained during hyperventilation hypocapnia lie close to the curve, and exclusion of these points has little effect on the terms of the parabola that describes the remaining 24 points. Therefore, the curve shown is considered to provide a useful analytical description of the CBF to flow velocity relationship over the entire range of arterial PCO2 that was studied.
Limitations of the current study
As stated previously, we did not measure CBF during air breathing in the present study, which proved to be a serious deficiency that complicated the evaluation of our CBF data obtained in an oxygen background. Our subjects had an average CBF15 of 32.1 ml/100 g/min during oxygen breathing at an arterial PCO2 of 38.5 mm Hg (Table 1). This value is significantly lower than the average CBF15 of 47.4 ± 4.6 ml/100 g/min (mean ± SD) measured by Obrist (personal communication, 1995) in a group of 42 young men under normoxic conditions at an average arterial PCO2 of 36.5 mm Hg. Although these comparative values are consistent with hyperoxic cerebral vasoconstriction, such an oxygen effect has not been established in the absence of concurrent changes in arterial PCO2. Previous measurements of CBF by the Kety-Schmidt N2O method under normoxic and hyperoxic conditions in the same subjects have shown average decrements ranging from 13 to 15% at 1.0 ATA (Lambertsen et al., 1953; Kety and Schmidt, 1948) to 25% at 3.5 ATA (Lambertsen et al., 1953), but these changes were associated with varying degrees of spontaneous hypocapnia. When arterial PCO2 was kept constant at average levels of either 45.0 or 24.4 mm Hg, breathing 80% O2 at 1.0 atmosphere did not change CBF from normoxic control values (Lambertsen, 1965). Using radioactive microspheres to measure CBF in awake ponies, Busija et al. (1980) also found that normocapnic hyperoxia did not change CBF from normoxic values.
Even in our subjects, direct measurements of MCA blood-flow velocity under both normoxic and hyperoxic conditions do not support an independent CBF reduction by hyperoxia apart from the influence of a concurrent decrease in arterial PCO2. Average MCA flow velocity during air breathing was 66.5 cm/s at an average arterial PCO2 of 42.1 mm Hg (Table 1). During O2 breathing, arterial PCO2 decreased to 38.5 mm Hg, and MCA flow velocity was significantly reduced by 12.6% to 58.1 cm/s. The observed velocity decrement can be explained entirely by the concurrent fall in arterial PCO2 without invoking an independent effect of hyperoxia.
It is possible that at least some of the apparently contradictory data with regard to an O2 effect on CBF may be explained by the use of different methods to assess cerebral circulatory parameters. The Kety-Schmidt N2O and 133Xe clearance methods use different diffusible molecules and measure different CBF properties (Young et al., 1995). In addition, the magnitude of a direct oxygen effect on CBF, if present, may vary at different levels of arterial PCO2 and may be masked at levels where CO2 effects are dominant. Comparative measurements of CBF15 under normoxic and hyperoxic conditions in the same subjects over an appropriate range of arterial PCO2 are required to resolve these uncertainties.
Applications and limitations of MCA blood-flow velocity as a CBF index
The data summarized in Fig. 4 indicate that MCA blood-flow velocity provides a useful index of CBF over a wide range of arterial PCO2 in a hyperoxic background. Transcranial Doppler ultrasonography does not require vascular punctures, immobilization of the subject, bulky instrumentation, or administration of radioactive isotopes. Therefore, it can be used under conditions that preclude the use of other methods that measure CBF directly. Furthermore, it is uniquely suitable for measuring rates of cerebral circulatory responses to abruptly imposed physiological or pharmacological stimuli.
With respect to baseline values measured while breathing 100% O2 at rest, our data are consistent with MCA vasodilation during exposure to both hypercapnia and extreme hyperventilation hypocapnia (Fig. 5). It cannot be assumed, however, that the specific relationships of CBF to MCA blood-flow velocity shown in Figs. 4 and 5 are fully applicable to other conditions, such as hypoxia or exercise, in which changes in MCA diameter might occur. Additional concurrent measurements of CBF and MCA blood-flow velocity under such conditions are required to determine the interrelationships of these parameters during exposure to physiological and pharmacological stimuli that differ significantly from those imposed in this study.
Footnotes
Abbreviations used
Acknowledgment:
We thank Dr. M. Reivich for making it possible to perform these studies in the Cerebral Blood Flow Laboratory of the Cerebrovascular Research Center at the University of Pennsylvania Medical Center. Dr. R. G. Eckenhoff provided key support by inserting the indwelling arterial catheters. E. Hopkin provided expert assistance with data processing and statistical analysis. J. Walker and R. Wiser provided technical support in the performance of CBF measurements by 133Xe clearance. We also thank Dr. W. D. Obrist for thoughtful discussions regarding data analysis and interpretation as well as for permission to cite his unpublished data. These experiments were supported in part by Naval Medical Research and Development Command contract N00014-92-J-1275 and NASA grant NAG 9–597, with analytic support from NASA grant NAGW 3628. All detailed results and analyses are maintained within the Environmental Biomedical Research Data Center, Institute for Environmental Medicine.