
Abstract
The cellular and molecular mechanisms of hypoxic/ischemic neurodegeneration are sensitive to numerous factors that modulate the time course and degree of neuronal death. Among such factors is hypothermia, which can dramatically protect neurons from injury. To examine and control for temperature-dependent effects, we developed a technique that provides for a high-throughput, accurate, and reproducible determination of the time course and degree of neurotoxicity in cultured cortical neurons at precisely defined temperatures. We used a fluorescence multiwell plate scanner, modified by us to permit the control of temperature, to perform serial quantitative measurements of propidium iodide (PI) fluorescence in cortical neuronal cultures exposed to excitotoxic insults. In validating this approach, we show that these time course measurements correlate highly with manual counts of PI-stained cells in the same cultures (r = 0.958, p < 0.0001) and with lactate dehydrogenase release (r = 0.964, p < 0.0001). This method represents an efficient approach to mechanistic and quantitative studies of cell death as well as a high-throughput technique for screening new neuroprotective therapies in vitro.
Recent years have seen a dramatic increase in our understanding of hypoxic/ischemic mechanisms. Much of this knowledge has arisen from in vitro studies in cultured neurons in which ischemia-like conditions are simulated using either anoxic/hypoglycemic conditions or the application of excitatory amino acids (Choi, 1988, 1990; Lipton and Rosenberg, 1994; Tymianski and Tator, 1996). This approach has helped to unveil some of the molecular mechanisms bridging the onset of an insult and the resultant neurodegeneration and has contributed to the development of several emerging treatments for stroke (Koroshetz and Moskowitz, 1996).
Many in vitro investigations of ischemic mechanisms consist of simple manipulations of cellular processes presumed to be associated with cell injury, usually by pharmacological means. Recently, it has also become widely appreciated that environmental manipulations, especially temperature, also significantly affect cell survival (Busto et al., 1987; Bruno et al., 1994). Evaluation of such manipulations of in vitro preparations exposed to ischemia-like condition requires a precise assessment of cell viability. Also, because the temporal features of cell death may vary, it is important to be able to accurately gauge the time course of cell death. For example, agonists of N-methyl-
Here we describe a high-throughput neurotoxicity assay for cultured neurons that takes into account the temperature sensitivity of neurodegeneration and the need to precisely assay cell viability and that incorporates the ability to monitor the time course of neuronal cell death as a cardinal feature. The utility of this approach is demonstrated in further reports in which it is used to characterize and study the protective and toxic effects of moderate and profound hypothermia on excitotoxicity (Tymianski et al., 1991a,b).
METHODS
Tissue culture
Dissociated cultures of cortical neurons were prepared using minor modifications of the method of Hertz et al. (1989). Cerebral neocortices from 15-day Swiss mouse embryos were dissected in phosphate-buffered saline (Gibco 10010-023), removing the hippocampal formation, olfactory bulbs, basal ganglia, and meninges. They were transferred to phosphate-buffered saline containing 0.05% trypsin/ethylenediaminetetraacetate (Gibco 25300-054) and incubated for 10 min at 37°C. Trypsin was inactivated by adding serum-containing growing medium (see later), and the tissue was dissociated by trituration with a fire-polished Pasteur pipetfe followed by centrifugation at 1,500 rpm for 10 min. The pellet was resuspended in culture medium, and a small aliquot was stained with fluorescein diacetate, a vital dye, to establish viable cell density by counting stained cells under fluorescence optics using a hemocytometer (Neubauer).
The cultures were plated on 24-well microtiter plates (Corning) that, a day prior, were coated overnight at 37°C with 15 mg/L poly-L-ornithine (dissolved in a 10 mM sodium tetraborate solution, adjusted to pH 8.4 with HCl), and then washed three times with sterile water. Prior to plating, the culture wells were coated at 37°C with incubation medium consisting of Eagle Minimal Essential Medium (Earle's salts; Gibco 041-0109) supplemented to contain 10% heat-inactivated horse serum (ICN 2921154; ICN Pharmaceuticals Canada Ltd., Montreal), 10% heat-inactivated fetal bovine serum (Gibco 26140-079), 2 mM glutamine, 25 mM glucose, and 26 mM NaHCO3, adjusted to pH 7.4.
The dissociated cells were plated in the precoated culture wells (15-mm diameter, 0.43 × 10⁶ cells/well in 0.5 ml medium) in a growing medium similar to the incubation medium but lacking fetal serum. Only 20 of 24 wells were plated with cells, leaving wells for background subtraction (see later). Cultures were maintained in a 100% humidified 5% CO2/95% air atmosphere at 36.5°C. At 4 days in vitro, they were treated with 5 μM uridine and 5 μM (+)-5-fluor-2′-deoxyuridine for 48 h to inhibit nonneuronal cell proliferation and were then shifted back to growing medium. Cultures were used for experiments after 12–16 days in vitro.
Drugs and solutions
Experiments were performed in serum-free physiological solution (control solution) containing (in mM): 121 NaCl, 5 KCl, 20
Instrumentation
Quantitative measurements of cell death were performed using a modified Cytofluor II fluorescence multiwell plate scanner (PerSeptive Biosystems, Framingham, MA, U.S.A.). Briefly, this is a software-controlled device in which the optical apparatus consists of a quartz halogen lamp (spectral range 320–700 nm), two six-position filter wheels (to filter excitation and emission wavelengths), and an R1527 Hamamatsu photomultiplier tube, all coupled via quartz optical fibers. The filter wheel is equipped with interference filters optimized for use with a given fluorescent probe. Presently, we used a filter combination aimed at exciting and recording PI fluorescence (530 ± 12.5-nm excitation, 620 ± 20-nm emission).
Modifications were made to the scanner to permit temperature control to within 0.2°C. The casing was altered to contain copious styrofoam insulation. Changes in temperature were achieved by mounting in the casing two modified thermoelectric heater/cooler assemblies taken from a cooler box (Igloo Cool-Mate, model 4502, Houston, TX, U.S.A.). These contained the thermoelectric devices, heat sinks, and fans. The fans thoroughly circulated the air within the device to produce a uniform temperature throughout the chamber housing the microtiter plates. The thermoelectric assemblies were powered by a precision bipolar thermoelectric controller (Power Puncher BP 120, max 8-W output; Alpha-Omega Instrument Corp., RI, U.S.A.) that permitted the temperature to be set and monitored. Monitoring was via a T-type thermistor placed at the level of the microtiter plate. A mercury lab thermometer was added to independently verify the accuracy of the temperature readings. Internal humidity was monitored with a household hygrometer and maintained above 65% using a water bath containing a humidifier sponge inside the scanner. This kept fluid evaporation at the higher temperatures (37°C) to <5% of the original culture well volume.
Experimental procedure
Experiments were performed near room temperature (23°C) as the cultures were shifted from the scanner to other areas within the same room for additional manipulations (see later). All manipulations were under sterile conditions. Typically, cultures were washed with 0.5 ml control solution containing 50 μg/ml PI, and a baseline fluorescence reading was taken. Subsequently, the solutions in each well were switched to contain a given concentration of L-glutamate, and additional PI fluorescence measurements were taken at 1-h intervals for 24 h. After this, the plates were removed from the scanner and were subjected to manual cell counting or to lactate dehydrogenase (LDH) efflux determinations (see later).
Raw PI fluorescence was background subtracted using measurements taken from wells devoid of cultures containing the experimental solution. PI fluorescence was unaffected by adding excitatory amino acids such as L-glutamate or by temperature changes (range tested 12–37°C). Fluorescence values in arbitrary units can be converted to the fraction of dead cells by normalizing them against the maximal backgrqund-subtracted PI fluorescence of identical cultures exposed to an insult killing 100% of cells (see Tymianski et al., 1997a, b ). For neuronal cultures, this is fraction dead = (Ft − F0)/FNMDA, where Ft is PI fluorescence at time t, F0 is initial PI fluorescence at time 0, and FNMDA is background-subtracted PI fluorescence of identical cultures from the same dissection and plating, 24 h after a 60-min exposure to 1 mM NMDA. This NMDA exposure routinely produced near complete neuronal death in each culture without effect on glia (also see Koh and Choi, 1987; Bruno et al., 1994; David et al., 1996).
Manual counts of PI-labeled neurons
At the end of some experiments, the plates containing PI-labeled cells were transferred to a Nikon Diaphot microscope equipped with epifluorescence optics and viewed through a ×20 lens (Nikon CF UV-F; 20×) using a Rhodamine filter cube (Nikon G-2A). Three microscope fields were chosen at random from each culture well and were photographed using a video camera (Hamamatsu C2400, Hamamatsu Japan) interfaced to a digital image analysis software package (Image-1/AT; Universal Imaging Corp., West Chester, PA, U.S.A.). The numbers of PI-labeled cells were counted manually from each digital micrograph. This approach was chosen over direct observation through the microscope eyepieces to minimize the possibility that phototoxicity due to prolonged exposure to incident excitation light would alter the number of dead cells in a given well. A second observer replicated all manual counts to ensure count accuracy and minimal interobserver variability (<5%).
Measurements of LDH release
In some experiments, PI fluorescence and LDH efflux measurements were compared at 24 h as described elsewhere (Koh and Choi, 1987), using a commercially available colorimetric assay (Boehringer Mannheim 1 664 793). Cell death was expressed as the percentage of LDH activity produced by the maximal glutamate exposure (1 mM for 24 h) in cultures within the same microtiter plate.
Data analysis
Custom software was used to transform the raw fluorescence data into display-ready data and to perform simple statistical analyses on groups of cultures as defined by the user. Further data analysis and display, including linear regression analysis, were performed using the Sigma-Stat and Sigma Plot software packages (Jandel Scientific, San Rafael, CA, U.S.A.). All means are shown with their standard deviations.
RESULTS
Performance of temperature control modification
The scanner was modified (see Methods) for temperature control in the range of 12–37°C. Upon changing the temperature setting, the measured temperature at the level of the culture plate oscillated about the set temperature and stabilized within 1–3 h (Fig. 1). All experiments were thus performed at least 3 h after any changes were made to the temperature settings.
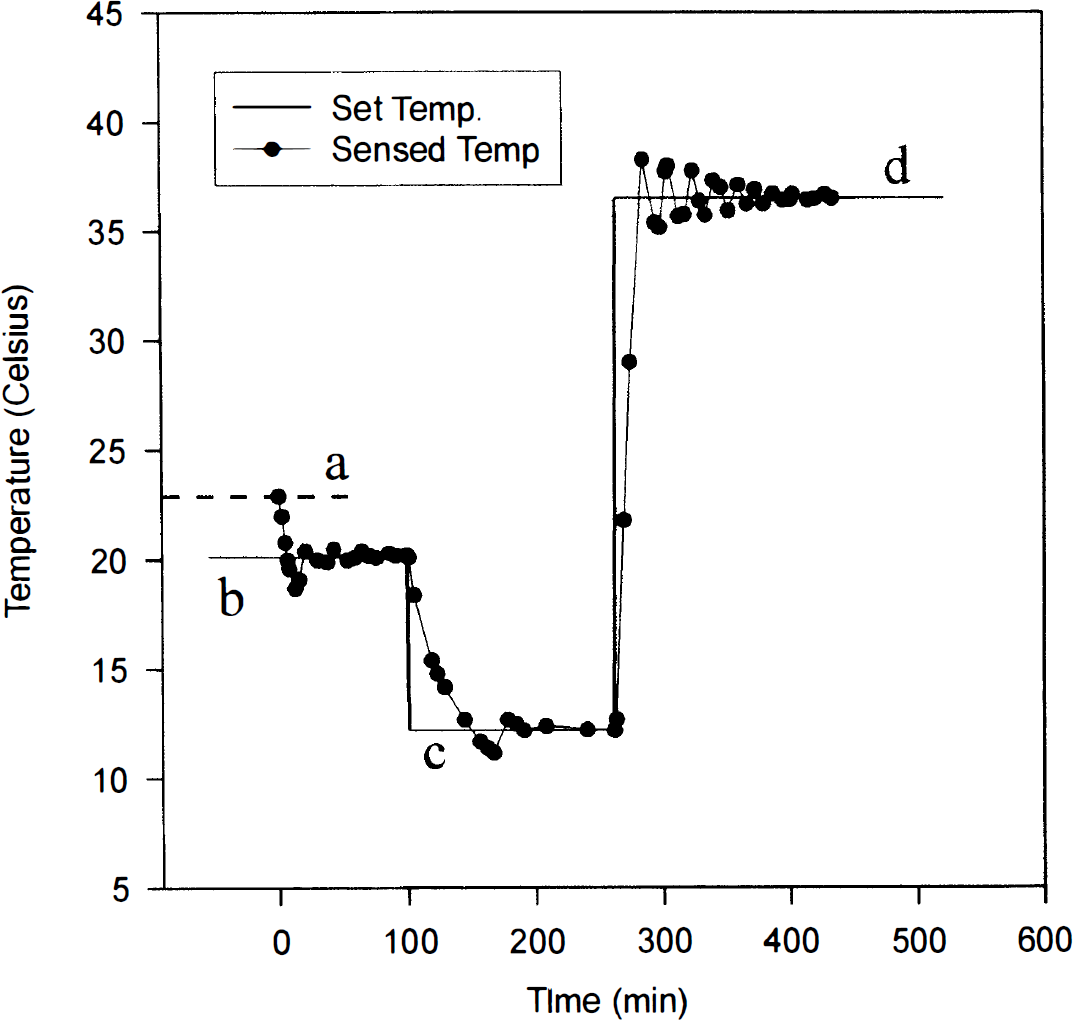
Performance of the temperature control modification of the multiwell plate fluorescence scanner in the range of 12–37°C. Actual temperature was sensed in the scanner interior at the level of the multiwell plate. The scanner temperature was initially at room temperature (
Cultures exposed to L-glutamate undergo early swelling followed by cell death
The morphological changes accompanying the application of excitotoxins to cultured cortical neurons are well described (Rothman, 1985; Choi, 1987; Choi et al., 1987). Neurons exposed to 100 μM L-glutamate, for example, undergo cell swelling as a consequence of an early influx of Na+ and Cl– and the accompanying shifts in water content (Fig. 2, t = 1 h). Over the ensuing hours, Ca2+ influx through glutamate receptor channels contributes to a loss of cell membrane integrity and subsequent cell lysis (Fig. 2, t = 6–24 h). The sequence of events illustrated here is typical for this type of preparation and underlies the rationale for using a marker of cell membrane integrity (PI) as an index of cell death.
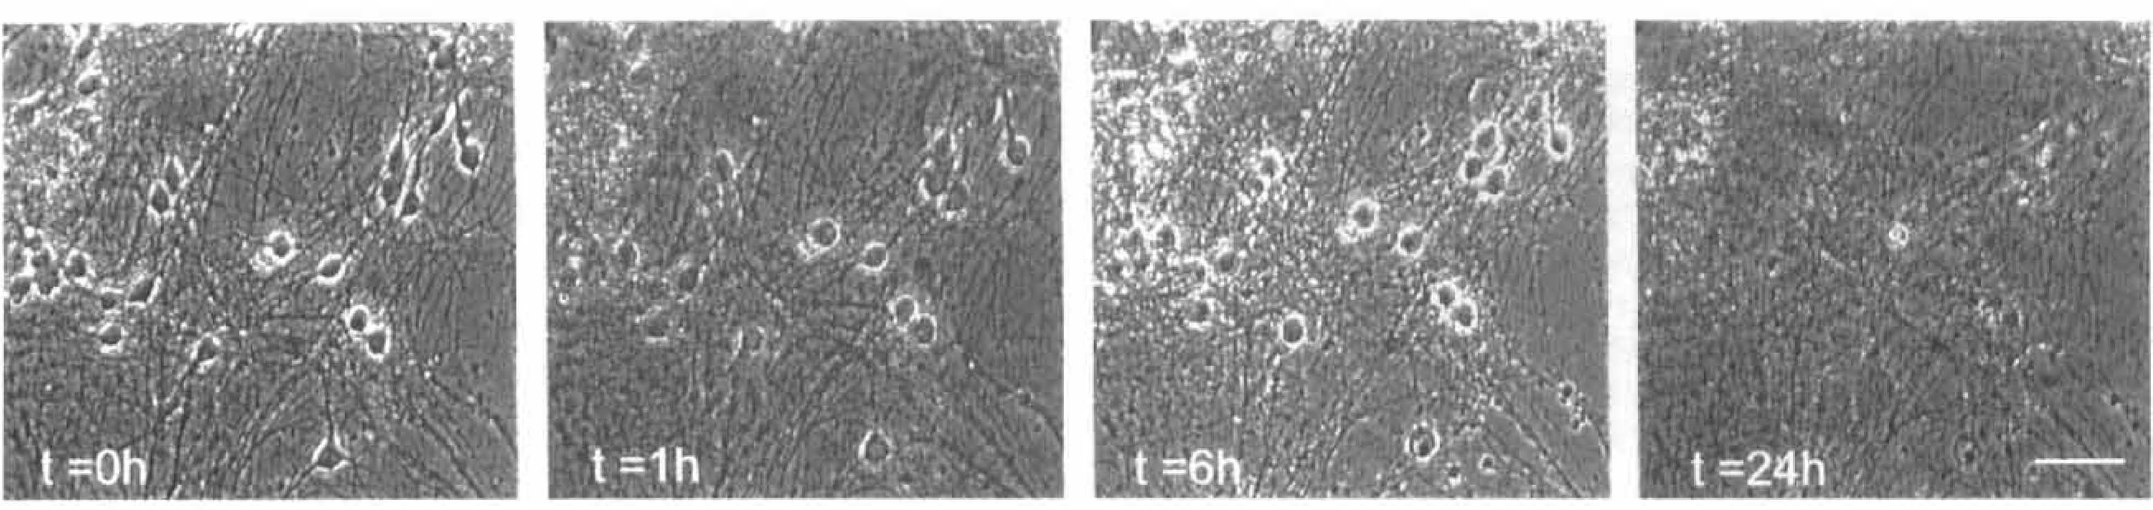
Transmitted light image (phase contrast) of cortical neuronal cultures exposed to excitatory amino acids. The pictures were taken at times 0, 1, 6, and 24 h following the application of 100 μM L-glutamate. The neurons undergo early neuronal swelling shortly after the insult and suffer a loss of cell membrane integrity and lysis by 24 h. Scale bar = 50 μm.
PI fluorescence increases with time and with magnitude of glutamate challenge
Pilot experiments revealed a minimal well-to-well variability in neuronal density. Therefore, entire concentration–response curves could be obtained in a single experiment by varying the concentration of L-glutamate between culture wells. In the representative experiment in Fig. 3A, PI fluorescence increased with time and reached, within ∼12 h, a plateau that paralleled the magnitude of the glutamate challenge. Note that 50 μg/ml PI had no adverse effects as this was easily tolerated by control cultures (Fig. 3A, curve a).
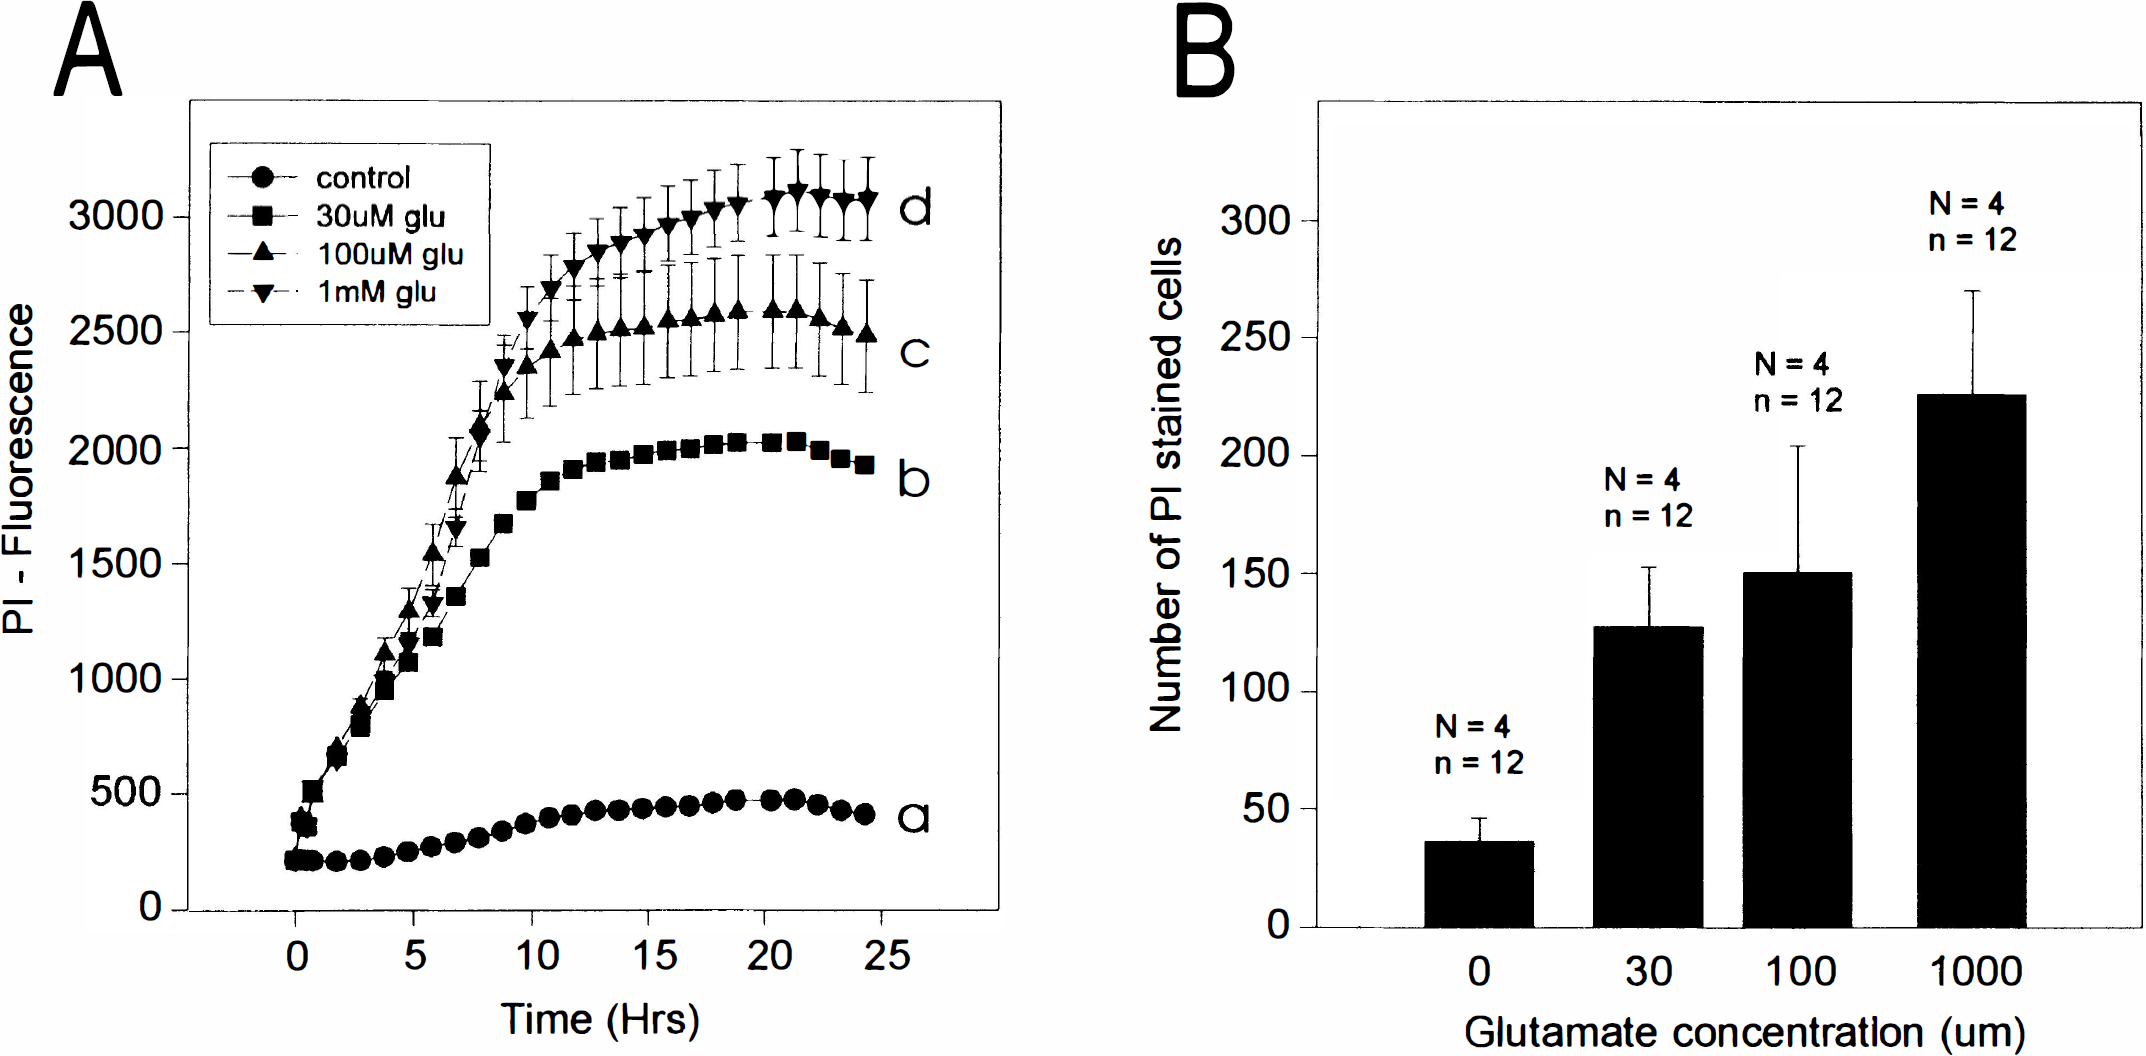
Representative measurement of the time course and extent of cell death in cultured cortical neurons using the multiwell plate fluorescence scanner. (
PI fluorescence intensity measurements using multiwell plate fluorescence scanner correlate highly with manual counts of PI-stained neurons
Manual counts of PI-stained neurons (see Methods) were performed in the cultures after the 24 h of PI fluorescence measurements (Fig. 3B, same plate as A). Dead neurons were easily visualized using conventional fluorescence optics (Fig. 4). There was a strong linear relationship between the manual cell counts and PI fluorescence measurements as performed by the scanner (Fig. 5) (r = 0.958, p < 0.0001; data pooled from 14 separate experiments using cultures from different dissections).
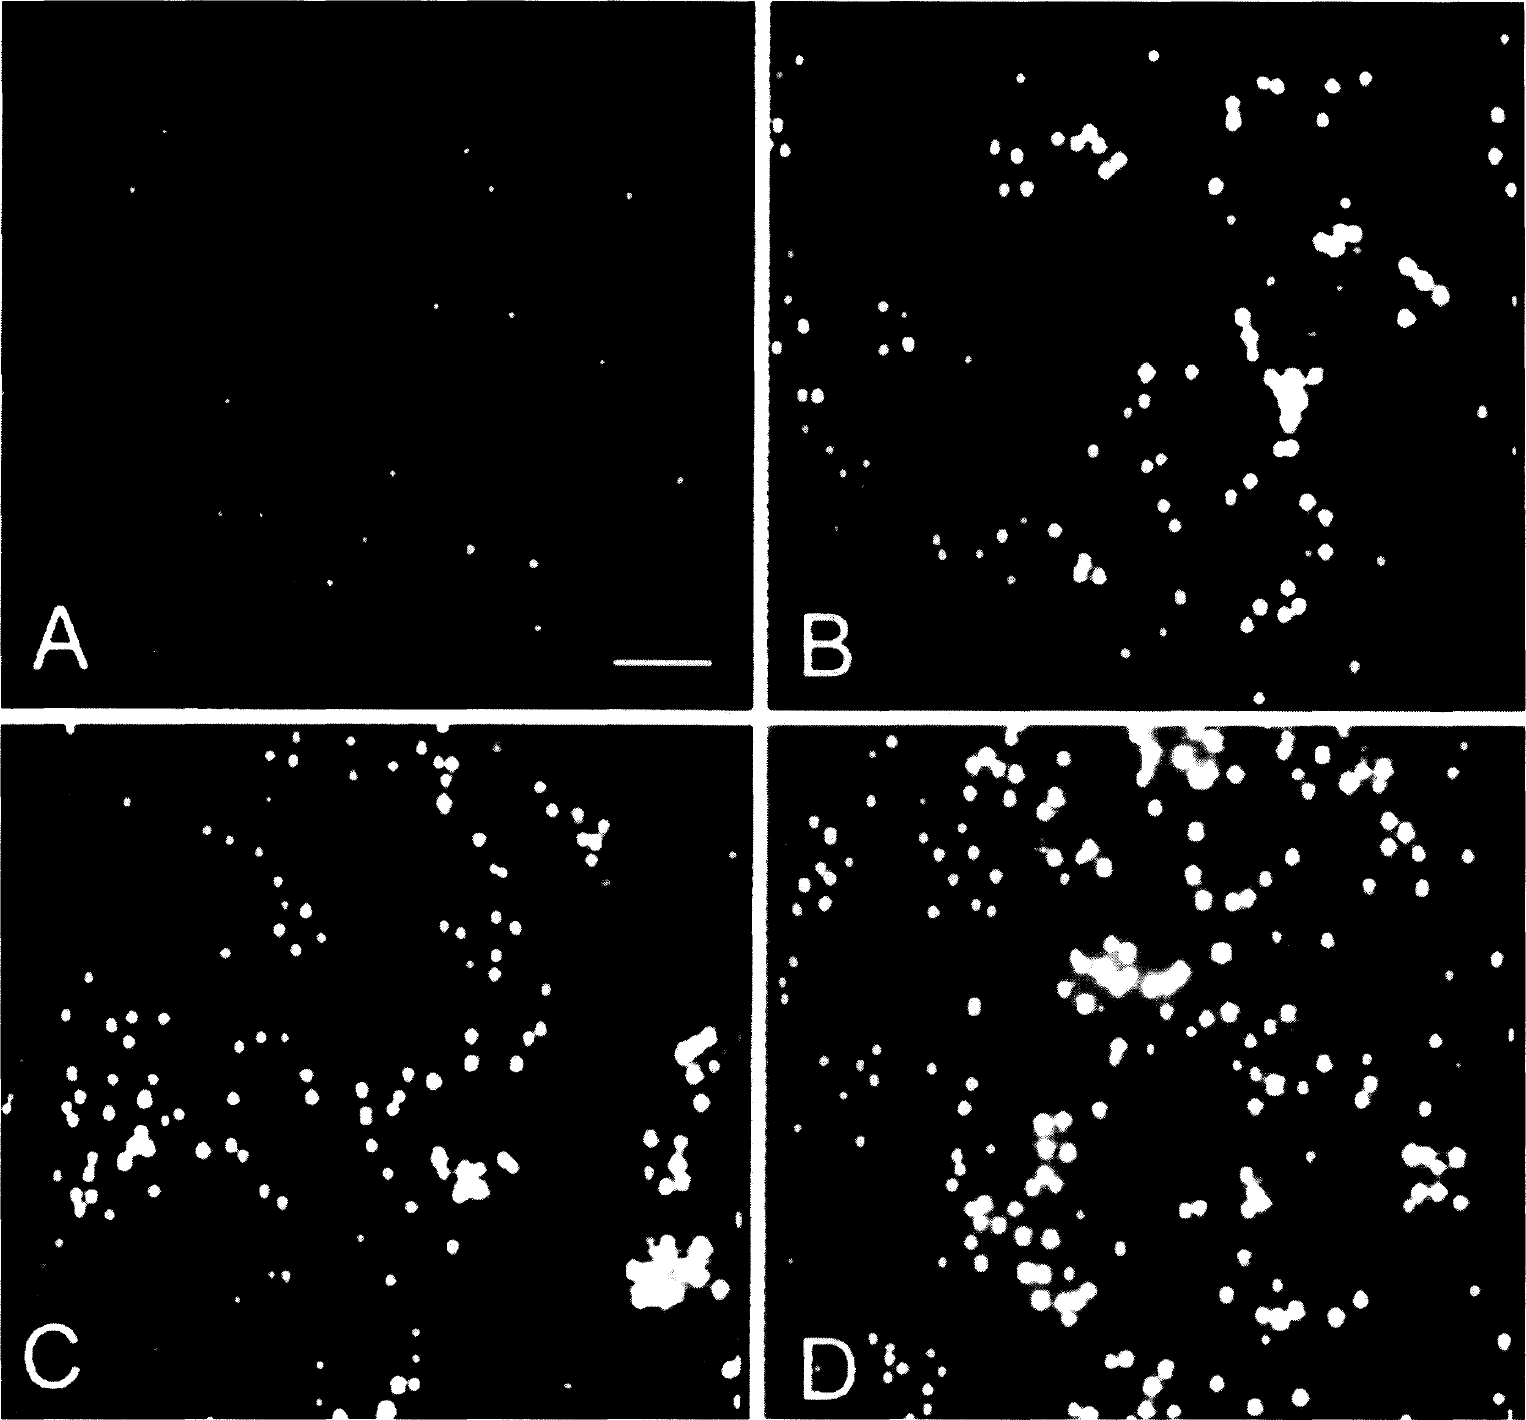
Images of propidium iodide-labeled neurons from the experiment shown in Fig. 3. These were among the fields photographed after the 24-h exposure to glutamate and were used to perform the cell counts as shown in Fig. 3B. Each panel (A–D) corresponds to the times shown in Fig. 3A (a–d). (
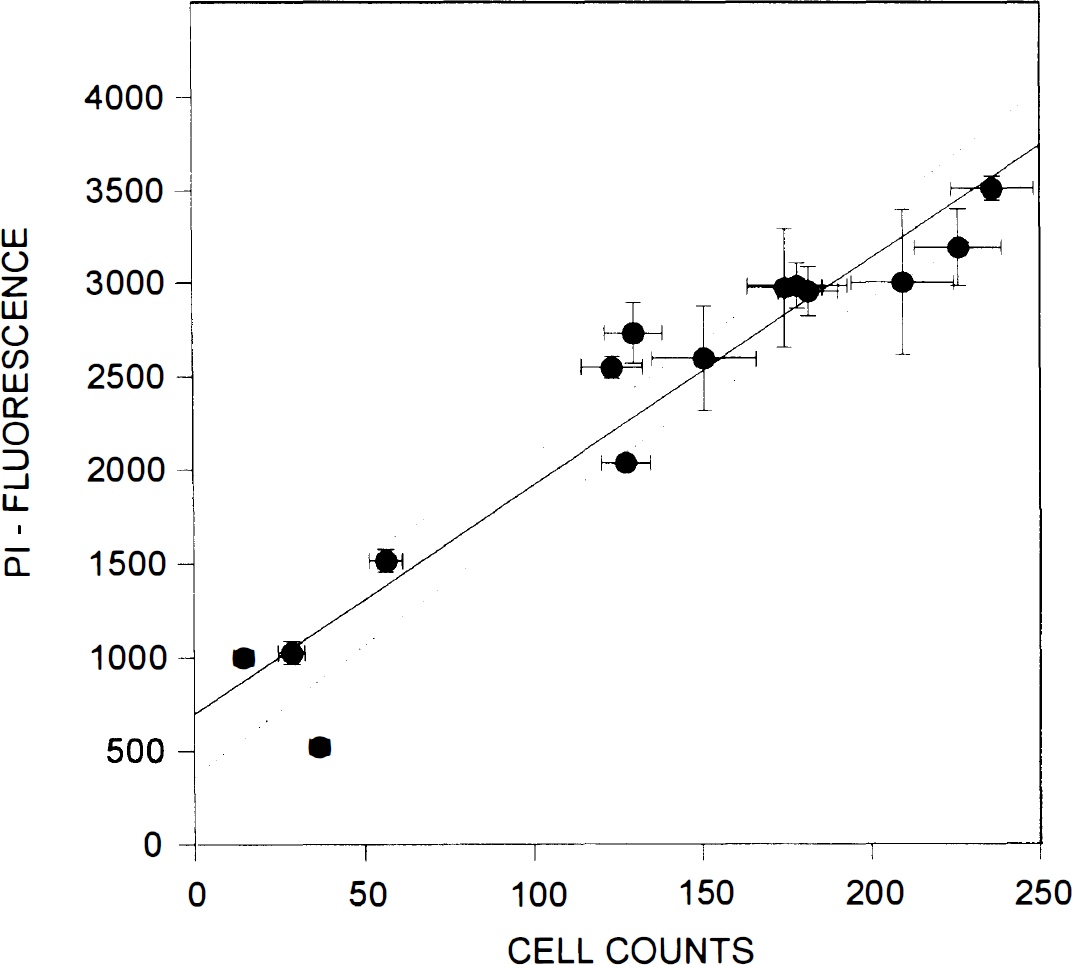
Relationship between propidium iodide (PI) fluorescence labeling as measured by the multiwell plate reader and manual cell counts. Each symbol represents the mean PI fluorescence intensity value measured in a given glutamate exposure group, plotted against the mean cell count in the same group (from 12 microscope fields in four cultures). Means are shown with their standard deviations. The solid and dotted lines show the best-fit curve and its 95% confidence interval, respectively. There was a high correlation and a linear relationship between the number of dead cells (PI labeled) and the measured fluorescence (PI fluorescence = 699.6 + 12.2 × cell counts; r = 0.958, p < 0.0001).
PI fluorescence intensity measurements using multiwell plate fluorescence scanner correlate highly with LDH release
LDH release is commonly employed as indicator of cell death in neurotoxicity studies (Koh and Choi, 1987). To compare the present approach with LDH measurements, the relative quantity of LDH release was determined (see Methods) in the same cultures subjected to 24 h of sequential PI fluorescence measurements in the scanner. Figure 6A shows a representative experiment in which the two methods were compared (results expressed as percentage of peak value for each method). Like PI fluorescence intensity, LDH release also increased in a glutamate concentration-dependent fashion (Fig. 6A). There was a high correlation between the two methods of cell death determination (Fig. 6B) (data pooled from four separate experiments; r = 0.964, p < 0.0001).
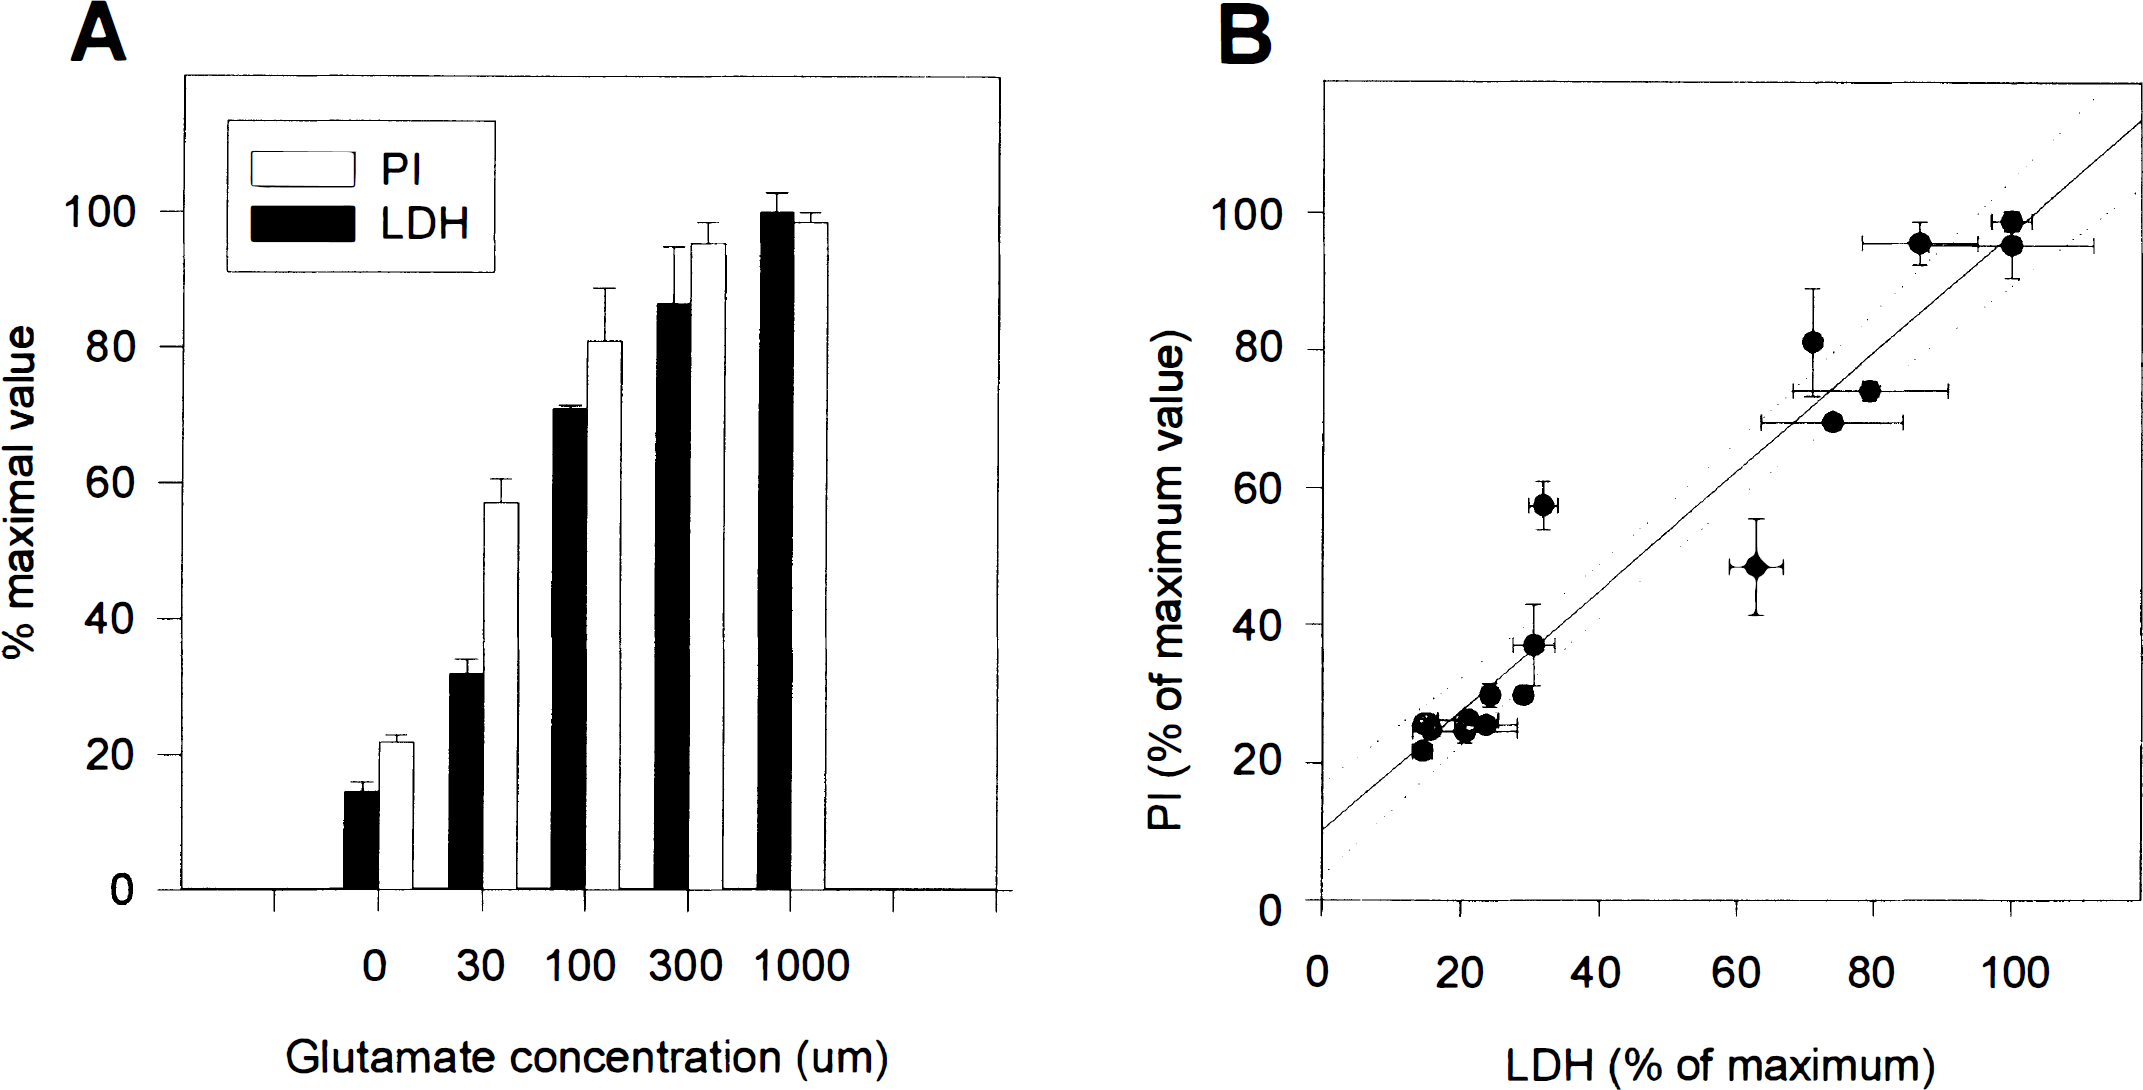
Propidium iodide (PI) fluorescence labeling, as measured by the multiwell plate fluorescence scanner, correlates highly with lactate dehydrogenase (LDH) release. Fluorescence and LDH release measurements were taken after a 24-h exposure of neurons to varying concentrations of glutamate (0,1,000 μM). Measurements for each assay were normalized to their respective peak values. (
DISCUSSION
The present assay provides a means to perform cytotoxocity experiments at precisely controlled temperatures, takes into account the temperature sensitivity of excitotoxic phenomena, and provides the ability to study with precision the time course of cell death, which may vary with different insults. The results obtained correlate highly with manual techniques (Figs. 3–5) and with other recognized approaches to measuring cytotoxicity (LDH efflux) (Fig. 6). This method should have wide applicability to cell types other than neurons with minimal or no modification.
Approaches to cell death determination
Assays of subcellular component function, metabolism, and integrity.
Cell death may be preceded by damage to intracellular components such as mitochondria and/or lysosomal stores. Thus, cell viability has been equated with the maintenance of the mitochondrial membrane potential (Graham et al., 1990; Nieminen et al., 1990; Rahn et al., 1991), the activity of mitochondrial enzymes (Mosmann, 1983; Funa et al., 1986; Marks et al., 1992), or lysosomal integrity (Borenfreund and Puerner, 1985; Lowik et al., 1993; Modha et al., 1993). However, such measurements do not reflect damage to the plasma membrane itself and may, in some instances, indicate a reversible state rather than the onset of cell death (Lemasters et al., 1987; Bronk and Gores, 1991; Nieminen et al., 1992).
Physiologic measures.
Electrophysiologic measurements of cell membrane potential may indicate cell death in some preparations (Scharfman and Schwartzkroin, 1989). Also, measurements of the ability to maintain intracellular calcium homeostasis have been correlated with impending cell death (Tsien, 1981; Randall and Thayer, 1992; Tymianski et al., 1993a). However, these approaches are labor intensive and difficult to apply on a large scale.
Measures of vital marker retention.
Many tests of plasma membrane integrity are based on the ability of cells to retain a preloaded vital marker. Commonly used indicators include 51Cr (Kroesen et al., 1992), fluorescein diacetate (Hutz et al., 1985; Gray and Morris, 1987; Bell et al., 1988), bis-carboxyethyl-carboxyfluorescein (Kolber et al., 1988; Sellers et al., 1994), or calcein/AM (Moore et al., 1990). A drawback of these is that they can be actively extruded from cells. Thus, their intracellular concentration could vary dramatically over long assay periods as used in the present report. The extrusion rate is usually also temperature dependent, making these markers less useful when changes in temperature are a factor. These indicators, however, remain useful as determinants of cell viability at a single time point and are widely employed in neuronal cells for this purpose.
LDH is an endogenous enzyme released from cells upon membrane lysis (Jauregui et al., 1981; Korzeniewski and Callewaert, 1983; Koh and Choi, 1987). The time course of cell death can be studied through sequential determinations of LDH activity in small aliquots taken from the culture medium. However, this may introduce inaccuracies in successive measurements. Also, LDH activity may degrade with time, with a half-life that can vary with the cell type, from the loss of a few percent to over half of LDH activity within a 12-h period (Marc et al., 1991).
Measures of vital marker exclusion.
Also commonly employed, these assays rely on the ability of intact cell membranes to exclude large polar molecules such as trypan blue (Formby et al., 1986; Tymianski et al., 1993a, b ), erythrosin B (Krause et al., 1984), ethidium compounds (Bohmer, 1985; Dey and Majumder, 1988; Beletsky and Umanski, 1990; MacCoubrey et al., 1990; Moore et al., 1990; Facchinetti et al., 1991), cyanine dyes (Becker et al., 1994), and PI (Tanke et al., 1982; Jones and Senft, 1985; Coco-Martin et al., 1992; Kroesen et al., 1992; Dengler et al., 1995). Interestingly, these different compounds occasionally produce differences in the time course of positive staining. For example, cultured spinal neurons exposed to lethal excitotoxic challenges stain with trypan blue 15–40 min before staining with ethidium homodimer (Tymianski et al., 1993a).
The vital marker exclusion strategy has the advantage over vital dye retention that it is unaffected by healthy cells. Fluorescent vital markers such as PI, which increases its fluorescence upon entering cells and binding to DNA, and thus ideal for quantitative determination of cell death. PI and other DNA-binding dyes are relatively resistant to photobleaching and are therefore amenable to repeated photoexcitation over prolonged periods as was done in the present report. Furthermore, these compounds are generally nontoxic to the cells over a period of many hours to days. Finally, fluorescent probes such as PI, when applied in correct quantities, provide for an excellent signal-to-noise ratio when measured in a multiwell plate scanner as described.
Advantages of present approach
Some advantages of using PI to assay cell viability have been already discussed. Other probes having different fluorescence properties could likely be used with similar success. However, there are several additional advantages to the present approach.
The use of a multiwell plate scanner permits a significant degree of automation, thereby removing any subjective element from the assessment of cell death. For this reason, this technique produces little variability among results obtained by different operators. The method is simple and is therefore easily learned by technical staff. Automation also results in large quantities of accurate and reproducible data being obtained, which is a time- and cost-effective advantage over labor-intensive manual cell-counting techniques. No manipulations of the cultures are needed to obtain sequential measurements. Thus, the culture plate can be kept in an enclosed space throughout the experiment, which permitted us to modify the scanner to control the inside temperature. This would have been more difficult if repeated access to the cultures were necessary.
Among the most significant scientific advantages of the current approach is that it can be easily adapted to the study of physiological processes other than cell death. For example, in the accompanying report (Tymianski et al., 1997b), we used the apparatus to measure the mitochondrial production of reactive oxygen species using the oxidation-sensitive probe dihydrorhodamine-123. The multiwell plate scanner used here is equipped with the ability to switch between several excitation and emission wavelengths within the same measurement cycle. The apparatus is thus especially amenable to studies combining the use of two or more fluorescent probes in the same cultures or in sister cultures within the same plate. Thus, studies are currently ongoing in our laboratory to examine simultaneously changes in cytoplasmic calcium concentration using fluorescent Ca2+ indicators and cell death with fluorescent vital stains.
Footnotes
Acknowledgment:
R.S. is a student of the National Centers of Excellence of Canada. M.T. is a clinician–scientist of the Medical Research Council of Canada. Portions of this work were funded by an Ontario Technology Fund Grant in collaboration with Allelix Biopharmaceuticals to M.T. and by a grant from the German Ministry of Science and Technology (BEO 0319520B) to M.H.