
Abstract
To monitor stroke-induced brain damage and assess neuroprotective therapies, specific imaging of cell death after cerebral ischemia in a noninvasive manner is highly desirable. Annexin A5 has been suggested as a marker for imaging cell death under various disease conditions including stroke. In this study, C57BL6/N mice received middle cerebral artery occlusion (MCAO) and were injected intravenously with either active or inactive Cy5.5-annexin A5 48 hours after reperfusion. Some mice also received propidium iodide (PI), a cell integrity marker. Only in mice receiving active Cy5.5-annexin A5 were fluorescence intensities significantly higher over the hemisphere ipsilateral to MCAO than on the contralateral side. This was detected noninvasively and ex vivo 4 and 8 hours after injection. The majority of cells positive for fluorescent annexin A5 were also positive for PI and fragmented DNA as detected by terminal deoxynucleotidyl transferase-mediated 2'-deoxyuridine 5'-triphosphate-biotin nick end labeling (TUNEL) staining. This study demonstrates the high specificity of annexin A5 for visualization of cell death in a mouse model of stroke. To our knowledge, this is the first study to compare the distribution of injected active and inactive annexin A5, PI, and TUNEL staining. It provides important information on the experimental and potential clinical applications of annexin A5-based imaging agents in stroke.
Introduction
Specific visualization of cell death with noninvasive imaging techniques is highly relevant in basic research and there is great hope that it will translate for the use in humans. It has been shown that imaging agents specifically targeting dead cells can be used to monitor treatment response in cancer (Blankenberg, 2008b), to localize tissue damage in myocardial infarction (Wolters et al, 2007), and to identify vulnerable plaques in atherosclerosis (Laufer et al, 2009). In cerebral ischemia, a decrease or arrest of regional blood flow leads to damage of neurons and other brain cells. Cells in the core of the infarcted area might not be salvageable, but cells in the periinfarct region, the so-called ischemic penumbra, which can only be approximated by using positron emission tomography (PET) or magnetic resonance imaging (MRI) techniques (Heckl, 2007), might be rescued (Dirnagl et al, 1999; Harraz et al, 2008). As cell death is a basic pathophysiological feature in cerebral ischemia, specific noninvasive imaging of this process would be highly desirable for monitoring stroke-induced brain damage and assessing neuroprotective therapies. To date, no clinically approved technique enables the specific visualization of cells in stroke with an imaging agent specifically targeting dead or lethally damaged cells.
To envisage cell death-related parameters ex vivo, different staining methods can be applied. Most commonly, in situ terminal deoxynucleotidyl transferase-mediated 2'-deoxyuridine 5'-triphosphate-biotin nick end labeling (TUNEL staining), which detects fragmented DNA, and fluorescent dyes such as propidium iodide (PI; 668.4 Da, red fluorescent), are used. As PI cannot penetrate the membrane of viable cells, it only stains cells with compromised plasma membrane integrity (Loo and Rillema, 1998; Moore et al, 1998). For noninvasive visualization of cell death, imaging agents based on small molecule caspase inhibitors or annexin A5 have been developed (Faust et al, 2009). Annexin A5 is an endogenous protein with a molecular weight of about 36 kDa that binds tightly and specifically to phosphatidylserine (PS) and other anionic phospholipids. In normal cells, PS is restricted to the inner surface of the cell membrane. The exposure of PS occurs during apoptosis and necrosis (Galluzzi et al, 2009; Kroemer et al, 2009), therefore, making it a suitable target for specific imaging of cell death with annexin A5 (Blankenberg, 2008a).
For imaging purposes, annexin A5 can be labeled with different signal molecules including radioactive isotopes for single photon emission computed tomography (SPECT) or PET (Blankenberg, 2008a), fluorochromes for near-infrared fluorescence (NIRF) (Schellenberger et al, 2004b), nanoparticles for MRI (Schellenberger et al, 2002; van Tilborg et al, 2010) or magneto-optical particles detectable for both optical and MR imaging (Schellenberger et al, 2004a; Sosnovik et al, 2005). Imaging agents based on annexin A5 have been applied successfully in a variety of disease models and in patients suffering from different diseases including cancer (Belhocine et al, 2002; Petrovsky et al, 2003), myocardial infarction and ischemia (Dumont et al, 2001; Hofstra et al, 2000; Thimister et al, 2003), and atherosclerosis (Kietselaer et al, 2004; Kolodgie et al, 2003). Blankenberg and colleagues were the first to use an imaging agent based on annexin A5 for the noninvasive visualization of cell death in cerebral ischemia. They injected annexin A5 labeled with 99mTc intravenously into patients with acute ischemic stroke. Subsequent SPECT imaging showed foci of increased tracer uptake at sites of ischemic injury. In the same study, the authors demonstrated that annexin A5 imaging can assess the effects of therapy for ischemic cerebral injury in rats. They concluded that radiolabeled annexin A5 and SPECT imaging might be used as a noninvasive indicator of drug efficacy in clinical trials (Blankenberg et al, 2006). Similar results in patients with acute stroke were observed by another group (Lorberboym et al, 2006). Tang et al (2007) demonstrated that 99mTc-labeled annexin A5 and SPECT imaging can be used to monitor the antiapoptotic effects of minocycline therapy in a mouse model of focal cerebral ischemia.
The use of targeted imaging agents may involve several confounders such as unspecific binding or issues of compartmentalization, particularly when the blood—brain barrier (BBB) breaks down in the disease process. To our knowledge, there are no data that compare the distribution of systemically administered active annexin A5 with that of inactive annexin A5. The latter has no binding properties to PS and can therefore be used as a control for unspecific distribution. Furthermore, there are no data at the histological level on how annexin A5 binding compares to other markers of cell death such as uptake of PI and TUNEL staining on a single cell level in focal cerebral ischemia. To address this, we intravenously injected active or inactive annexin A5, both labeled with the NIRF-dye Cy5.5, together with PI into mice after transient middle cerebral artery occlusion (MCAO). Noninvasive in vivo and ex vivo NIRF imaging were performed and tissue sections were prepared. After fluorescence inspection of Cy5.5 and PI, we stained the same sections with TUNEL and finally with hematoxylin and eosin (HE). In this study, we present important information on the usefulness of annexin A5 imaging in cerebral ischemia, especially its specificity in imaging lethally damaged or dead cells.
Materials and methods
Preparation of Near-Infrared Fluorescence-Labeled Annexin A5
Recombinant human annexin A5 (from C Reutelingsperger) was labeled with Cy5.5 (Cy5.5-N-hydroxysuccinimide ester, PA 15601, Amersham Biosciences, Buckinghamshire, UK) as described (Schellenberger et al, 2004b). Briefly, active annexin A5 with retained affinity for PS was prepared by labeling annexin A5 with about one mole of dye per mole of protein. Inactive annexin A5 with a complete loss of affinity for PS was prepared with two moles or more of Cy5.5 per mole of protein (Schellenberger et al, 2004b).
Animals and Model of Focal Cerebral Ischemia
Twenty-one adult male C57BL6/N mice (Bundesinstitut fuer Risikoforschung, Berlin, Germany) weighing between 18 and 20 g were housed under standard conditions with free access to food and water. All procedures were in accordance with the German animal welfare laws and approved under the animal research license G0229/05. Focal cerebral ischemia was induced by transient occlusion of the MCA with the intraluminal filament technique as previously described (Hara et al, 1996). Mice were anesthetized with isoflurane in 70% N2O and 30% O2. The left common and external carotid arteries were isolated and ligated. A microvascular clip was placed on the internal carotid artery. An 8-0 nylon monofilament (Suprama, Berlin, Germany) coated with silicon resin (Heraeus Kulzer, Hanau, Germany) was introduced through a small incision in the common carotid artery and advanced to a position 9 mm distal from the carotid bifurcation for occlusion of the MCA. Rectal temperature was controlled and kept constant at 36.5°C ± 0.5°C by means of a feedback temperature control unit. After 1 hour, the monofilament was removed under isoflurane anesthesia to allow reperfusion of the MCA. The internal carotid artery was then ligated and the skin incision was closed.
Application of Fluorescent Annexin A5 and Propidium Iodide
Both annexin A5 preparations were diluted to a volume of 150 μL in saline and 7nmol of Cy5.5/mouse (inactive annexin A5: about 0.1 mg of protein; active annexin A5: about 0.3 mg of protein) were injected intravenously into the tail vein 48 hours after MCAO. Eight mice were injected with inactive annexin A5 and NIRF imaging was performed 4 hours (n = 5) or 8 hours (n = 3) postinjection. Three of the mice imaged 4 hours after injection of inactive annexin A5 were also injected with PI (Molecular Probes, Eugene, OR, USA; 20 mg/kg body weight, diluted in 150 μL saline). Thirteen mice received active annexin A5 and NIRF imaging was performed 4 hours (n = 8) or 8 hours (n = 5) postinjection. Three of the mice imaged 4 hours after active annexin A5 injection were also injected with PI.
Near-Infrared Fluorescence Imaging Protocol
Before NIRF imaging, the mice were anesthetized by intraperitoneal injection of a 5% chloralhydrate solution (200 mg/kg; Merck, Darmstadt, Germany) and the skin overlying the parietal cortex was depilated. For NIRF imaging, we used a system developed by our group, which we recently described in detail (Klohs et al, 2006). The system enables noninvasive detection of amounts of Cy5.5 dye as low as 10−12 mol located deep in the brain of adult pigmented mice. For NIRF imaging of Cy5.5 (absorption maximum at 675 nm, emission maximum at 694 nm), we applied the fluorescence reflectance imaging mode with the light source for illumination and the detector both on the same side of the object. The animal's head was illuminated with a laser (applied power: 40 mW, wavelength: 682 nm). Fluorescence emission was captured with a charge-coupled device camera equipped with two 710 nm interference filters to block excitation light. Data acquisition time was 60 seconds for noninvasive in vivo NIRF imaging and between 30 and 60 seconds for ex vivo NIRF imaging of the brains removed from the skull and the 1 mm brain slices, respectively.
Data Processing and Analysis of the Near-Infrared Fluorescence Images
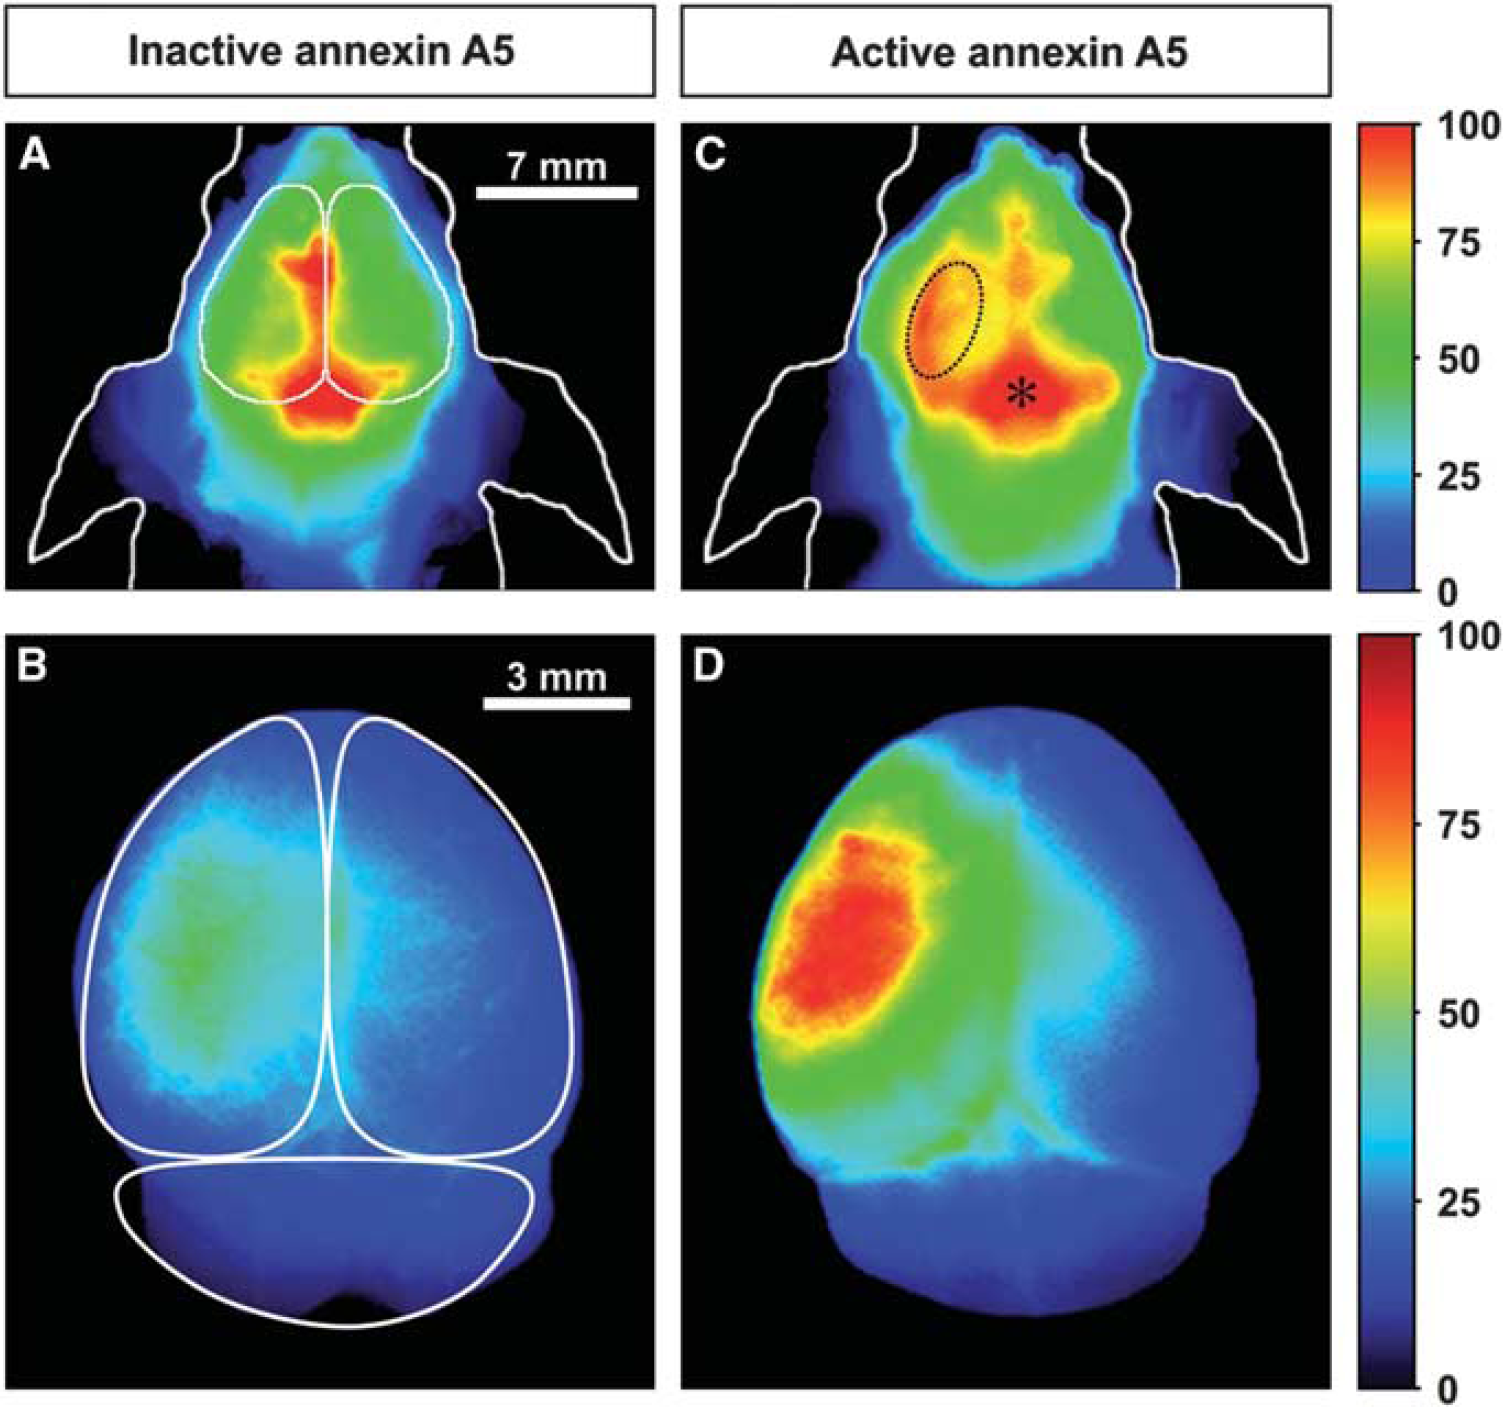
Data were processed and analyzed as described previously (Klohs et al, 2006). This included normalization, correction for illumination inhomogeneities, and subtraction of superficial fluorescence from dust or photons from cosmic rays. Region of interest (ROI) analysis was performed with the normalized noninvasive NIRF images by manually selecting anatomically defined ROIs over the right and left hemispheres of the mice (outlined in Figure 1A). The average fluorescence intensity of all pixels within the ROI was calculated. Target-to-background ratios (TBRs) were calculated by dividing the ROI values from the left hemisphere by the ROI values from the right hemisphere. For statistical comparison of the TBR, an unpaired Student's t-test was used. P-values below 0.05 were considered significant.
Noninvasive near-infrared fluorescence (NIRF) images of the heads of middle cerebral artery occlusion (MCAO) mice (
Infarct Staining with Triphenyl Tetrazolium Chloride
The brains of the mice that did not receive PI underwent infarct staining with triphenyl tetrazolium chloride (TTC). After noninvasive and ex vivo NIRF imaging, 1 mm coronal brain slices were cut in a brain matrix using a razor blade. After NIRF imaging, the slices were then incubated in a 2% TTC solution (Sigma-Aldrich, Hamburg, Germany) at 37°C for 30 minutes. In viable brain tissue, TTC is converted by mitochondria to appear red in color, while the ischemic area remains colorless. Digital photographs of the TTC-stained slices were taken for documentation.
Histology and Microscopy
The brains of mice that received PI underwent histology and microscopy. After noninvasive and ex vivo NIRF imaging, the brains were snap-frozen in 2-methylbutane at −40°C and stored at −80°C until sectioning. The brain tissue was cut in 20 μm coronal cryostat sections taken between bregma 1.6 to −1.3 mm. The sections were first examined by fluorescence microscopy using a Leica DMRA microscope (Leica Microsystems, Heidelberg, Germany) equipped with a nitrogen-cooled charge-coupled device camera (Vers Array 512B, Roper Scientific Inc., Duluth, GA, USA) and appropriate filters for Cy5.5, PI, and FITC detection. The sections were then stained using a TUNEL Kit (TUNEL stain, ApopTag Fluorescein In Situ Apoptosis Detection Kit, Chemicon International, Temecula, CA, USA). A second fluorescence microscopy was performed, and finally, the sections were stained with HE and examined with the microscope equipped with a digital camera (DC200, Leica Microsystems). The percentage of cells in the ischemic area (striatum and cortex) that showed no labeling/staining and the number of cells positive for annexin A5 and/or PI, and/or TUNEL staining were calculated by examining three sections from each mouse.
Results
Noninvasive Near-Infrared Fluorescence Imaging and Ex Vivo Near-Infrared Fluorescence Imaging of the Brains
NIRF imaging was performed 4 and 8 hours after intravenous injection of either Cy5.5-labeled active or inactive annexin A5. Injections were performed in MCAO mice 48 hours after reperfusion. In Figure 1, noninvasive NIRF images of the heads of MCAO mice and respective ex vivo NIRF images of the brains removed from the skull 4 hours postinjection of either fluorescent labeled inactive or active annexin A5 are shown. At both time points, no differences were seen between the hemispheres on the noninvasive NIRF images in mice injected with inactive annexin A5, but mice injected with active annexin A5 showed higher fluorescence intensities over the ischemic hemisphere than over the contralateral side. The images of the brains removed from the skull showed slightly higher fluorescence intensities over the ipsilateral compared with the contralateral hemisphere after injection of inactive annexin A5. However, only after injection of active annexin A5 was the fluorescence intensity considerably higher over the ischemic hemisphere than over the contralateral side. Figure 2 shows the TBRs calculated from noninvasive NIRF images for inactive and active annexin A5 at both time points. MCAO mice that received active annexin A5 showed significantly higher TBR at 4 and 8 hours postinjection than the mice that received inactive annexin A5, respectively (1.16 ± 0.07 versus 1.02 ± 0.02 at 4 hours, P = 0.002; 1.18 ± 0.08 versus 1.01 ± 0.01 at 8 hours, P = 0.008).
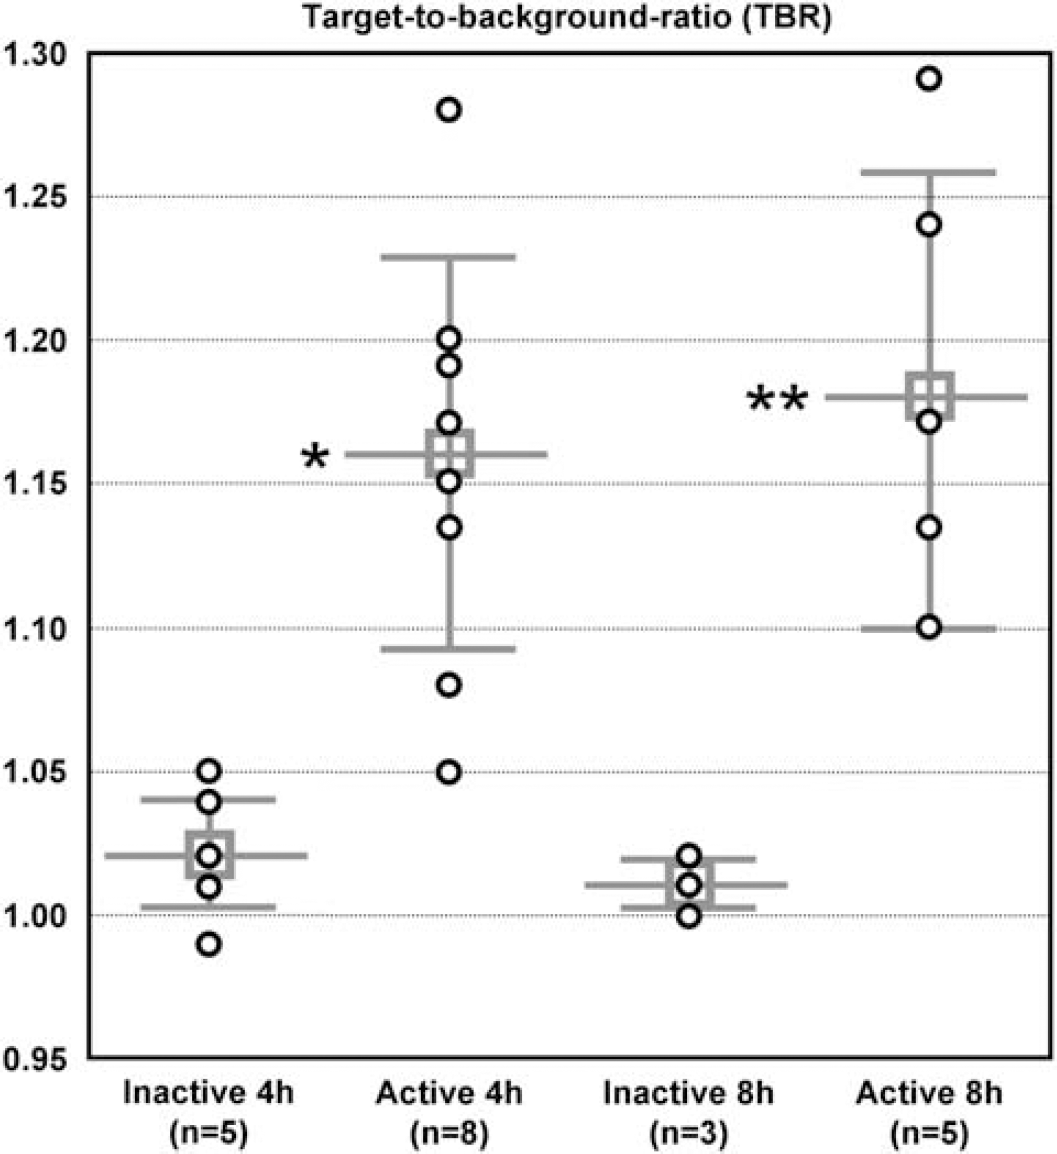
Target-to-background ratios (TBRs) calculated from noninvasive near-infrared fluorescence (NIRF) images 4 and 8 hours after intravenous injection of either fluorescent labeled inactive or active annexin A5. TBR's were calculated by dividing the average fluorescence intensity of all pixels within the region of interest (ROI) of the left hemisphere by the values from the right hemisphere. The TBR for each individual mouse and the means ± s.d. are given. Middle cerebral artery occlusion (MCAO) mice that received active annexin A5 showed significantly higher TBR 4 and 8 hours postinjection compared with mice that received inactive annexin A5 (Student's t-test, *P = 0.002, **P = 0.008).
Near-Infrared Fluorescence Imaging of the Brain Slices and Triphenyl Tetrazolium Chloride Staining
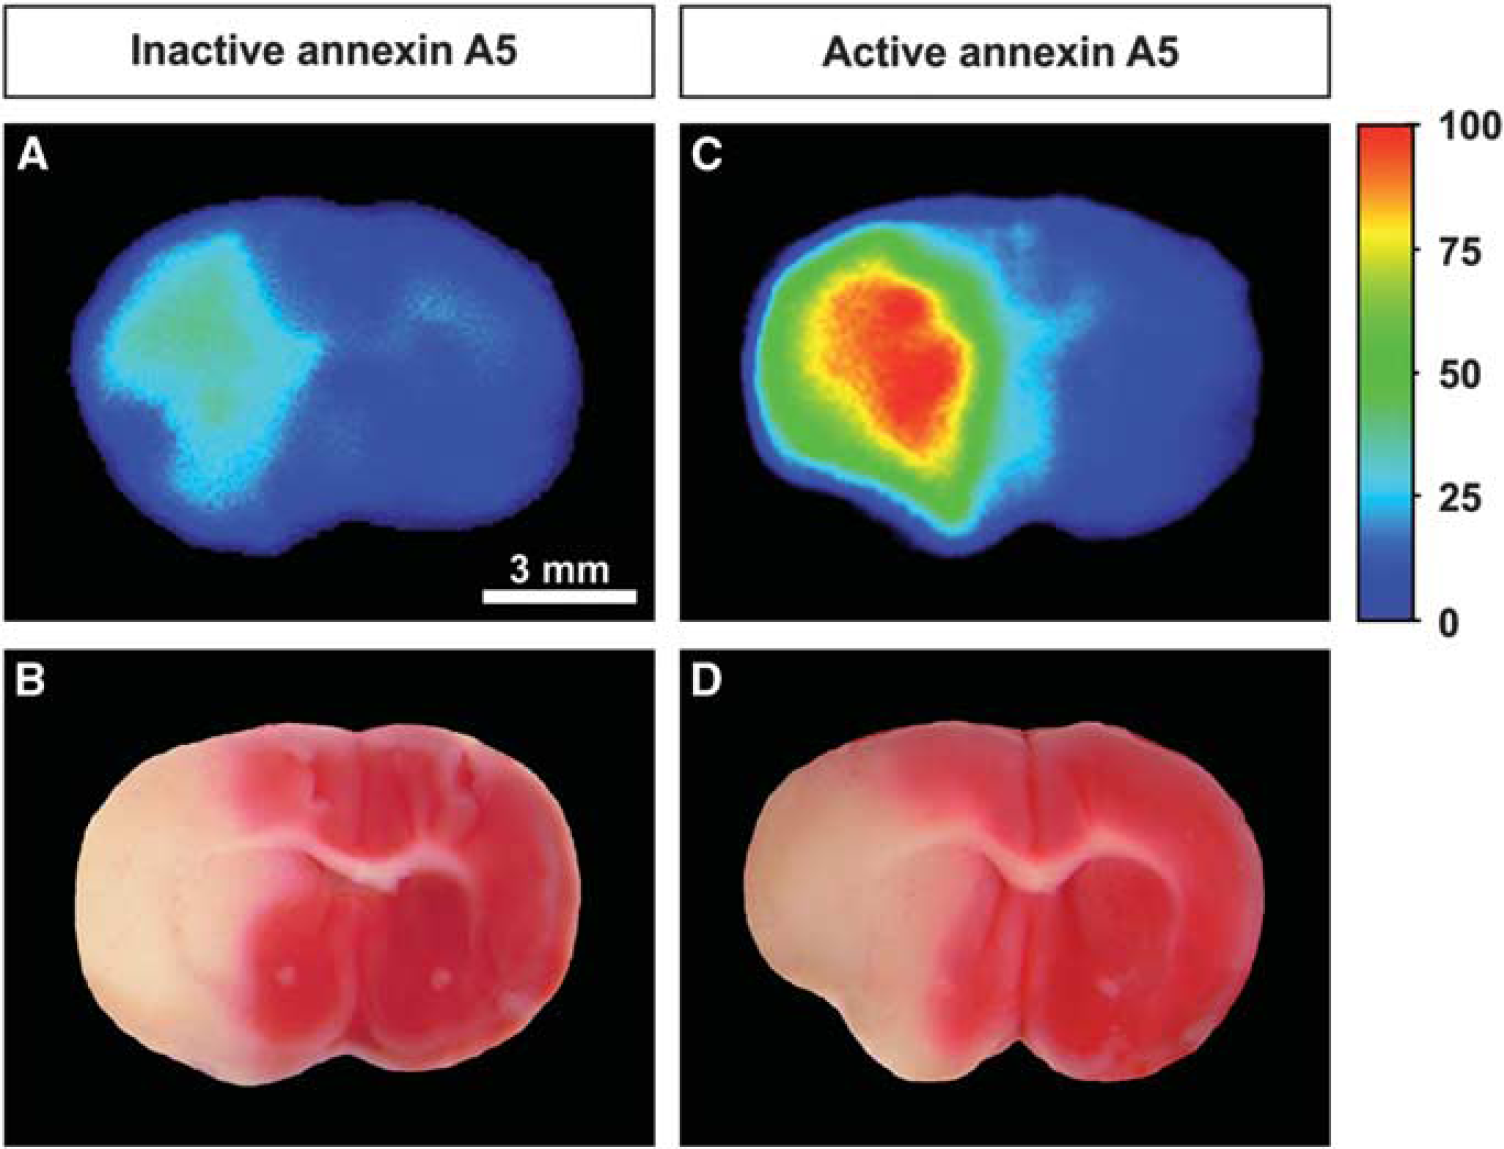
After noninvasive and ex vivo NIRF imaging, 1 mm coronal brain sections were obtained and NIRF imaging of the sections was performed. Immediately afterwards, the sections were incubated with TTC for demarcation of the lesion. Figure 3 shows NIRF images of brain sections before and after TTC staining 4 hours postinjection of either fluorescent inactive or active annexin A5. At both time points, areas with high fluorescence intensities closely corresponding with the TTC staining were observed in mice that had received active and inactive annexin A5. Lower fluorescence intensities over the infarct region were seen in animals injected with inactive annexin A5 compared with the mice that received active annexin A5.
Ex vivo near-infrared fluorescence (NIRF) images of coronal brain slices (
Fluorescence Microscopy
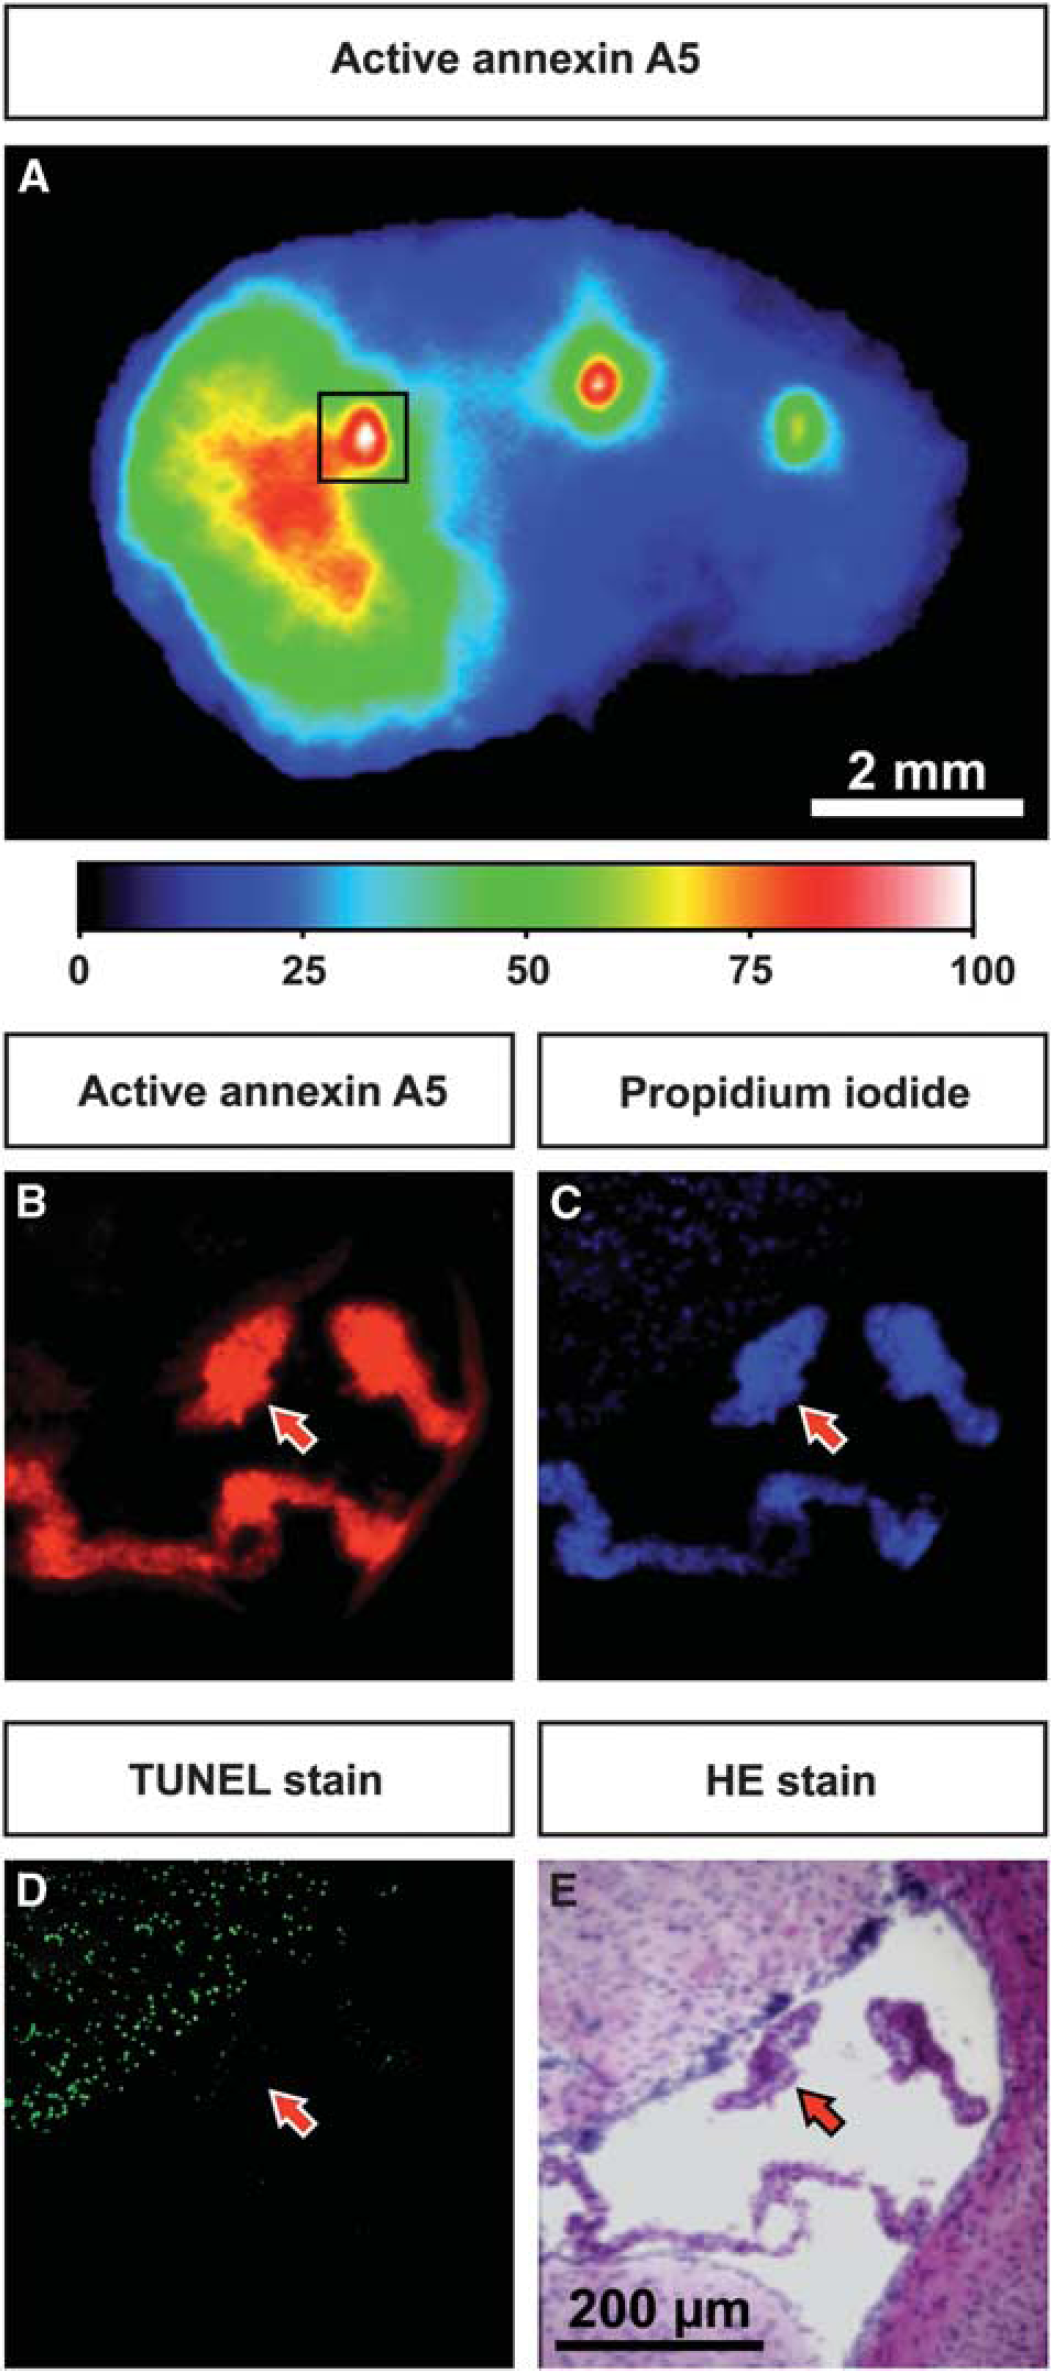
After examining the 1-mm brain sections with NIRF imaging, we realized that a strong signal in the area of the ventricles was observed at both time points in all mice. The same was observed in the 20-μm sections. Figure 4A depicts a 20 μm brain section 4 hours after injection of active annexin A5, with high fluorescent intensities in the ischemic region and even stronger fluorescence signals in the ventricles. Figures 4B−4E show microscopic images of a tissue section, also 4 hours after injection of active annexin A5 and from the same area demarcated on the NIRF image in Figure 4A. In the infarcted area (upper left), strong fluorescence signals from injected active annexin A5 and injected PI were detected and the majority of the cells were positive for TUNEL staining. In contrast, the noninfarcted regions showed no fluorescence from injected annexin A5 and PI and a negligible number of cells were TUNEL-positive. The highest fluorescence intensities from active annexin A5 and PI were located in the choroid plexus in the ventricles, whereas only a few cells in this tissue were TUNEL-positive.
Ex vivo near-infrared fluorescence (NIRF) image of a brain slice showing the distribution of active annexin A5 (
Figure 5 shows microscopic images of 20 μm tissue sections 4 hours after injection of either inactive annexin A5 or active annexin A5 and PI. The sections were subsequently stained with TUNEL and then with HE. Larger vessels showed high fluorescence intensities after injection of inactive and active annexin A5. Only in mice that received active annexin A5, but not in those injected with inactive annexin A5, were high fluorescence signals detected in cells of the ischemic area. Most cells positive for active annexin A5 were also PI- and TUNEL-positive. Also of note, annexin A5, PI as well as TUNEL staining were found in the whole infarct area and delineated the infarct area similar to what can be seen on the HE-stained section.
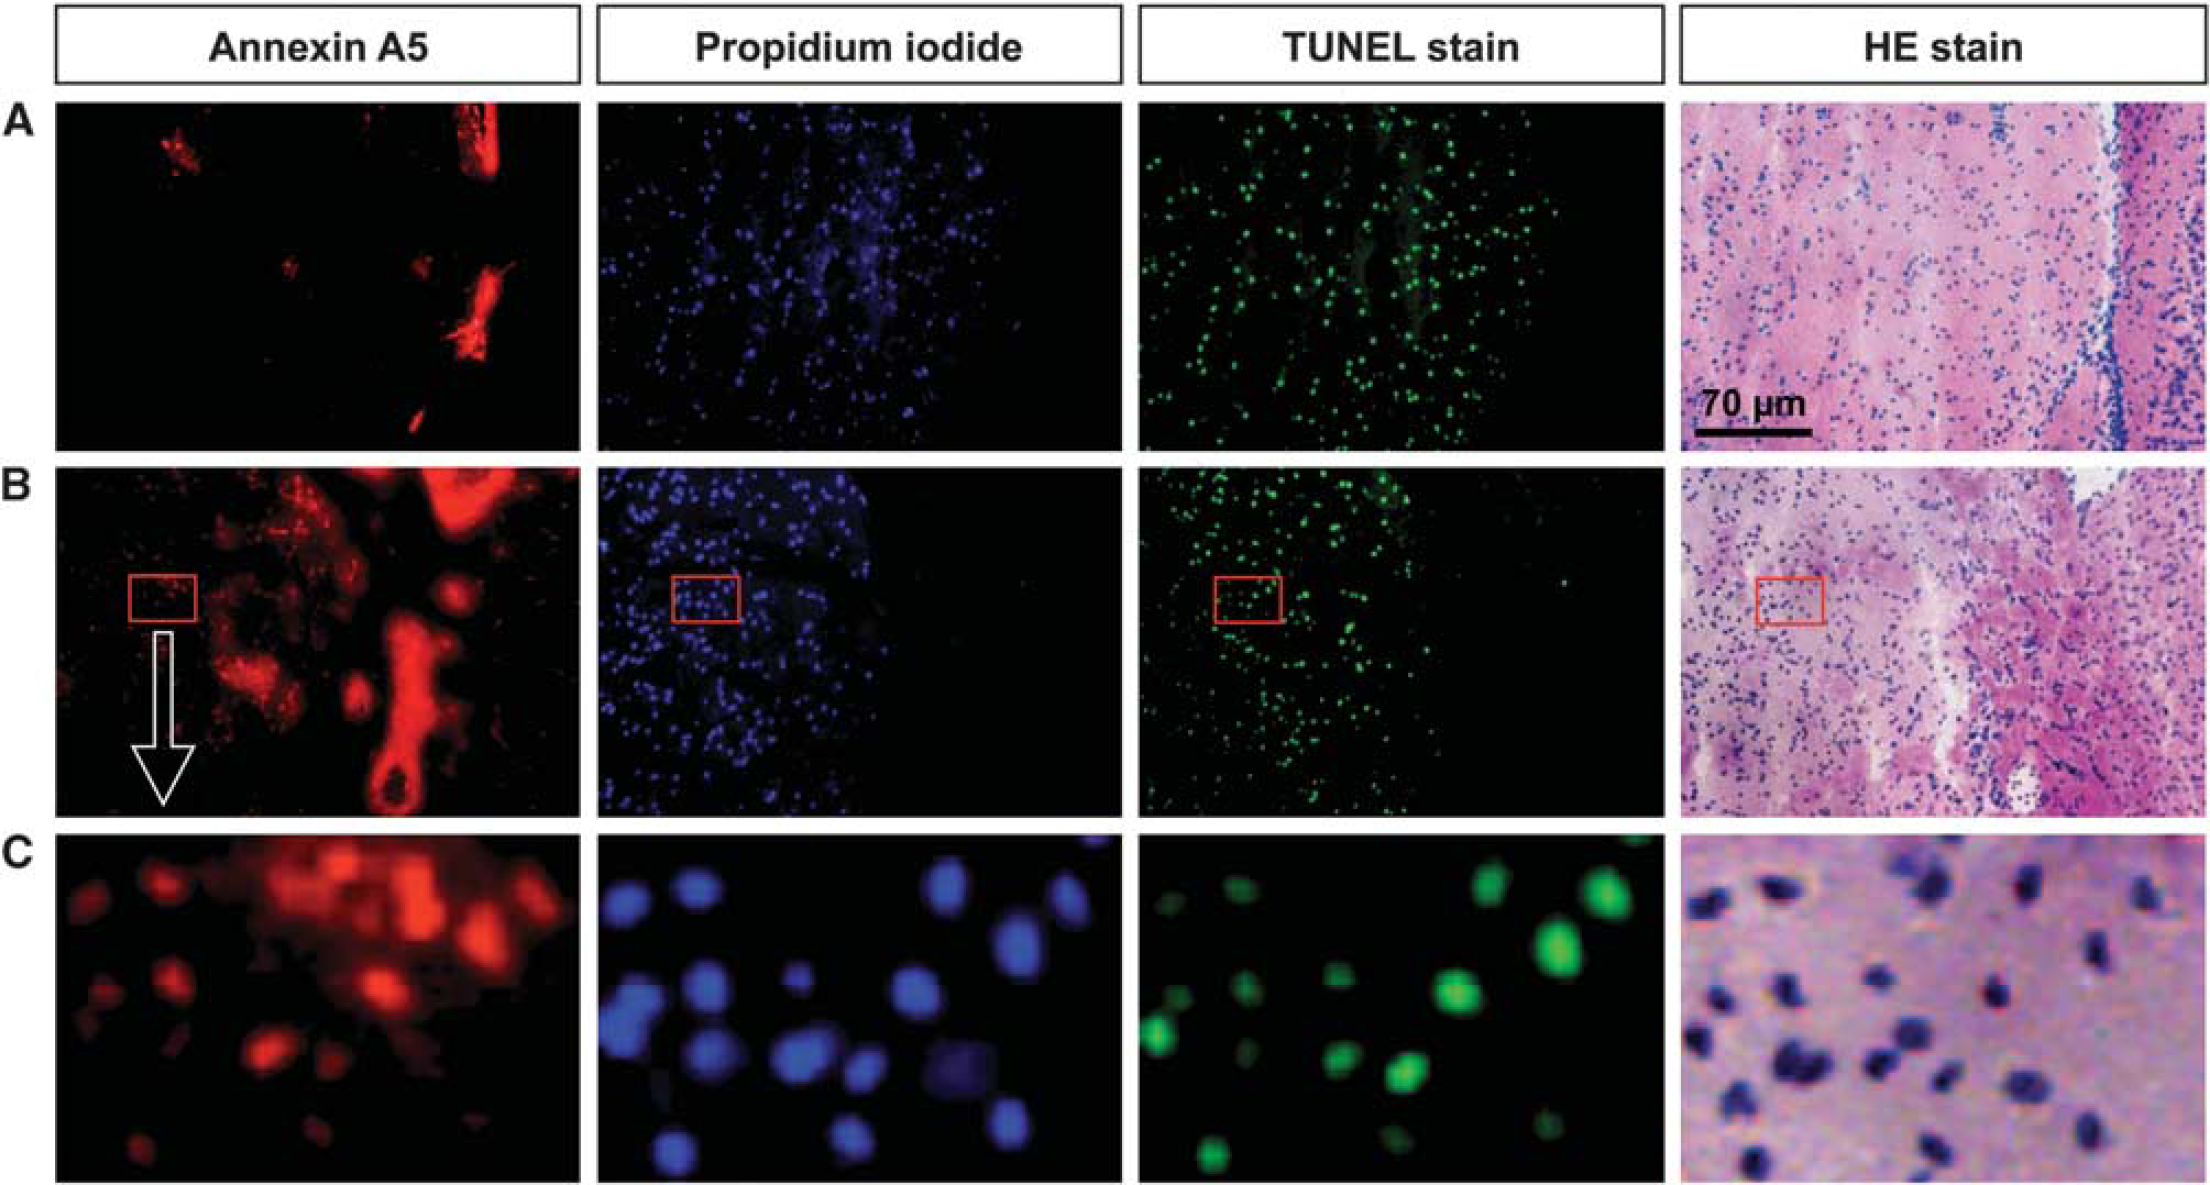
Microscopic images of tissue sections taken from middle cerebral artery occlusion (MCAO) mice 4 hours after intravenous injection of propidium iodide (PI) and either inactive annexin A5 (
Single Cell Analysis
The percentage of cells showing a distinct labeling pattern was calculated from three sections from each mouse (Table 1). In the striatum, ~59% of the cells were positive for fluorescent annexin A5, in the cortex about 53%. In both regions, the majority of cells positive for fluorescent annexin A5 were also positive for PI and TUNEL staining (striatum: 84%, cortex: 89%). Most of the remaining cells positive for annexin A5 were at least PI positive. Only a few cells positive for annexin A5 showed no other label. It has to be noted that a considerable fraction of the total number of cells showed no annexin A5 signal but were positive for PI and TUNEL staining or only positive for PI (striatum: 18%, cortex: 16%). The number of cells only positive for TUNEL was negligible.
Percentage of cells in the striatum and the cortex of the brain showing certain labeling patterns
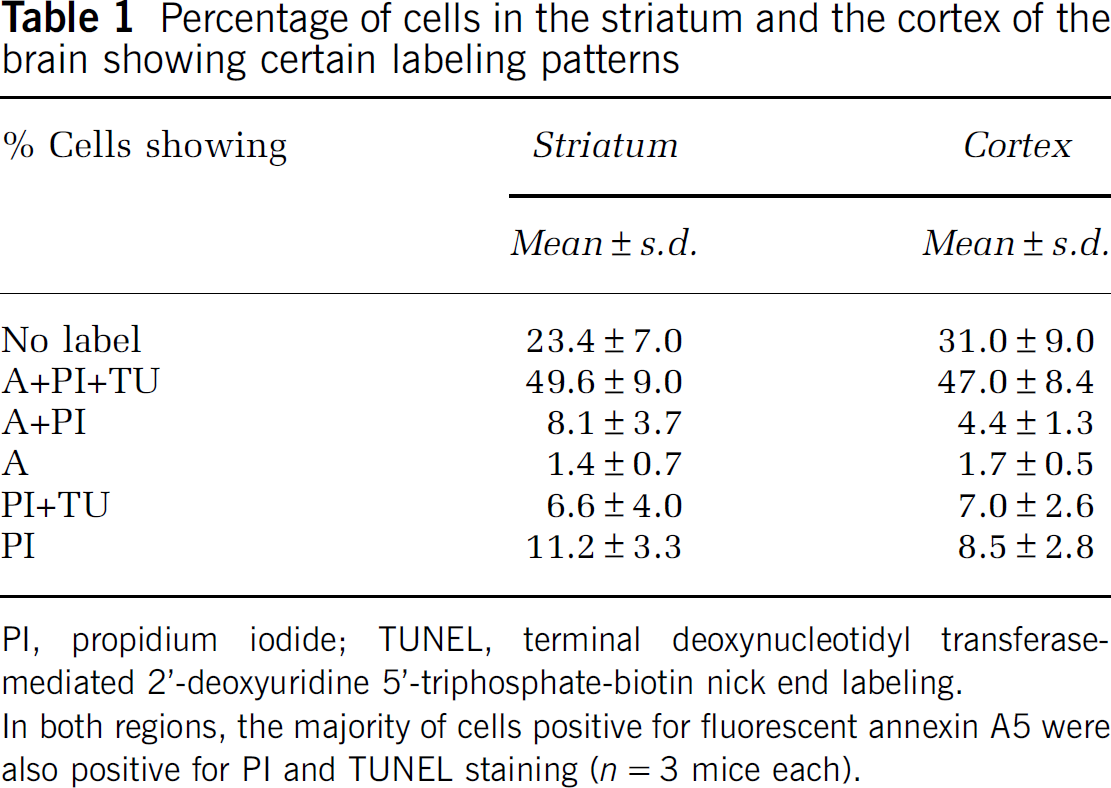
PI, propidium iodide; TUNEL, terminal deoxynucleotidyl transferase-mediated 2'-deoxyuridine 5'-triphosphate-biotin nick end labeling.
In both regions, the majority of cells positive for fluorescent annexin A5 were also positive for PI and TUNEL staining (n = 3 mice each).
Discussion
Our study demonstrates the high specificity of annexin A5 for the in vivo visualization of lethally damaged or dead cells in a mouse model of cerebral ischemia. This is supported, for the first time, by data that include both an active PS-binding annexin A5 and an appropriate control compound, inactive annexin A5 without binding properties for PS. Also for the first time, the specificity of annexin A5 for damaged or dead cells is demonstrated on the microscopic level by comparing the in vivo distribution of active and inactive annexin A5 with other cell damage or cell death markers, namely PI and TUNEL staining. However, we also observed unspecific accumulation of both annexin A5 forms in the choroid plexus. Taken together, we conclude that active annexin A5, which can be easily labeled with different signal molecules detectable with different imaging modalities (SPECT, PET, or MRI), is a suitable marker for the visualization of tissue damage in mouse models of cerebral ischemia and it might also be useful in patients with stroke.
To claim ‘specificity’ of an imaging agent, an appropriate control experiment is mandatory. Under pathological conditions, the perfusion of the tissue and the permeability of vessels that can lead to extravasation of molecules can change dramatically compared with normal tissue. In many brain diseases, the BBB is impaired, potentially leading to extravasation of compounds into the parenchyma and thus to unspecific probe accumulation. This is particularly relevant for imaging in brain tumors, multiple sclerosis, and in stroke (Ballabh et al, 2004; Zlokovic, 2008). Thus, the signal measured after injection of an imaging agent might be, at least partially, due to unspecific extravasation. This effect can be very prominent and is the underlying principle of contrast generation in Gd-enhanced MRI of BBB disruption. In validation studies, control experiments can be performed with knockout mice lacking the target molecule, as we have shown in previous studies (Klohs et al, 2008, 2009a). In the current study, we used inactive annexin A5 as a control (Schellenberger et al, 2004b). At both 4 and 8 hours after injection, mice with both active and inactive annexin A5 showed higher fluorescence intensities in the ischemic hemisphere compared with the contralateral side. However, the TBR of inactive annexin A5 was considerably lower than that of the mice injected with active annexin A5 (Figures 1–3). Therefore, the signal detected in the ischemic hemisphere from inactive annexin A5 can be attributed to extravasation. Accordingly, a part of the signal detected after injection of the active compound is also caused by BBB impairment. However, we cannot define the exact percentage attributable to leakage, since absolute quantification of the NIRF signals is not possible. This can be addressed in future studies using radioactive annexin A5 preparations labeled with different radioisotopes, which can be detected separately.
To our knowledge, the literature on the pharmacokinetics of annexin A5 is surprisingly sparse. The PK of annexin A5 labeled with 99mTc and 111In has been studied in rats (Greupink et al, 2009) and mice (Wen et al, 2003), respectively. A two-compartment model has been postulated with a rapid elimination of annexin A5 in the first phase (<10 minutes) and a slower one in the second phase (>60 minutes). Furthermore, there are studies on the PK of 99mTc-labeled annexin A5 in rabbit and swine models (Stratton et al, 1995; Tait et al, 1994). Owing to its size and water solubility, annexin A5 is rapidly cleared by the kidneys with a short half-life in blood of about an hour or less. Among the organs studied, the kidneys showed by far the highest uptake. In humans, >90% of the blood activity was cleared with a half-life of 24 minutes (Kemerink et al, 2003). In our study, we found no significant differences between the TBRs at 4 and 8 hours after injection of active annexin A5. This indicates that annexin A5 is only washed out slowly from the lesion and that imaging might be performed at comparably late time points after injection.
The TBR after injection of active NIRF-annexin A5 is clearly lower (<1.2) than that found in similar studies with Cy5.5-labeled compounds. For example, TBRs above 1.5 are typically produced when using an antibody directed against the proinflammatory CD40 receptor (Klohs et al, 2008) or with a matrix metalloproteinases-cleavable macromolecular imaging agent (Klohs et al, 2009a) or fluorescently labeled albumin (Klohs et al, 2009b). The low TBR in our study is, in part, attributable to unspecific signals from the ventricles (Figure 4), which were not present in the earlier studies, and lead to a comparably low TBR. However, the analysis of uptake ratios in ischemic compared with normal brain areas in animal models using tomographic imaging systems such as SPECT are, due to their better spatial resolution, expected to be less influenced by the background signal in the ventricles.
To further evaluate the specificity of systemically administered annexin A5, we compared its distribution with that of intravenously injected PI and TUNEL staining. The choroid plexus showed fluorescence signals from both PI and active annexin A5 that were even stronger than that of the ischemic area, whereas only a few cells were positive for TUNEL (Figure 4). The choroid plexus separates the cerebrospinal fluid containing ventricles and spinal canal from the blood. The blood—cerebrospinal fluid barrier, like the BBB, consists of tight junctions (Nabeshima et al, 1975), but is more permeable than the BBB (Johanson et al, 2008). It remains unclear why annexin A5 and PI bind to the choroid plexus, while other molecules such as antibodies or albumin do not. Radiolabeled annexin A5 has already been used in animal and human studies of stroke without such a characterization (Blankenberg et al, 2006). Some of the images of these studies are indicative of unspecific signal from the choroid plexus, especially in the paper by Blankenberg et al (2006). The strong signal in the area of the ventricles detected with SPECT can be blood pool, as discussed in the paper or accumulation of the compound in the choroid plexus or both. From the images presented in that paper, this cannot be ruled out, but it is neither mentioned nor further investigated.
The specificity of active Cy5.5-annexin A5 for dead or lethally damaged cells is also supported by our single cell analysis. On the microscopic level, cells in the ischemic area with high fluorescence intensity were only detected for active annexin A5 but not for inactive annexin A5. The majority of these cells were also PI- and TUNEL-positive. Some cells were also only PI- and TUNEL-positive or only PI-positive (see Table 1). This can be explained by limited delivery of fluorescent annexin A5 or different detection sensitivities. Our results correspond to the findings by Unal Cevik and Dalkara (2003). They compared systemically administered PI (0.5 μg injected into the ipsilateral ventricle or 20 mg/kg injected intravenously) with subsequent TUNEL staining at 6 and 72 hours in two mice models of focal cerebral ischemia (30 minutes of transient MCAO with either intravenous or intracerebroventricular injection and permanent MCAO injected intracerebroventricularly). The authors showed that only discrete populations of cells positive for either PI or TUNEL were detected in areas with mild ischemic injury in the 30-minute model. In regions of more severe ischemic damage, most of the cells had a mixed phenotype of both markers, in addition to cells labeled with only one of the markers, which is similar to our study. However, the fraction of only PI-positive cells in our study was larger, and we detected only a few exclusively TUNEL-positive cells. These differences might be attributed to differences in the animal models used. For example, Unal Cevik and Dalkara found that only a few cells were positive for PI and TUNEL at 6 hours after ischemia. As we have not studied early time points after ischemia, it is not clear whether the staining pattern (annexin A5, PI, and TUNEL) is different at early and late time points after reperfusion. This remains to be determined in future studies using fluorescent annexin A5.
Cell death can be classified according to morphological, enzymological, functional, or immunological characteristics (Galluzzi et al, 2009; Kroemer et al, 2009). Neither TUNEL staining, annexin A5 binding, nor PI uptake is specific for a certain type of cell death. Further complexity ensues with the different sensitivities and specificities of the methods used to evaluate cell death. In addition, some of the ‘cell death markers’ may bind to cells that are not yet fully committed to cell death, and may be ‘rescued’ under certain conditions. For instance, Yang et al (2002) described reversible PS expression on the cell surface of granulocytes and monocytes. Kenis et al (2010) demonstrated reversible PS expression in cardiomyocytes subjected to brief episodes of ischemia. Although we are not aware of any data on reversible PS expression in the brain after stroke, we cannot exclude it. Taken together, we believe that annexin A5 can be used as a marker for ‘dead cells’ or ‘lethally damaged cells’, without further qualification of the type of cell death.
In summary, we have shown that cell death induced by cerebral ischemia can be specifically visualized using NIRF imaging of annexin A5 in a mouse model of stroke. Imaging of annexin A5 may be applied to further study cell death in animal models of stroke and other diseases. As annexin A5 can be labeled for SPECT, PET, or MRI, it might also prove useful in the diagnosis and therapy monitoring of stroke and other diseases in humans, provided that the resolution of the imaging approach allows for the discrimination of unspecific signal enhancement in the ventricles.
Footnotes
Acknowledgements
The authors thank Ingo Przesdzing for his support in the histological parts of the study.
The authors declare no conflict of interest.