
Abstract
Functional magnetic resonance imaging (FMRI) is a noninvasive technique for mapping regional brain changes in response to sensory, motor, or cognitive activation tasks. Interpretation of these activation experiments may be confounded by more elementary task parameters, such as stimulus presentation or movement rates. We examined the effect of movement rate on the FMRI response recorded from the contralateral primary motor cortex. Four right-handed healthy subjects performed flexion-extension movements of digits 2–5 of the right hand at rates of 1, 2, 3, 4, or 5 Hz. Results of this study indicated a positive linear relationship between movement rate and FMRI signal change. Additionally, the number of voxels demonstrating functional activity increased significantly with faster movement rates. The magnitude of the signal change at each movement rate remained constant over the course of three 8-min scanning series. These findings are similar to those of previous rate studies of the visual and auditory system performed with positron emission tomography (PET) and FMRI.
Keywords
Functional magnetic resonance imaging (FMRI) has emerged as a technique for mapping human brain function (Sanders and Orrison, 1995; DeYoe et al., 1994; Binder and Rao, 1994). In designing activation experiments, it is important to understand the effects of elementary sensory and motor task parameters (e.g., rate, duration, amplitude) on the hemodynamic response. In a positron emission tomography (PET) study, Fox and Raichle (1985) demonstrated that stimulus rate was an important factor in determining rCBF in the visual cortex, a finding recently replicated with FMRI (Kwong et al., 1992). These studies demonstrated a positive linear change from 0 to 8 Hz, followed by a decline at higher rates. We (Binder et al., 1994) have shown that the FMRI signal change in the auditory cortex increases in a monotonic, nonlinear manner with increasing presentation rates of speech syllables, ranging from 0.17 to 2.5 Hz.
The relationship between task parameters and the magnitude of the hemodynamic response has not been investigated thus far in the motor system. Previously, we (Rao et al., 1993) demonstrated that self-paced sequential finger-tapping movements resulted in a wider spatial distribution of activation within the primary and secondary motor cortices than do self-paced repetitive movements. Pacing the rate of movement of the two tasks greatly reduced the magnitude of the FMRI signal change for the repetitive task, suggesting an interaction between task complexity and movement rate. These findings prompted the current study to determine if the FMRI hemodynamic response is influenced by movement rate.
MATERIALS AND METHODS
Subjects
Four healthy, strongly right-handed (Oldfield, 1971), volunteers (3 women, 1 man; ages 20–27), served as subjects. Subjects were paid and gave informed consent according to institutional guidelines.
Apparatus and scanning procedure
FMRI was conducted on a commercial 1.5 T scanner (Signa, GE Medical Systems, Milwaukee, WI, U.S.A.) equipped with a prototype 30.5-cm-ID three-axis local gradient head coil and an elliptical end-capped quadrature radiofrequency coil (Wong et al., 1992a,b). Functional imaging consisted of a single-shot, blipped, gradient-echo, echo-planar pulse sequence (Bandettini et al., 1992). Data acquisition time was 40 ms to acquire a 64 × 64 image (voxel dimensions = 3.75 × 3.75 × 10.0 mm) with a field of view of 24 cm. A functional imaging series consisted of 480 sequential images collected from an axial slice centered 22 mm from the vertex of the brain, as visualized from a mid-sagittal localizer. This location was selected as an optimal site for detecting functional activity from the hand region of the left motor cortex. The interscan interval (TR) was 1 s, yielding a total duration for each imaging series of 8 min. Scanning also included acquisition of 5–mm 256 × 128 standard GRASS (gradient-recalled at steady-state) or fast spin-echo anatomic reference images, located at the same position as the echo-planar images. Foam padding was used to limit head motion within the coil.
Activation paradigm
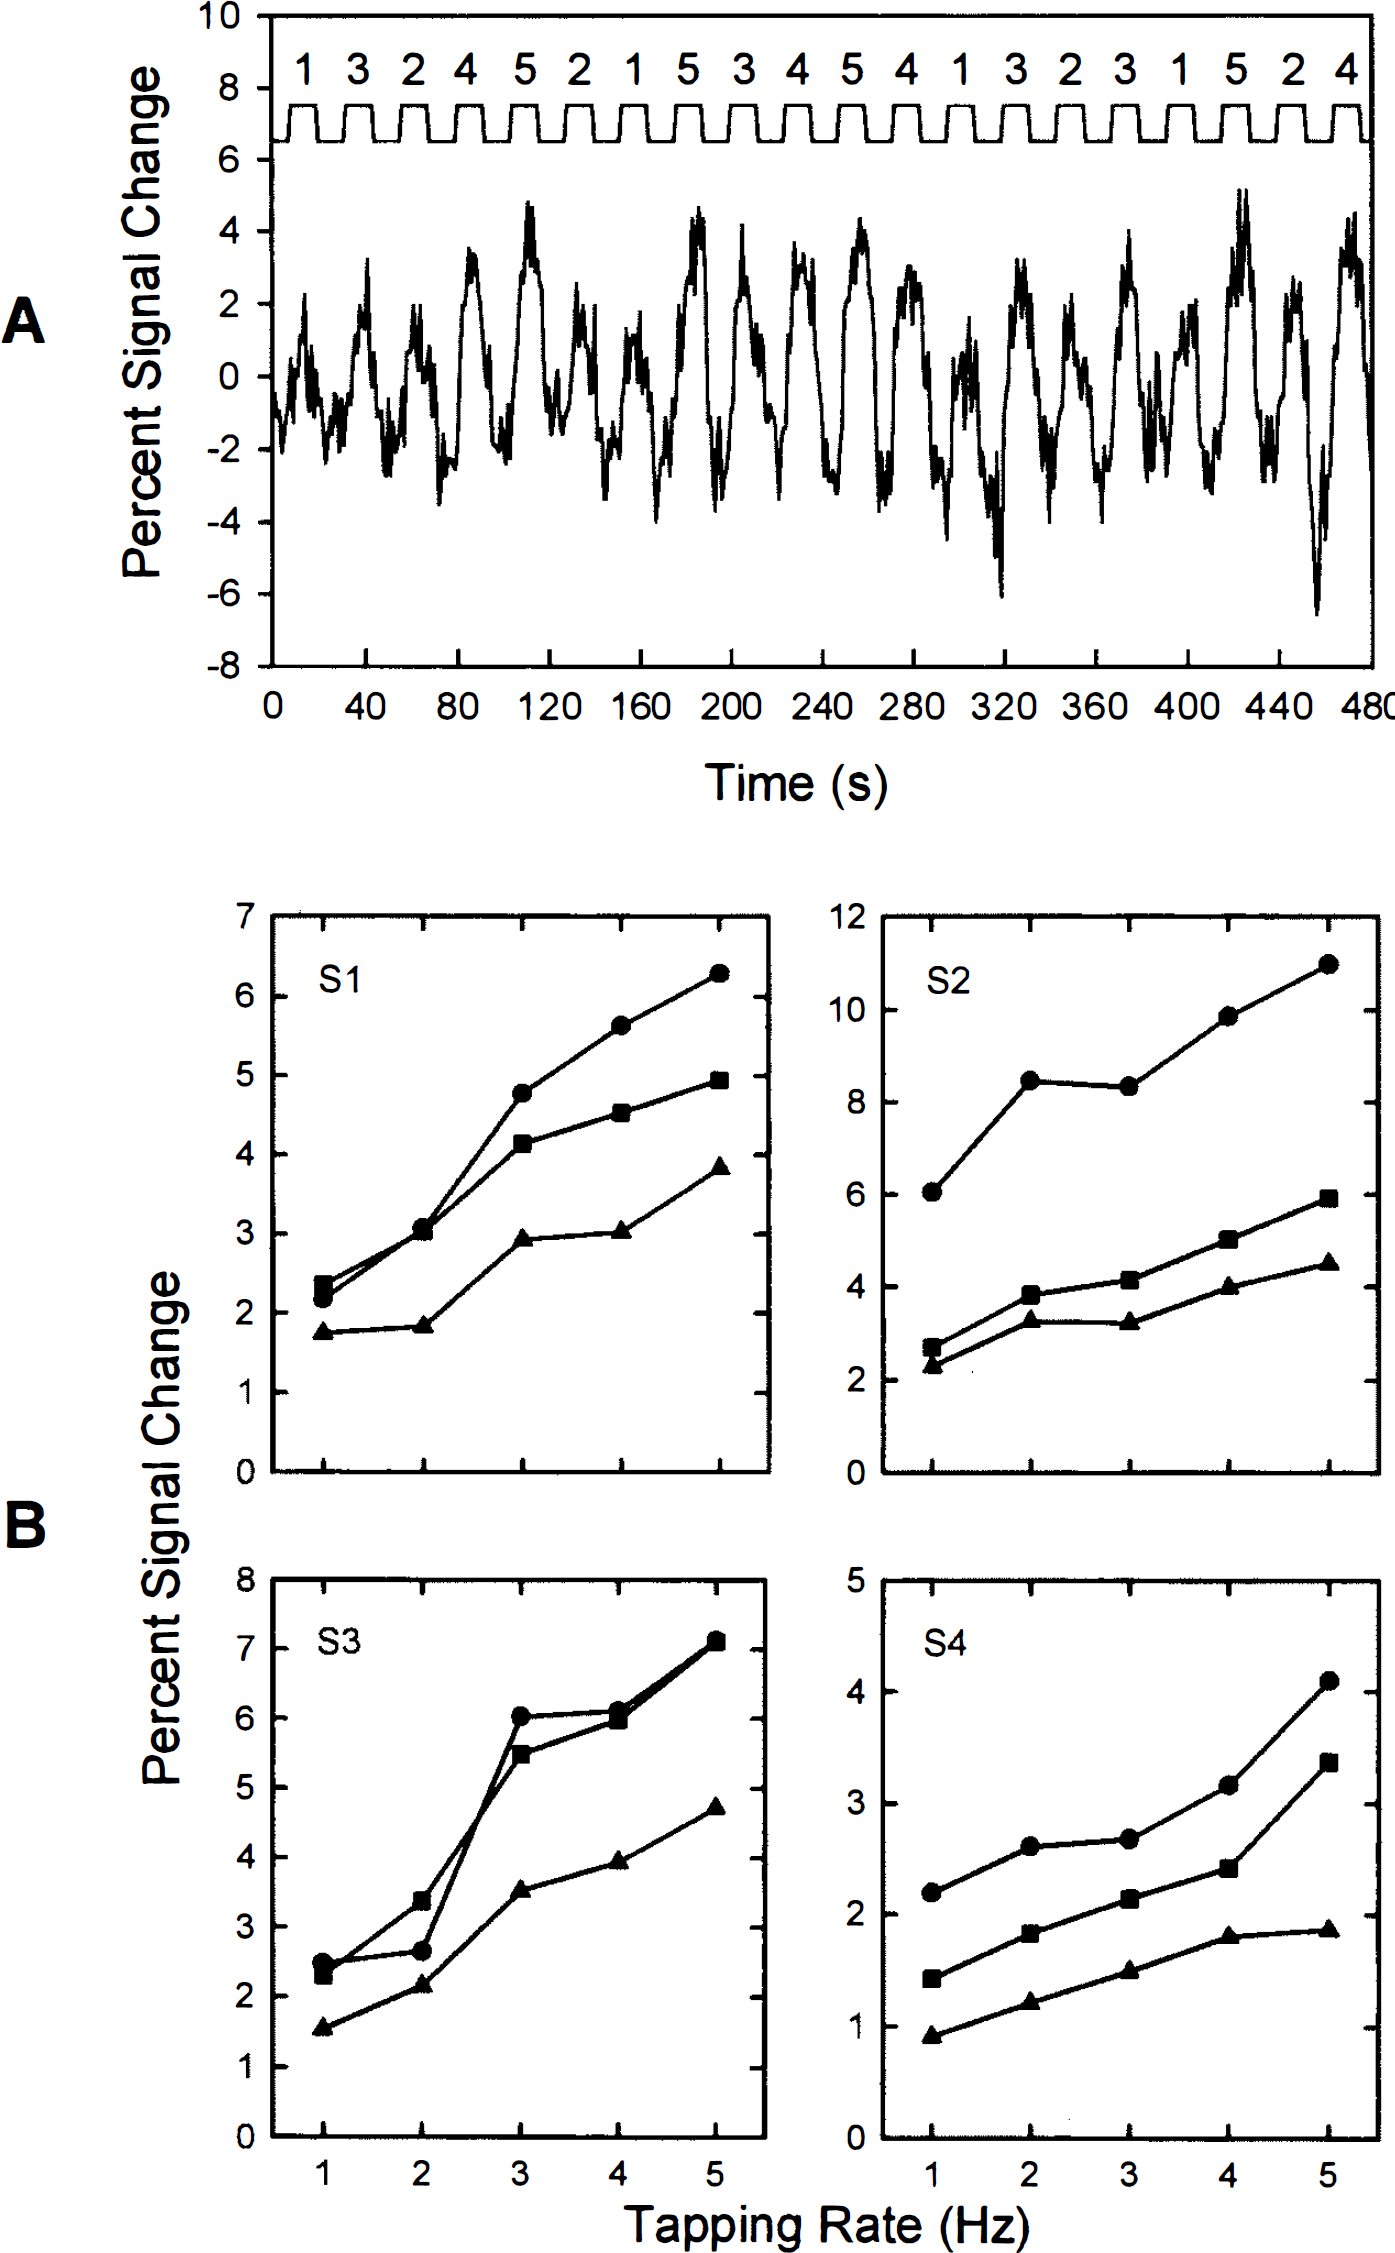
Subjects were instructed to keep their eyes open throughout the scanning series. They were provided instructions and allowed to practice the motor activation task prior to scanning. The task consisted of flexing and extending digits 2–5 repeatedly in unison without also moving the wrist. Subjects tapped their fingers on a flat surface. Finger-tapping rates were set at 1, 2, 3, 4, or 5 Hz. Subjects paced their movements in response to a metronome, which consisted of a clicking sound played at precise intervals using a computer, amplified, and delivered binaurally to the subject via air conduction through a pair of plastic tubes 2.5 m in length. Movements were performed for 12 s (activation) followed by 12 s of rest (baseline). The 12-s activation period was selected based on previous research (DeYoe et al., 1992) showing that the latency of the activation-induced FMRI signal change is approximately 5–8 s from movement onset to 90% maximum. The tapping rate was constant within an activation period. There were a total of 20 activation/baseline cycles per imaging series. Three consecutive imaging series were conducted per subject (60 activation periods per scanning session). Each of the five movement rates was repeated for a total of 12 activation periods (4 per imaging series). Rate conditions were presented in pseudorandom order within an imaging series (see Fig. 1A).
Data analysis
Three voxels from the left primary motor cortex showing the largest FMRI signal change were analyzed quantitatively for rate effects in each subject. Data from each activation cycle were analyzed separately for each voxel. A local baseline state was calculated by averaging FMRI signals from images obtained −3, −2, and −1 s prior to movement onset, and the activation state was calculated by averaging images taken 9, 10, 11, and 12 s after movement onset. These baseline and activation intervals were selected to provide maximum percent signal change values. For each voxel, percent signal change was computed for each of the 60 activation periods in the scanning session (20 per imaging series). Repeated-measures analysis of variance (ANOVA) was used to assess the overall effects of movement rate and imaging series. The latter effect was assessed to examine possible changes in the FMRI response over the course of the 24-min scanning session.
The effects of rate on the total number of activated voxels within the motor cortex was evaluated by performing a t test on the 12 baseline and activation intervals per rate condition. Voxels were identified as active if they exhibited a significant increase in signal during the activation period (t > 2.20, p < 0.05).
RESULTS
Figure 1A illustrates sample FMRI signal data from a single motor cortex voxel derived from the first imaging series of subject 1. The time course plot in this figure suggests a relationship between the degree of FMRI signal change and the frequency of the finger tapping rate. The percent signal change as a function of movement rate is shown for 12 motor cortex voxels (3 per subject) in Fig. 1B. Figure 2A represents the mean (±SD) percent signal change of the same 12 voxels shown in Fig. 1B. The correlation between movement rate and percent signal change was highly significant (r = 0.51, p < 0.001). The best-fit curve to the data in Fig. 2A was defined by a linear function (slope = 0.76; y intercept = 1.57).
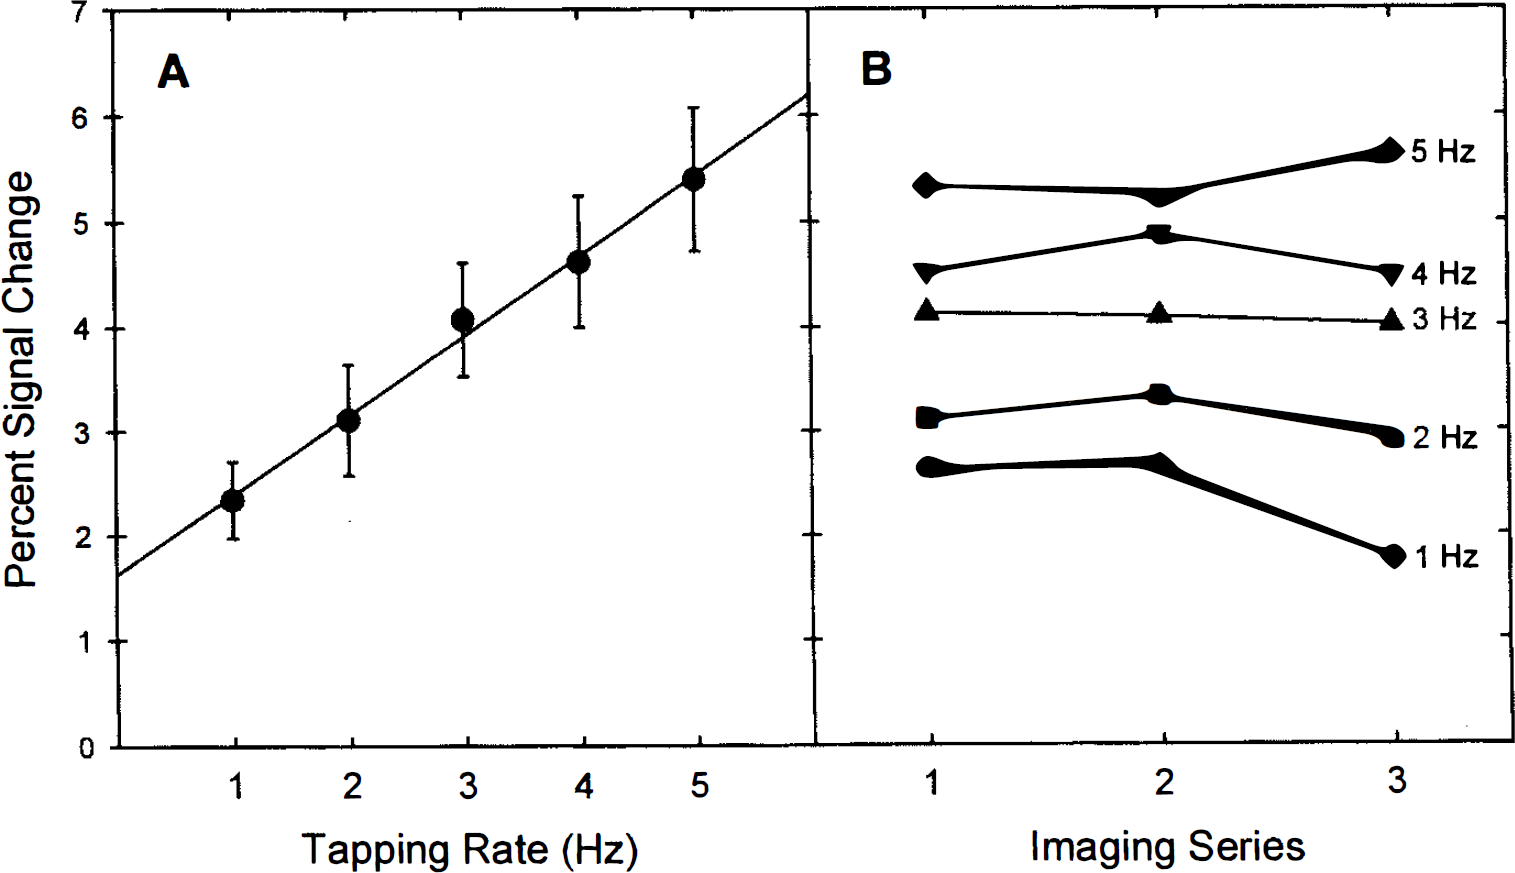
Figure 2B demonstrates the change in FMRI response as a function of imaging series and movement rate. Repeated-measures ANOVA indicated a highly significant rate main effect [F(4,44) = 42.29, p < 0.0001], a nonsignificant imaging series main effect [F(2,22) = 2.33, p > 0.12], and a significant rate × imaging series interaction [F(8,88) = 2.48, p < 0.02].
The total number of voxels demonstrating stimulus-related signal changes within the left primary motor cortex for each of the four subjects is shown in Fig. 3. The number of active voxels increased with stimulus rate [F(4,12) = 16.64, p < 0.0001]. Post-hoc paired t tests indicated that the 1 Hz condition resulted in significantly (p < 0.05) fewer active voxels than the 2- through 5-Hz conditions, which were not significantly different from each other.
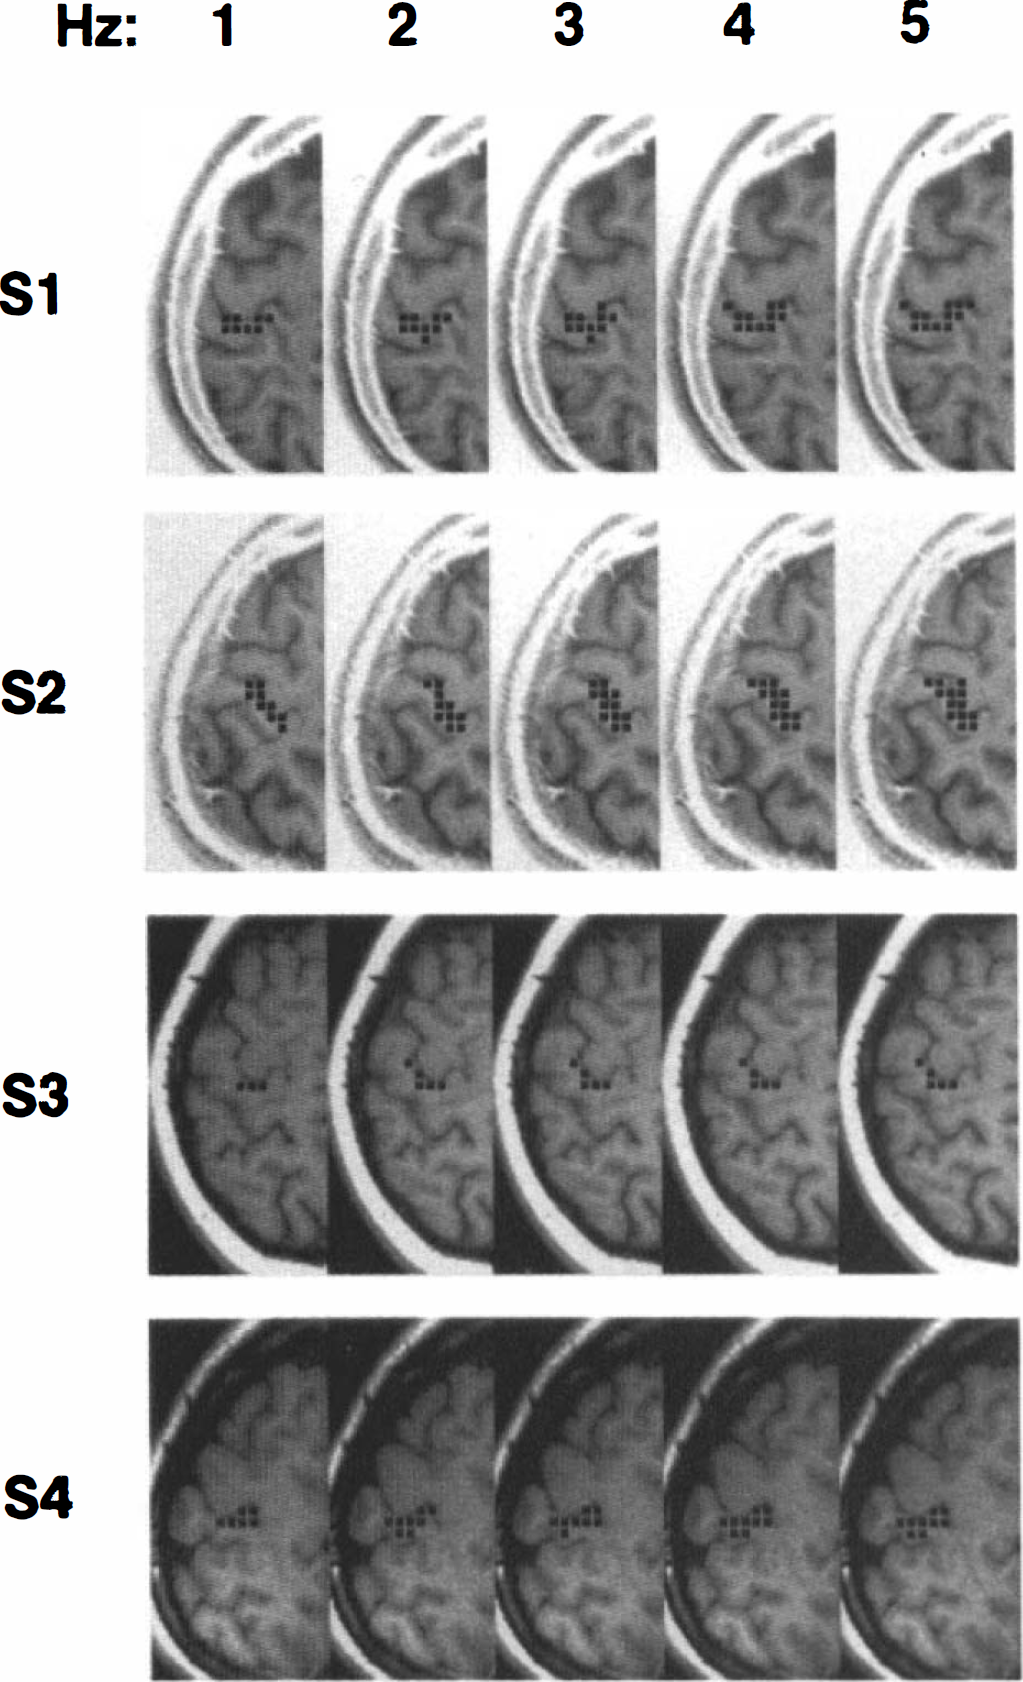
Location of active voxels (black squares) within the left primary motor cortex as a function of movement rate for each of the four subjects. See text for criteria for defining voxel activation.
DISCUSSION
Results of this study indicate a positive linear relationship between finger movement rate and FMRI percent signal change in the primary motor cortex. These findings are in general agreement with previous PET and FMRI studies demonstrating rate-dependent changes in the hemodynamic response to visual or auditory stimuli. Unlike these sensory studies, a linear increase was observed over the entire range of movement rates. We did not examine movement rates below 1 Hz, since the 1–2% change induced at this rate (Fig. 1B) is near the limits in detecting contrast from noise. Higher movement rates were not examined because pilot testing indicated that subjects could not reliably synchronize their finger movements to the metronome at rates greater than 5 Hz.
Considerable variability in the percent signal change was observed in individual voxels, ranging from 1 to 11% (Fig. 1A). Several factors may account for this, including the geometric orientation of the voxel to the cortical surface and partial volume effects as a function of the size of the vascular compartment generating the signal within a voxel. The gradient-echo EPI pulse sequence used in this study has the highest contrast-to-noise of the FMRI techniques but is also sensitive to signals emanating from both large and small vessels (Bandettini et al., 1994). Previous research indicates that the largest FMRI signal changes arise from vessels on the surface of the brain rather than from small vessels and capillaries within the parenchyma (Lai et al., 1993).
The magnitude of the signal change remained constant over the course of the three 8-min imaging series (Fig. 2B), indicating that the signal change is highly reproducible within a scanning session. The size of the area of activation within the primary motor cortex increased significantly with movement rate, but only between the 1-Hz condition and the faster movement rates. These data suggest that voxels at the fringe of the primary activation site are not identified as active at the lowest movement rate due to low contrast-to-noise rather than as a result of a widening area of activation with movement rate.
The information derived from parametric studies such as this are necessary for designing and interpreting experiments involving more complex activation tasks. Whether similar rate effects are also observed in secondary motor areas (lateral premotor cortex, supplementary motor area) in response to more complex, sequential movements remains to be investigated.
Footnotes
Abbreviations used
Acknowledgment:
This study was supported in part by grants from the National Institute of Mental Health (P01MH51358), National Institute of Neurological Diseases and Stroke (R01NS33576), National Institute of Drug Abuse (R01DA09465), and the National Multiple Sclerosis Society.