
Abstract
Magnetic resonance water diffusion imaging can detect early ischemic changes in stroke. Using a middle cerebral artery occlusion model, we examined which range of values of the orientation-independent diffusion quantity  is an early noninvasive indicator of reduced cerebral perfusion and focal brain injury. Cats underwent either a 30-min occlusion followed by 3.5 h reperfusion (n = 7) or a 60-min occlusion followed by 4-h reperfusion (n = 6). Repeated measurements of CBF were made with radiolabeled microspheres, and acute focal injury was measured with triphenyltetrazolium chloride (TTC) staining. During occlusion, the decrease in Dav correlated with CBF for caudate [30-min occlusion (n = 13): p < 0.0001; 60-min occlusion (n = 6): p < 0.02] and for cortex [30-min occlusion (n = 12): p < 0.0001; 60-min occlusion (n = 5): p < 0.04]. Variable caudate and hemispheric injury levels were found among cats in both groups. The area of tissue injury demarcated by TTC began to correlate with the area of reduced Dav by 30 min of occlusion (p < 0.02), and this correlation improved (p < 0.0001) at 1, 1.5, and 2.0 h after the onset of occlusion. The time necessary to reach a one-to-one correspondence between the percent of hemisphere injured and the percent of hemispheric area with Dav < 0.65 × 10⁻⁹ m2/s was 2 h after occlusion. Thus, the absolute value of Dav is a good indicator of the risk of tissue injury, whereas the combination of Dav and the length of time of Dav reduction is an excellent predictor of acute focal tissue injury demarcated by TTC staining.
Keywords
Recent studies have suggested that the therapeutic window for pharmacologic intervention in focal cerebral ischemia is limited to ∼2–3 h postocclusion (Park et al., 1988b; Steinberg et al., 1988). To properly diagnose stroke patients within this time frame, it is necessary to develop quantitative imaging modalities that can rapidly distinguish irreversible from reversible brain damage. Focal ischemic regions consist of an ischemic core surrounded by areas of reduced perfusion (Astrup et al., 1977; Siesjö, 1992). These hypoperfused border regions are at risk of eventual infarction and are the regions of most interest for potential therapy. Magnetic resonance (MR) spin density and T2 images generally indicate only the irreversible damage of infarction (Bose et al., 1988) and do not outline the border region at risk. Diffusion images, on the contrary, can indicate early stages of both reversible and irreversible ischemia (Moseley et al., 1990a; Knight et al., 1991; Moonen et al., 1991; Benveniste et al., 1992; Busza et al., 1992; Minematsu et al., 1992). Indeed, changes in water diffusion constant can occur within minutes after onset of the insult (Pierpaoli et al., 1993; Davis et al., 1994; Hoehn-Berlage et al., 1994) and are faster than changes in lactate and ATP (Decanniere et al., 1995). Several studies have shown a close spatial relationship between histopathological damage and areas of reduced diffusion constants (Kucharczyk et al., 1991; Minematsu et al., 1992; Helpern et al., 1993; Jiang et al., 1993; Pierpaoli et al., 1993; Back et al., 1994; Knight et al., 1994). The changes in the diffusion constant have also been shown to correlate spatially with ultimate damage after irreversible global and focal ischemia and with concomitant changes in pH and glucose and ATP levels (Hossmann et al., 1994). Focal ischemia studies in rats have shown that the absolute value of the diffusion constant varies within the ischemic zone at different time points during ischemia and that the D value at 2 h after stroke onset is highly correlated with postmortem infarct area (Dardzinski et al., 1993; Jiang et al., 1993). In addition, recent studies by the same group (Hasegawa et al., 1994) have shown that recovery of regions with reduced diffusion constants after 45 min of transient ischemia occurred only for D values that were reduced by <0.25 × 10⁻⁹ m2/s. However, global ischemia studies have shown that diffusional changes of this order of magnitude can still be reversed (Pierpaoli et al., 1993; Davis et al., 1994), and it seems likely that the absolute value of the diffusion constant at any given point in time alone cannot be a complete indicator of the resulting injury. Because clinical diffusion images of acute stroke victims, some of whom have spontaneous recanalization, are obtained at a single time point at a variable delay from onset, it is important to understand the time course of D in models of reversible focal ischemia.
Based on the aforementioned results in the rat showing that D values are a good indicator of the extent of ischemia at certain points in time in the acute stage of stroke, we postulate that the extent of injury can be determined by combined evaluation of D and the length of ischemia. One study investigating this hypothesis has been reported (Helpern et al., 1993), but except for trends no significant correlations were reported between the gradation in D-values and length of reduction in D to the extent of damage. In the present study, we evaluate this correlation for transient focal ischemia of relatively short duration (30–60 min) in which some brain regions are subjected to variable levels of reversible injury. We use cats, rather than rats, because the larger brain region permits identification of larger border regions with intermediate levels of CBF, which is an indicator of ischemic extent during occlusion. We developed a method to reversibly occlude the middle cerebral artery (MCA) inside the magnet, so that the complete time course of the diffusion coefficient (preischemic, during occlusion and reperfusion) could be determined while CBF was measured simultaneously using radiolabeled microspheres.
In this study we determine the diffusion quantitity  . Contrary to all other studies where only one of the tensor components is reported, Dav is not dependent on the orientation of the subject with respect to the magnetic field gradient axes (Basser et al., 1994b; van Gelderen et al., 1994b; van Zijl et al., 1994; Mori and van Zijl, 1995). Our goal was twofold: first, we tested the hypothesis that Dav is a noninvasive indicator of the severity of ischemia by correlating the absolute values of CBF and Dav during occlusion and reperfusion. Second, we correlated the area and severity of the Dav reduction at different times of occlusion and reperfusion with the area of brain injury as indicated by 2,3,5-triphenyltetrazolium chloride (TTC) staining.
MATERIALS AND METHODS
Animal preparation
All studies received approval from the institutional animal care and use committee and were performed as previously reported by our laboratory (Matsumiya et al., 1990, 1991). In short, after anesthesia was induced with halothane in oxygen, cats (3–5 kg) were orally intubated and mechanically ventilated to maintain arterial carbon dioxide tension (Paco2) at 35–45 mm Hg. Anesthesia was maintained with halothane (0.5–1.5%) in oxygen-enriched air (FIO2 0.35–0.4), and pancuronium bromide (0.2 mg/kg/h i.v.) was administered for muscle relaxation to prevent movement during electrocautery and diffusion imaging. Arterial pH was maintained between 7.35 and 7.45 using sodium bicarbonate as needed. Body temperature was controlled with a warming blanket. The femoral vein was catheterized for the administration of lactated Ringer's solution and drugs. Catheters were placed in the descending aorta via both femoral arteries for blood pressure measurement, arterial blood gas sampling, and for withdrawal of reference blood samples during injection of radiolabeled microspheres. After left thoracotomy, a catheter was inserted into the left atrium for injection of radiolabeled microspheres. Arterial blood pressure was measured continuously with a Statham pressure transducer. Arterial pH, Paco2, and Pao2 were measured with a self-calibrating Radiometer electrode system (ABL 3; Copenhagen, Denmark). Hemoglobin and arterial oxygen content were measured with a hemoximeter (model OSM3, Radiometer). Glucose was measured using a YSI model 2300 stat glucose/lactate analyzer (Yellow Springs, OH, U.S.A.).
Induction of focal cerebral ischemia
The left MCA was exposed by a transorbital approach using microsurgical techniques (O'Brien and Waltz, 1973; Matsumiya et al., 1990, 1991), and a suture (6–0 Ethilon or 7–0 Surgilene) was placed loosely around the MCA near its origin from the intracranial carotid artery. The suture exited through PE-190 tubing cemented to the orbit. After recording baseline values of all variables, ischemia was produced by tightening the suture loop around the MCA with a 10-g plastic weight. After 30 (n = 7) or 60 min (n = 6) of occlusion, reperfusion was initiated by removing the plastic weight from the suture.
NMR: T2-weighted and absolute diffusion imaging
Experiments were performed on a horizontal-bore 4.7 T GE CSI animal imager with shielded gradients of up to 0.19 T/m. A homemade 4.0-cm 1H surface coil was used. Images were obtained using a spin echo sequence (echo time = 90 ms; repetition time = 1 s.; field of view 100 mm; 128 × 64 matrix, zerofilled to 128 × 128). Four diffusion-weighted images (gradient values: 0.01, 0.06, 0.10, 0.13T/m; 1 T/m = 100 G/cm; b values: 4.12, 148, 412, and 697 s/mm2) were used to calculate a pure diffusion image every 4.8 min. At the lowest gradient strength for diffusion imaging, the image contrast is mainly T2 weighted. All images were processed using the IDL software package (RSI Systems, CO, U.S.A.). Diffusion images were obtained by fitting each image voxel to the Stejskal-Tanner equation (Eq. 1, next paragraph). Regions of interest for comparison with CBF and staining were also examined using this software package.
The reproducibility of absolute diffusion constants is not a straightforward problem. Although individual groups are able to achieve highly reproducible D values, there is a large variation among laboratories (van Zijl et al., 1994). The reason is related to the fact that diffusion is influenced by restriction effects such as molecular binding and transport through cell membranes. Due to the limited permeability of membranes and the asymmetry of cell structures, water diffusion is anisotropic (direction dependent) and can best be described by a tensor (Basser et al., 1994a, 1994b; van Gelderen et al., 1994a, 1994b). Thus, diffusion weighting is sensitive to the orientation of the object with respect to the magnetic field gradients. In order to determine diffusion constants that are orientation-independent, one can measure the average diffusion constant (Basser et al., 1994b; van Gelderen et al., 1994a,
b
)  . Although some restrictional influence remains depending on the duration of the period over which a certain MR experiment is sensitized to water diffusion (diffusion time), measurement of Dav strongly reduces contrast between gray and white matter and can accurately outline small ischemic regions (van Gelderen et al., 1994b; Mori and van Zijl, 1995). We therefore incorporated this approach in the present study. The gradient pattern used to weight the signal intensity by Dav within a single acquisition is pattern I given by Mori and van Zijl in Fig. 2 of the article (Mori and van Zijl, 1995). The directions u, v, and w can be allocated x, y, or z arbitrarily. Pure diffusion images (Le Bihan et al., 1991) were calculated by fitting the signal intensities 5 at the four gradient strengths to
in which S0 is the signal intensity before diffusion weighting, n is the number of field gradient pairs (n = 6 for pattern I), and γ is the proton gyromagnetic ratio (26.75 × 10⁷ rad/T/s). G and 8 are the gradient strength and length (5 ms) and tdif(3.84 ms) is the diffusion time, which is the time between the starts of the individual two gradients in a pair minus one-third the gradient length.
CBF measurement
Regional CBF was measured with radiolabeled microspheres (16 ± 0.5-m diameter; Du Pont-NEN Products, Boston, MA, U.S.A.) using the reference withdrawal method (Heymann et al., 1977; Matsumiya et al., 1990). Six radioactive isotopes (153Gd, 114mIn, 113Sn, 103Ru, 95Nb, 46Sc) were injected in random sequence in each animal. Approximately 2.5 × 10⁶ microspheres were injected into the left atrium during a 20-s period, followed by 3-ml saline flush. The reference blood sample was withdrawn from the aorta at 1.94 ml/min beginning 30 s before the injection and continuing for 90 s after the saline flush. Injection of microspheres and withdrawal of reference blood were performed using 2-m-long catheters. Dead space volume was measured to ensure adequate flush solution after microsphere injection and adequate withdrawal volume for the reference blood samples. After the MR experiment, the brain was removed and placed in 10% formalin for 1–2 days before sectioning. After sectioning, brain tissue and withdrawn blood samples were analyzed in an autogamma scintillation spectrometer. Blood flow was calculated from CBF = CPMc/CPMr × RBF, where CPMC is counts per minute per 100 g cerebral tissue, CPMr is counts per minute in the reference sample, and RBF is the withdrawal rate of the reference blood sample (milliliters per minute).
Experimental protocol
Cats underwent 30 min of MCA occlusion (30′ MCAO) followed by 3.5 h reperfusion (n = 7) or 60 min of MCA occlusion (60′ MCAO) followed by 4-h reperfusion (n = 6). Diffusion images were obtained in an axial slice of 5-mm thickness, positioned in the basal ganglia (17 mm below the top of the brain). This slab contains lateral temporal cortex, where cortical ischemia is dense in this model. Series of four images with different diffusion weighting were taken every 4.8 min before and during occlusion, during the first hour of reperfusion, and every 15 min thereafter. Physiological variables and CBF were measured before and during occlusion (at 30 min in the 30′ MCAO group; at 30 and 60 min in the 60′ MCAO group), and during reperfusion (at 0.5, 1, 2, and 3.5 h of reperfusion in the 30′ MCAO group; at 1,2, and 4 h of reperfusion in the 60′ MCAO group). At the end of the experiment, cats were killed with intravenous potassium chloride. The brain was removed and axial sections were cut 5-mm thick. Brain injury area was estimated with TTC staining (Sigma Chemical Co., St. Louis, MO, U.S.A.) technique (Benderson et al., 1986; Cole et al., 1990). Both sides of the brain slices were photographed and injury volume was estimated as previously described in our laboratory (Matsumiya et al., 1990, 1991; Takeshima et al., 1992). The section centered at 17 mm from the top of the brain was used for comparison with the diffusion image. The cortical rim of each 5-mm-thick section was further dissected into anterior, lateral, and posterior segments for measurement of regional CBF. The lateral segment had the greatest reduction in CBF during occlusion and was used in the correlation with Dav. In addition, CBF was measured in the entire caudate nucleus for correlation with Dav in this region.
Data analysis
Relationships among variables were determined by linear regression analysis and the Pearson product-moment correlation coefficient was calculated. First, we determined the relationship between CBF and Dav during ischemia and reperfusion in the caudate nucleus and cortex. One animal was excluded because CBF increased in cortex during the 60-min occlusion period. Differences in the relationships between 30- and 60-min values were considered significant if the 60-min regression line fell beyond the 95% confidence limit of the 30-min regression line. Second, we compared the percent of hemispheric area showing injury by TTC staining with the area in which the absolute Dav value was less than 0.65 × 10⁻⁹ m2/s at 0.5, 1, 1.5, and 2 h after occlusion. Third, to study the time-dependent relationship between the Dav value and severity of injury, we compared the time necessary to reach one-to-one correlation between the percent hemispheric injury and the areas where Dav was reduced below either 0.7, 0.65, 0.6, or 0.55 × 10⁻⁹ m2/s during the first 2 h from the start of occlusion (including early reperfusion). At 2 h from the onset of occlusion, some cats showed hyperintensity on the T2-weighted images, indicating irreversible damage and infarction (Bose et al., 1988). Because infarction may lead to an increase in D value (Knight et al., 1991), no further correlations were made after this period. Because diffusion mapping allows monitoring of the stroke evolution at all times, all animals were included in the diffusion analysis.
RESULTS
Arterial pH, blood gases, hemoglobin, glucose, and blood pressure were unchanged during ischemia and reperfusion in both groups (Table 1).
Physiological variables at baseline, during 30 and 60 min of middle cerebral artery occlusion, and after reperfusion
Values are mean ± SD, Paco2, arterial partial pressure of carbon dioxide; Pao2, arterial partial pressure of oxygen; Hb, arterial hemoglobin concentration; MABP, mean arterial blood pressure. There were no differences over time for any of these variables in either group.
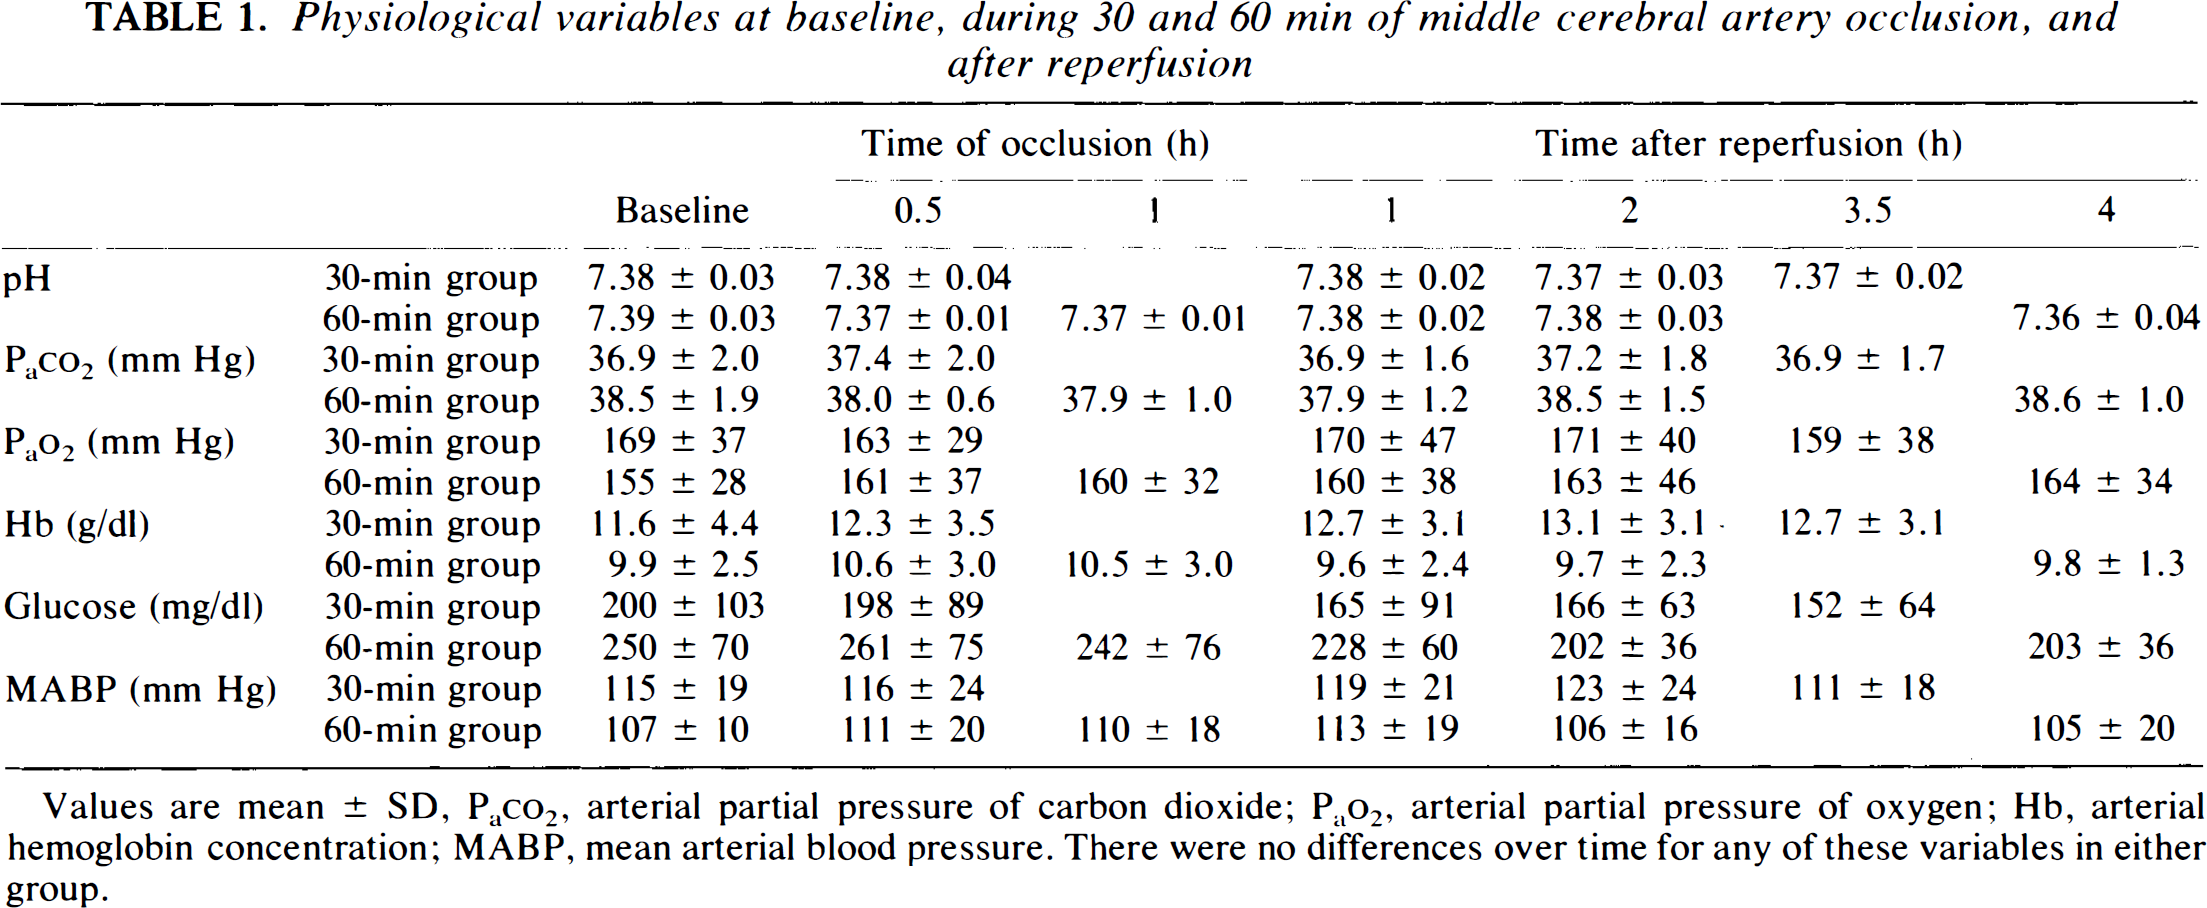
Figures 1 and 2 show a series of Dav images as a function of time with reversible and irreversible reductions in Dav, respectively. Earliest decreases in Dav (dark regions) were seen in the caudate nucleus. Areas of different diffusion constants varying from very low values in the ischemic core to almost normal values further from the core were observed after a variable length of time. When the occlusion was prolonged to 60 min, a gradual decrease in Dav was seen spreading from the core in the caudate nucleus to the cortex (Fig. 2). A dark region of lowered diffusion constant was visible in the anterior contralateral hemisphere in all 13 cats before, during, and after occlusion. This artifact is due to a chemical shift artifact from a lipid region near the eyes and is not visible on the ipsilateral side, where the eye is removed for access to the MCA.
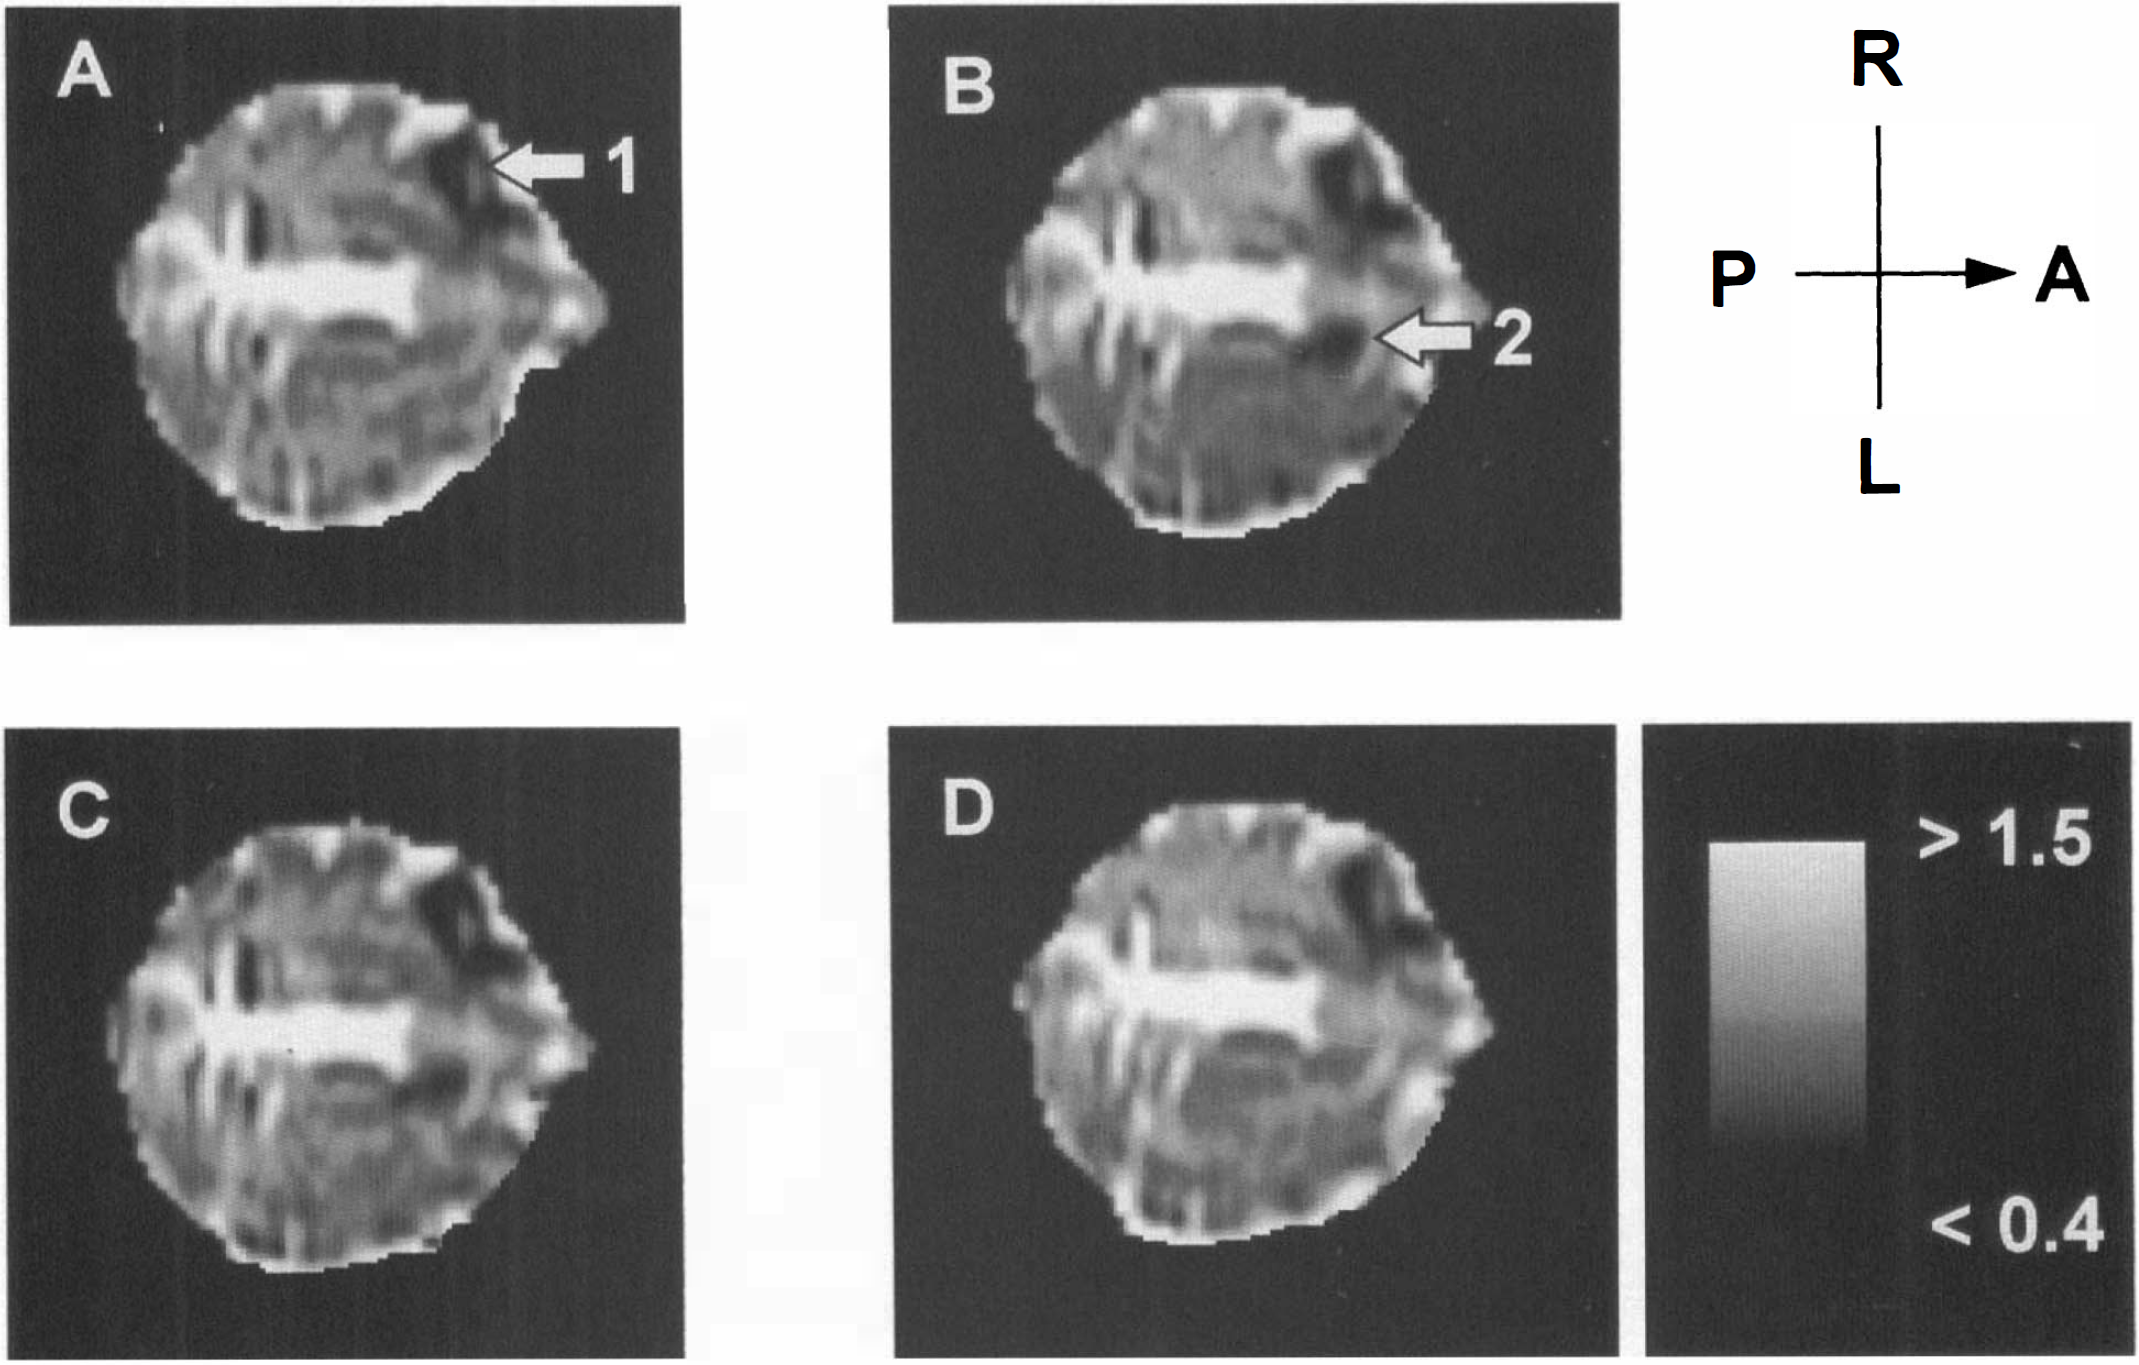
Illustration of the evolution of Dav in a 30′ middle cereral artery occlusion experiment with reversible changes in Dav and CBF (cat indicated by + in Fig. 3). The axial slice in this absolute diffusion image is chosen in the basal ganglia. The images are before occlusion
Illustration of the evolution of Dav in a 60′ middle cereral artery occlusion experiment with irreversible changes in Dav but reversible changes in CBF (cat indicated by + in Fig. 4). The axial slice in this absolute diffusion image is in the basal ganglia. The images are before occlusion
The average baseline values for Dav were 0.80 ± 0.08 × 10⁻⁹ m2/s in the caudate and 0.85 ± 0.07 × 10⁻⁹ m2/s in the hemisphere. Individual changes in Dav and CBF during 30 min (Fig. 3) and 60 min (Fig. 4) of MCAO indicated reductions in caudate in all cats and in the cortex in most cats. By 3.5 h of reperfusion in the 30′ MCAO group, Dav recovered to near baseline in caudate in 4 of 7 cats and in cortex in 5 of 7 cats. Dav remained above 70% of baseline during ischemia in those with reversible changes in Dav, whereas Dav decreased below 70% at least at one time point in those with irreversible changes. In the 60′ MCAO group, one cat had complete recovery of Dav in the caudate and this cat had the smallest reduction in Dav during MCAO. In the cortex, the three cats in the 60′ MCAO group with persistent reductions in Dav throughout reperfusion had the greatest reductions in Dav during ischemia. Thus, in both the 30- and 60-min groups and in both the caudate and cortex, there was a general correspondence between reversibility of Dav changes and the magnitude of changes in Dav during ischemia.
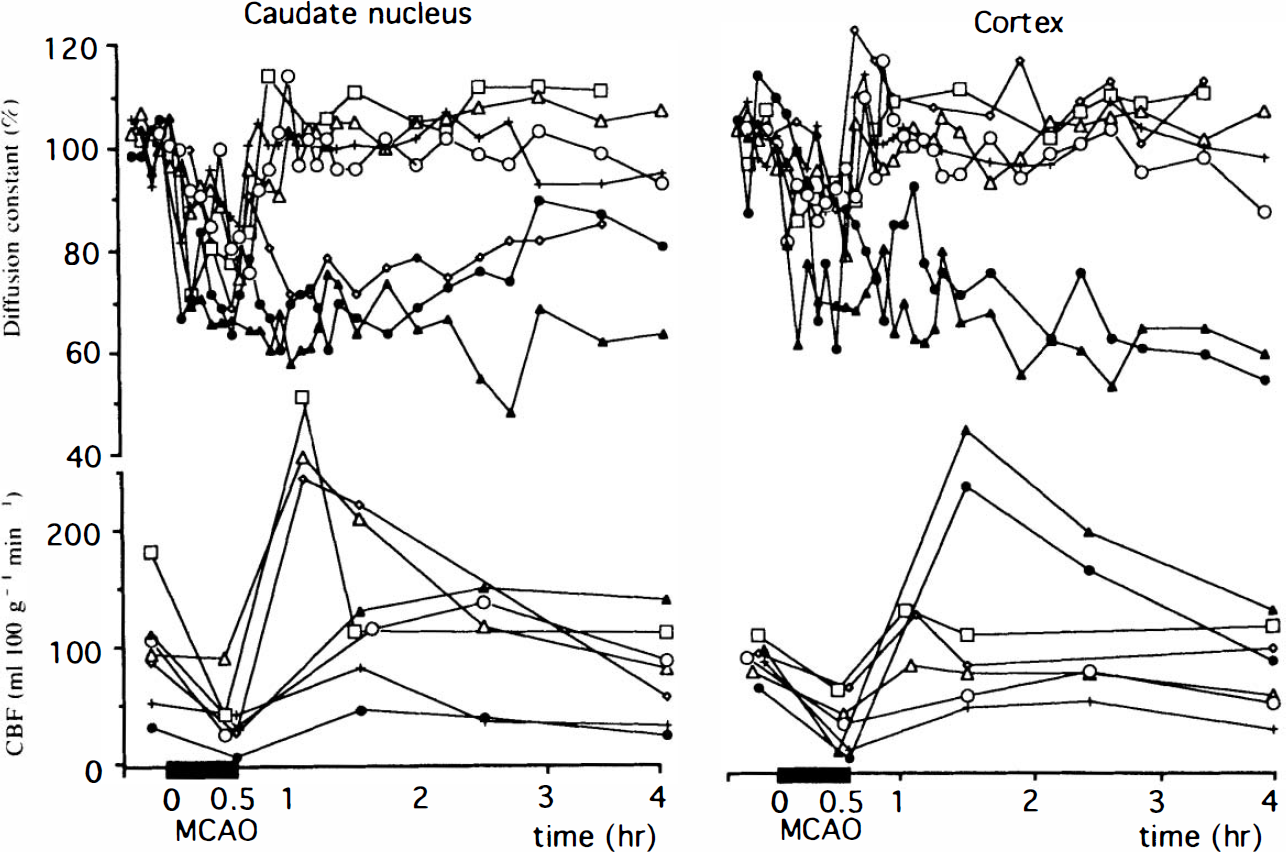
Time evolution for Dav and CBF in the caudate nucleus and the cortex for the 30′ middle cereral artery occlusion (MCAO) experiments (n = 7). Values for Dav are given as a percentage of control. The baseline values of Dav are 0.80 × 10⁻⁹ m2/s in the caudate nucleus and 0.85 × 10⁻⁹ m2/s in the cortex.
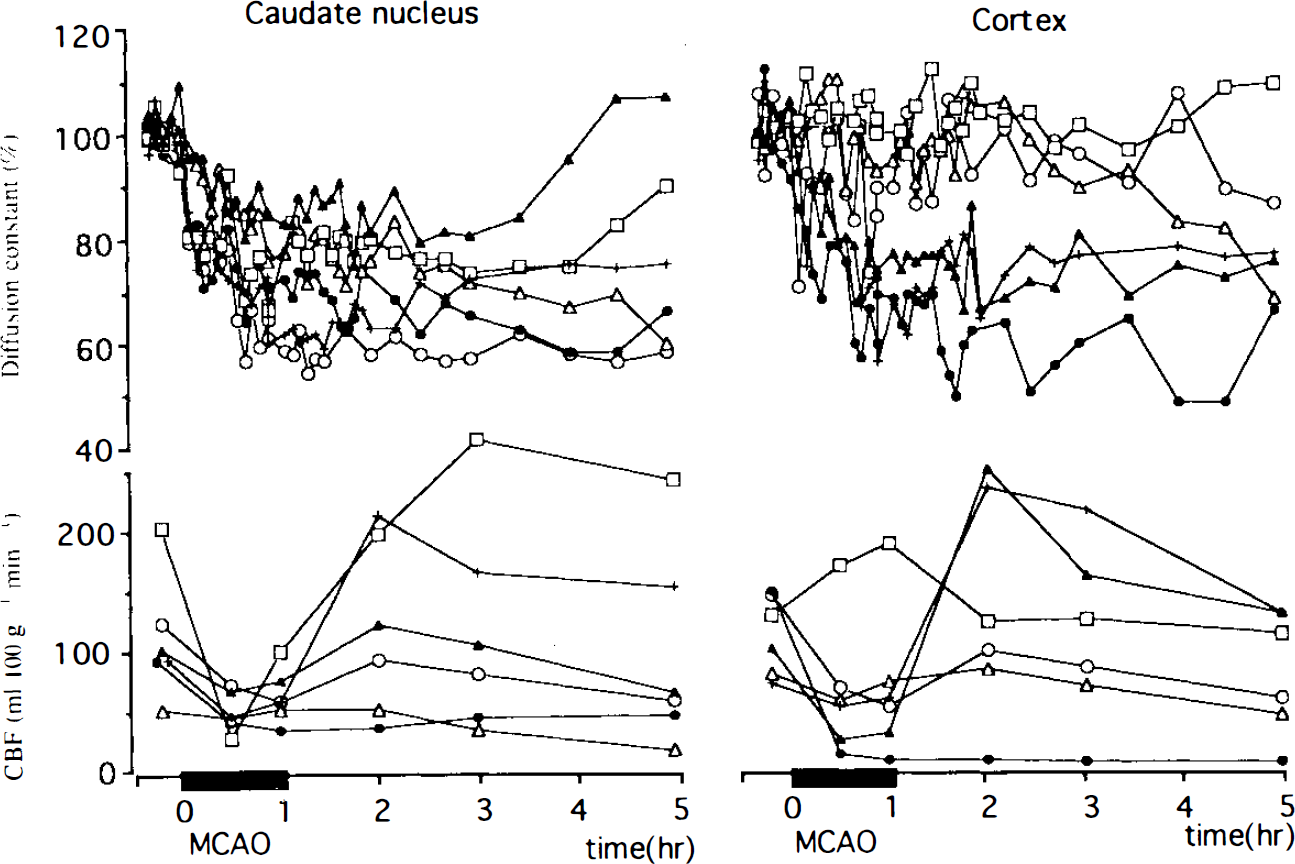
Time evolution for Dav and CBF in the caudate nucleus and the cortex for the 60′ middle cereral artery occlusion (MCAO) experiments (n = 6). Values for Dav are given as a percentage of control. The baseline values of Dav are as in Fig. 3.
There were significant correlations (Fig. 5) between Dav and CBF measured at 30 min of occlusion in both groups (n = 13) in caudate (r = 0.89; p < 0.0001) and cortex (r = 0.91; p < 0.0001), and measured at 60 min of occlusion in the 60′ MCAO group (n = 6) in the caudate (r = 0.88; p < 0.02) and cortex (r = 0.90; p < 0.04). The regression lines for the 60-min values lie below the 95% confidence limits of the regression lines for the 30-min values over nearly the entire CBF range (Fig. 5), indicating that for a given reduction in CBF during ischemia, Dav is lower at 60 min than at 30 min of occlusion. Thus, during occlusion, Dav is a function of both severity and duration of reduced CBF. During reperfusion, no correlation was found between CBF and Dav when CBF recovered in most cats. In two cats, caudate CBF did not increase substantially when the weight on the occluding suture was released (Fig. 4: closed circle and open triangle cases), suggesting that the MCA remained partially occluded.
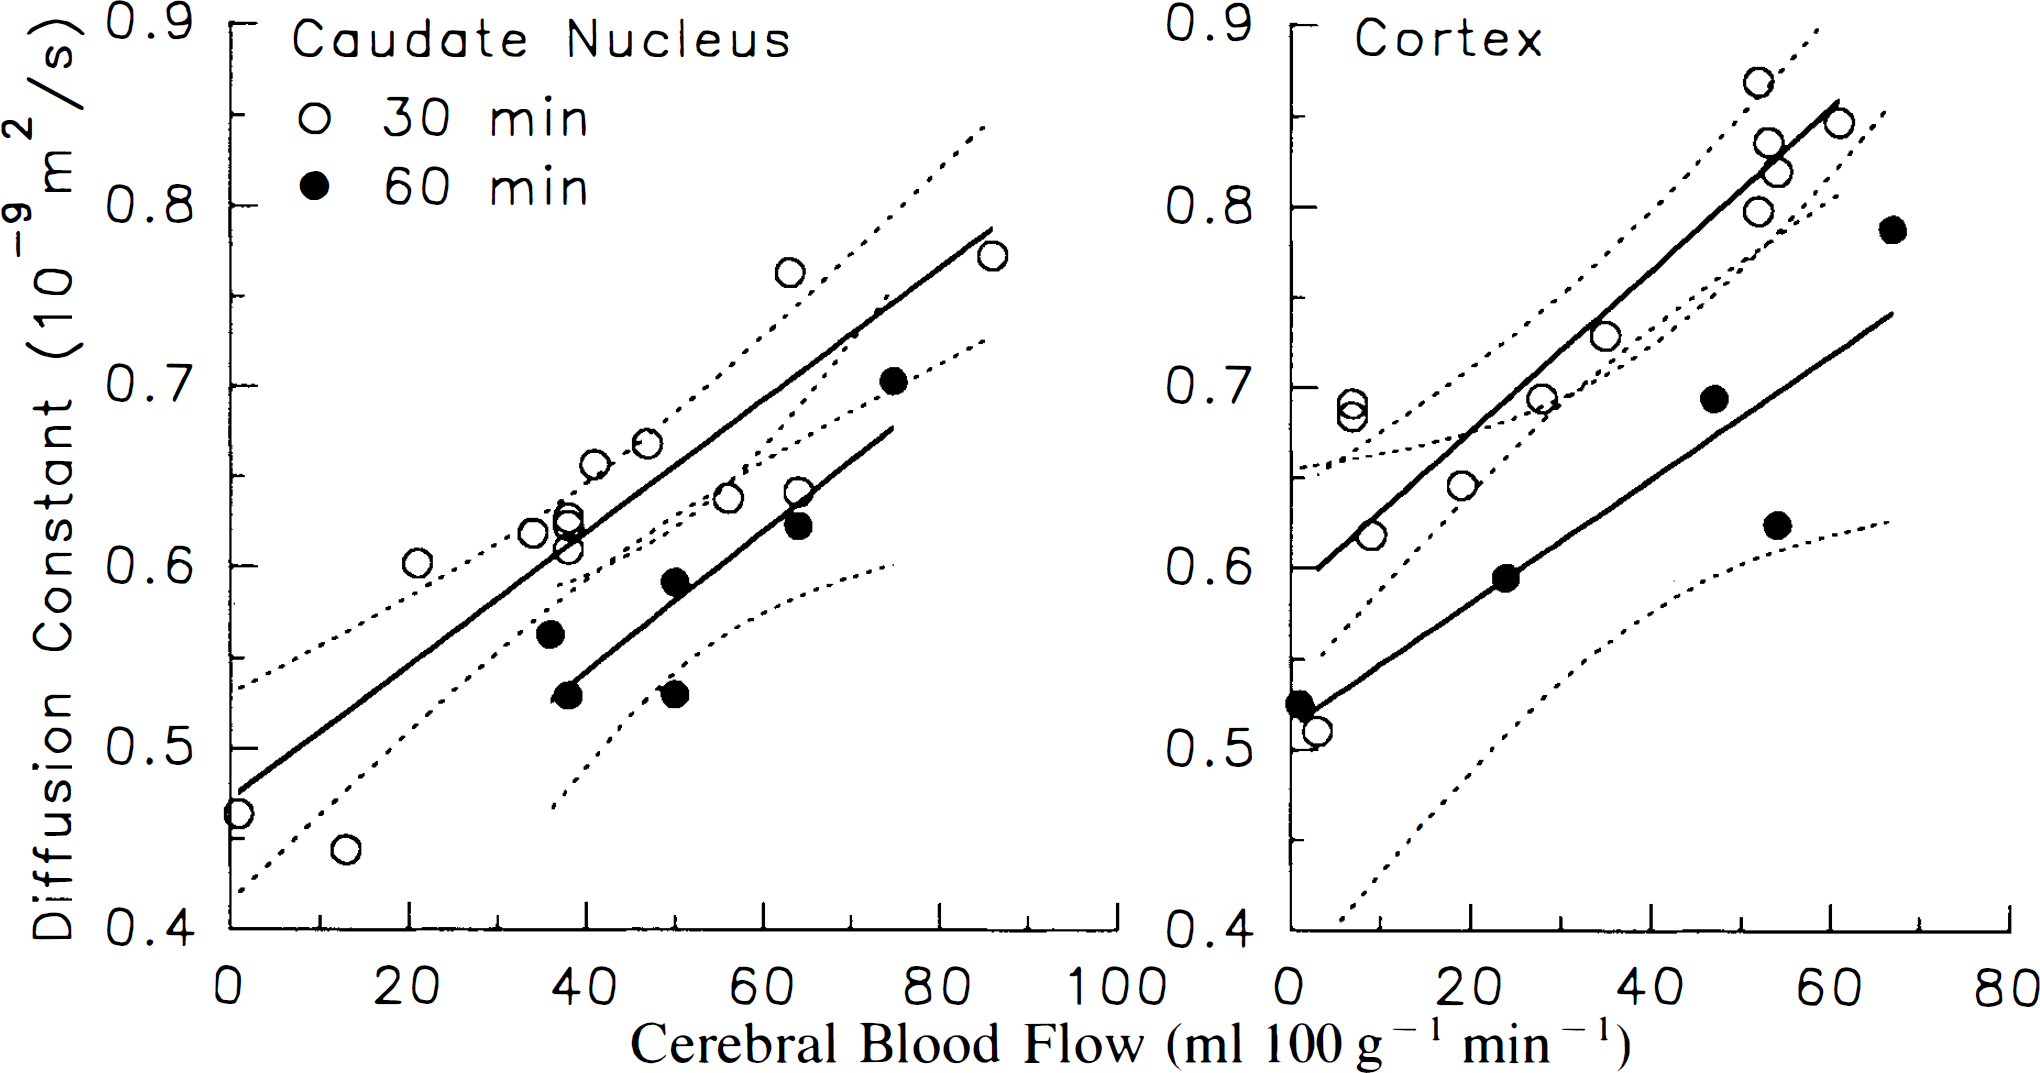
Correlation between CBF and Dav during middle cerebral artery occlusion (MCAO) in the caudate nucleus
Figure 6 shows the correlation between the percent area in which Dav < 0.65 × 10⁻⁹ m2/s at different times from the onset of occlusion and the percent of injured area determined by TTC staining. Caudate plus cortex were combined in this analysis. At 0.5 h from the onset of occlusion, the correlation was worse when including the cases where Dav was reduced only during the period of the occlusion (dashed line; r = 0.66; p < 0.02). If the five cats (four in the 30-min group and one in the 60-min group) showing recovery of Dav and 0% TTC injury are excluded (solid line at 0.5 h), an excellent correlation relation is found (solid line; r = 0.93; p < 0.0003) as early as 0.5 h of occlusion. However, the slope is >1, indicating that the ischemic region is still growing. At later times when Dav has recovered during reperfusion in the reversible cases and all data are included in the regression analysis, the correlations are all excellent. More importantly, the slope converges to 1.0 by the 2-h time point. The intercepts for all fits are smaller than a few percent and thus negligible within experimental error. The fact that they are nonzero may be due to some voxels with coincidentally lowered Dav values, e.g., due to some image artifacts.
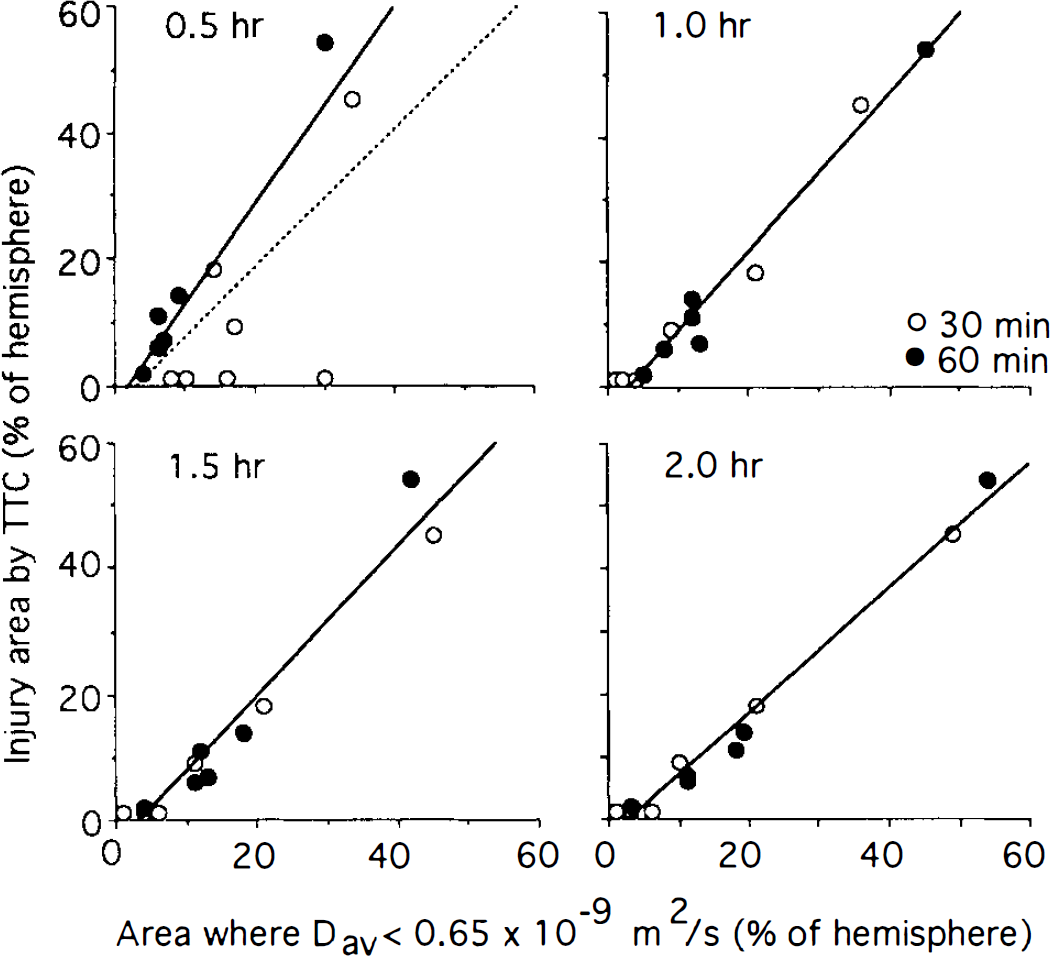
Correlation between percent hemispheric injury determined by triphenyltetrazolium chloride (TTC) and percent hemispheric region in which is Dav lower than 0.65 × 10⁻⁹ m2/s at different periods after the onset of occlusion. Data from 30 min (open circles) and 60 min (closed circles) were combined in the analysis. Due to recovery in some cats (0% injury with TTC), correlation is lower at 0.5 h than at later times. The dashed regression line at 0.5 h includes all data points, whereas the solid line excludes the five points with 0% TTC staining. At later times (when the five cats with 0% TTC injury had reversal of Dav after reperfusion), the solid line includes all points. The solid regression lines show a slope moving toward 1.0 for increasing time −0.5 h: slope = 1.54 (r = 0.93; p < 0.0003); 1 h: slope = 1.26 (r = 0.99; p < 0.0001); 1.5 h: slope = 1.17 (r = 0.98; p < 0.0001); 2 h: slope = 0.99 (r = 0.99; p < 0.0001).
We also determined the effect of choosing different thresholds of absolute Dav on the correlation of TTC-determined injury with areas of Dav below the chosen critical Dav value (Table 2). For lower critical Dav values, the slope of the regression line approaches 1.0 at later times. This is understandable because regions of very low Dav are small and some other regions showing injury by TTC staining may never have reached such a low Dav value. The fact that the slope decreases at later times again indicates spreading of the area of lower diffusion constant and thus of the injury. When the critical Dav value is relatively high (Dav < 0.70 × 10⁻⁹ m2/s), the regression slope becomes < 1 at 2 h, indicating that the area of reduced diffusion constant is greater than the injured area. Thus, at the diffusion time presently used (3.84 ms), the correspondence of injured area measured by TTC with area of reduced Dav approaches unity when a critical value of Dav < 0.65 × 10⁻⁹m2/s is used.
Correlation between percent hemispheric damage from 2,3,5-triphenyltetrazolium chloride with percent hemispheric area of reduced Dav for different critical values of Dav at different time points after occlusion (n = 13, except at t = 0.5 h, where n = 9 a )
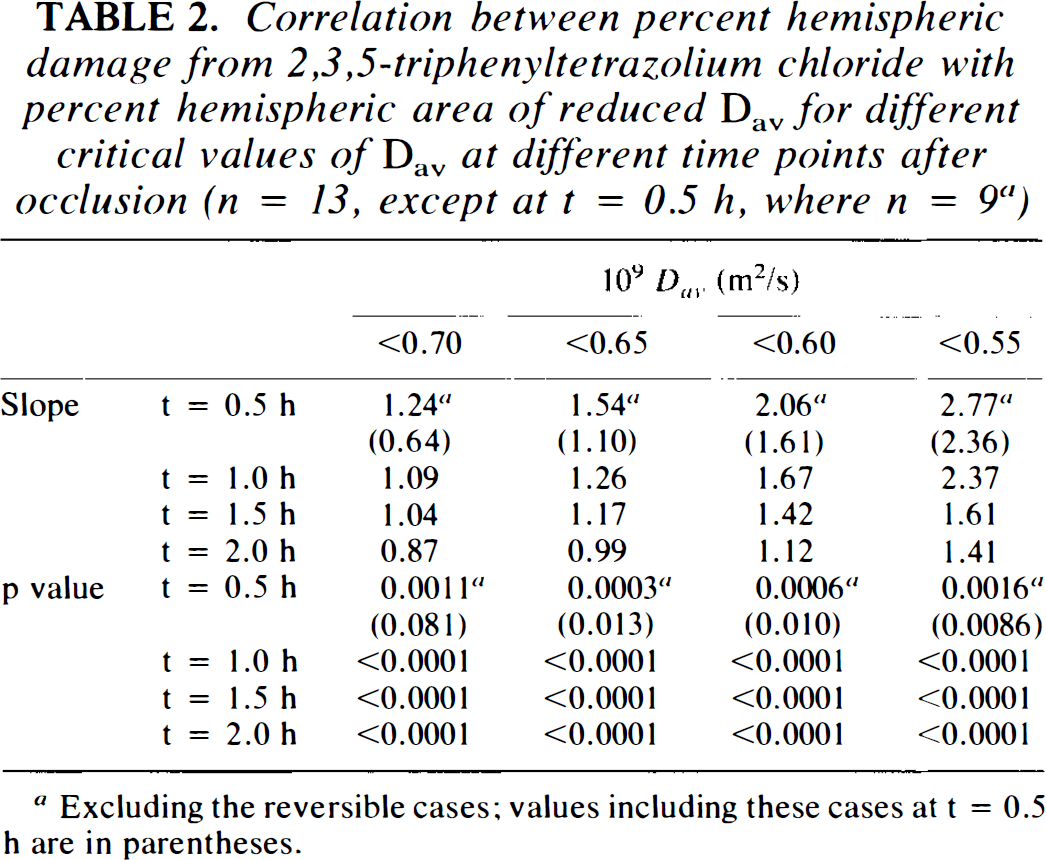
Excluding the reversible cases; values including these cases at t = 0.5 h are in parentheses.
DISCUSSION
By performing occlusion and reperfusion remotely with the cat remaining in the magnet, we were able to track the time course of Dav alteration with a time resolution of 4.8 min. We observed early decreases in Dav, particularly in the caudate. During occlusion (30 or 60 min), Dav usually continued to decrease and the area of reduced Dav expanded. If reperfusion occurred before Dav decreased to <∼70% of control (0.55–0.60 × 10⁻⁹ m2/s) for a sustained period (10–20 min), Dav alterations were usually reversible. Without timely reperfusion, the areas of hypoperfusion become irreversibly damaged. Our results show that the parameter Dav = 1/3Trace(D) = 1/3(Dxx + Dyy + Dzz) in the caudate nucleus and cortex correlates well with the extent of perfusion during MCAO (Fig. 5), but not on reperfusion (Figs. 3 and 4). The data also show excellent correlation between the value of Dav at a specific time after the onset of occlusion and the percent hemispheric injury measured by TTC (Fig. 6).
The fact that CBF and Dav do not correlate on reperfusion is expected, because CBF is only an index for perfusion, whereas Dav is an indicator of actual cellular status (intra/extracellular volume ratio, depolarization). Thus, the correlation between CBF and Dav during occlusion is a cause-effect phenomenon, in which a certain reduced perfusion leads to a certain extent of cellular risk as indicated by Dav. This expectation is borne out by the staining results, which show that the percent hemispheric injury depends not only on the length of the insult, but also on the value of Dav (Table 2). The lower Dav, the shorter the period of ischemia that leads to acute damage indicated by TTC staining. Our results show that serial Dav imaging can provide both the extent of risk and the actual time period at certain levels of risk. This capability makes the MCAO model very useful for stroke studies by removing the risk of not detecting potential variability in ischemic level when only CBF is used as an index, because CBF data cannot be measured continuously when using microspheres. One point of importance that has to be addressed is the absolute value of blood flow. With unilateral carotid occlusion in the gerbil, which reduces CBF throughout the hemisphere, a critical flow threshold for diffusion-weighted signal intensity of 15–20 ml/min/100 g was reported (Busza et al., 1992). A review of flow thresholds (Hossmann, 1994) suggests that the threshold may be as high as 41 ml/min/100 g during prolonged focal ischemia. Our study was not designed to determine the flow threshold with graded ischemia. However, Fig. 5 indicates that Dav is linearly related to CBF below 60 ml/min/100 g by 30 min of focal ischemia, and that the relationship shifts by 60 min. This result indicates that the flow threshold changes with ischemic duration, in agreement with recent results in rats (Kohno et al., 1995). The precise flow threshold cannot be determined from these data because there presumably was a spatial gradient of flow within the lateral segment of the cortical slab sampled for microsphere-determined cortical CBF. For caudate blood flow, we sampled the entire caudate to ensure an adequate number of microspheres. However, a portion of caudate remains well perfused by the recurrent artery of Heubner. This partial volume averaging will act to smooth the “knee” of a critical threshold relationship. Flow thresholds are also species dependent (Jacewicz et al., 1992) because of differences in metabolic rate and are anesthetic dependent because of flow-metabolism coupling. Use of halothane anesthesia in the present study in cats accounts for the relatively high cortical blood flows at baseline (100 ml 100 g−1 min−1) and during ischemia (range of 3–70 ml 100 g−1 min−1). Halothane anesthesia may also contribute to the variability in caudate blood flow seen at baseline. In a small group of three halothane-anesthetized cats, we measured a global CMRO2 value of 4.1 ml O2 100 g−1 min−1 (Nishikawa et al., 1994a), which suggests that this level of anesthesia does not markedly depress metabolism. Moreover, the arterial hemoglobin concentration in the cat (10–12 g/dl) is lower than that in rats and humans, and will act to increase the ischemic flow threshold.
Despite these limitations, it is interesting that the linear relationships in Fig. 6 indicate that a Dav < 0.65 × 10⁻⁹ m2/s is associated with a cortical blood flow of < 15 ml 100 g−1 min−1 at 30 min of ischemia and < 40 ml 100 g−1 min−1 at 60 min of ischemia. These flow values are similar to those obtained by others for brief (Busza et al., 1992) and prolonged (Hossmann et al., 1994) ischemia. The area of the brain with Dav < 0.65 × 10⁻⁹ m2/s also corresponded best with the injury area demarcated by TTC staining. These results are internally consistent with the flow threshold for ischemic injury increasing as ischemic duration is prolonged from 30 to 60 min. These results are also consistent with previous experience with this model in which MCA occlusion of 1–4 h results in CBF of 25–35 ml 100 g−1 min−1 in the inferior temporal cortex and TTC-determined injury volume of 18–30% of the hemisphere (Nishikawa et al., 1993, 1994a, 1994b).
It is also important to consider that the TTC staining of mitochondrial enzymes at 4–5 h after the initiation of ischemia may not precisely delineate eventual infarction. One study (Cole et al., 1990) reported that 3 h of ischemia plus 2 h of reperfusion resulted in a smaller injury volume than 3 h of ischemia alone, suggesting that an early component of injury in some areas not stained by TTC is reversible. Results at 4 h of ischemia (Park et al., 1988a) indicate that the area demarcated by TTC was larger than that measured by standard histology for neuronal damage. The area of pancellular necrosis leading to eventual infarction can continue to enlarge beyond 4–5 h (Dereski et al., 1993) and the area of infarction measured by standard histology and TTC closely agree by 24 h (Isayama et al., 1991; Lin et al., 1992). Therefore, the precise value of Dav correlating with injury at the 2-h point may differ from the 0.65 × 10⁻⁹ m2/s that we obtained in the present study.
A final question to be addressed is how reproducible the value of Dav is for absolute quantitation. First, motion artifacts can be sufficiently reduced in animals to allow accurate determination of D values. This is reflected in the magnitude of the Dav values measured. They agree well with earlier studies in which the individual tensor components were determined (Moseley et al., 1990b) and with the expected value for Dav at short diffusion time, as used here (tdif = 3.84 ms). In addition, no phase-encode artifacts occur in the strongly diffusion-weighted images, supporting the notion of absence of motion artifacts. Second, contrary to earlier studies in which individual tensor elements were measured, Dav is not dependent on the orientation of the subject with respect to the magnetic field gradients, as has previously been shown (van Gelderen et al., 1994b; Mori and van Zijl, 1995). Although Dav still contains an average restriction element and will depend on the length of the chosen diffusion time, there is a clear improvement in using Dav instead of single tensor elements, which may give arbitrary results depending on subject orientation. The diffusion time dependence is illustrated by the fact that our mean control Dav = 0.85–0.80 × 10⁻⁹ m2/s (measured at tdif = 3.84 ms) is larger than values reported by van Gelderen et al. (Dav = 0.77–0.67 × 10⁻⁹ m2/s), who measured at a range of tdif values between 20 and 2,000 ms. For the lowest ischemic values they measured Dav = 0.53–0.39 × 10⁻⁹m2/s, whereas we find Dav = 0.60–0.48 × 10⁻⁹ m2/s. However, it is very important to see that the mean relative drops in Dav (36 and 35%) are very similar, indicating that relative reductions (e.g., ipsilateral versus contralateral) may be the way to quantify changes in Dav. This will have to be proven in studies in which changes in Dav are measured at different diffusion times in the same animal. In this study we found that regions where Dav < 0.65 × 10⁻⁹ m2/s at 2 h postocclusion (∼78% of control) correlate excellently with the injury area outlined by TTC staining, whereas the region outlined for Dav < 0.70 × 10⁻⁹ m2/s (∼85% of control) is too large at this time. Because the region of Dav < 0.65 × 10⁻⁹ m2/s is included in the region with Dav < 0.70 × 10⁻⁹ m2/s, this result seems to indicate that drops in the diffusion constant that are smaller than 15–20% for 2 h do not indicate regions at immediate risk. However, we cannot exclude that longer ischemic duration with 15–20% reduction in Dav, or reperfusion beyond 4 h, would eventually lead to selective neuronal necrosis or eventual infarction in a particular region.
The reversible MCAO cat model used in this study resembles the pattern of human stroke, in which an ischemic core is found surrounded by regions of reduced perfusion rates. Based on the present results, we believe that Dav is an excellent predictor of the extent of risk for tissue damage in hypoperfused brain regions. Thus, imaging of Dav may prove useful for human studies in establishing an index on which therapeutic intervention can be based. However, human studies generally involve a single examination, whereas the present study shows that the absolute value of Dav is not predictive of outcome, unless used together with the length of the injury. Because T2 images show only irreversible ischemia (Bose et al., 1988), the combined use of diffusion and T2 imaging (Knight et al., 1994) should provide the areas at risk and the extent of the risk.
CONCLUSIONS
In summary, our data show that MR imaging of the average water diffusion constant (or the trace of the diffusion tensor) is a noninvasive means of early determination of the extent of ischemia in stroke. The data show that CBF is correlated with Dav during occlusion, but not during reperfusion. The absolute value of Dav is an indicator of the severity of the ischemic injury at specific times, but not necessarily of irreversible injury, because even areas with Dav values as low as 70% from baseline can recover. However, absolute Dav values at specific times are an indicator for the risk of TTC-determined injury. The data also show that the combined use of absolute values of Dav and the length of ischemia can predict the final injury region measured by TTC staining. Although this result does not mean that any single measurement of a decrease of Dav can be related to the extent of permanent damage, combined use of diffusion and T2 imaging should allow determination of the tissue regions that are irreversibly damaged (T2 hyperintensity) and that are still viable but at risk of infarction (lowered Dav), namely, the ischemic penumbra. This should facilitate decisions concerning therapy for acute stroke patients.
Footnotes
Acknowledgment:
This research is supported in part by National Institutes of Health grants NS31490 and NS 20020. Part of this work was done during the tenure of an established investigatorship from the American Heart Association (S. Eleff, P. C. M. van Zijl).