
Abstract
Fluorodopa (FDOPA) is an analogue of L-dihydroxyphenylalanine (L-dopa) used to assess the nigrostriatal dopamine system in vivo with positron emission tomography (PET). However, FDOPA/PET quantitation is complicated by the presence of the 3-O-methyl-FDOPA (30MFD) fraction in brain and plasma. Pretreatment with entacapone (OR-611), a peripheral catechol O-methyltransferase (COMT) inhibitor, greatly reduces the plasma 30MFD fraction and provides an ideal situation to evaluate the contribution of the plasma 30MFD fraction in several kinetic models of FDOPA uptake. We performed FDOPA/PET with and without the OR-611 preadministration in six Parkinson's disease (PD) patients. We measured the time-course of the plasma FDOPA and 30MFD fractions using high-pressure liquid chromatography (HPLC). We calculated striato-occipital ratios (SOR), and estimated the striatal FDOPA uptake rate constant graphically using the plasma FDOPA and occipital tissue time activity curves (KiFD and KiOCC, respectively). We also estimated striatal dopa decarboxylase (DDC) activity (k3D) using a model incorporating independent measurements of 30MFD transport kinetic rate constants. With the preadministration of OR-611, the pharmacological efficiency in plasma was prolonged significantly (21.1–37.7%; p < 0.01). We also observed significant mean elevations in SOR and KiOCC by 21.8 and 53.5%, respectively (p < 0.05). KiFD and k3D did not show significant change. We conclude that OR-611 prolongs the circulation time of FDOPA in the plasma but does not alter rate constants for striatal FDOPA uptake or decarboxylation.
Parkinson's disease (PD) is characterized by presynaptic nigrostriatal dopamine dysfunction. L-dihydroxyphenylalanine (L-dopa) remains the single most effective agent for the presynaptic treatment of PD (Cedarbaum et al., 1991). L-dopa is a large neutral amino acid (LNAA) that enters the brain via a carrier transport mechanism shared with other LNAAs (Oldendorf and Szabo, 1976; Morris, 1978; Nutt and Fellman, 1984; Leenders et al., 1986). In the brain, L-dopa is taken up by presynaptic dopaminergic terminals and converted to dopamine by the enzyme L-aromatic amino acid decarboxylase, or dopa decarboxylase (DDC) (Lloyd et al., 1975). When DDC is inhibited, L-dopa in the circulation is largely converted into catechol-O-methyldopa (30MD) by catechol-O-methyltransferase (COMT) (Nutt and Fellman, 1984). Due to this O-methylation, only a small fraction of orally administered levodopa (<10%) actually reaches the brain, even when there is maximal inhibition of decarboxylase (Mannisto and Kaakkola, 1989).
Methods for improving the bioavailability of L-dopa may help to prolong its antiparkinsonian effect. In this regard, there has been much interest in several new COMT inhibitors as adjuncts to L-dopa therapy (Backstrom et al., 1989) Of these, OR-611 (OR-611) appears to have utility in the treatment of L-dopa-related response fluctuations by blocking peripheral COMT activity (Linden et al., 1990; Mannisto et al., 1992; Kaakkola et al., 1994).
6-[18F]fluoro-L-dopa (FDOPA) is an analogue of L-dopa used to assess the presynaptic nigrostriatal dopamine system in vivo with positron emission tomography (PET). This method yields quantitative information on regional differences in FDOPA entry and metabolism in the brain. However, the kinetic analysis of FDOPA uptake is complicated by the presence of 3-O-methyl-FDOPA (30MFD) fraction in the brain (Gjedde et al., 1991; Huang et al., 1991; Kuwabara et al., 1993). Peripheral inhibition of 30MFD formation with COMT inhibitors provides an ideal situation to assess the contribution of the plasma 30MFD fraction in the kinetic models that have been developed to estimate striatal DDC activity. Several groups have reported the effect of COMT inhibition on striatal FDOPA uptake. Guttman et al. (1993) administered OR-611 to cynomolgus monkeys and found that striatal FDOPA accumulation showed a 2.3-fold increase, with no significant change in kinetic rate constants for FDOPA transport and decarboxylation. Sawle et al. (1994) found that OR-611 preadministration elevated the target-to-background ratio as well as striatal FDOPA uptake rate constants estimated with the use of tissue input function.
In this study, we performed FDOPA/PET to assess the effects of OR-611 on the systemic metabolism and striatal uptake of FDOPA using a comprehensive kinetic model (Dhawan et al., 1996). These results were compared with those obtained through the model of Kuwabara et al. (1993) to evaluate the sensitivity of each to the plasma 30MFD fraction.
MATERIALS AND METHODS
Subjects
We studied six patients (one woman and five men; mean ± SD age, 57.7 ± 13.6 years) with mild-to-moderate parkinsonism: Hoehn and Yahr stage I, four patients; Hoehn and Yahr stages II and III. one patient each (Hoehn and Yahr, 1967). Ethical permission for these studies was obtained from the Institutional Review Board of North Shore University Hospital/Cornell University Medical College. Written Informed consent for all subjects was obtained following a detailed explanation of the scanning procedure.
PET
PET studies were performed using Superpett 3000 tomograph (Scanditronix; Essex, MA, U.S.A.). The performance characteristics of this instrument have been described elsewhere (Robeson et al., 1993). This four-ring BaF2 time-of-flight, whole body tomograph acquires 14 PET slices with Z-axis gantry translation of one half-ring distance every 30 s. Each slice is 8-mm thick and reconstructed with an in-plane resolution of 7.5 mm—full width at half maximum (FWHM)—in high resolution mode.
Each patient was studied with FDOPA/PET on two occasions at least 1 week apart. In each study, patients fasted overnight prior to PET scanning. All antiparkinsonian medications were discontinued at least 12 h before PET investigations. All patients received 200 mg carbidopa 90 min before the study to inhibit decarboxylation. At each scanning session, patients were randomly assigned an additional premedication, either OR-611 (400 mg) or placebo, 60 min before the study. Those who received OR-611 in the first study were given placebo in the second, and vice versa.
Patients were positioned in the scanner using the Laitinen stereoadapter (Hariz and Erikson, 1986) with three-dimensional laser alignment with reference to the orbitomeatal line. A cylindrical tube filled with 68Ge was placed in the field of view to provide real-time calibration for each slice. All studies were performed with eyes open in a dimly lit room and minimal auditory stimulation. FDOPA was produced according to the radiochemical synthesis of Luxen et al. (1990), and was > 95% radio-chemically pure. Then, 260–370 MBq (7–10 mCi) of FDOPA in 20–25 ml saline was injected into an antecubital vein over 45 s with an automated infusion pump. The transit time from injection point to the brain (brain delay) was measured by the coincidence counter on the scanner. Emission scanning began simultaneously with the start of the FDOPA injection, and continuous scan data were acquired in list mode between 0 and 100 min postinjection. PET images were reconstructed with a correction for tissue attenuation of 511 KeV gamma-radiation measured with an external 68Ge source. PET reconstructions were also corrected for random coincidence, electronic dead time, and scatter effects.
The time course of plasma 18F radioactivity was determined by radial arterial blood sampling followed by plasma centrifugation. Sixteen 9-s samples were taken by a precision peristaltic pump followed by nine discrete samples taken at 3.5, 5, 10, 25, 40, 65, 75, 85, and 100 min postinjection. Because the first 16 arterial samples were collected using a pump, an appropriate smearing correction was applied (Dhawan et al., 1988).
High-performance liquid chromatography (HPLC) analysis
In each of the paired FDOPA/PET studies, the specific time course of plasma activity for FDOPA and its principal metabolite, 30MFD, was measured using HPLC with radiochemical detection. The five blood samples taken at 10, 25, 40, 65, and 85 min postinjection were centrifuged in order to separate plasma for HPLC. The details of the HPLC analysis are described elsewhere (Eidelberg et al., 1993; Firnau et al., 1988). Two major peaks corresponding to FDOPA and 30MFD were distinguished; a small peak from an unknown metabolite was also observed overlapping the FDOPA peak. A chromatography curve-fitting program (“Peakfit”, Jandal Scientific, San Rafael, CA, U.S.A.) was employed to separate the peaks and calculate the ratio of area under curves for FDOPA and its metabolites.
We assessed the pharmacokinetics of FDOPA by calculating the pharmacokinetic circulation time, θTFD (θTFD = ∫T0 CaFD (t)dt/CaFD (T)), where CaFD (t) is the radioactivity concentration of FDOPA in plasma as a function of time and CaFD (T) is the concentration at specific time, T. This parameter indicates the time needed for a bolus-delivered substance to achieve the same availability achieved by maintaining the plasma concentration constant (Gjedde, 1981). We also calculated an index of pharmacokinetic efficiency, Ep[Ep = (T/θTFD) × 100%], where θTFD is the pharmacokinetic circulation time at specific time, T (Guttman et al., 1993).
Image analysis
Region of interest (ROI) analysis was performed on 256 × 256 PET reconstructions using a SUN microcomputer (490 SPARC Server, Sun Microsystems, Mountain View, CA, U.S.A.) and Scan/VP software (Spetsieris et al., 1993). Striatal and occipital ROIs were identified by visual inspection with reference to a standard neuroanatomical atlas (Talairach and Tournoux, 1988). Elliptical ROIs were placed so as to encompass the whole striatum (mean 90 pixels/striatum; pixel size 4 mm2), and identical ROI size was used for the two studies in the same subject. Background count rates were determined separately for an occipital ROI (mean size 350 pixels), which was placed on composite PET slices with reference to the first 10-min scan so as to avoid activity in the transverse sinuses and torcula.
Kinetic measures for the striatal FDOPA uptake were calculated graphically by the multiple time graphical approach (MTGA) (Patlak et al., 1983; Patlak and Blasberg, 1985) using the time course of striatal radioactivity and each of two input functions. The first input function for plasma FDOPA was determined using plasma arterial blood sampling and HPLC analysis as described above. The time course of specific (background subtracted) striatal concentration divided by plasma FDOPA activity was plotted against the ratio of the plasma time integral to the plasma FDOPA concentration. In the MTGA, the slope of the line represents the rate constant of FDOPA uptake into the striatum, KiFD (Eidelberg et al., 1993). Striatal uptake rate constants obtained in this way were designated KiFD (Eidelberg et al., 1993; Takikawa et al., 1994). The second input function consisted of the time course of occipital 18F activity. In this analysis, we determined the occipital 18F time-activity curve in serial PET images acquired over a full 100-min interval beginning at the time of injection. The time course of striatal/occipital activity was plotted against the ratio of integrated occipital-to-occipital activity to obtain striatal K1 values, designated KiOCC (Brooks et al., 1990; Takikawa et al., 1994).
We determined striatal DDC activity by two methods. For the first method, we previously found that values of striatal DDC activity estimated from population mean values of 30MFD transport rate constants (designated k3D (pop)) are significantly correlated with the actual k3D values calculated using individual subject K1M and k2M values obtained with adjunctive 30MFD/PET (Ishikawa et al., 1996). We therefore employed population mean K1M and k2M values [K1M = 0.0400 (ml/min/g), k2M = 0.0420 (min−1) for striatum; K1M = 0.0371, k2M = 0.0468 for frontal cortex; K1 and k2 are the unidirectional blood-brain and fractional brain-blood clearances for FDOPA and 30MFD (with superscripts D and M, respectively) (see Fig. 1)] for the calculation of striatal k3D (pop) in this study. In our four-compartment model (Dhawan et al., 1996), we set the values of k5D, k7D, and k9D all to 0 min−1 [k5D is the O-methylation coefficient of FDOPA, k7D is the lumped O-methylation and oxidation coefficient of fluorodopamine (FDA), and k9D is the fractional clearance from brain of diffusible FDA metabolites (see Fig. 1)] and estimated frontal and striatal K1D, k2D, k3D (pop), and Vb, the brain vascular volume. In a second compartmental modeling approach, we used the model of Kuwabara et al., 1993 (Model M2) and estimated striatal K1D, k3D (M2), and Vb with several predetermined q values (q = K1M/K1D = 0.5, 1.0, 1.7, 2.3, and 3.0). These q values were selected based on the following estimates: 2.3 (Reith et al., 1990), 1.7 (Huang et al., 1991), and 1.0 (based on our combined 30MFD and FDOPA/PET measurements). These calculations were performed using software for the statistical analysis of nonlinear models (PCNONLIN, SCI Software, Lexington, KY, USA).
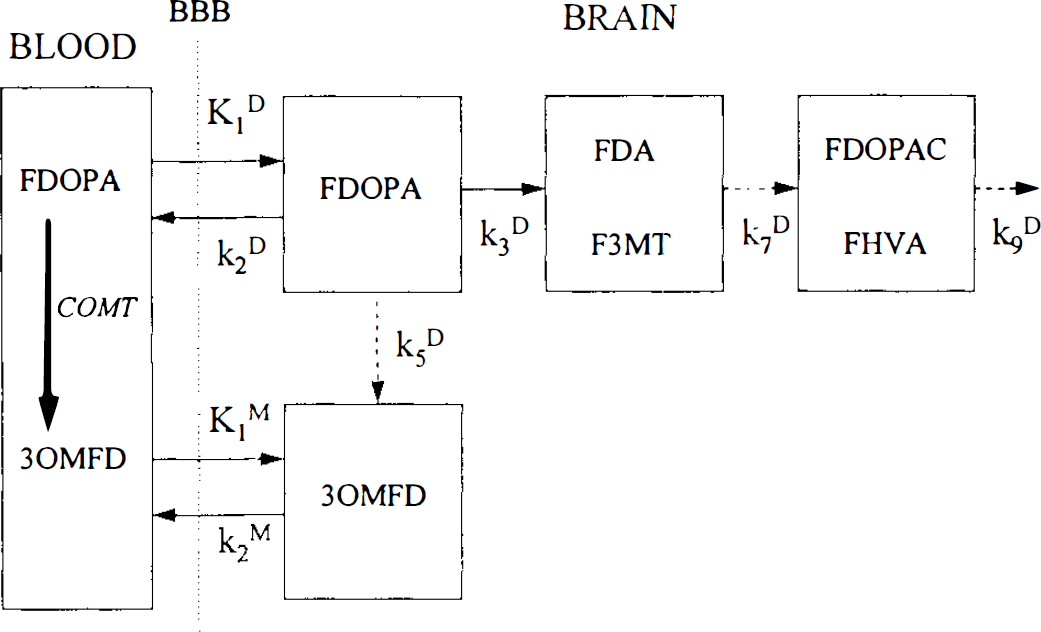
The compartmental model for the biodistribution of 6-[18F]fluoro-L-dopa (FDOPA). This model has been previously published by Kuwabara et al., (1993) and is shown here for quick reference. The nomenclature has also been kept the same for comparison purposes. Rate constants shown (dotted) are to emphasize the marginal contribution of these processes for a 100-min study. COMT, catechol O-methyltransferase; 30MFD, 3-O-methyl-FDOPA; FDA, fluorodopamine; F3MT, 3-methoxy-6-[18F]fluorotyramine; FDOPAC, 6-[18F]fluorophenylacetic acid; FHVA, 6-[18F]fluorohomovanillic acid; FDA and FMT are considered to be nondiffusible metabolites, whereas FDOPAC and FHVA are considered to be diffusible metabolites. The rate constant k3D represents the crucial DDC step, which is assumed to underly the dysfunction in Parkinson's disease; k7D represents the conversion of FDA to FDOPAC, and FHVA and k9D is the rate of loss of diffusible metabolites. A very small amount of O-methylation of FDOPA to 30MFD in the brain is shown by the rate constant k5D.
Based on the striatal kinetic rate constants [K1D, k2D, k3D (pop)] estimated from our model, we calculated the following measures: The striatal distribution volume of FDOPA [Vcstr = K1D/(k2D + k3D)], the fraction of free FDOPA [fDOPA = k2D/(k2D + k3D)], the fraction of FDOPA that proceeds towards FDA synthesis [fto DA = k3D/(k2D + k3D)], and the distribution volume of FDOPA that participates in FDA synthesis (Veto DA = Vestr × fto DA). We also calculated composite rate constants of FDOPA uptake: KD and KD′ [KD = K1D × k3D/(k2D + k3D); KD′ = k2D × k3D/(k2D + k3D)] (Patlak and Blasberg, 1985).
In addition to the above kinetic analysis, we also calculated the striato-occipital ratio (SOR) (Takikawa et al., 1993) by dividing striatal count rates by occipital count rate measured on the last 10-min scan (90–100 min postinjection).
Statistical analyses
The following statistical procedures were performed using SAS (SAS Institute; Cary, NC, U.S.A.): (a) The mean % fraction of plasma FDOPA metabolites were compared with and without OR-611 pretreatment using repeated measures analysis of variance (ANOVA). θTFD and Ep values were also compared with and without OR-611 using the paired Student's t-test. (b) The mean of left and right striatal KiFD, KiOCC, and SOR values, and estimates of striatal DDC activity, (striatal k3D (pop) and striatal k3D (M2)) derived with different choices of q, were compared with and without OR-611 pretreatment using the paired Student's t-test. (c) We compared the mean of left-right values of striatal and frontal Vc the partition volume, of FDOPA [Ve = K1D/k2D] with and without OR-611 using the paired Student's t-test. (d) The mean of left-and-right values for Vcstr, fDOPA, fto DA, Veto DA, KD, and KD′ with OR-611 were compared to corresponding values without OR-611 using the paired Student's t-test. (e) We correlated individual left and right KD and KD′ values with corresponding KiFD and KiOCC values, respectively, by computing Pearson product-moment correlation coefficients.
RESULTS
Plasma analysis
Without COMT inhibition, 30MFD is the predominant metabolite at 20–30 min (Fig. 2, left panel). At 85 min postinjection, the fraction of 30MFD reached 70% and the fraction of FDOPA decreased to <20%. An average of 10% of the total radioactivity was from an unknown metabolite. With OR-611 (Fig. 2, right panel), the 30MFD fraction was significantly inhibited to <20% at the end of the study (p < 0.001). The FDOPA fraction, by contrast, increased significantly (p < 0.01), remaining >50% throughout the study. The fraction of the unknown metabolite increased significantly to 30% after 30 min (p < 0.05). Overall, the mean proportion of FDOPA in plasma at 85 min increased from 17 to 50% through the use of OR-611.
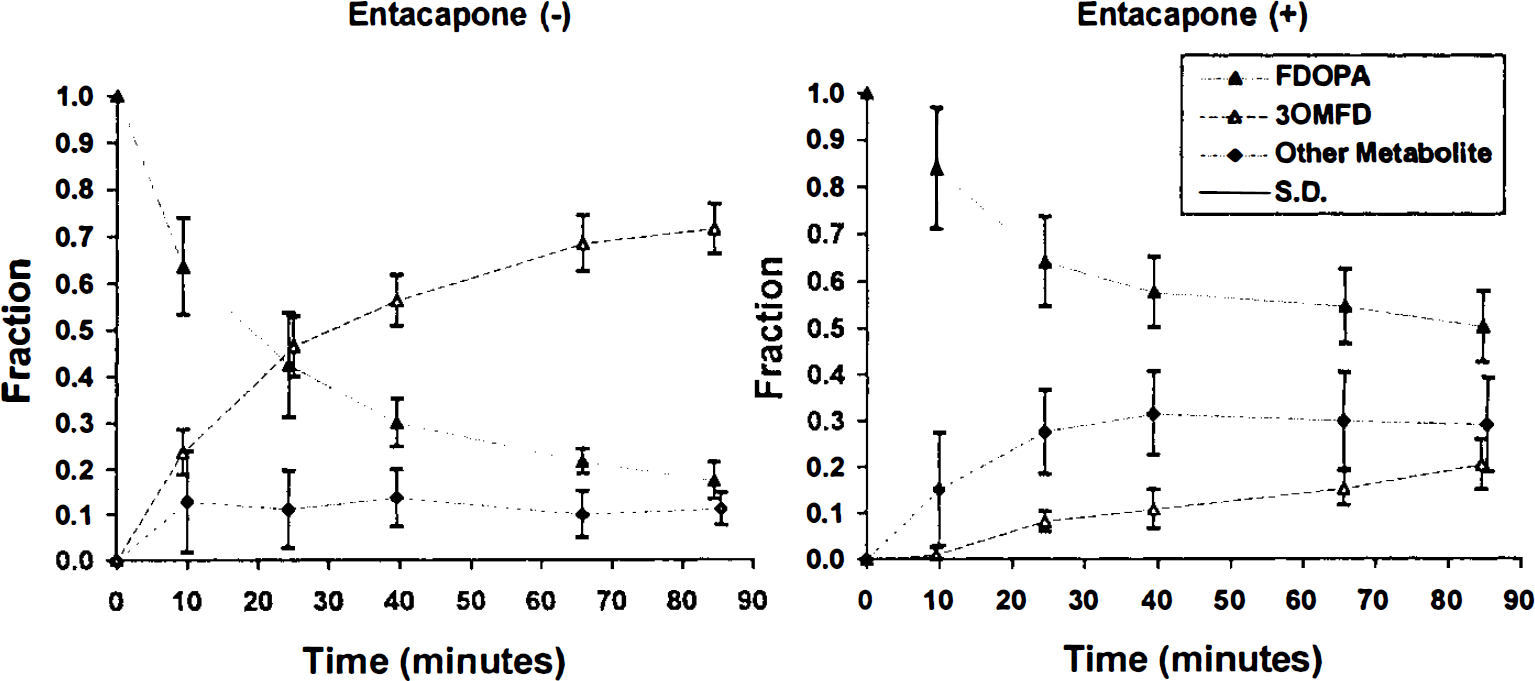
The time courses of plasma FDOPA metabolites are shown with and without OR-611 pretreatment (right and left panels, respectively). Error bars represent ± 1 SD. The 30MFD fraction was significantly inhibited with OR-611 (OR-611) preadministration to <20% at the end of the study (p < 0.001). By contrast, the FDOPA fraction increased significantly (p < 0.01) with OR-611, being maintained at >50% throughout the study. With OR-611 pretreatment, the fraction of the unknown metabolite(s) increased significantly to 30% after 30 min (p < 0.05).
The values of the pharmacokinetic circulation time of FDOPA, θTFD, and the pharmacokinetic efficiency, Ep, with and without OR-611 appear in Table 1. Mean θTFD decreased significantly from 271.0 to 146.7 min (p < 0.001), and mean Ep increased significantly from 21.2 to 37.7% with OR-611 pretreatment (p < 0.001).
Estimated parameters (primary) with and without OR-611 pretreatment
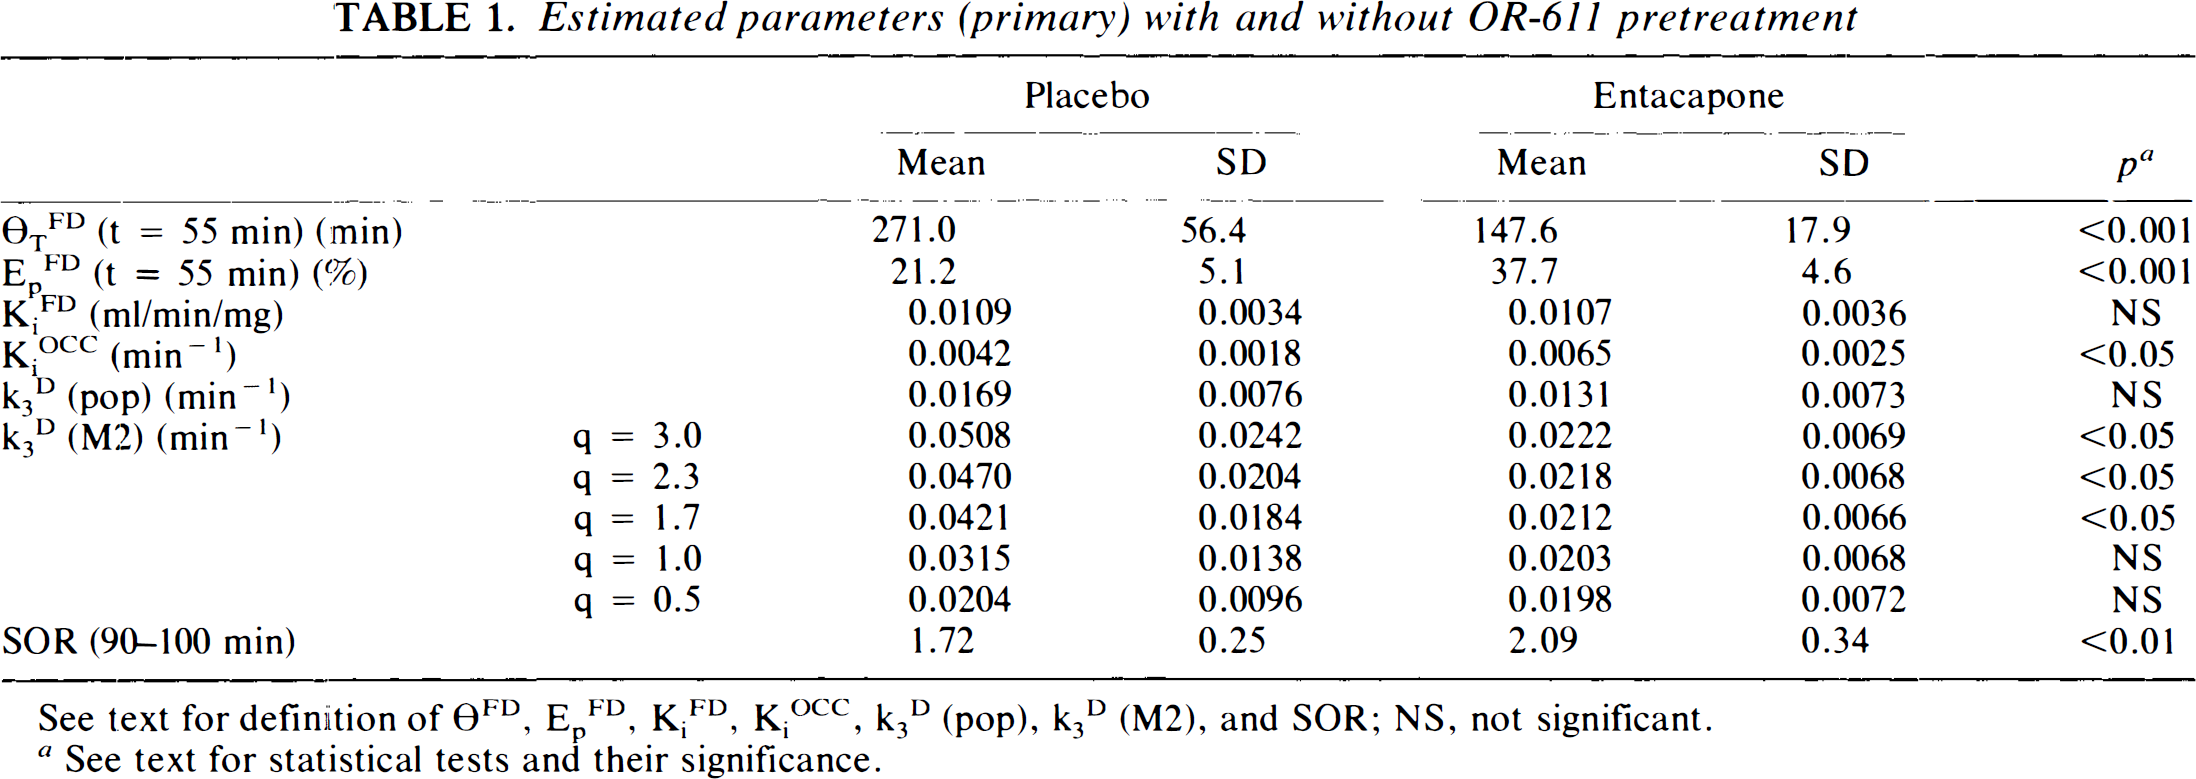
See text for definition of θFD, EpFD, KiFD, KiOCC, k3D (pop), k3D (M2), and SOR; NS, not significant.
See text for statistical tests and their significance.
PET analysis
Mean values and SD for SOR, striatal KiFD, KiOCC, k3D (pop), and k3D (M2) calculated for several q values are given in Table 1. Changes of individual values in striatal KiFD, Kiocc and SOR with and without OR-611 appear in Fig. 3A. Striatal DDC activity, k3D (pop) and k3D (M2), are presented in Fig. 3B. There was no significant difference in KiFD with and without OR-611. KiOCC values were, however, significantly increased in all cases with OR-611 premedication (mean change 53.5%, p < 0.01). SOR was increased by an average of 21.8% with OR-611 pretreatment (p < 0.05), due to a 3% increase in the proportion of the injected dose within the striatum and a 13% decrease in the proportion of the injected dose in the occipital cortex.
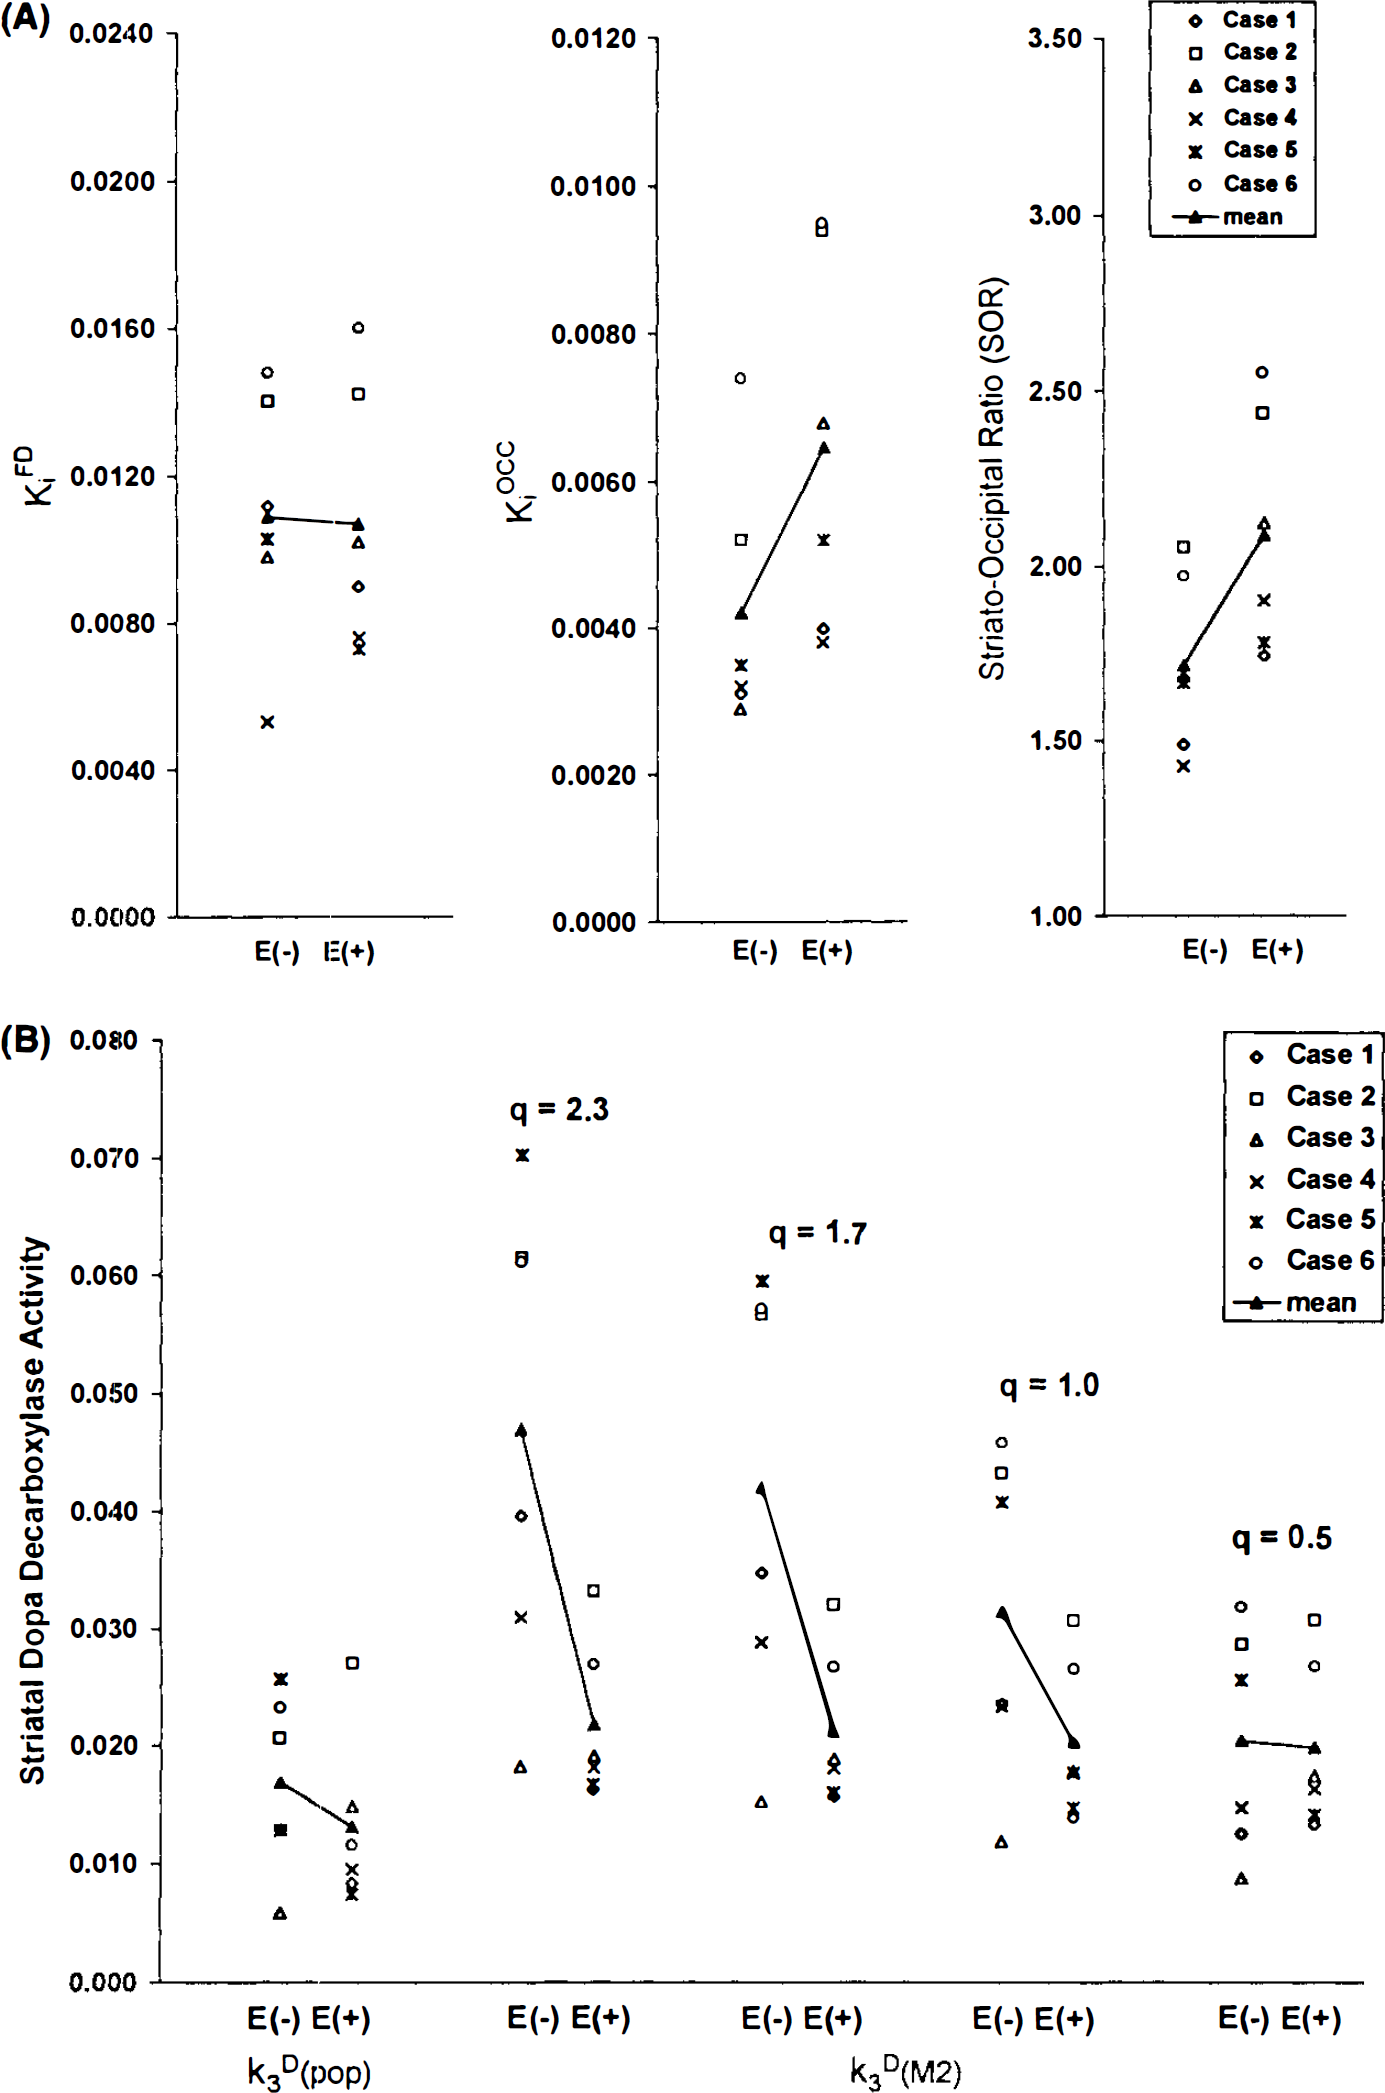
With regard to striatal DDC activity, k3D (pop) did not show significant change with OR-611 pretreatment. On the other hand, k3D (M2) values decreased by pretreatment for all q ≥ 1.7 (p < 0.05). With OR-611 pretreatment, k3D (M2) values were variable at all choices of q, as compared with values obtained without COMT inhibition. Ve, the partition volume of FDOPA, did not show significant change with or without OR-611 in either frontal cortex or striatum. Ve values in the striatum were observed to be higher than those in the frontal cortex by an average of 20%, irrespective of treatment status (Fig. 4).
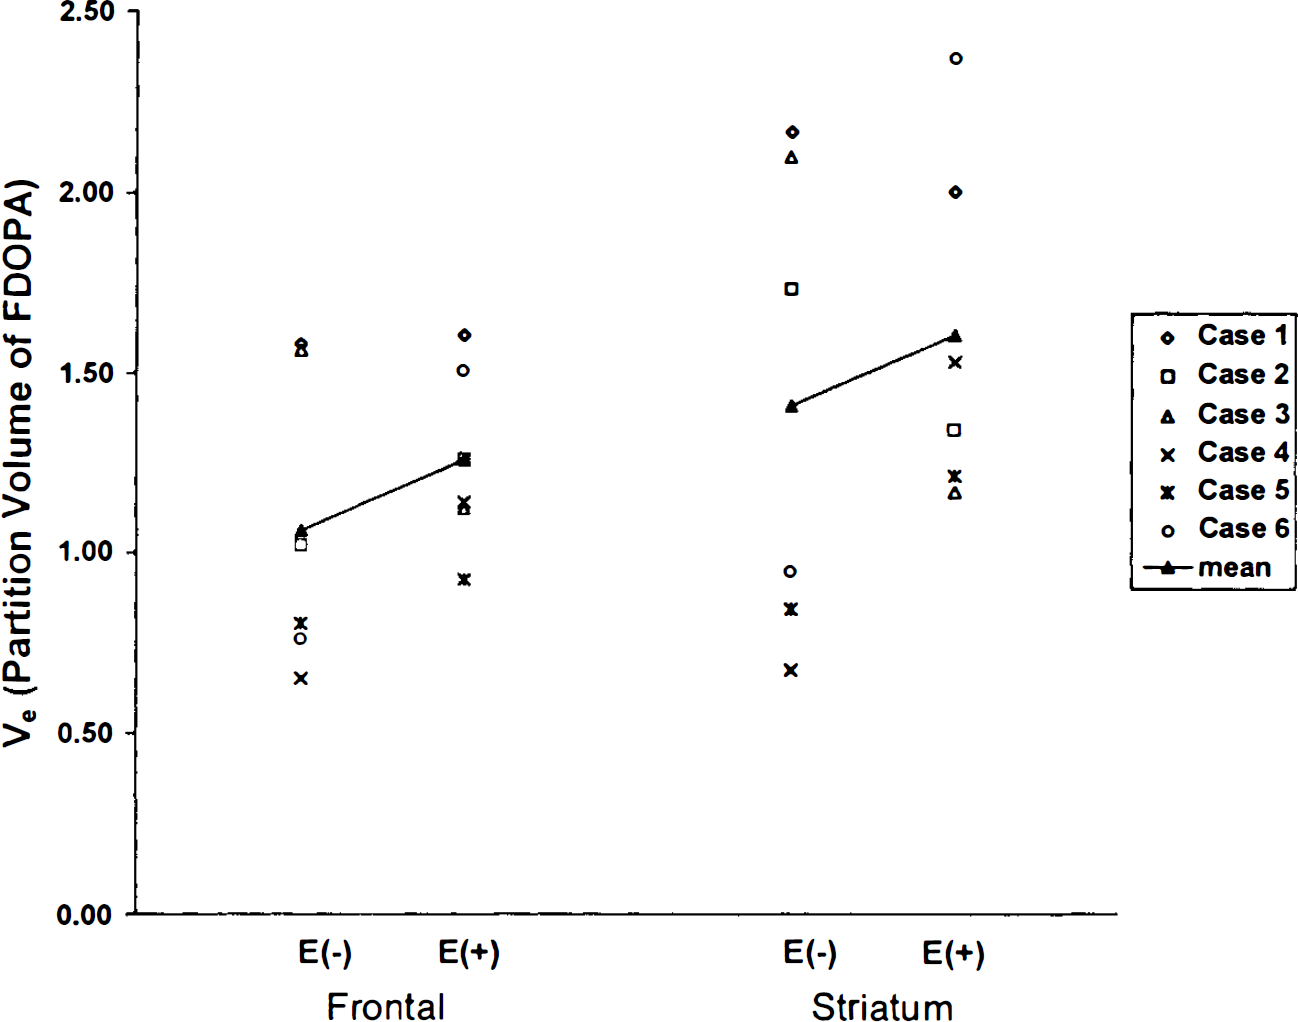
Individual (right-left mean) values for striatal and frontal FDOPA partition volumes with (E +) and without (E –) OR-611 pretreatment, respectively. Closed triangles (▴) and connecting lines represent changes in the mean values of the E+ and E– treatment groups. Ve did not show significant change with OR-611 pretreatment in either frontal cortex or striatum. Ve values in the striatum are observed to be significantly higher than those in the frontal cortex by an average of 20%, irrespective of treatment status (p < 0.05).
None of the calculated functional indexes, such as Vestr, FDOPA,fto DA, Veto DA, KD, or KD′, showed significant change with OR-611 preadministration (Table 2). Changes in KD and KD values are presented in Fig. 5. KD values are highly correlated with KiFD with and without OR-611 (r = 0.88 and 0.75 for the treated and untreated states, respectively; p < 0.01 for both correlations) (Fig. 6, left panel). KD values correlated significantly with KiOCC values for both treatment conditions (r = 0.61 and 0.60, respectively; p < 0.05 for both). However, the slopes of the regression lines between KiOCC and KD′ tended to be different in the two treatment states (36.1% difference, p = 0.06) (Fig. 6, right panel).
Estimated parameters (secondary) with and without OR-611 pretreatment
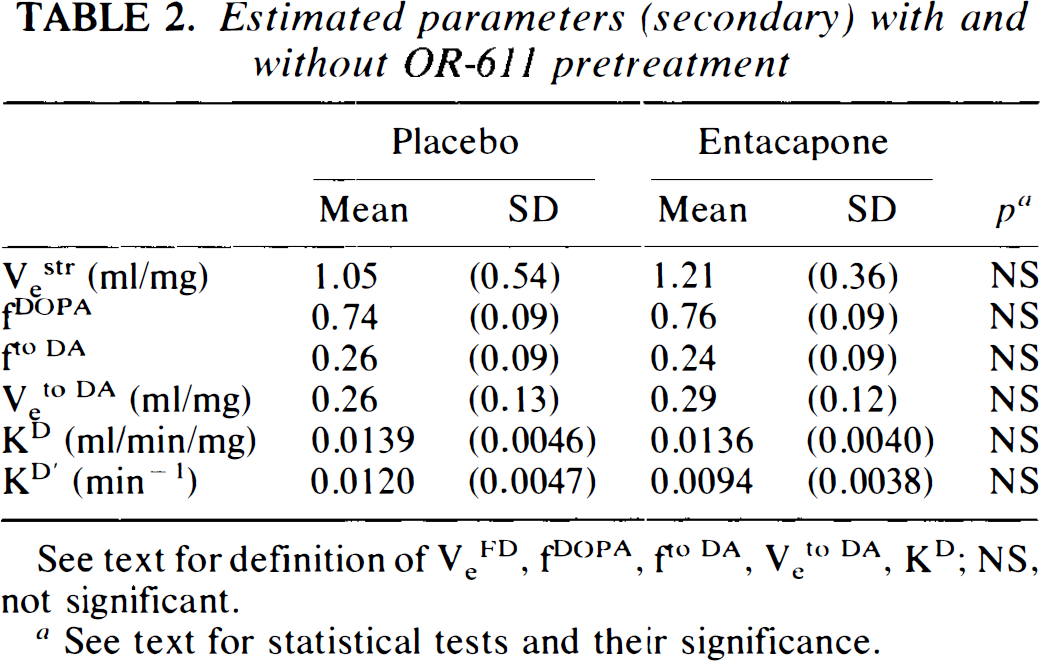
See text for definition of VeFD, fDOPA, fto DA, Veto DA, KD; NS, not significant.
See text for statistical tests and their significance.
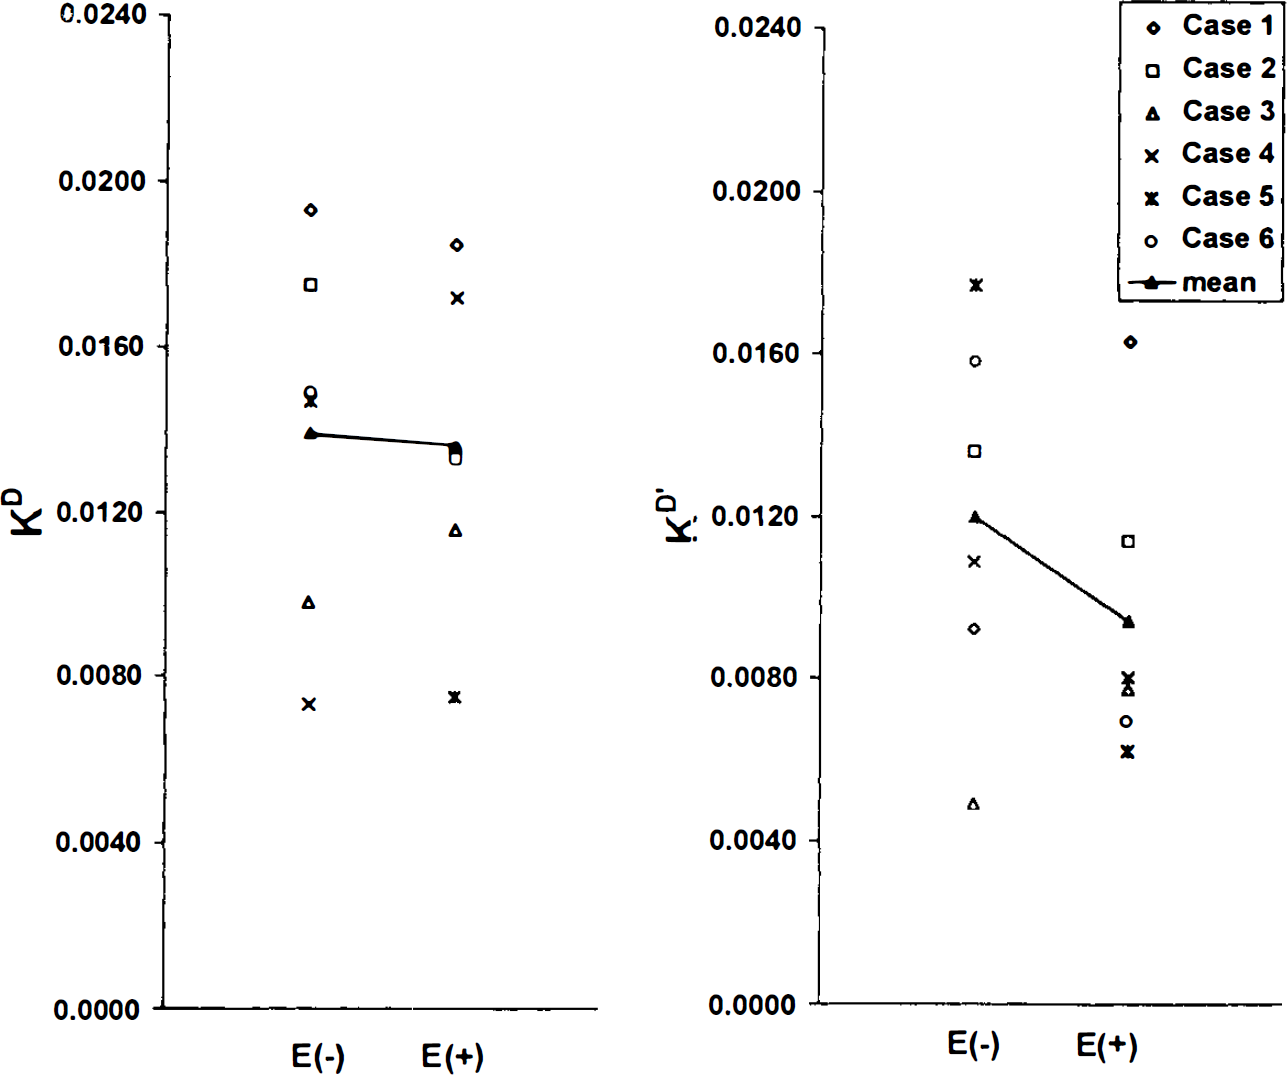
Individual (right-left mean) measures of the calculated striatal FDOPA uptake rate constants KD and KD′ with (E +) and without (E –) OR-611 pretreatment, respectively. [KD = K1D × k3D/(k2D + k3D), KD′ = k2D × k3D/(k2D + k3D)]. Neither of these two macroparameters changed significantly with OR-611 preadministration.
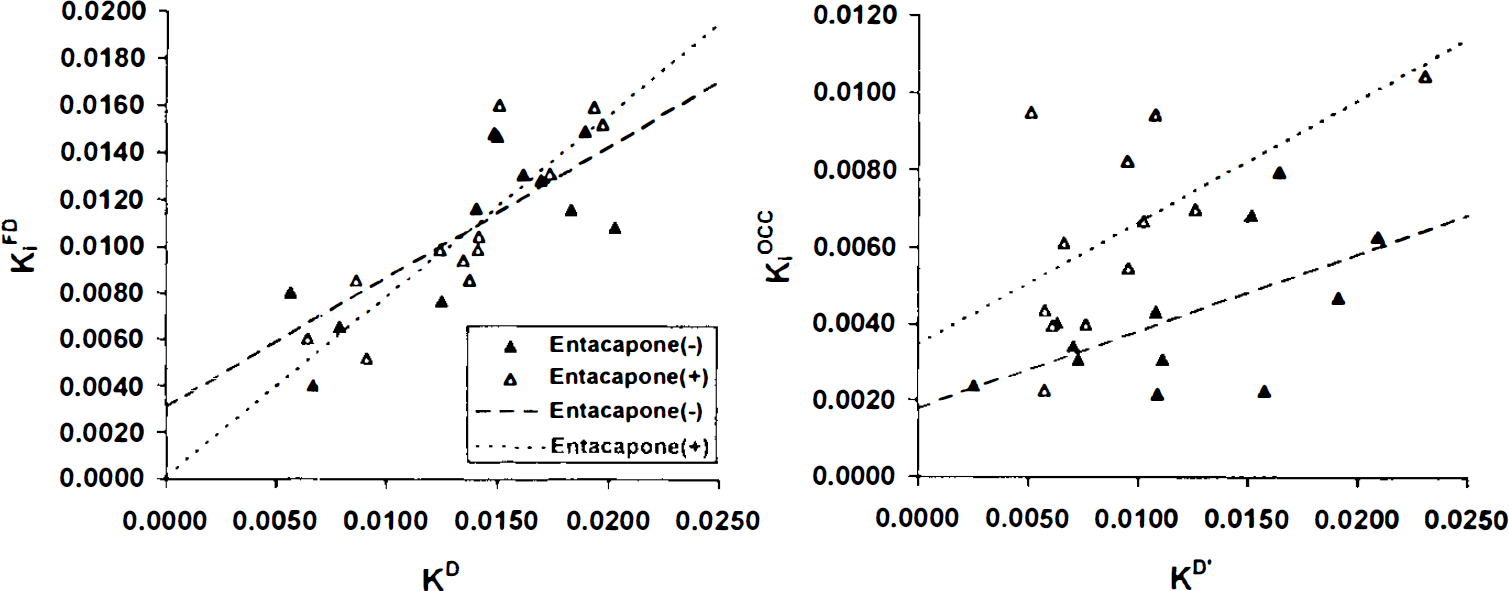
Correlations between the calculated individual (right and left) KD and KD′ measures and the corresponding graphically estimated values, KiFD and KiOCC, respectively. Left panel: KD values are highly correlated with KiFD with (E +) and without (E –) OR-611 (r = 0.88 and 0.75 for treated and untreated states, respectively; p < 0.01 for both correlations). Right panel: KD′ values correlated significantly with KiOCC under both treatment conditions (r = 0.61 and 0.60 for treated and untreated states, respectively; p < 0.05 for both correlations). However, the slopes of the regression lines for this correlation tended to be different in the two treatment states (p = 0.06).
DISCUSSION
Plasma analysis
There has been much interest in the adjunctive use of COMT inhibitors with L-dopa therapy for PD. OR-611 acts predominantly by inhibiting COMT at peripheral sites, such as liver, kidney, gut, and red blood cells (Linden et al., 1990). This compound was found to effectively increase the half life of L-dopa and reduced the formation of 30MFD in cynomolgus monkeys (Cedarbaum et al., 1991; Guttman et al., 1993). We administered OR-611 to PD patients and found that this medication effectively reduced the metabolism of FDOPA to 30MFD and prolonged the plasma half-life of FDOPA. Our findings are consistent with those of the analogous animal experiment in which COMT inhibition with OR-611 reduced the 30MFD fraction to 15% at 60 min (Guttman et al., 1993). These investigators also detected an unknown metabolite, perhaps dopamine sulfate, that accounted for 10% of plasma activity at 60 min. In our human study, we found a lower FDOPA fraction at 60 min as compared to that in the monkey experiments (55% as compared with 75%, respectively). This was due, presumably, to an increase in the fraction of the unknown metabolite (30% as compared with 10%, respectively), rather than to a change in the 30MFD fraction, which did not differ between the two studies. FDA is deaminated by monoamine oxidase to 3,4-fluoro-dehydroxyphenylacetic acid (FDOPAC). FDA undergoes 3-O-methylation by COMT to 3-methoxytyramine and is subsequently conjugated by phenosulfotransferase to 6-fluorodopamine sulfate. FDOPAC can also undergo 3-O-methylation by COMT to 6-fluorohomovanillic acid (FVHA). With COMT inhibition, the metabolic pathways from FDA to FDA sulfate and from FDOPAC to fluorovanillic acid (FVA) are also blocked, which may result in a relative increase of FDOPAC. However, the location of the peak in HPLC suggests that it may be assigned to 6-FDA sulfate rather than to FDOPAC (Firnau et al., 1988). A full HPLC analysis with comparison to known standards will be needed to conclusively identify this metabolite, but for modeling purposes, it is important to know that none of these metabolites cross the blood-brain-barrier (BBB).
When we estimated the pharmacological circulation time, θTFD, the value significantly decreased with OR-611 pretreatment. The pharmacological efficiency of FDOPA, EpFD, increased significantly with OR-611. Both θTFD and EpFD changes are consistent with the corresponding values from the monkey study (Guttman et al., 1993). Our results, therefore, demonstrate that OR-611 is effective in prolonging the available time of FDOPA in plasma in PD patients.
SOR
In their monkey study, Guttman et al. (1993) demonstrated, using FDOPA/PET, that administration of OR-611 increased striatal radiotracer accumulation with 20% increase in the striatum/occipital cortex ratio. Subsequently, Saw le et al. (1994) studied six normal subjects and four PD patients and found a mean increase in (striatum-occipital)/occipital ratio of ∼38%, due to a combination of 22% increase in the proportion of the injected dose present within the striatum and an 11% decrease in the proportion of the injected dose in the cerebellum at 90 min postinjection. In our study, we noted an increase of 20% in SOR due to the combination of a 3% increase in the proportion of the injected dose within the striatum and a 13% decline in that proportion in the occipital cortex. This finding agrees with Sawle's data, which, if also calculated as the striatum/occipital ratio, corresponds to a 19% increase with OR-611. The decline in the occipital cortex appears to have resulted from the ∼20% increase of the unknown metabolite, probably 6-FDA sulfate, which does not cross the BBB. OR-611 pretreatment thus gives rise to a net reduction in the combined FDOPA and 30MFD plasma fraction, and lowers the total activity in “neutral” brain regions such as the occipital cortex. This decrease in the occipital cortex appears to play a greater role in raising SOR than does a concomitant increase in striatal FDOPA concentration. The discrepancy between Sawle's data and ours regarding the percent contribution of striatal and occipital activities to the increase in SOR probably stems from the way the injected dose was estimated. We estimated this injected dose by normalizing it by body weight (the procedure used by Sawle was not published). Because of the short study duration and slow uptake of tracer in the striatum of PD patients, the striatal increase with OR-611 may be smaller than that in a comparable study of larger duration (>200 min).
DDC activity (k3D)
Guttman et al. (1993) estimated striatal DDC activity by the method of Kuwabara et al. (1993), in which a fixed ratio, q, was assumed for the transport kinetic rate constants for FDOPA and 30MFD (K1M/K1D). They selected q = 2.3 based on data derived from rat experiments (Reith et al., 1990). These investigators found that striatal k3D (M2) fell from 3.9 to 2.5 (h−1) following OR-611, although this decrease did not reach statistical significance (Guttman et al., 1993).
When we applied Kuwabara's model (M2) with choices of q to our patient data, estimates of striatal k3D (M2) significantly decreased after OR-611 pretreatment, but only when q values ≥1.7 were selected. However, neither k3D (M2) values estimated with q values <1.0 nor k3D (pop) values showed significant change with COMT inhibition. We also note that in our study k3D (M2) values were found to be sensitive to the choice of q, especially when 30MFD was present appreciably in plasma. Specifically, without COMT inhibition, model M2 with q ≤ 1.7 produces a significant increase in k2D, with a compensatory increase in the estimated k3D (M2) value. A large q value causes an artificial increase in the size of the 30MFD pool relative to the free FDOPA pool. This forces a compensatory increase in k3D to keep the size of the bound FDOPA pool constant and is primarily dependent on the shape of the brain curve during the later scan times. When the plasma 30MFD fraction was reduced with OR-611 pretreatment, k3D (M2) did not vary with q. Additionally, that model assumed a common value for frontal and striatal Ve. However, our data revealed a 20% difference in Ve values between the frontal cortex and striatum. The constraint of a common value for the frontal and striatal Ve may also lead to overestimation of k2D values in the striatum, with a compensatory overestimation in striatal k3D (M2) values. We conclude that model M2 may be sensitive to the choice of q and that the assumption that Ve is equal in frontal cortex and striatum may be invalid. These assumptions may lead to a q-dependent overestimation of k3D (M2) in the presence of a large 30MFD plasma fraction and, consequently, a spurious decline in striatal k3D (M2) with COMT inhibition. Indeed, animal studies have demonstrated that OR-611 does not cross the BBB and does not effect central DDC activity (Mannisto et al., 1992). For this reason, we conclude that this model may not be appropriate for DDC activity estimation in settings in which COMT is not effectively inhibited.
According to Patlak and Blasberg (1985), free FDOPA is the fraction of the amount in the reversible compartments that leaves the system by returning to plasma. The free FDOPA fraction (fDOPA) is, therefore, calculated as k2D/(k2D + k3D). Similarly, the fraction and distribution volume of FDOPA that participate in FDA synthesis (fto DA and Veto FD) can be expressed as k3D/(k2D + k3D) and fto DA × Vestr, respectively. When we calculated the striatal distribution volume of FDOPA, Vestr and fDOPA based on the kinetic rate constants derived by our model, we found no significant change with OR-611 pretreatment. In addition, we found no significant change in estimates of fto DA and Veto DA with OR-611 treatment. These findings support the lack of a central effect of OR-611 on dopamine metabolism.
FDOPA influx rate constants
We found no change in KiFD with OR-611. This finding is consistent with the animal experiment of Guttman et al. (1993), who calculated striatal influx rate constants for FDOPA, KiFD, and found no change in this parameter with OR-611 pretreatment. Similarly, Sawle et al. (1994) found no change in KiFD values in humans. We did find that KiOCC increased significantly by ∼50% with OR-611 pretreatment, in agreement with the findings of Sawle et al. (1994). These investigators speculated that the reason for the KiOCC increase was its sensitivity to the presence of 30MFD in the periphery, and suggested that the change in free brain FDOPA may be reflected in the magnitude of change in the value of KiOCC. We did not, however, find a significant increase in the free brain FDOPA fraction, fDOPA, in our kinetic analysis (see above). We also used the individually estimated rate constants, K1D, k2D, and k3D, to calculate the net uptake rate constants, KD and KD′, and found no change with OR-611 treatment. Indeed, in accordance with Patlak and Blasberg (1985), we found that KD values were highly correlated with the graphically estimated KiFD values. The slope of KiFD versus KD is closer to unity when OR-611 is administered, i.e., when the model becomes less sensitive to the assumptions regarding the behavior of 30MFD. The between-group (with and without OR-611) difference in slope, however, is not significant given the small number of subjects in each group. The uptake rate constant derived by graphical analysis using a “neutral” tissue input function such as KiOCC should be correlated to KD′, assuming metabolites can be neglected in the reference region (Patlak and Blasberg, 1985). Indeed, we found that KD′ correlated significantly with KiOCC irrespective of treatment status. Nevertheless, the slope of the regression line of the data with COMT inhibition tended to be different from those without pretreatment (Fig. 6). Furthermore, mean KiOCC was elevated significantly with OR-611, while KD′ was not significantly changed. As mentioned above, our data suggest that the increase in the plasma concentration of the sulfated metabolite with OR-611 pretreatment leads to a concomitant reduction in the combined FDOPA and 30MFD plasma fraction. This, in turn, gives rise to a reduction in “neutral” region brain count rates. Such reductions in the occipital time-activity integral serve to increase KiOCC, without necessarily affecting striatal FDOPA uptake. We note that striatal KiOCC values derived by graphical analysis appear not to discriminate PD patients from normals as accurately as do KiFD values determined with metabolite-corrected plasma input functions (Takikawa et al., 1994; Sawle et al., 1994). Similarly, we have found KiOCC not to be as well correlated with clinical severity ratings (Takikawa et al., 1994). These comparative limitations in KiOCC may derive from inaccuracies in this estimate introduced by variable fractions of the nontransported sulfated metabolite. Nonetheless, because the range of this fraction is narrow across subjects when peripheral DDC activity is blocked by carbidopa (Melega et al., 1990), KiOCC remains a very useful noninvasive alternative to KiFD for most clinical applications (e.g., Brooks et al., 1990).
In summary, our results suggest that OR-611 has little effect on FDOPA kinetics in the striatum, and that the main pharmacologic effect of this agent is brought about by the prolongation of FDOPA circulation time in plasma. This PET result is in agreement with those of clinical studies showing that the improvement in L-dopa response duration with OR-611 was proportional to the increased half-life of L-dopa in plasma in the treated state (Mellero et al., 1994). Quantitative FDOPA/PET may be useful in assessing the effects of other pharmacologic manipulations of L-dopa delivery in the treatment of parkinsonism.
Footnotes
Acknowledgment:
We thank Dr. Ariel Gordin, Orion Pharmaceutica, Espoo, Finland for the supply of OR-611. This work was supported by grants from the National Parkinson Foundation and the Parkinson Disease Foundation. T. Ishikawa is the Veola S. Kerr Fellow of the Parkinson Disease Foundation. The authors wish to thank Mr. Ralph Mattachieri for cyclotron support, Dr. Debyendu Bandyopadyay for radiochemistry assistance, and Ms. Debra Segal for manuscript preparation.