
Abstract
[15O]Butanol has been shown to be superior to [15O]water for measuring cerebral blood flow with positron emission tomography. This work demonstrates that it is also superior for performing activation studies. Data were collected under three conditions: a visual confrontation animal-naming task, nonsense figure size discrimination, and a nonvisual darkroom control task. Time–activity curves (TAC) were obtained for regions known to be activated by the confrontation naming task to compare absolute uptake and the different kinetics of the two tracers. Also, t statistic maps were calculated from the data of 10 subjects for both tracers and compared for magnitude of change and size of activated regions. Peak uptake in the whole-brain TAC were similar for the two tracers. For all regions and conditions, the washout rate of [15O]butanol was 41% greater than that of [15O]water. At a threshold of 0, the [15O]water and [15O]butanol percent difference (nonnormalized) and t statistic (global normalization) images are nearly identical, indicating that the same property is being measured with both tracers. The [15O]butanol parametric images displayed at a threshold of |t| = 5 look similar to the [15O]water parametric maps displayed at a threshold of |t| = 4, which is consistent with the observation that t statistic values in [15O]butanol images are generally greater. The t statistic values were equal when the [15O]butanol parametric map was created from any subset of 6 subjects and the [15O]water parametric map was created from all 10 subjects. Fewer subjects need to be studied with [15O]butanol to reach the same statistical power as an [15O]water-based study.
Oxygen-15–labeled water is used routinely for measuring CBF and performing neuroactivation studies. Berridge et al. (1991) report measuring CBF with [15O]butanol. They also estimate the permeability–surface area (PS) product of [15O]water (133 mL/100 g/min) and infer that the PS product of [15O]butanol is large enough (PS >> F) to make variable extraction (as a function of flow) correction when using [15O]butanol unnecessary. Herzog et al. (1996) present a validation for calculating CBF with [15O]butanol.
Quarles et al. (1993) compare measuring CBF with [11C]butanol and [15O]water. They conclude that when using a one-compartment model to measure flow, [15O]butanol is the tracer of choice. However, they also state that their data are insufficient to support the claim that [15O]butanol is a superior tracer in the application of functional brain mapping. They cite two reasons and hypothesize another for this: (1) only three patients were compared in this part of their study; (2) since they used [11C]butanol, they could not inject equal amounts of radioactive tracer; and (3) they hypothesize that the PS product of [15O]water may increase during physiologic activation. If this hypothesis is true, then [15O]water may gain an advantage under the special circumstances of functional activation studies. They suggest a method for determining the PS product of [15O]water at different flows, but these values have not been published.
We therefore believe that the superiority of either [15O]butanol or [15O]water is not established for the application of functional neuroanatomical imaging. However, we also believe that the work by Berridge et al. is compelling in that permeability properties of [15O]butanol are superior to those of [15O]water. We report here a direct side-by-side comparison of the two tracers labeled with [15O] in a common activation experiment. The paradigm is a visual confrontation naming task that causes documented increases in the left and right fusiform gyri and left inferior frontal gyrus (Henry et al., 1998). The hypothesis that [15O]butanol is superior to [15O]water for activation studies is tested with the measured data from these areas.
MATERIALS AND METHODS
Subject selection
Ten normal subjects (5 men, 5 women), ranging in age from 21 to 34 years, were enrolled in this study approved by the Human Investigations and Radiation Safety Committees of Emory University. Written informed consent was obtained from all subjects. Subjects had completed less than 2 years of college, were right handed, and are representative of the ethnic background of Atlanta. Handedness was determined by the participant's self-report, which always was consistent with their writing hand.
Subjects were screened with complete medical, neurologic, and psychiatric histories and cardiovascular and neurologic examinations. All subjects had normal cardiovascular and neurologic examinations and no history of the following: (1) head trauma; (2) meningitis or encephalitis; (3) prenatal, perinatal, or postnatal hypoxia; (4) migraine headaches or other neurologic conditions; (5) neurosurgical procedures; (6) current medical therapy; (7) ethanol abuse or illicit drug use; or (8) conditions treated by a psychiatrist or psychologist. They also performed within 2 SD of the age-appropriate mean in each test of the following neuropsychologic battery: (1) Wechsler Adult Intelligence Scale—Revised (Vocabulary, Digit Symbol, and Similarities subtests); (2) Wechsler Memory Scale—Revised (Mental Control and Digit Span, Logical Memory Immediate and 30-Minute Delayed Recall, and Visual Reproduction Immediate and 30-Minute Delayed Recall); (3) Boston Naming Test; (4) Controlled Oral Word Association Test; and (5) Category Fluency.
Butanol production
[15O]Butanol was prepared from the corresponding tributylborane precursor using a modification of a previously described method (Kabalka et al., 1985; Berridge, 1992). Oxygen-15-labeled O2, 660 mCi, was produced by proton irradiation of [15N]N2. A 10-mL volume target was pressurized to 200 psi with a mixture of 99% enriched [15N]N2 plus 1% O2 (volume/volume) (Isotec, Inc., Dayton, OH, U.S.A.) gas, then irradiated with 40 μA of 11-MeV protons (Siemens RDS 112 cyclotron, Knoxville, TN, U.S.A.). The production was controlled by a computer command file that loaded and irradiated the target. When requested by by the operator, the beam on target was stopped, and approximately 80% of the target contents were released, producing a bolus of [15O]O2. The target then was reloaded, and the beam placed back on target to continue [15O]O2 production. The [15O]O2 bolus was swept in a He stream onto an alumina Seppak (Waters, Milford, MA, U.S.A.) containing 154 mg of tributylborane. The output from the column was typically 358 mCi of [15O]butanol in an average radiochemical yield of 55% (n = 9) calculated to end of bombardment. The total synthesis/purification time was 3 minutes, with a radiochemical purity of 98% and a specific activity of 6500 mCi/mmol.
Water production
[15O]Water was prepared by combining oxygen-15–labeled O2 with hydrogen (H2) over a heated palladium catalyst. After preparation of oxygen-15–labeled O2 as described earlier, approximately 25% of the target contents were remotely unloaded and swept with the aid of a scavenger gas (He) to the palladium catalyst column, where it was mixed with hydrogen and air (high-purity medical grade). The hydrogen and air flow rates were set at 2 mL/s and 4.77 mL/s, respectively. The 15O2 and H2–air mixture was passed through a column of palladiumcoated alumina pellets (0.5% weight/weight) heated to 150°C, yielding 500 mCi of [15O]water at end of synthesis, with a radiochemical purity of 98%.
Activation paradigm
Visual confrontation animal naming, visual size discrimination of unnamable nonsense figures, and nonvisual (dark environment) counting activation scans were collected for each subject. We term these tasks naming, sizing, and dark counting, respectively. The order of tasks was pseudorandomized across subjects. The sequence was repeated three times for a total of nine acquisitions (three repetitions for each of the three tasks). Each visual stimulus for the naming and sizing tasks appeared on a computer monitor for 1 second, with 2 seconds between stimuli. The computer generated an audible beep when each new stimulus was displayed (every 3 seconds). The subject was asked to view the monitor and to make a single, brief statement concerning the stimulus. The computer beep and the subject's statement were recorded. For the dark counting task, the subject was blindfolded, and the entire scan room darkened. The same computer program was run, and the subject was asked to count the beeps aloud.
The sizing task was observing a series of Attneave figures, which are abstract figures that cannot be readily named and do not typically elicit cognitive or emotional associations (Attneave, 1957; Van der Plas, 1959). The figures were presented in either of two sizes, and the subject was asked to state aloud either, “That is a large figure,” or “That is a small figure.”
The naming task was visual confrontational naming of a series of line drawings of common and uncommon animals. Subjects were instructed to say, “That is a [the name of each animal presented on the screen].” A different set of 28 figures was used for each acquisition.
Scanning and image processing
Nine acquisitions were acquired on each of 2 days for each subject. One day, the studies were performed with [15O]butanol and the other, with [15O]water. The first three subjects were scanned with a nine-frame sequence lasting 90 seconds (nine frames, 10 seconds each). It became obvious that additional time information would be useful, so the last seven subjects were scanned with a nine-frame sequence over 240 seconds (five frames, 10 seconds each followed by single frames of 20, 40, 60, and 90 seconds, respectively). The additional data were used for the time–activity curves (TAC) only—all image analyses (t statistic and percent change) were performed on summation images over the first 70 seconds of scanning. All injections were 45 mCi. The task was started simultaneously with tracer injection, and the scan acquisition was started 10 seconds later. The task was performed for 90 seconds, and the patient remained at rest for the duration of the acquisition and until the next injection 6 minutes later (10 minutes between injections).
All studies were acquired on a Siemens 951 scanner in two-dimensional mode. This scanner has a 10.5-cm axial field of view that is reconstructed into 31 transaxial planes. After the subject was positioned on the bed, a thermoplastic mask (Tru-Scan Imaging, Inc., Annapolis, MD, U.S.A.) was used to restrict cranial motion. Subjects were positioned in the scanner so that the temporal lobes were definitely in the field of view.
Because of the limited field of view, the vertex of the brain was not scanned on most subjects. During scanning, the peak counting rate was typically 250,000 cps prompts and 50,000 cps randoms. The maximum dead time correction was about 1.26 during the fourth or fifth frame. Images were reconstructed with a ramp filter to the Nyquist frequency and calculated attenuation correction. The images then were filtered with a three-dimensional Hanning filter with 1 cycle/cm cutoff. The resolution in the final images is 11.8 cm in all directions.
For registration, all nine frames of the acquisition were added together. All images for each subject were corrected for motion that may have occurred during the acquisition by registering in three dimensions (rotations and translations about all axes) all subsequent images to the first using the methods of Woods et al. (1998a). This registration approach also was used to align in three-dimensions the first frame of the functional image set to a magnetic resonance image (Woods et al., 1993). Each anatomical image then was warped into a standard space using the methods described by Woods et al. (1998b). The standard was a mean anatomical magnetic resonance image created by aligning and averaging 15 normal volunteers and then manually translating, rotating, and scaling the mean image to fit into the coordinate system described by Talairach and Tournoux (1988). This standard image consisted of 47 slices of 3-mm thickness; each slice was 121 × 95 pixels of dimension 1.5 × 1.5 mm. The registration (functional to anatomical) and warping (anatomical to standard) transforms were combined and applied to each image of the functional data set so that all images of each subject were in the same standard coordinate space.
To perform a comparison of absolute changes, percent change images of the first 70 seconds of data collection were created without normalizing the data. The naming and sizing images were paired, and percent difference images were calculated. These percent difference images then were averaged across all replications and subjects.
Data analysis
Parametric images. Parametric images were calculated on the 70-second summation images. Each positron emission tomography (PET) image volume was normalized by the average intensity of its pixels within the brain. Only pixels common to all acquired images, as determined by the alignment to the standard, were used to calculate the average.
A three-way analysis of variance was applied to the PET studies using subject, repetition, and scan condition as factors. Linear contrasts were computed to test whether the mean pixel intensities were different between control and task states (Neter et al., 1990). The model assumed that there were no interactions between variables.
Time–activity curves. Time–activity curves for specific structures were determined by drawing approximately 2-mL regions of interest (ROI) over the left and right anterior fusiform gyri, the left inferior frontal gyrus, and the posterior cingulate and recording the nondecay corrected radioactivity concentration. Each of these ROI covers the pixel of maximum intensity on both the [15O]water and [15O]butanol t statistic images and was drawn to include the surrounding area where peaks on the two image sets overlap. A large whole-brain ROI was determined as the intersection of the scanned brain regions for all subjects. The TAC data were examined two ways: without normalization, and after dividing by the integral of the whole brain TAC. The first case allows comparison of absolute uptake and kinetics between the two tracers, whereas the latter corresponds to the usual method to analyze data from activation studies.
The TAC were fit to the following empirical function by nonlinear least squares fitting:
Here, a is sensitive to the amplitude of the curve, to accounts for the time delay between injection and arrival of activity in the brain, and kr and kf are rate constants that describe the rise and fall of radioactivity in the brain region. F(t) has a maximum of
Fitting the data has the advantages of smoothing the data, allowing rapid evaluation of different imaging scenarios, accurate interpolation between measured points, and enabling the differences in kinetics to be described with four parameters. More importantly, it allows accurate determination of the delay between injection and arrival of activity in the brain, which varies greatly between subjects. Parameters for population average curves were determined by first fitting individually each TAC to determine to, then time shifting the data, averaging across the population, and fitting equation 1 to the average TAC. Arrival time for tracer entering the brain is defined as the time when the whole-brain activity concentration reaches half the maximum calculated from equation 2.
RESULTS
Parametric images
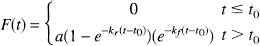
A comparison of the unnormalized naming minus sizing percent difference images for [15O]butanol and [15O]water are presented in Fig. 1. Seventy-seven percent of the imaged pixels change in the same direction for [15O]butanol and [15O]water. If pixels with less than 0.5% change in either data set are eliminated (because small changes are more susceptible to noise), there is 85% agreement in direction, and if the threshold is raised to 1%, the agreement is 92%. (These figures are for the entire data set, not just the image slices shown.)
Overlap of absolute confrontation naming (naming versus sizing) percent difference results for [15O]butanol and [15O]water. The indicated thresholds are percent changes that apply to a row of images. Yellow shaded pixels indicate increases greater than the threshold for both [15O]butanol and [15O]water data and blue indicates corresponding decreases. The second row clearly shows increased blood flow in the bilateral fusiform gyri and left frontal region as anticipated from previous work.
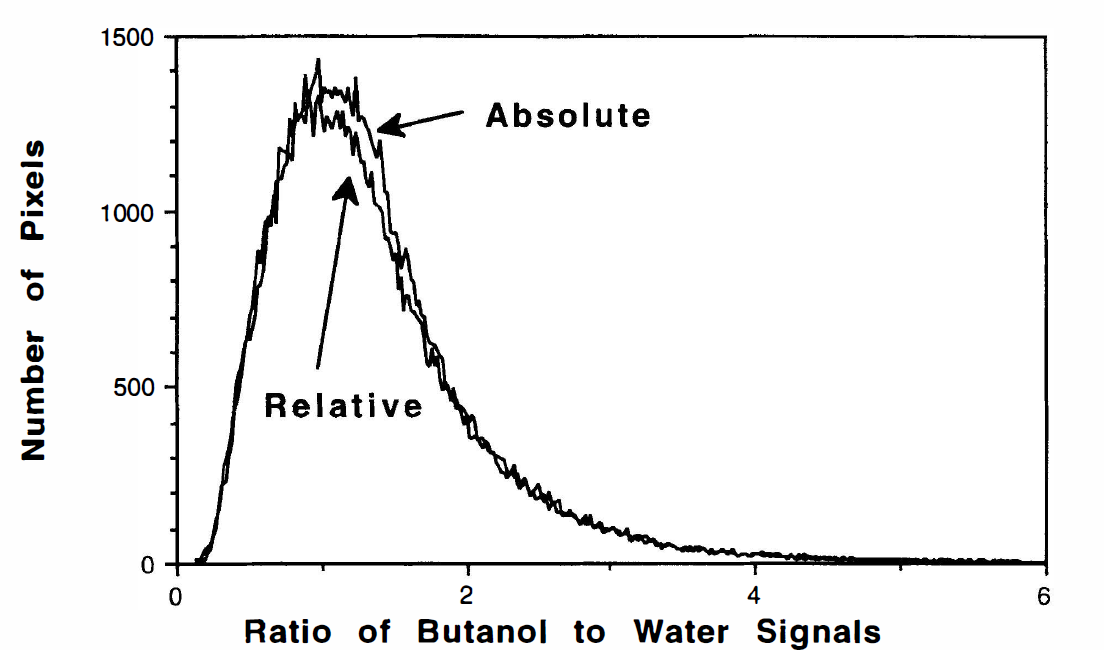
Figure 2 is a histogram of the ratio of change measured with [15O]butanol to that measured with [15O]water for pixels that either increase or decrease by more than 1% in both. Considering both increases and decreases greater than 1%, the [15O]butanol change is an average factor of 1.35 (1.34 for the normalized data) greater than the [15O]water change. In the left anterior fusiform gyrus, the increase is 9.35% for [15O]butanol and 7.68% for [15O]water. If each scan is normalized by the average whole-brain activity before analysis, the change is 3.29% for [15O]butanol and 2.75% for [15O]water.
Histograms of the ratio of the [15O]butanol to [15O]water percent change for the naming versus sizing comparison. The curve labeled relative is from data that was first normalized to whole-brain activity. No normalization was applied to the curve labeled absolute. The histograms include all pixels where both the [15O]butanol and [15O]water signal change by more than 1% in the same direction. The area under the curves to the right of the ratio = 1 line is approximately two thirds of the total.
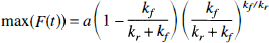
The overlap between [15O]water and [15O]butanol naming versus sizing t statistic parametric maps is shown in Fig. 3 By comparing with Fig. 1, it can be seen that the effect of normalizing each scan by the global mean uptake (as is done in Fig. 3) is minimal. The fraction of pixels that agree in sign between the [15O]butanol and [15O]water analyses at a threshold of t = 0 is 76%. At a threshold of |t| = 2, the agreement is 96%. For the pixels that change by more than 1% in magnitude, the mean change in the [15O]butanol t statistic is a factor of 1.24 greater than that of the [15O]water t statistic.
Comparison of t statistic parametric maps for the naming versus sizing comparison for [15O]butanol and [15O]water. The top row shows where the [15O]butanol map is greater (yellow) than 2 or less (blue) than -2. The second row shows the [15O]water data, and the third row shows the overlap of rows 1 and 2. This row shows where |t| > 2 for both the [15O]butanol and [15O]water experiments. Notice that the appearance of this row is almost completely determined by the [15O]water result. The last row shows where both maps are positive (yellow) or negative (blue).
Images of confrontational naming minus sizing for [15O]butanol and [15O]water at thresholds of |t| = 4 and |t| = 5, respectively, are shown in Fig. 4. There are (in the entire image volume) 3911 and 478 pixels above the |t| = 5 threshold for [15O]butanol and [15O]water, respectively. At the |t| = 4 threshold, the corresponding numbers are 12131 and 3417. In the left anterior fusiform gyrus, the maximum t score is 10.31 for [15O]butanol and 6.69 for [15O]water. In this analysis, there were 60 degrees of freedom (10 subjects × 3 conditions × [3 replications - 1]), and the number of pixels above threshold suggest that the [15O]butanol t scores are about 1 unit greater than the [15O]water t scores. Since the t score is proportional to the square root of the number of degrees of freedom, a [15O]butanol study with approximately (4/5 √60)2 = degrees of freedom should give the same t scores as the [15O]water study. A study with six subjects has 36 degrees of freedom. We therefore hypothesized that averaged [15O]butanol data of 6 subjects would have regional CBF changes in the same regions and at approximately the same t values as would averaged [15O]water data of 10 subjects. To test this hypothesis, four sets of six subjects were chosen randomly (using the random number generator in IDL [Research Systems, Boulder, CO, U.S.A.]), and the contrast analysis was repeated for the [15O]butanol data.
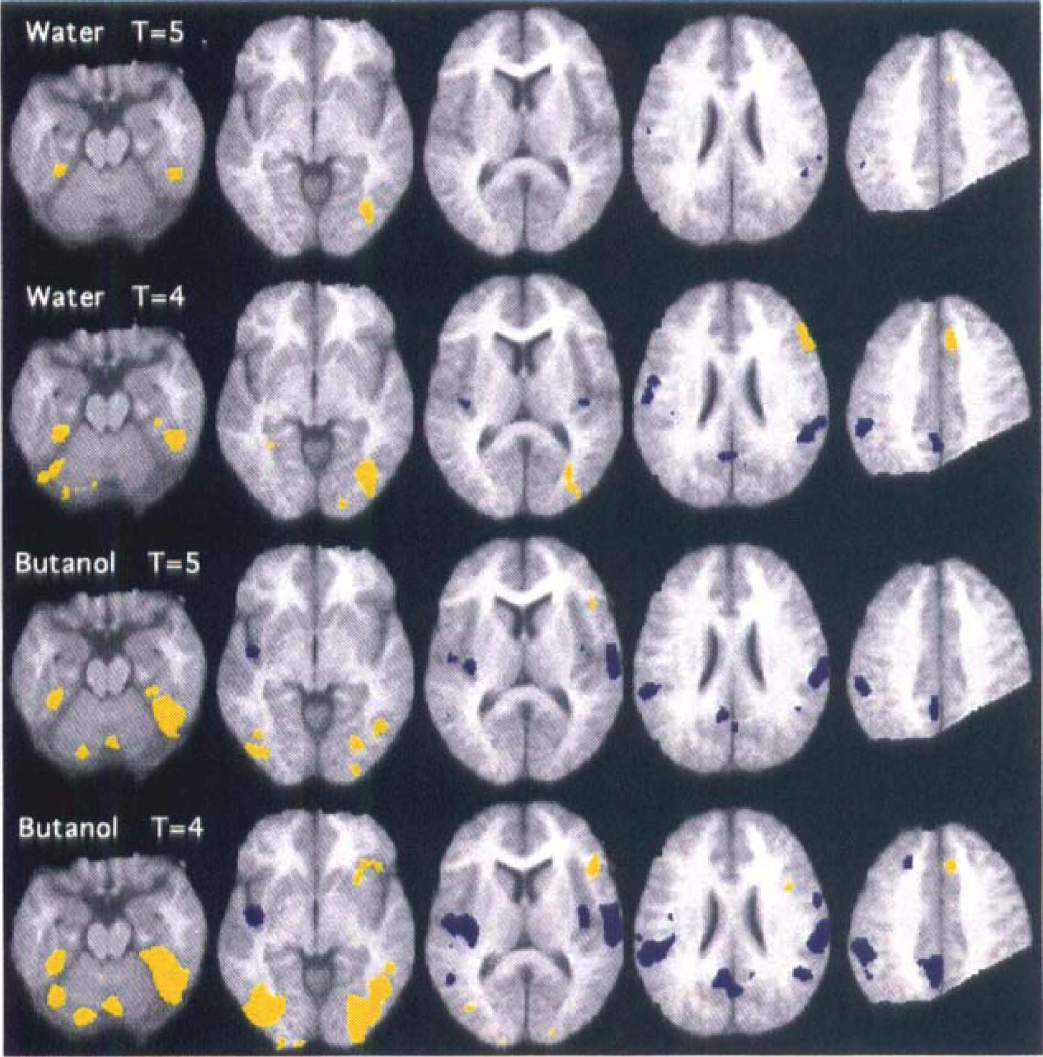
Comparison of t statistic parametric maps at thresholds of |t| = 4 and |t| = 5 for the naming versus sizing comparison for [15O]butanol and [15O]water. The meaning of the yellow and blue pixels is consistent with Fig. 3. Notice that the number of pixels above threshold is about the same for the [15O]water |t| = 4 and the [15O]butanol |t| = 5.
Figure 5 shows images of the [15O]water study with 10 subjects and the four [15O]butanol analyses with subsets of 6 subjects all displayed at a threshold of |t| = 3.5. In the left anterior fusiform gyrus, the maximal t score averages 8.4 for the [15O]butanol data and 6.7 for the [15O]water data. The size of the region averages 2358 pixels for the [15O]butanol data and is 1916 pixels for the [15O]water data. Over the common volume imaged in all subjects, the total number of pixels above the |t| = 3.5 threshold is 9300, 11300, 10900, 10700 for the 6-subject [15O]butanol subsets, and 8311 for the 10-subject [15O]water analysis.
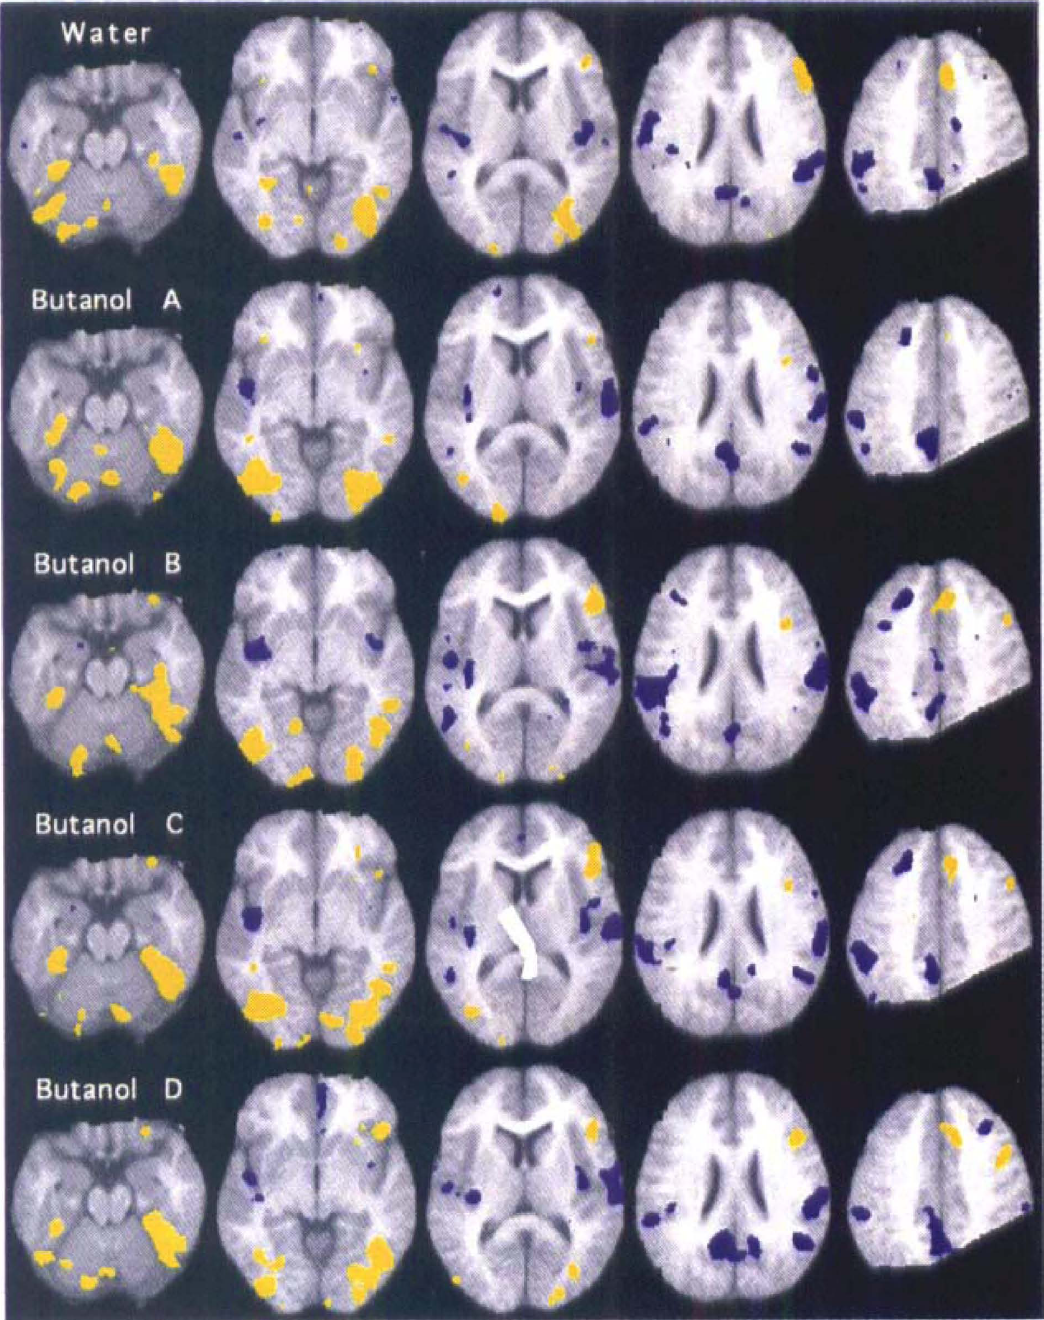
Comparison of the [15O]water activation experiment performed with 10 subjects to the [15O]butanol experiment performed with 6 subjects. The threshold for yellow and blue pixels is |t| = 3.5 for all images.
Time-activity curves
Representative fits of Eq. 1 to measured data are shown in Fig. 6 for one subject (subject JS). Across all nine time points, three conditions, and three replications, the root mean squared deviation of the data from the fit curve is 85 nCi/mL. By contrast, the root mean squared deviation of the data across replication for similar conditions is 140 nCi/mL, indicating that there is not a significant difference between the data and model equation.
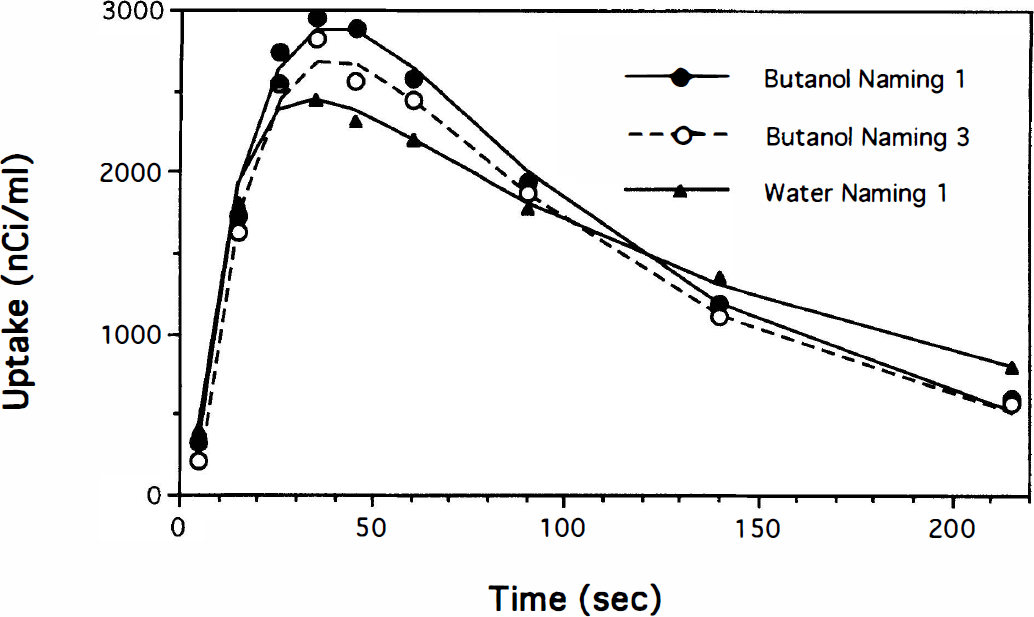
Representative fits, solid lines (subject JS) of equation 1 to the measured ROI data, data points, for the left anterior fusiform gyrus.
Activity concentration in the brain reached half its maximum at 19 ± 3 seconds after injection. There was no significant difference between butanol and water arrival times. Whole-brain TAC averaged across all subjects, after alignment in time, are displayed without normalization in Fig. 7. At approximately 70 seconds after activity enters the brain, the [15O]butanol and [15O]water curves diverge as the [15O]butanol clears from the brain faster than [15O]water. The peak heights and area under the curves corresponding to a 70-second duration scan all are within 3%. For a high flow region, the left anterior fusiform gyrus, the peak uptake and total collected counts in the [15O]water data are approximately 5% greater than the corresponding [15O]butanol-based values, The fit parameters for these conditions are listed in Table 1. Averaging across all conditions for the whole-brain ROI, the [15O]butanol rise rate is 37% less (0.150 versus 0.096 s−1; SD = 0.031), and its washout rate is 41% greater (0.0071 versus 0.0100 s−1; SD = 0.0016).
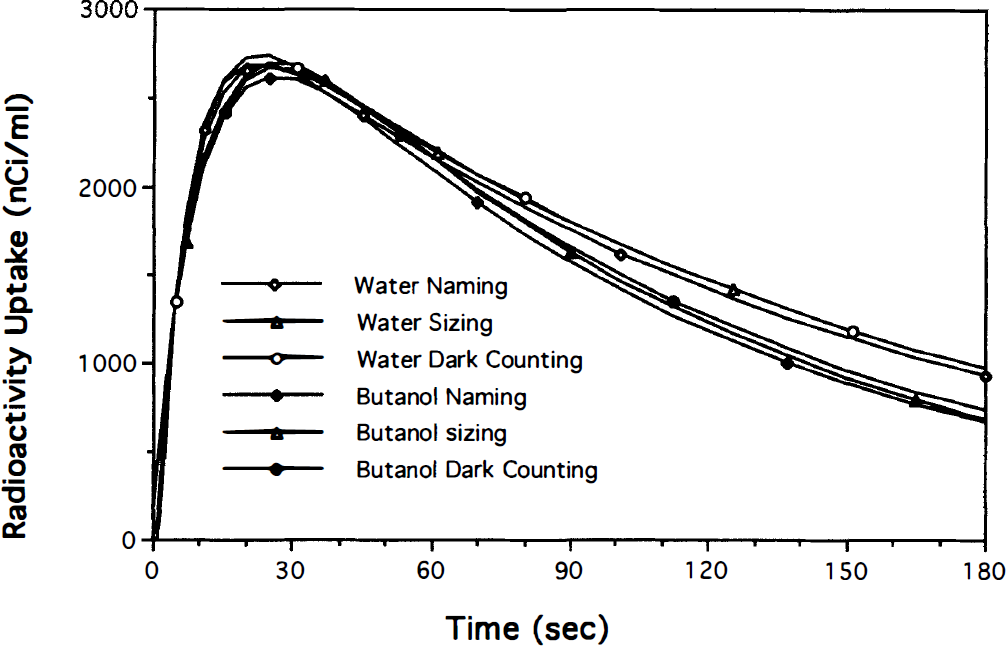
Whole-brain time–activity curves averaged across all subjects. The displayed curves are averages of individual curve fits (equation 1) to the measured data. (The plot symbols only serve to distinguish the curves; they are not measured data points.) No normalization has been applied. The curve fits were shifted so that the radioactivity enters the brain at a constant time before averaging.
Fit parameters for non-normalized average data
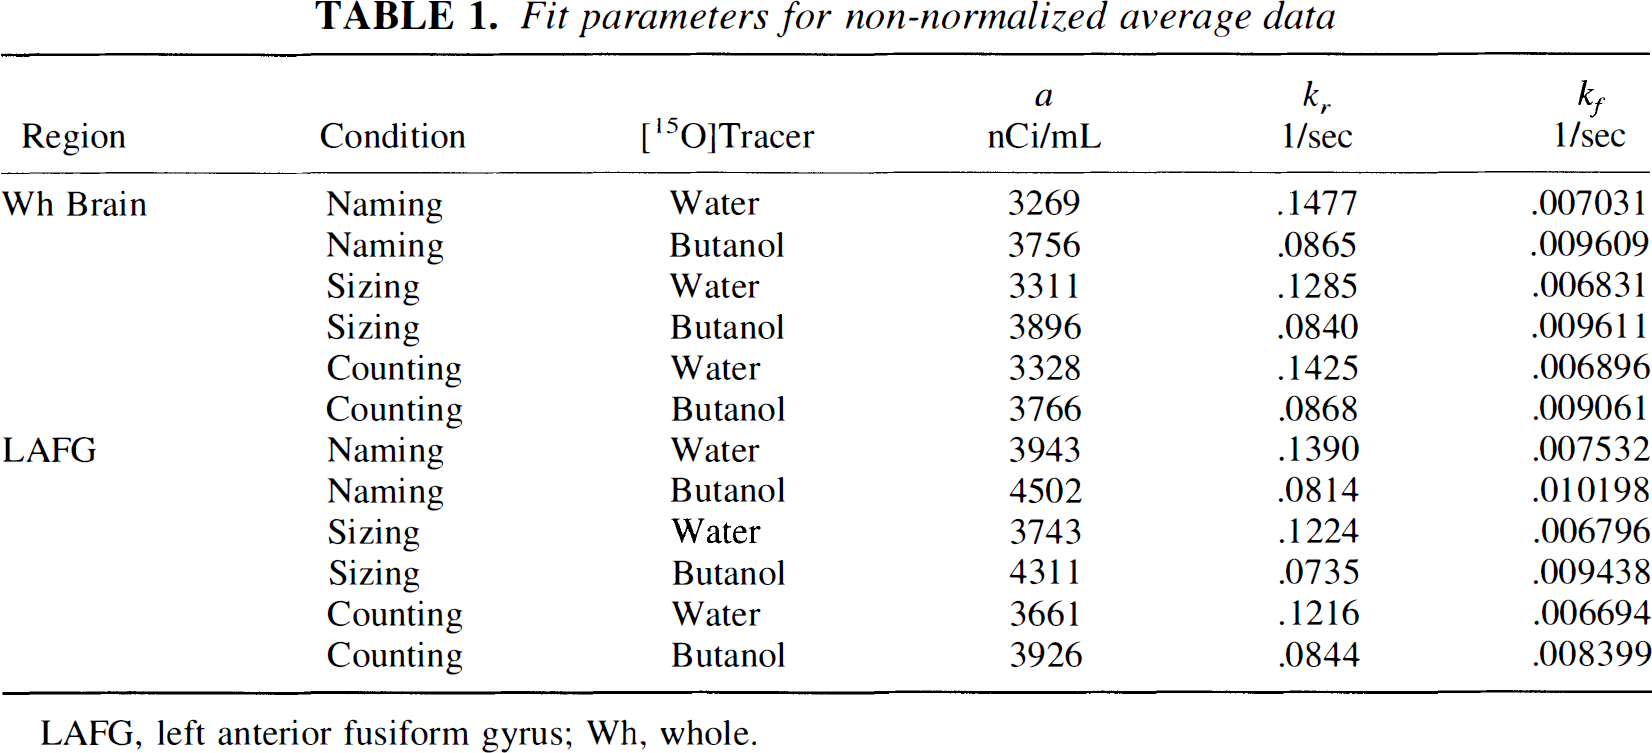
LAFG, left anterior fusiform gyrus; Wh, whole.
The TAC for the left anterior fusiform gyrus normalized to the average uptake in the whole brain for the naming and figure sizing scans are shown in Fig. 8. Figure 9 shows the activation signal (naming minus sizing in the left anterior fusiform gyrus) as a function of scan duration after activity entering the brain. For a 70-second scan, the [15O]butanol signal is 40% larger than the [15O]water signal. The [15O]water signal peaks at 77 seconds, and the [15O]butanol signal peaks 47% higher 92 seconds after activity enters the brain.
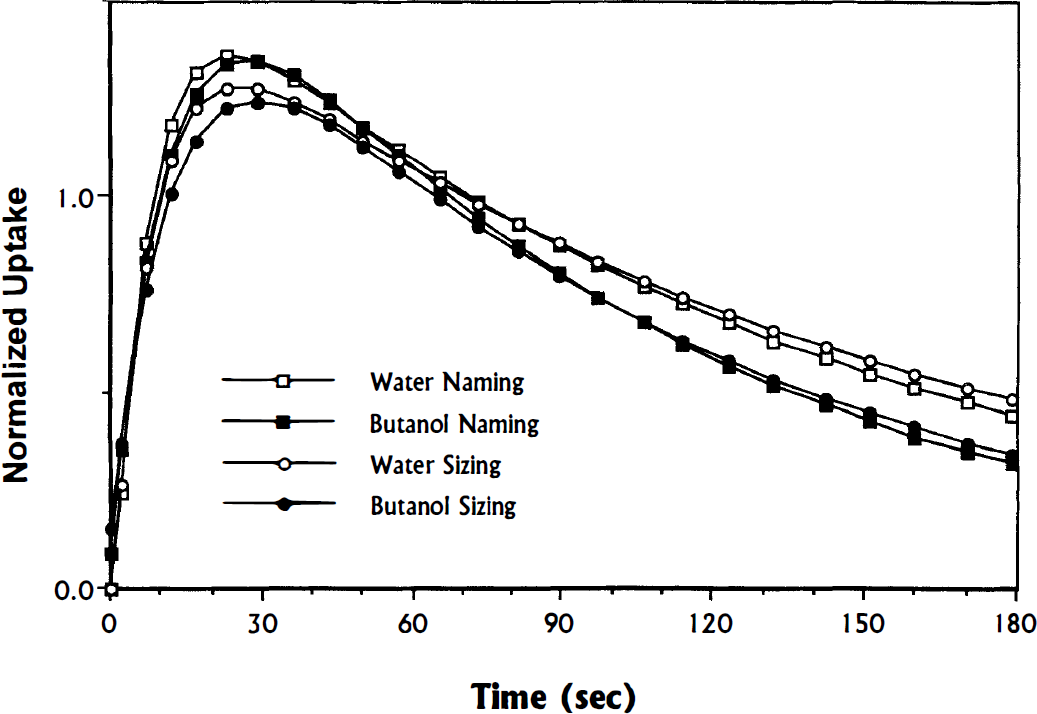
Average normalized time–activity curves for the left anterior fusiform gyrus (lafg). Each individual lafg curve was fit to equation 1, time shifted so that activity enters the brain at t = 0, normalized to the integral of its corresponding whole-brain curve, and then averaged across all subjects and replications.
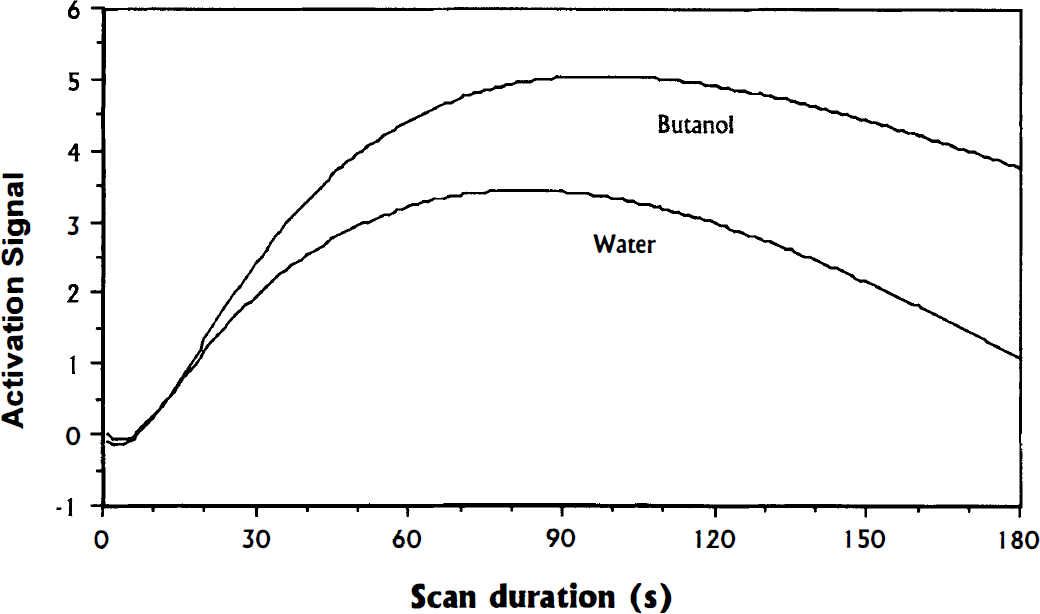
Confrontation naming activation signal as a function of scan duration derived from the curves in Fig. 8. The sizing curves were subtracted from the naming curves and then integrated.
DISCUSSION
Our studies provide strong evidence that [15O]butanol is a superior tracer to [15O]water for performing activation studies. Figures 1 and 3 demonstrate that both tracers are measuring the same phenomena. When the threshold is set to 0 on either the absolute percent difference images or the whole-brain normalized images, we observed that the radioactivity uptake changes in the same direction for both tracers as a function of task. However, the TAC data, as well as the t statistic parametric maps, indicate that the corresponding pixels change by a greater amount, approximately 25% greater, between tasks when [15O]butanol is used rather than [15O]water. This leads to greater statistical power when using [15O]butanol. Or, results that have similar statistical significance can be obtained by studying fewer patients when using [15O]butanol.
Figures 3 though 5 highlight regions of pixels that have t statistic values greater than certain thresholds. Friston et al. (1994) have described how to use the threshold and spatial extent to determine the significance of these focal regions. The greater the threshold and number of pixels above the threshold, the more significant the finding. It is clear from Fig. 4 that more pixels are above a given threshold when [15O]butanol is used, implying that an activation study using [15O]butanol is more likely to find significant sites of activation.
[15O]Butanol has a larger PS product than [15O]water, which implies that a greater fraction of [15O]butanol crosses into the brain during a capillary transit (Berridge et al., 1991). Using their value of PS = 133 mL/min/100 g, the extraction (E = 1 – e−PS/F) of [15O]water at resting flow (assume 60 mL/min/100 g) is 91%, whereas the extraction of [15O]butanol is expected to be near 100%. Based on this, the [15O]butanol TAC in Fig. 7 were expected to be about 10% higher than the [15O]water TAC. Because, in all other respects, the [15O]butanol behaved as expected, it is likely that about 10% less [15O]butanol was delivered to the brain than in the comparable [15O]water studies. A trivial cause could be that [15O]butanol sticks in the intravenous tubing or injection syringe. The intravenous tubing was not moved between injections and so was not assayed. However, throughout the chemistry development, the amount of activity remaining in transfer lines was measured and found to be negligible, so we do not believe that activity remaining in the injection apparatus can explain the less-than-expected uptake of [15O]butanol.
The amount of activity measured in the brain is affected by many factors. The tracers pass through the heart twice and the lungs once before entering the brain. Because the volatility of [15O]butanol is much greater than [15O]water, more [15O]butanol activity is expected to be released during passage through the lungs. This would be expected to affect the amount of radioactivity and the profile of the input function that reaches the brain. Differences in cardiopulmonary kinetics may explain why the measured rate of rise of [15O]butanol is less than that of [15O]water (Fig. 7). It is unknown to what extent, if any, the above factors are involved in the less-than-expected uptake of [15O]butanol. In any case, since the activity in the brain is the same for both tracers, the uncertainty resulting from the Poisson nature of radioactive decay also is similar. Therefore, the improved [15O]butanol t scores cannot be explained by an increased number of detected events for [15O]butanol than for [15O]water.
After activity has entered the brain tissue compartment, a greater PS product, with all other factors constant, will result in faster tracer clearance. This is clearly observed in Figs. 6 and 7, where the [15O]butanol TAC fall much faster than the [15O]water curves. In this respect, [15O]butanol appears to behave, as expected, as a tracer that is more freely diffusible than [15O]water. However, notice that the observed clearance rate is a function of the input function as well as the PS product. It could be that the faster clearance of [15O]butanol results, at least in part, from a faster decline of the [15O]butanol input function. Since [15O]butanol behaved as expected except in its uptake, it is likely that the slower rise time and lesser uptake observed for [15O]butanol is caused by differences in the profile of the input function that is delivered to the brain. Future studies would benefit from collecting arterial blood samples.
The similarities of the whole-brain tissue TAC for the same tracer in Fig. 7 indicate that the global CBF changes little across the three tasks in this study. Based on this observation, in this study the variation may be reduced by normalizing by the average whole-brain uptake without introducing artifactual increases or decreases in differential tracer uptake. Examination of radioactivity uptake in the left anterior fusiform gyrus (Fig. 8), which should have elevated flow during the naming task and baseline flow during the sizing task, indicates that a difference in flow causes a greater difference in [15O]butanol uptake than [15O]water uptake. This is consistent with a higher extraction fraction for [15O]butanol than [15O]water.
These results indicate that an activation study can be completed with [15O]butanol using approximately 60% of the number of scans in a [15O]water-based experiment. The larger activation signal means that fewer repetitions are needed to identify a site as significantly activated. Most of the material cost of producing both [15O]butanol and [15O]water, using a proton-only cyclotron, originates from the cost of the enriched [15N]N2. Reliability of the chemistry is not an issue, since there were no chemistry-related failures for either [15O]water or [15O]butanol during this study. However, the production of [15O]butanol is a radiochemically less efficient process than [15O]water production, requiring nearly four times the amount of enriched [15N]N2. Therefore, although an activation study using [15O]butanol can be completed using approximately 60% of the number of doses, the realized savings will be less than 40% compared with [15O]water because of the increased production costs. However, since the cost of scanner and cyclotron time are the major determinants of the cost of a PET study, the same experiment using [15O]butanol is less expensive than an experiment using [15O]water. The conclusion holds whether the experiment is to determine the average activation pattern in the population or if the goal is to measure the activation pattern of a particular individual.
Functional magnetic resonance imaging is now commonly used to functionally map the brain (Kwong et al., 1992). It has the advantage of allowing many more replicates to be acquired in a shorter time and thus has some statistical advantages. However, there are situations where functional magnetic resonance imaging studies cannot be performed. These include when the large magnetic field, the sound from the gradient coils, the sensitivity to motion, or the confining nature of the main magnetic field coil prevent exerting the desired control over the state of the subject. For this reason, increasing the sensitivity of the PET activation technique is critical.
This work used group averages for all of the analyses. The increased difference signal from [15O]butanol also should make activation studies on individuals more sensitive and bears further investigation. The extent of the improvement depends on the main source of variation in the data set. If it is intersubject variability, then activation studies on individuals are more likely to be successful because variability decreases whereas signal remains high. There are several situations where the increased sensitivity (and thereby fewer replications) would enable activation research into normal brain function or patient evaluations with PET that might not be possible with functinal magnetic resonance imaging. These include the following: (1) when the task or condition is a safety hazard if repeated but safe in rare occurrence, such as inducing certain types of seizures; (2) when performance of the task leads to change in brain function, such as motor or cognitive learning; and (3) when the activation stimuli may cause a subsequent change in either baseline or activated brain–blood flow, such as direct brain electrical stimulation.
CONCLUSION
A side-by-side comparison of [15O]butanol and [15O]water has been performed. The same subjects were studied twice with the only difference being the tracer used. Both tracers appear to be measuring the same phenomena in that the experimental manipulation causes uptake of the tracer to change in the same direction. In the group analysis, the t statistic values for the [15O]butanol experiment are greater than the corresponding values for the [15O]water experiment.
The greater t statistic values appear to result from the higher PS product of [15O]butanol, which allows [15O]-butanol to enter and clear the brain much faster than [15O]water. It was anticipated that this would cause the [15O]butanol uptake to be greater than [15O]water uptake for equal injected doses but, due to affects prior to the tracer reaching the brain, the global uptake is approximately equal for the two tracers. However, the difference in uptake between high and low flow states is greater for [15O]butanol, which leads to a greater difference signal.
Subject and experimenter variation are the same for the [15O]butanol and [15O]water experiments in this work. And, since the total uptake is nearly the same, the radioactive counting statistics are roughly equal, which leads to nearly the same variation in the data for either [15O]butanol or [15O]water studies. All other factors being equal, the greater difference signal between on-task and control conditions for [15O]butanol leads to greater t statistic values. The most important advantages are less scan and cyclotron time to obtain comparable data and less radiation exposure either to individual subjects or to a study group. The greater signal may be traded off against the number of subjects studied to allow identifying an activation as significant with fewer Subjects. Or, with the same number of subjects, regions of weaker activation may be identified with [15O]butanol. In this study, data from 6 subjects with [15O]butanol give the same result as data from 10 subjects with [15O]water.