
Abstract
Recently, two methods have been proposed for regional cerebral blood flow (rCBF) quantitation using [123I]iodoamphetamine (IMP) and single-photon emission computed tomography (SPECT). The table look-up (TLU) method has been shown to provide both rCBF and volume of distribution, Vd, images from two SPECT scans, while a single-scan autoradiographic (ARG) technique provided rCBF using a fixed and assumed Vd. In both methods, a single blood sample was referred to calibrate the previously determined standard input function The present multicenter project was designed to evaluate the accuracy of both methods for use as clinical investigative tools. Ten independent institutions performed [123I]IMP-SPECT studies according to both methods in 76 subjects (10 normal volunteers, 32 patients with cerebrovascular disease, and 34 patients with other diseases). Calculated rCBF values were compared with those obtained by the following reference methods available in the participating institutions; [15O] H2O positron emission tomography (PET) (five institutions), [133Xe]SPECT (four institutions), and the [123I]IMP microsphere method (three institutions). Both ARG and TLU methods provided rCBF values that were significantly correlated with those measured by the [15O] H2O PET technique (p < 0.001 for all subjects; overall regression equation, y = 15.14 + 0.54×) and those measured by the [123I]IMP-microsphere method (p < 0.001 for all subjects; y = 2.0 + 0.80×). Significant correlation (p < 0.05) was observed in 18 of 24 subjects studied with the [133Xe] SPECT reference technique (overall regression equation, y = 15.0 + 0.55×). Mean cortical gray matter rCBF in a group of normal subject was 43.9 ± 3.3 and 43.4 ± 2.0 ml/min/100 g for the ARG and TLU methods, respectively. Regional Vd of [123I]IMP estimated by the TLU method was 45 ml/ml ± 20% in the normal cortical region. Close agreement between ARG and TLU rCBF values was observed (y = −3.21 + 1.07×, r = 0.97), confirming the validity of assuming a fixed Vd in the ARG method. Results of this study demonstrate that both the ARG and TLU methods accurately and reliably estimate rCBF in a variety of clinical settings.
123Iodine (123I) labeled N-isopropyl-p-iodoamphetamine (IMP) can provide a tomographic map of brain perfusion with single photon emission computed tomography (SPECT) (Winchell et al., 1980; Kuhl et al., 1982; Podreka et al., 1989; Greenberg et al., 1990; Yokoi et al., 1993; Yonekura et al., 1993; Odano et al., 1994; Nishizawa et al., 1989; Takeshita et al., 1992; Hashikawa et al., 1994; Murase et al., 1990; Ito 1995a). However, due to clearance of the tracer from the brain, imaging with conventional SPECT cameras may cause a systematic underestimation of global cerebral blood flow (CBF) and a reduction in contrast between high and low regional CBF (rCBF) regions. Recently, two methods, proposed by Iida et al., (1994a,b), provide absolute, quantitative rCBF using conventional [123I]IMP SPECT in a routine clinical setting. These two methods employ a two-compartment model and take the clearance of [123I]IMP from the brain into account. This allows delayed and prolonged SPECT data acquisition using a conventional rotating gamma camera. The so-called table look-up (TLU) method provides two functional parameters: rCBF and regional distribution volume, Vd, of [123I]IMP from two SPECT studies acquired at different times after the [123I]IMP administration. The second, autoradiographic (ARG), method provides a quantitative rCBF map from a single SPECT scan using an assumed Vd value. In both methods, frequent and/or continuous arterial blood sampling and measurements of the lipophilic fraction in each blood sample are avoided by employing a standard input function previously generated from an independent subject group (Iida et al., 1994a, b ; Munaka et al., 1992; Ito et al., 1992). Use of this standard input function has been validated previously both theoretically and clinically, and it has been demonstrated that individual differences of the input function do not significantly affect rCBF estimates (Iida et al., 1994a, b ; Munaka et al., 1992; Ito et al., 1992).
Previous studies (Iida et al., 1994a, b ) have also shown that quantitative rCBF values from these two methods are in good agreement with those obtained by previously established methods, e.g., nonlinear least square fitting to [123I]IMP kinetic data, the [123I]IMP-microsphere method, and the PET 15O water ARG technique. While these studies demonstrated the potential of these techniques, the number of subjects was limited and all validation studies were performed at a single institution. To evaluate the general applicability of the techniques in a large, heterogeneous patient population for a variety of SPECT systems, a multicenter project was initiated. Ten independent institutions participated in the project. Each institution compared rCBF values obtained from the IMP-TLU and IMP-ARG methods with rCBF measurements for the same patient using an established reference technique available at the institution.
METHODS
Institutions
Ten independent institutions in Japan (Table 1) participated in this project. All institutions performed [123I]IMP-SPECT on each subject following set protocols for the IMP-TLU and IMP-ARG methods. Each subject was also studied by the reference rCBF method available at the particular institution (Table 2).
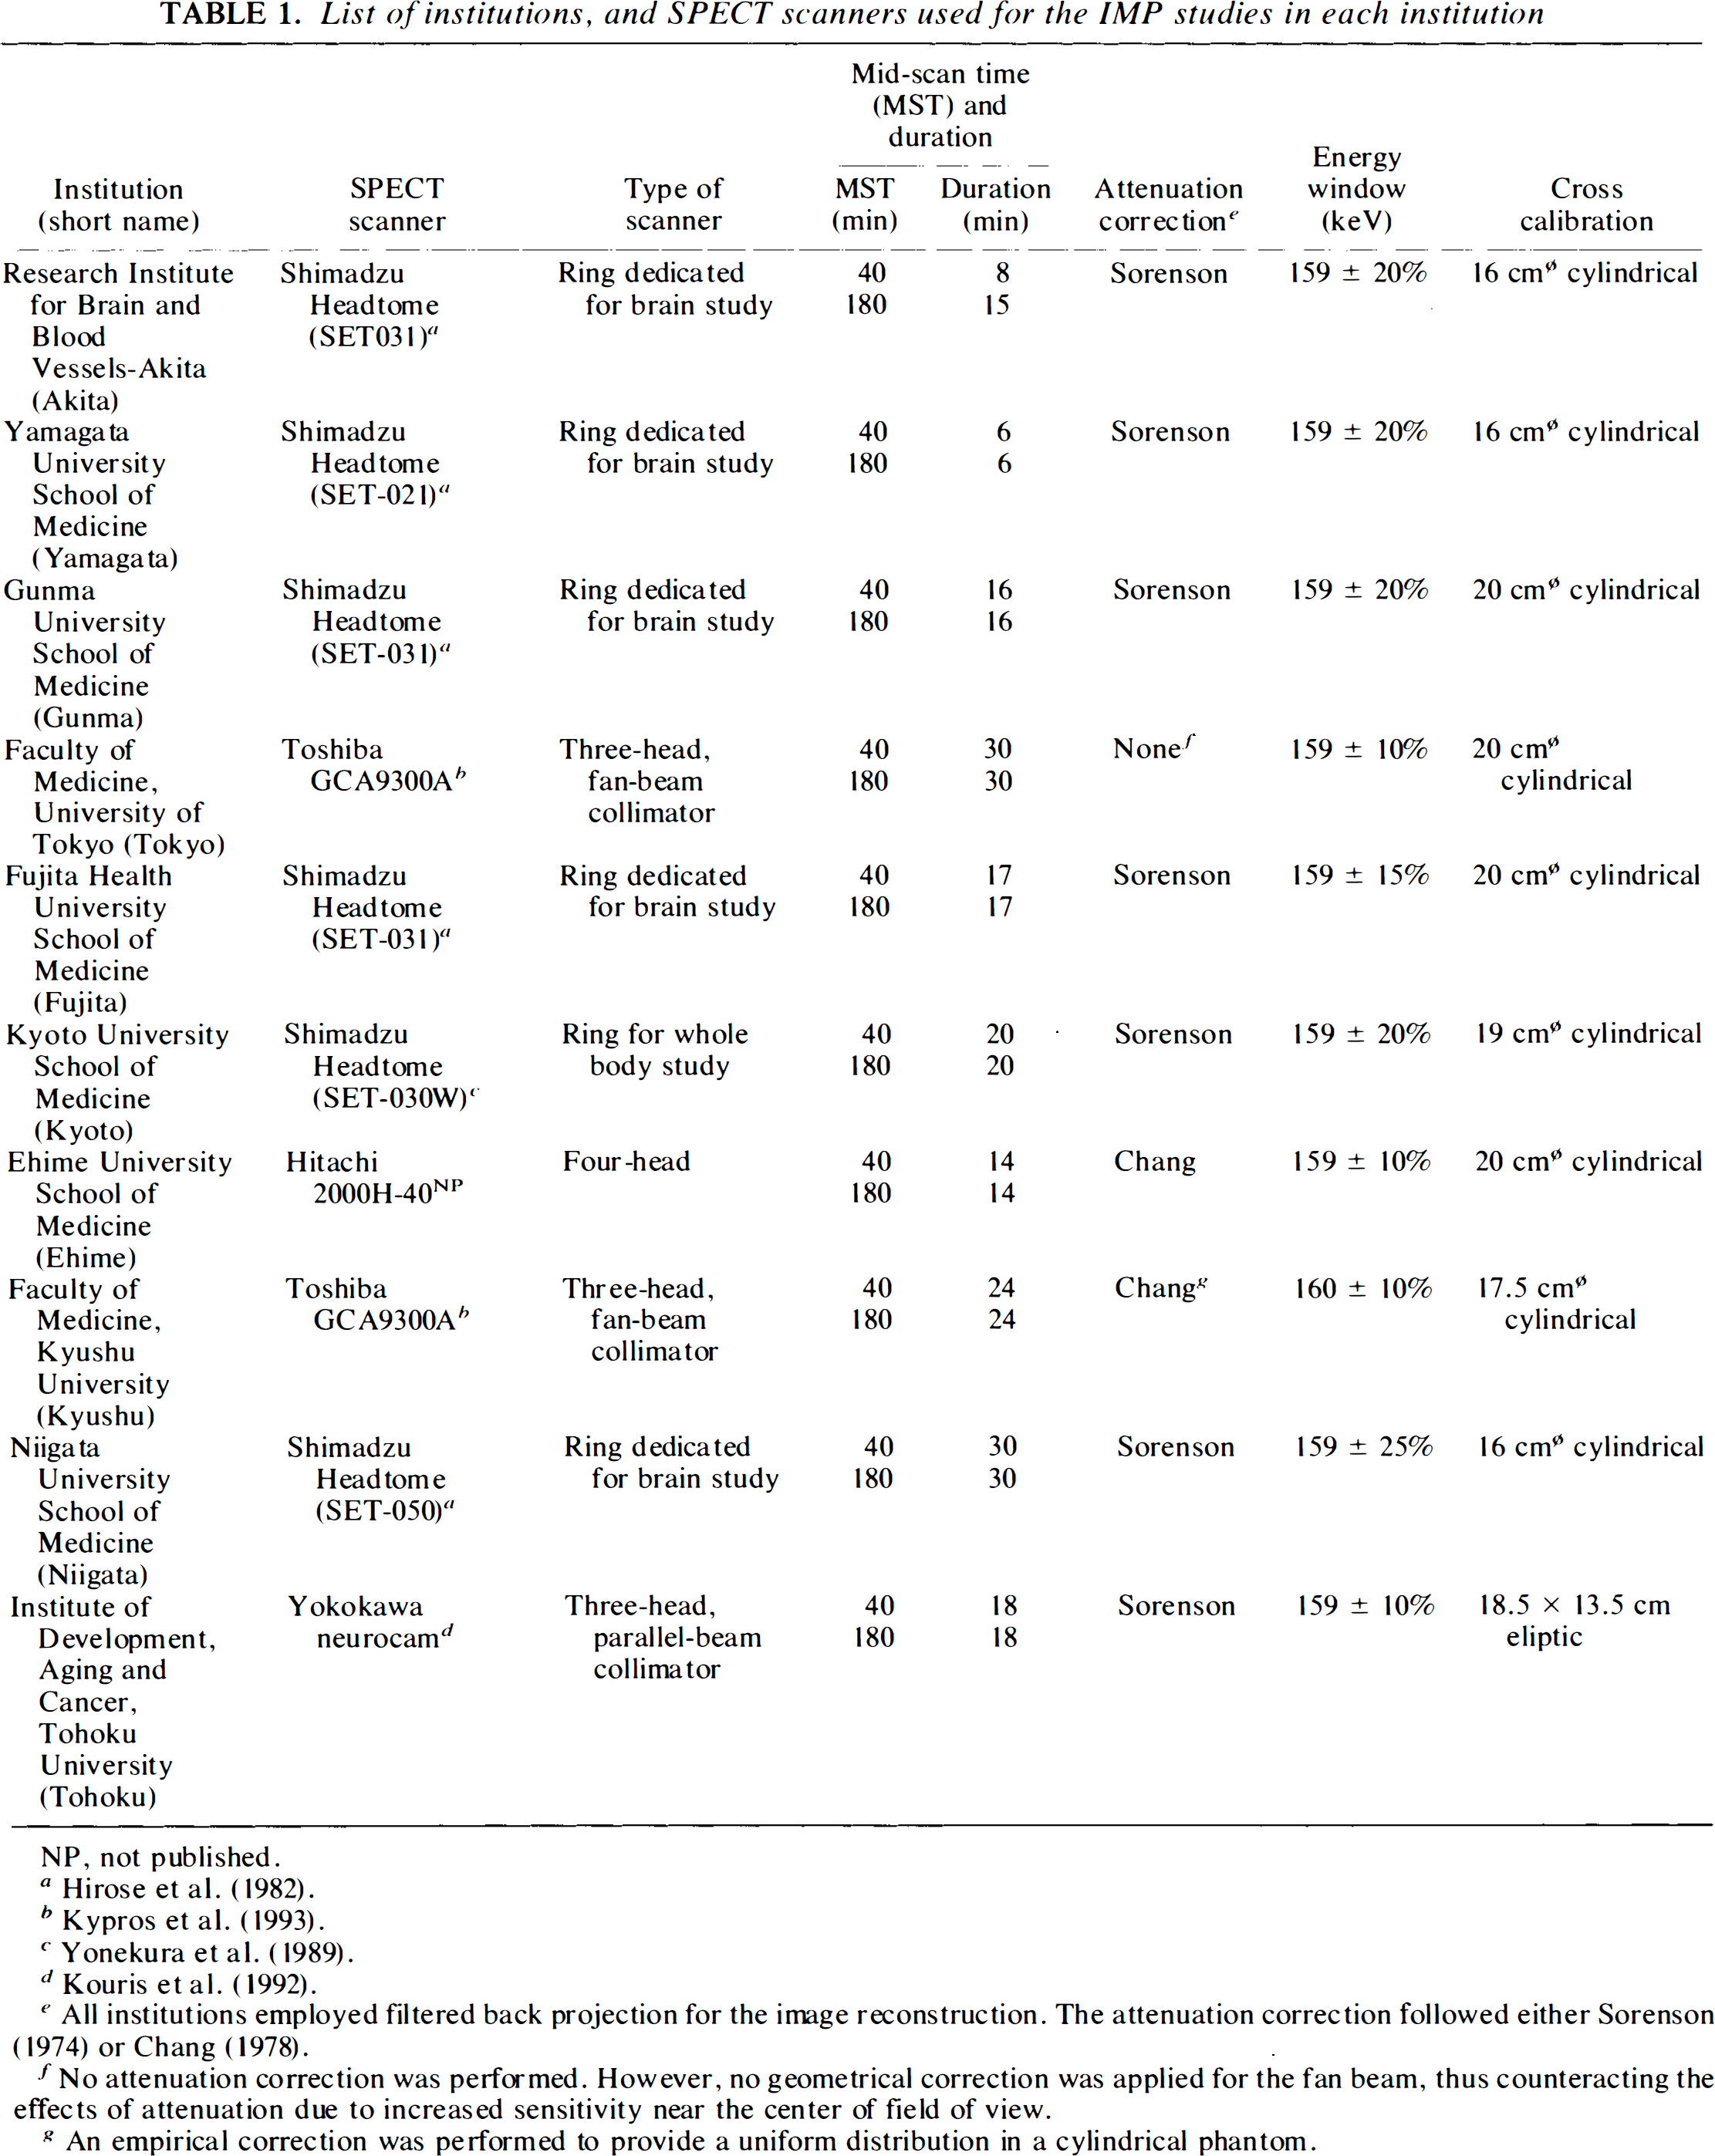
List of institutions, and SPECT scanners used for the IMP studies in each institution
NP, not published.
All institutions employed filtered back projection for the image reconstruction. The attenuation correction followed either Sorenson (1974) or Chang (1978).
No attenuation correction was performed. However, no geometrical correction was applied for the fan beam, thus counteracting the effects of attenuation due to increased sensitivity near the center of field of view.
An empirical correction was performed to provide a uniform distribution in a cylindrical phantom.
List of reference methods for each institution
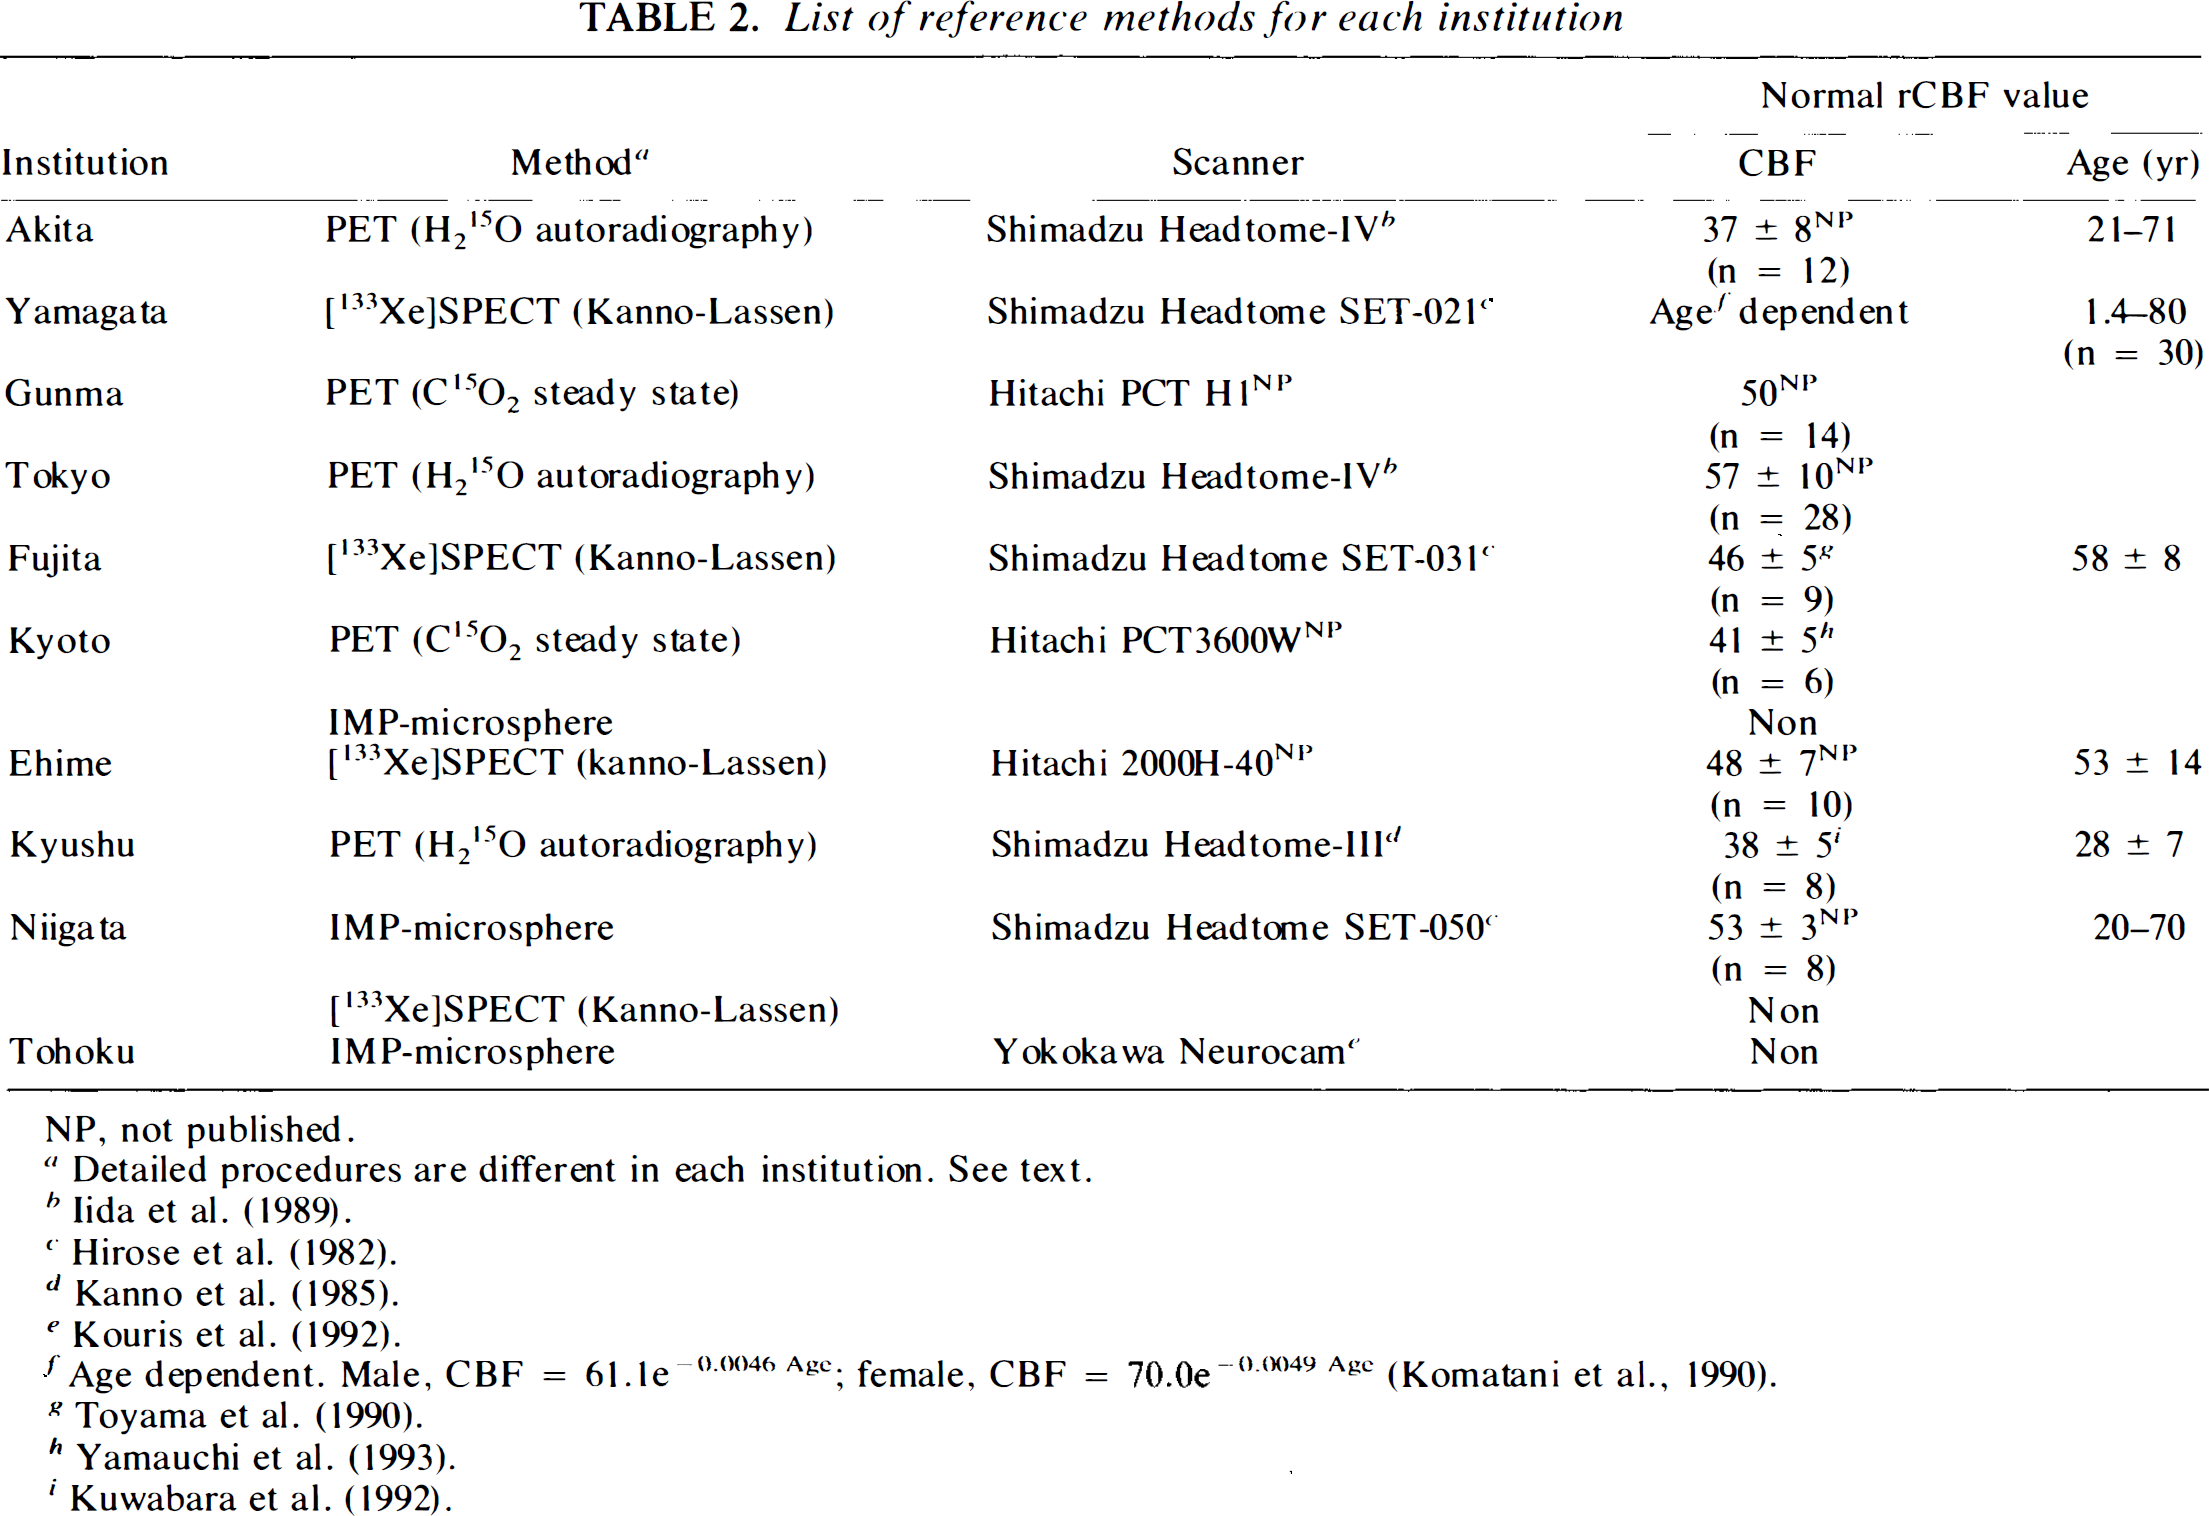
NP, not published.
Detailed procedures are different in each institution. See text.
Age dependent. Male, CBF = 61.1e−0.0046 Agc.; female, CBF = 70.0e−0.0049 Agc (Komatani et al., 1990).
Subjects
In total, 76 human subjects were studied [59 men and 17 women, aged 6–80 years (mean ± SD, 52 ± 18 years)]. The study group included 10 healthy volunteers (all men, aged 26–46 years, mean ± SD; 36 ± 7 years), 32 patients with cerebrovascular disease [17 cerebral infarction, five hemorrhage, two transient ischemic attack (TIA), six arteriovenous malformation (AVM), and two Moyamoya disease], 14 patients with degenerative neurological disorder (eight Alzheimer's, three Pick, and three Parkinson disease), three patients with brain tumors, nine patients with brain injuries, and seven patients with other disorders (deafness, headache, carotid-cavernous fistula, hypoxic brain, and motor ataxia). Two patient suffered from cardiac disease (one with heart failure), and there were six patients with lung disease. Nineteen subjects were smokers.
[123I]IMP-SPECT study protocol
The [123I]IMP-SPECT study followed the procedure described previously (Iida et al., 1994a, b ). Briefly, 111–222 MBq (3–6 mCi) of [123I]IMP was infused into the antecubital vein at a constant infusion rate for 1 min. At 10 min after the beginning of the [123I]IMP infusion, one arterial blood sample was taken and its whole blood radioactivity concentration counted using a well counter that was cross calibrated to the SPECT scanner. A single SPECT scan was performed at mid-scan time (MST) of 40 min after [123I]IMP administration. After repositioning the subject, another single SPECT scan was performed at MST of 180 min after the [123I]IMP administration. The duration of the SPECT scan varied between institutions, and ranged from 6 to 30 min (Table 1).
Each institution employed its own image-reconstruction protocol. Nine institutions performed attenuation correction (Table 1). The one institution (Tokyo) that did not perform attenuation correction, used fan-beam collimators, without applying geometrical corrections for the fan-bean collimators during reconstruction. This increased the pixel counts at the center of reconstructed images, thus compensating to some extent for attenuation. Akita was the only institution that performed scatter correction using an empirical procedure (subtraction of the scatter projection simulated for a cylindrical object).
All institutions performed cross calibration scans between the SPECT scanner and the well counter system. A uniform phantom, which contained 20–50 MBq of 123I was scanned by the SPECT scanner, and the solution in the phantom was sampled and its radioactivity concentration (cps/g) counted in the well counter. The shape and the size of the phantoms varied between institutions and are summarized in Table 1.
Reference methods
Within a short interval (minimum 30 min, maximum 1 week) before or after the [123I]IMP-SPECT study, all subjects were studied using an independent and established method of rCBF quantitation.
PET H215O reference technique
Five institutions performed H215O PET studies as the reference rCBF method before the [123I]IMP-SPECT study. Akita, Tokyo, and Kyushu employed intravenous H215O ARG (Raichle et al., 1983; Iida et al., 1986; Iida et al., 1992; Kanno et al., 1987; Iida et al., 1988; Iida et al., 1989). Scan duration was 90 s for Akitau and 75 s for Tokyo and Kyushu. A partition coefficient of p = 0.8 ml/ml was assumed in Akita, and p = 1.0 ml/ml for the other two institutions. Continuous arterial blood sampling was performed in all cases for the duration of the study. Delay and dispersion were corrected according to published techniques for Akita (Iida et al., 1986) and the other two institutions (Kanno et al., 1987). Two institutions (Gunma and Kyoto) performed C15O2 steady state rCBF measurements according to Frackowiak et al. (1980). Several arterial blood samples were taken in all studies, and whole blood radioactivity concentrations were measured in a well counter calibrated to the PET scanner. A water partition coefficient of p = 1.0 ml/ml was assumed in these two institutions.
[1231]IMP-microsphere reference technique
The [123I]-IMP-microsphere technique originally proposed by Kuhl et al. (1982) was employed in Kyoto, Niigata, and Tohoku. Data were obtained from the same injection of [123I]IMP as for the IMP-TLU and ARG methods. For the [123I]IMP-microsphere calculation, Kyoto used data from a 5-min SPECT scan performed at a MST of 5 min. In Kyoto, frequent, discrete arterial blood samples were obtained manually, separated into lypophilic fractions, and counted. Arterial blood was continuously withdrawn in Niigata and Tohoku for the first 5 and 8 min of the study, respectively. The SPECT MST were 30 min for Niigata and 40 min for Tohoku. SPECT studies were calibrated to the blood sampling period, with planar images collected at the end of the blood sampling period (Kuhl et al., 1982). Radioactivity concentrations of the octanol extracted fraction were counted in both institutions.
[133Xe]SPECT (Kanno-Lassen) technique
Yamagata, Fujita, Ehime, and Niigata employed the [133Xe]SPECT (Kanno-Lassen) technique (Kanno et al., 1979; Celsis et al., 1981) as reference. Following an inhalation of 133Xe for 1 min, dynamic SPECT images were acquired for 4 min, with the exception of Yamagata where data were acquired for 6 min. The end-tidal 133Xe concentration was monitored continuously and the input function obtained from this. In Yamagata and Fugita, the end-tidal partial pressure of CO2 was monitored during the study, and the calculated rCBF values were corrected for the change of Paco2 between the [123I]IMP and the [133Xe]SPECT studies (4% in rCBF per unit mmHg) in Yamagata.
Regions-of-interest (ROIs) definition
ROIs were drawn manually on reconstructed [123I]IMP images for both early and delayed SPECT scan data sets on the reference rCBF images. In each institution, ROIs were drawn on cortical gray matter, white matter, cerebellum, and deep gray matter. Exact definition of ROIs was at the discretion of each institution, but the same shape and size of ROIs were drawn for both the [123I]IMP and the reference rCBF images. Selected ROIs numbered between 15 and 25 in each subject. In total, 1,300 ROIs were obtained from all subjects.
rCBF calculation from [123I]IMP-SPECT
For all ROIs, rCBF values were calculated from the [123I]IMP-SPECT data sets according to both the IMP-TLU and the IMP-ARG algorithms. In both methods, arterial input function was determined by calibrating the previously determined standard input function (Iida et al., 1994a, b ; Munaka et al., 1992; Ito et al., 1992), with the blood sample obtained at 10 min. In the IMP-ARG calculation, the regional distribution volume of [123I]IMP, Vd, was assumed to be 45 ml/ml.
Data analyses
The rCBF values calculated by the IMP-TLU and IMP-ARG methods were compared with those obtained by the reference rCBF study for all ROIs of individual subjects. Calculated rCBF and Vd values were also averaged for four different brain areas in each subject, namely cortical gray matter, white matter, deep gray matter, and cerebellum. As well as comparing IMP-TLU and IMP-ARG against the reference method in individual subjects, data from all subjects were pooled for each institution to provide combined subject comparisons. Pearson's correlation analysis and linear-regression analysis were used to evaluate relationships between two different measurements for each patient and institution. Comparison of multiple data sets were performed using a one-way analysis of variance (ANOVA). Paired t-tests were used to identify specific differences of paired data. Student's t test was used to compared data from different institutions; p < 0.05 was considered statistically significant.
RESULTS
Results of the correlation analysis performed in each institution are summarized in Table 3.
Summary of results of the linear regression analysis in each institution
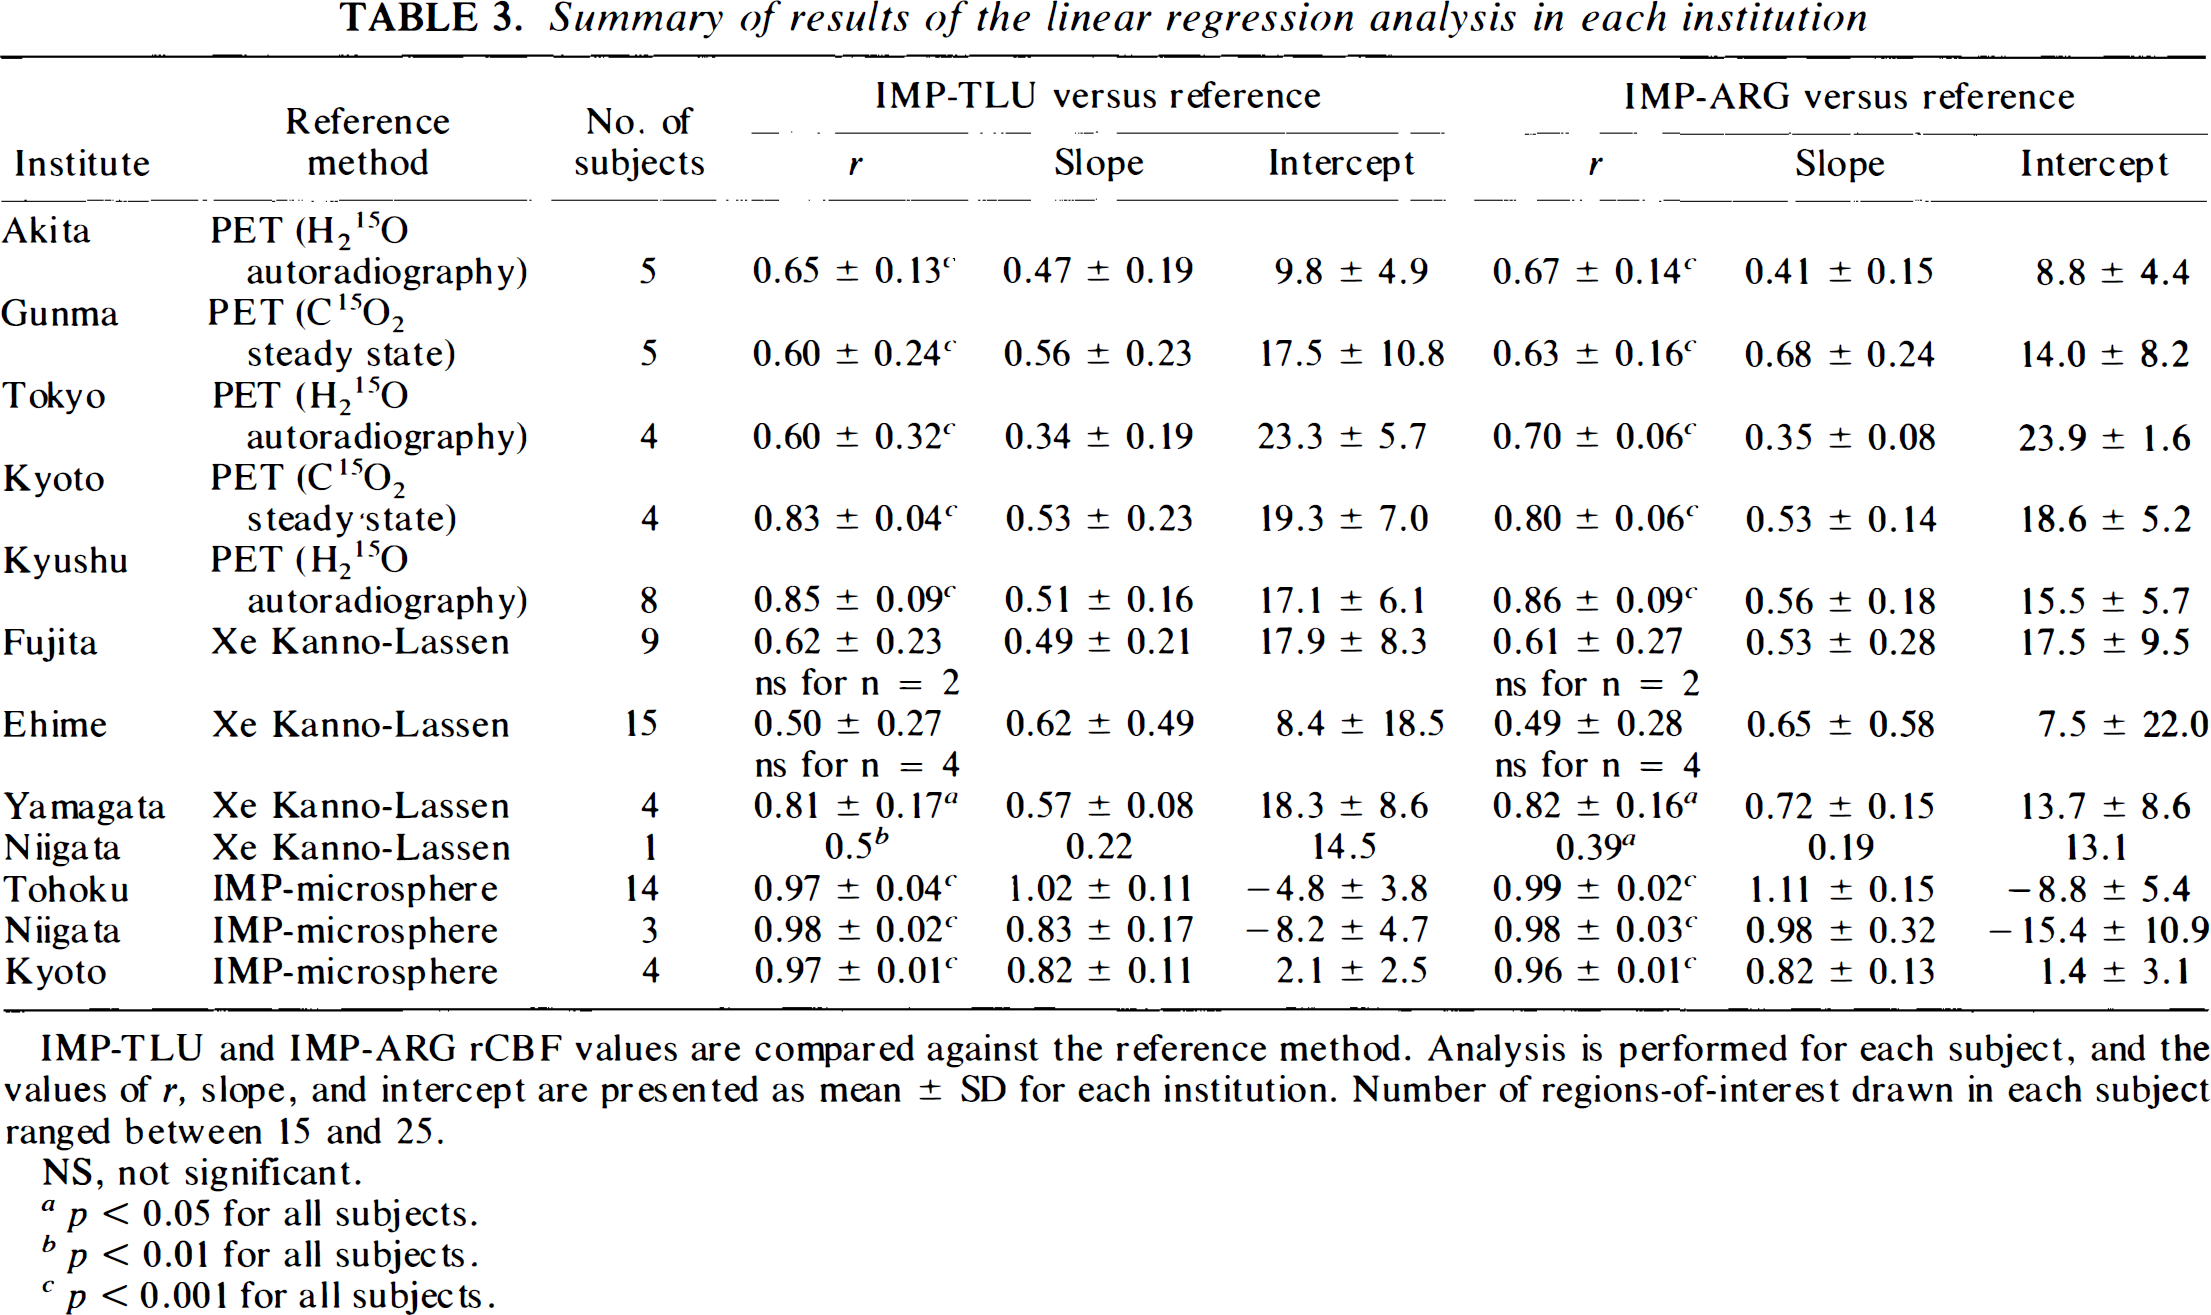
IMP-TLU and IMP-ARG rCBF values are compared against the reference method. Analysis is performed for each subject, and the values of r, slope, and intercept are presented as mean ± SD for each institution. Number of regions-of-interest drawn in each subject ranged between 15 and 25.
NS, not significant.
p < 0.05 for all subjects.
p p < 0.01 for all subjects.
p 0.001 for all subjects.
Five institutions (Akita, Gunma, Tokyo, Kyoto, and Kyushu) showed that the rCBF values obtained by the IMP-TLU and IMP-ARG methods were significantly correlated (p < 0.001) with those from the H215O PET method in all subjects (Table 3). Combined subject correlation was also found to be significant in four institutions for both IMP-TLU and IMP-ARG methods against H215O PET. Correlation for Tokyo combined subjects was not significant (r = 0.42 and 0.41 for IMP-TLU and ARG methods, respectively). IMP-ARG rCBF values for all subjects are plotted against the 15O PET reference in Fig. 1. Values of rCBF were averaged for each of the four main brain areas in each subject, namely cortical gray matter, white matter, and deep gray matter, and cerebellum.
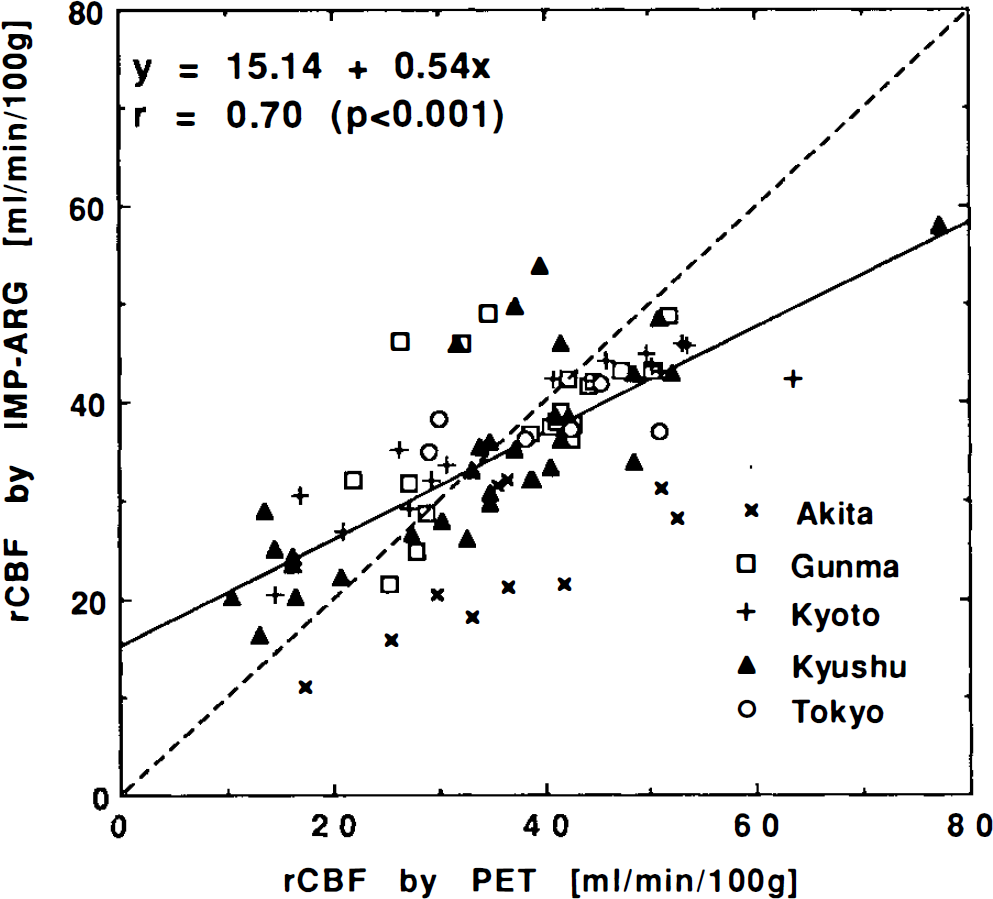
Combined subject correlations of rCBF values calculated by the IMP-ARG method with those by the H215O PET method. Data were obtained from five institutions: Akita (×), Gunma (□), Kyoto (+), Kyushu (▴), and Tokyo (○). Values of rCBF were averaged for each of the four main brain areas in each subject, namely cortical gray matter, white matter, cerebellum, and deep gray matter. Significant correlations were observed in four institutions. Akita: y = 5 + 0.51×, r = 0.74 (p < 0.01); Gunma: y = 20 + 0.49×, r = 0.57 (p < 0.05); Kyoto: y = 19 + 0.49×, r = 0.92 (p < 0.001); and Kyushu: y = 14 + 0.59×, r = 0.81 (p < 0.001). Correlation appeared not to be significant for Tokyo (r = 0.41), probably due to lack of appropriate attenuation correction and, thus, failure of the cross calibration. Significant correlation was also found for all data: y = 15 + 0.54×, r = 0.70 (p < 0.001). Dashed straight line denotes line of identify.
In three institutions (Tohoku, Niigata, and Kyoto), the rCBF values obtained by the IMP-TLU and IMP-ARG methods were shown to be significantly correlated (p < 0.001) with those obtained by the [123I]IMP-microsphere method in all subjects (Table 3). High correlation (p < 0.001) was also found in the combined subjects comparisons in all three institutions for both the IMP-TLU and IMP-ARG methods. IMP-ARG values are plotted against this reference method in Fig. 2. In Kyoto and Tohoku, the rCBF values calculated by the IMP-TLU or IMP-ARG methods were not significantly different from those obtained by the [123I]IMP microsphere method, and the slopes of the regression lines were not significantly smaller than unity. However, in Niigata, the rCBF values obtained by the IMP-TLU and IMP-ARG methods were significantly smaller than those measured by the [123I]IMP-microsphere method (p < 0.001). This appeared to be due to a systematic overestimation of rCBF by the [123I]IMP-microsphere method, rather than underestimation by the IMP-TLU and IMP-ARG methods (see Discussion).
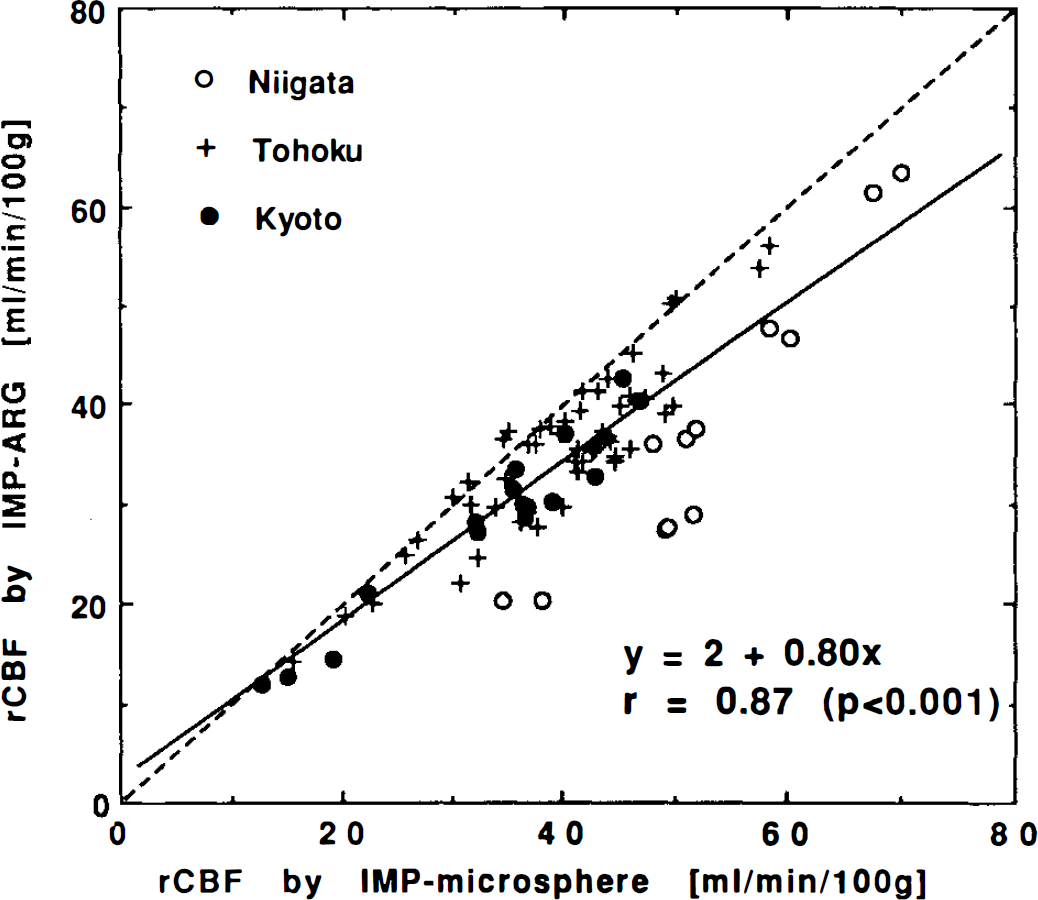
Combined subject correlations of rCBF values calculated by the IMP-ARG method with those by the [123I]IMP-microsphere method. Each datum corresponds to the average for each of the four main brain areas in each subject (same as Fig. 1). Data were obtained from Niigata (○), Tohoku (+), and Kyoto (•). Significant correlation was observed for all institutions. Niigata: y = −31 + 1. 3×,r = 0.95 (p < 0.001); Tohoku: y = 1 + 0.86×, r = >0.90 (p < 0.001); Kyoto: y = 0 + 0.85×, r = 0.97 (p < 0.001). Correlation was also significant for all data: y = 2 + 0.80×, r = 0.87 (p < 0.001). The calculated rCBF values by the IMP-ARG methods were significantly (p < 0.001) smaller in Niigata compared with those measured by the [123I]IMP-microsphere method. Dashed straight line denotes line of identify.
The four institutions of Yamagata, Niigata, Fujita, and Ehime demonstrated that the rCBF values obtained by the IMP-TLU and IMP-ARG methods were significantly correlated with those obtained by the 133Xe Kanno-Lassen method, except for six subjects, as shown in Table 3. Averaged p-values for the [133Xe]SPECT method were, however, larger than those from the other two reference methods. Correlations of combined subject data were found to be significant in Fujita, Yamagata, and Niigata, but not in Ehime, for both IMP-TLU and IMP-ARG methods (Fig. 3). It was found in Yamagata that Paco2 was greatly different between [123I]IMP and 133Xe studies in two subjects; this was thought to be responsible for the not significant grouped subject correlation of both the IMP-TLU and IMP-ARG methods (r = 0.14 and r = 0.15 for the IMP-TLU and IMP-ARG methods, respectively, before the correction). A correction of 4% in rCBF per unit mmHg in Paco2 increased the correlation coefficients (r = 0.51 and r = 0.57 for IMP-TLU and IMP-ARG, respectively), and the correlation became significant (p < 0.05) for both methods. No significant difference was observed in Paco2 in Fujita between the [123I]IMP and 133Xe studies, and the grouped correlation was significant without the correction for Paco2.
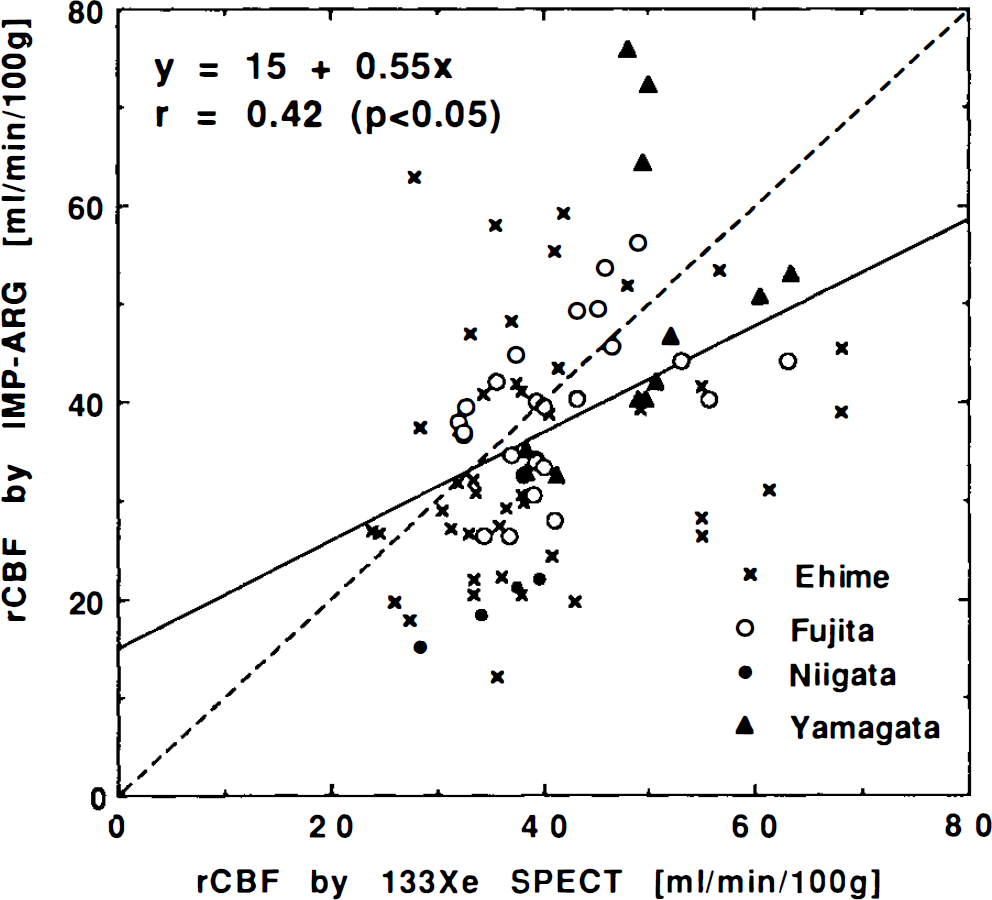
Combined subject rCBF values calculated by the IMP-ARG method compared with those by the 133Xe-SPECT (Kanno-Lassen) method. Data correspond to the average for each of the four main brain areas in each subject (same as Fig. 1). Data were obtained from Ehime (crosses), Fujita (open circles), Niigata (filled circles), and Yamagata (filled triangles). Significant correlation was found in Fujita (y = 18 + 0.51×, r = 0.49, p < 0.05), Niigata (y = −3 + 0.62×, r = 0.99, p < 0.001) and Yamagata (y = 10 + 0.80×, r = 0.51, p < 0.05), but not in Ehime (r = 0.08). Correlation was significant for all data (y = 15 + 0.55×, r = 0.42, p < 0.05). The dashed straight line denotes the line of identify. Data for Yamagata were corrected for differences in Paco2 between the studies.
Typical functional images obtained from a healthy volunteer (data from Akita) are shown in Fig. 4: images of rCBF and Vd of water obtained by PET with H2I5O, images of rCBF and Vd of [123I]IMP obtained by the IMP-TLU method, and an rCBF image obtained by the IMP-ARG method. It can be seen that there is excellent agreement between the IMP-TLU and the IMP-ARG rCBF images. It can also be seen that these two rCBF images compare well with those measured by PET, despite systematic underestimation in gray matter and systematic overestimation in white matter. The Vd of [1231]IMP was relatively homogeneous throughout the whole brain.
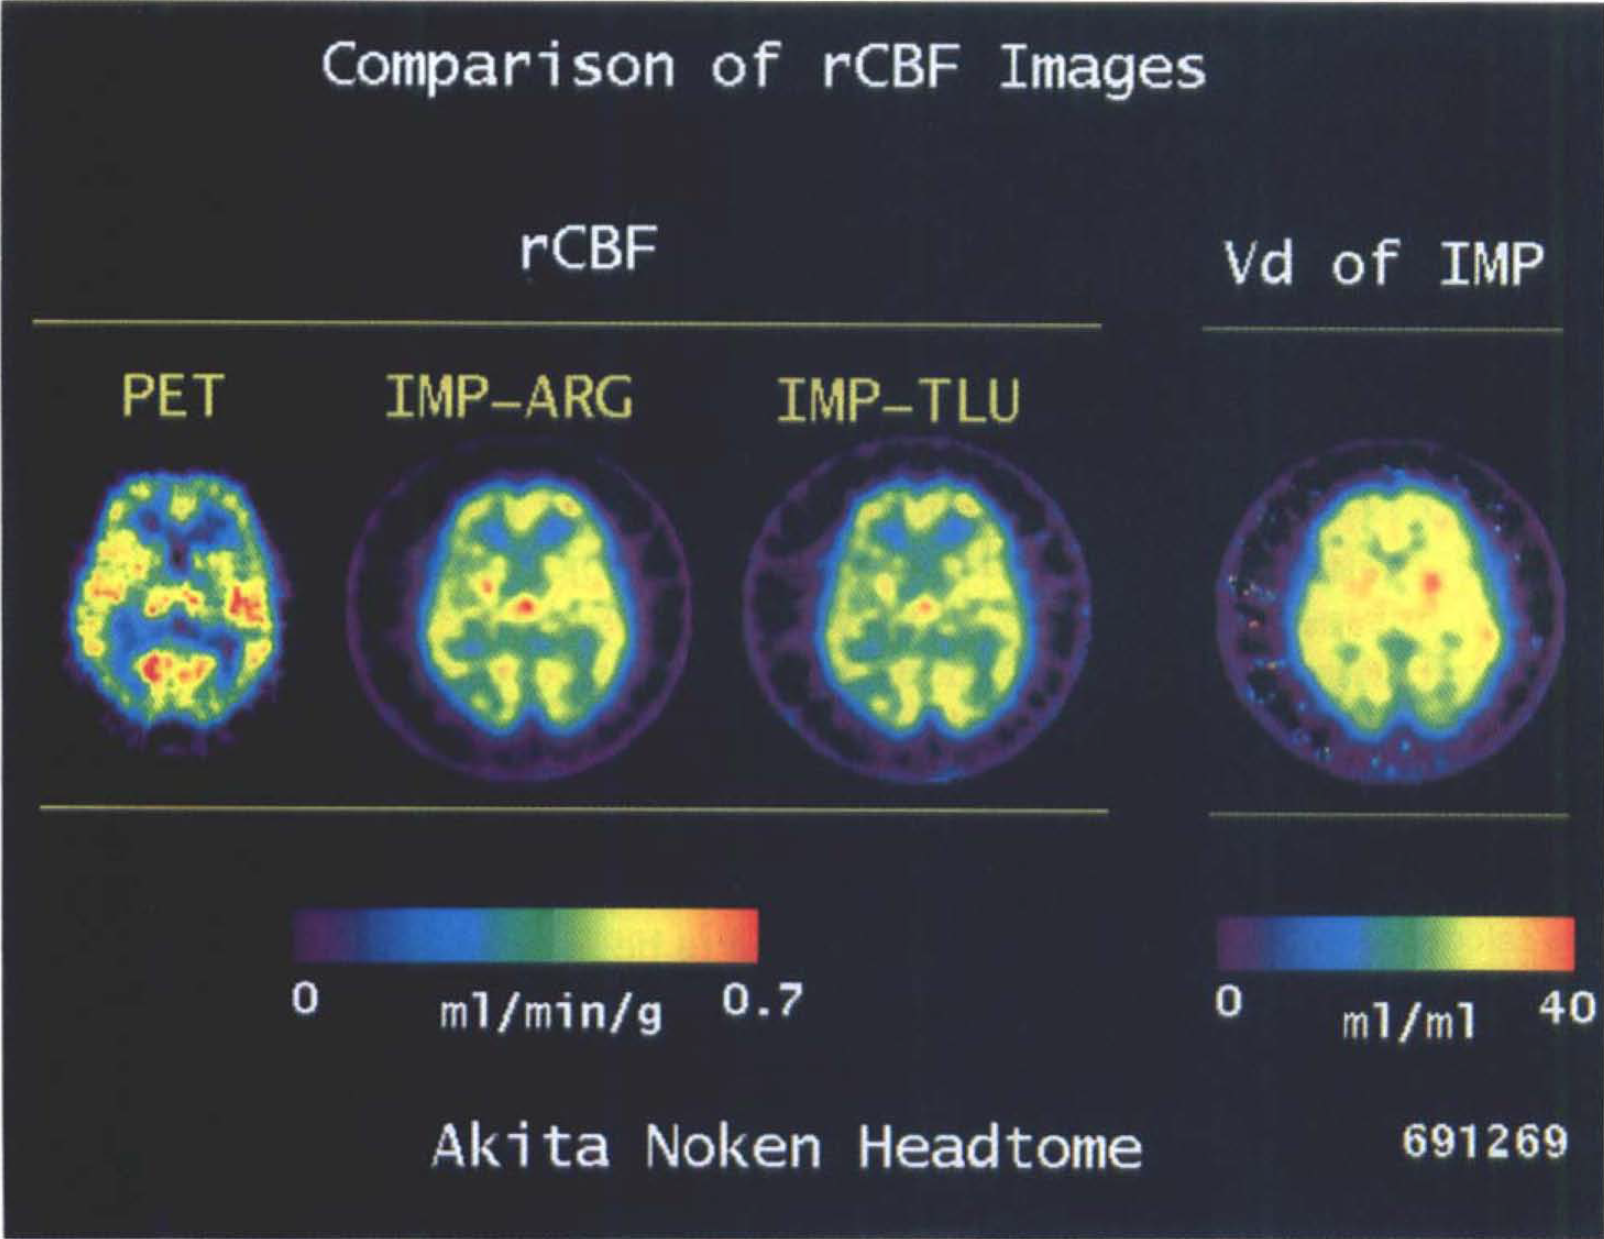
Functional rCBF images of representative tomographic slice of the brain obtained from a healthy volunteer in Akita; 0–15 water PET, IMP-ARG, and IMP-TLU methods, together with the Vd (distribution volume) image calculated by the IMP-TLU method. The same absolute color scale is used for the three rCBF images. It can be seen that the rCBF images obtained by the IMP-TLU and the IMP-ARG methods show close agreement, but, compared with the PET images, are slightly reduced in high rCBF areas, and somewhat elevated in low rCBF areas.
Figure 5 compares the rCBF values calculated by the IMP-ARG method against those calculated by the IMP-TLU method. There was no significant difference between the two methods.
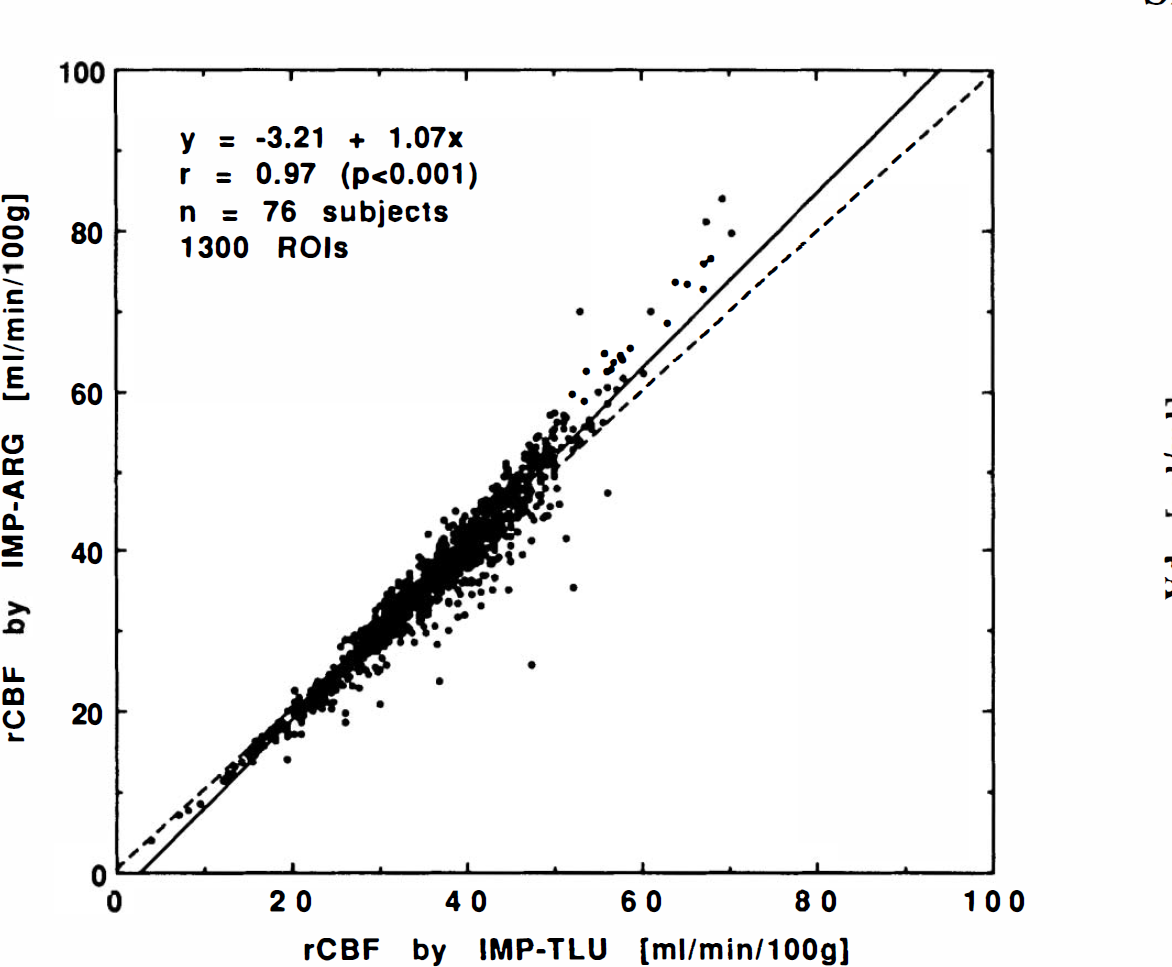
Comparison of calculated rCBF values obtained by the IMP-ARG method with those by the IMP-TLU method. There was no significant difference between the two methods, confirming the validity of fixing the Vd value in the IMP-ARG method.
Values of Vd calculated by the IMP-TLU method (averaged for the four regions in each institution) are summarized in Fig. 6 for all institutions. Calculated Vd values showed no significant difference among the regions. Average Vd values were 47.5 ± 8.6 for cortical gray matter, 45.2 ± 19.2 for white matter, 42.0 ± 11.2 for the cerebellum, and 46.6 ± 11.8 ml/ml for deep grey matter regions. There was no significant difference in the averaged Vd values among the institutions except for Akita (significantly smaller compared with the other nine institutions, p < 0.05).
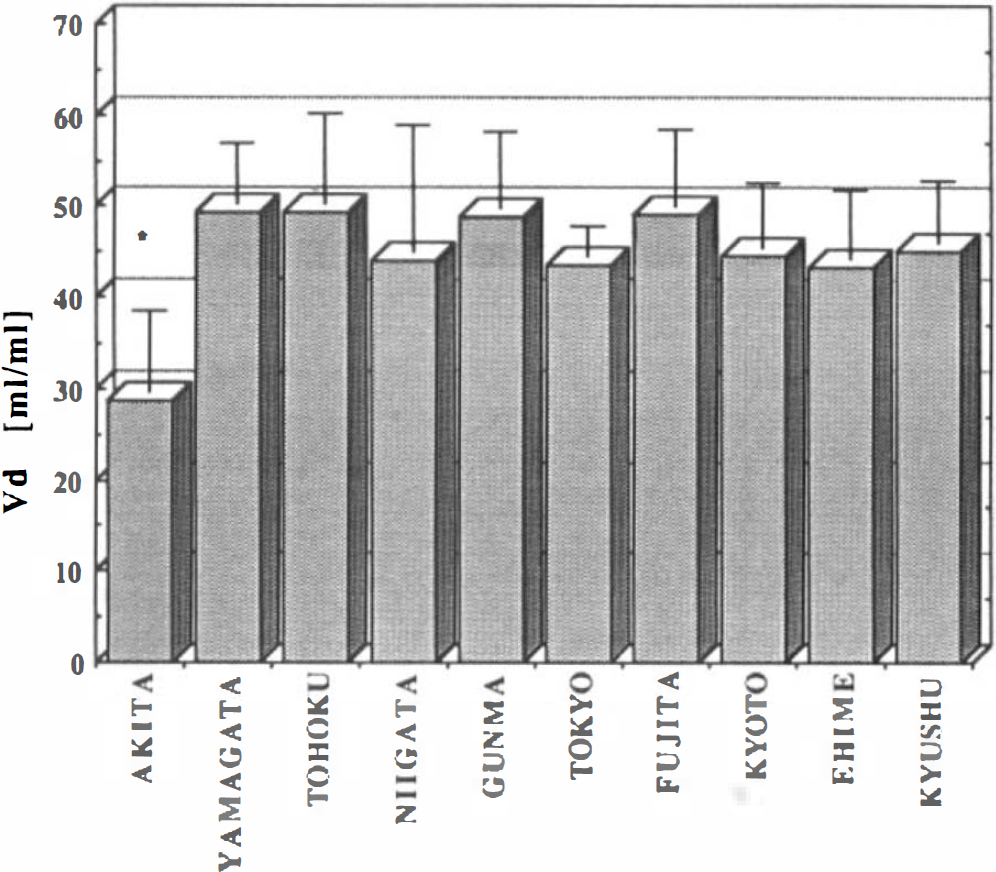
The Vd values obtained by the IMP-TLU method (mean ± 1 SD) in each institution. The Vd value averaged for all subjects was 43 ± 9 ml/ml. The Vd value showed no significant difference among nine institutions, with the exception of Akita with a significantly smaller Vd (p < 0.05).
Normal rCBF values obtained from Gunma are summarized in Table 4. No significant difference was found in rCBF between the IMP-TLU and IMP-ARG methods. Normal rCBF values calculated by the IMP-TLU and IMP-ARG methods were also not significantly different from those measured with the H215O PET method. There was no significant difference in the calculated Vd values among the regions.
Summary of rCBF and Vd values obtained from four healthy volunteers at Gunma University (age, 41 ± 6.3 years)
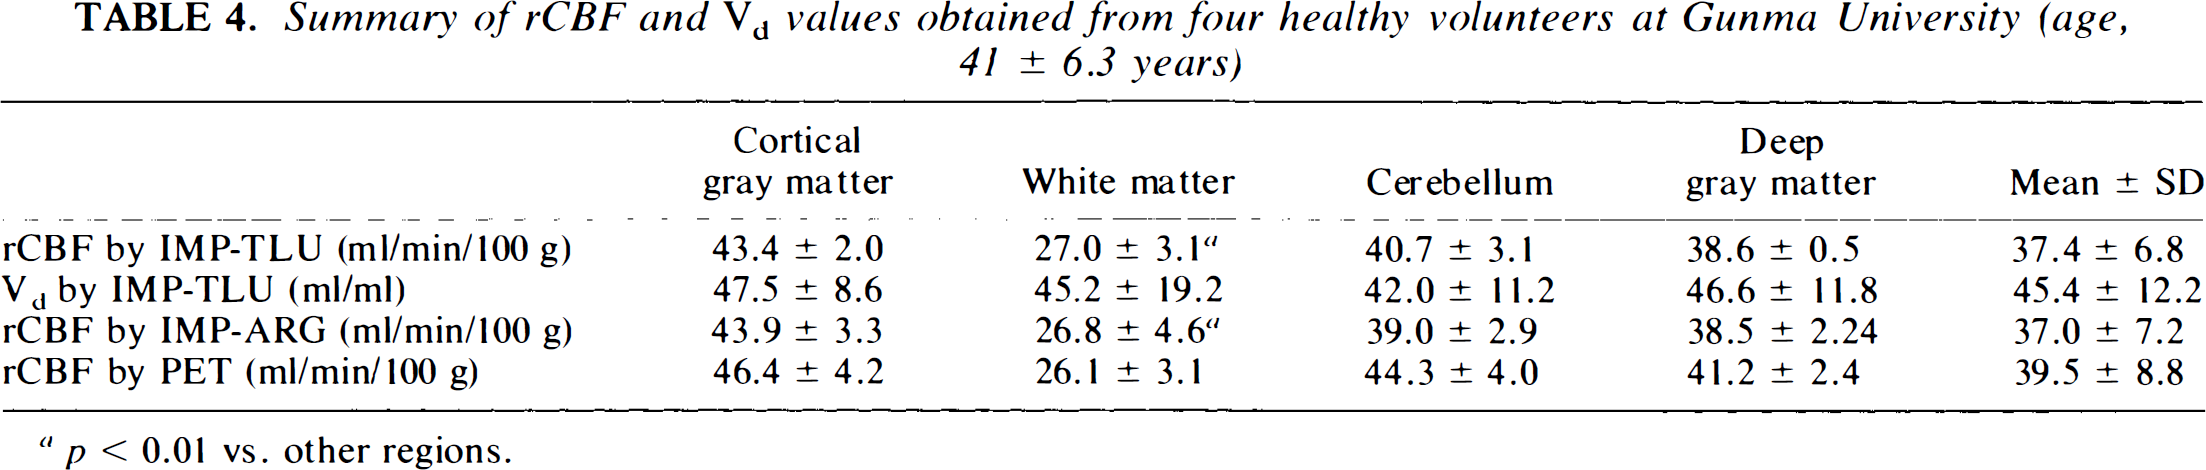
p < 0.01 vs. other regions.
DISCUSSION
Validity of IMP-TLU and IMP-ARG methods
This multicenter project demonstrated the validity of recently proposed IMP-TLU and IMP-ARG methods for noninvasive quantitation of rCBF in humans. It was shown in five institutions that these two methods provided rCBF values that were well correlated and quantitatively consistent with those obtained by PET and H215O. Normal rCBF values were also found to be in good agreement with those measured by the H215O PET and normal values published in the literature (Frackowiak et al., 1980; Yamaguchi et al., 1986; Pantano et al., 1985). The high correlation with the [123I]IMP-microsphere technique further confirms the validity of the two methods. The correlation for combined subject data (p < 0.001 for both methods) shown in Fig. 2 clearly demonstrates that a standard input function calibrated with a single blood sample provides reliable results in the heterogeneous patient population encountered in the routine clinical practice.
This study clearly demonstrates that both the IMP-TLU and IMP-ARG methods provide reliable estimates of rCBF in heterogeneous patient populations using a diverse range of SPECT equipment. The techniques do not require fast dynamic SPECT acquisitions, but can utilize data from prolonged and delayed conventional SPECT scans with good counting statistics. Thus, the techniques are generally applicable and not restricted to using specific instrumentation or specialized techniques not generally available. This study also validates the use of a single standardized input function across institutions, eliminating the need for frequent arterial blood sampling or the requirement for each institution to determine its own standardized input function.
The technical procedures of the IMP-TLU and IMP-ARG methods are simple enough for routine clinical use. In this study, the single arterial blood sample was not found too onerous, even in a clinical setting. A recent study by the Tohoku group (Ito et al., 1994) confirmed that arterial blood sampling may be replaced by venous blood sampling, further simplifying the protocol. However, arterial blood sampling would still be needed for measuring the Paco2, which greatly influences absolute rCBF.
Validity of fixing Vd in the IMP-ARG method
Previous simulation studies (Iida et al., 1994b) showed that the error sensitivity of rCBF to assumed Vd values was related to the rCBF value. High sensitivity to errors in the assumed Vd value were observed only in regions of relatively high rCBF, with little error being introduced in areas of low CBF. Since Vd appears to be primarily decreased only in areas of low rCBF and is generally normal in high flow areas, the assumption of a fixed Vd was expected to introduce little error in the rCBF value. The good agreement of rCBF values between the IMP-TLU and IMP-ARG methods in our heterogeneous patient population (Fig. 5) confirms the simulation results and the validity of assuming a fixed Vd value in the IMP-ARG method. Since the IMP-ARG method requires only a single SPECT scan, whereas the IMP-TLU method requires two SPECT scans, the IMP-ARG method is the method of choice for routine clinical use, unless the Vd map is also required.
The Vd image, however, provides additional information, which might be clinically and prognostically useful. Odano et al. (1993) demonstrated that rCBF was reversible in areas that exhibited [123I]IMP redistribution in patients with cerebrovascular diseases. Vd, which is independent of flow, relates to the affinity of [123I]IMP in brain tissue (physiological partition coefficient) and the number of cells (amount of brain tissue in units of gram of tissue within a volume element), in a quantitative manner. Quantitative evaluation of Vd might provide identification of the ischemic penumbra in patients with cerebrovascular disease. Further studies are warranted to investigate the clinical significance of the quantitative Vd map.
Comparison with H215O PET method
Despite the high correlation of the two methods with the H215O PET method for all subjects in all five institutions, the slopes of the linear regression lines were significantly smaller than that of the identity line. This may be due to errors in the SPECT reconstruction, i.e., imperfect attenuation correction, scatter, and limited spatial resolution of the scanner [partial volume effect, (PVE)]. Another possible explanation for the systematic underestimation at high flow may be due to the limited first pass extraction fraction of [123I]IMP in the brain. It was shown by the Ehime group (Murase 1991) that rCBF values can be significantly underestimated at high rCBF, e.g., >50 ml/min/100 g. Although [123I]IMP has a relatively high first-pass extraction among the commercially available rCBF SPECT tracers, a correction would be required in quantitation at a high rCBF range (see Fig. 7). Several other factors are also likely to have contributed to the observed difference with the PET technique: misalignment of ROIs between the SPECT and PET images, poorer (different) spatial resolution of SPECT compared with PET, and physiological change of rCBF between the studies.
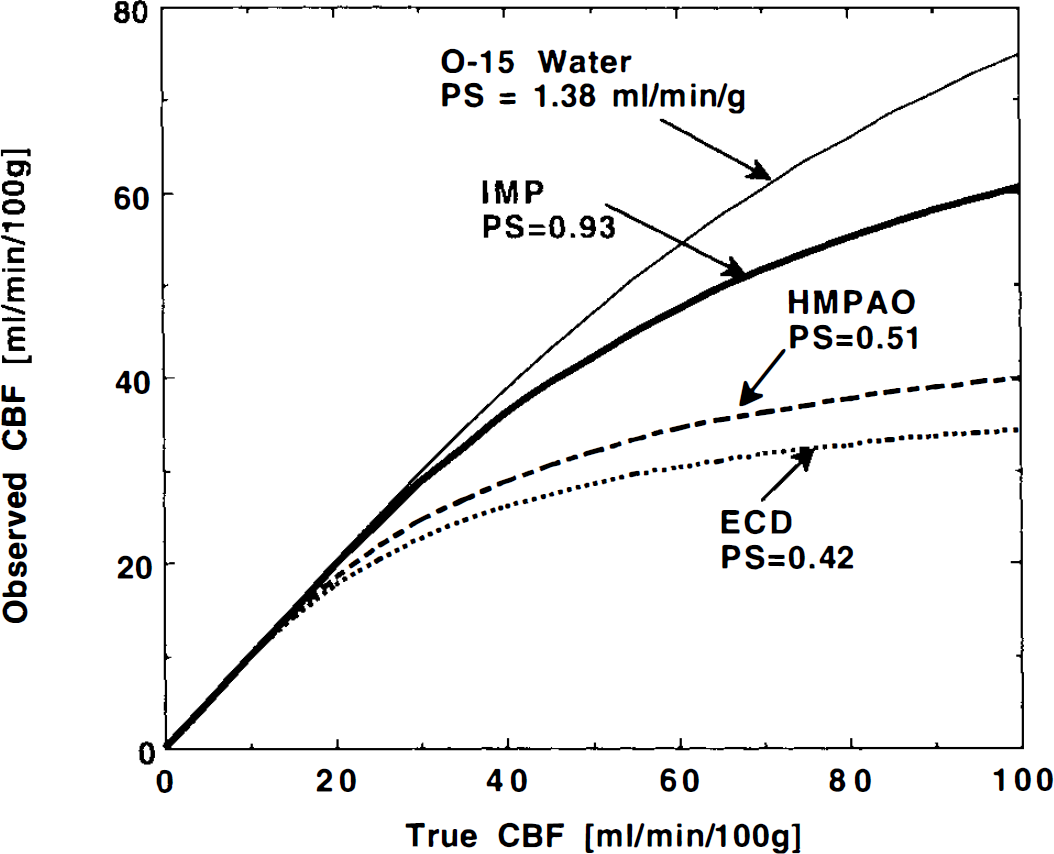
Underestimation of observed rCBF due to the limited first-pass extraction fraction. The underestimation was estimated for four permeability-surface area product (PS) values, corresponding to four rCBF tracers of H215O, [123I]IMP, 99mTc-hexamethyl-propylene-amineoxime (99mTc-HMPAO), and 99mTc-bicisate (99mTc-ECD), respectively, according to the Renkin-Crone's equation (Renkin, 1959; Crone, 1963). PS values were obtained by Eichung et al. (1974) for H215O, and by the Ehime group for other tracers (Murase et al., 1991).
The combined subject correlations were not significant in Tokyo for both IMP-TLU and ARG methods. This is probably due to the attenuation correction not being performed in the SPECT reconstruction and, thus, failure in the cross calibration. It is likely that the geometrical factor of the fan-beam collimators do not correct for attenuation sufficiently to provide reliable cross calibration. Proper attenuation correction might have produced significant correlation in this institution as well.
Comparison with the [123I]IMP microsphere method
The correlation with the [123I]IMP microsphere method was better than that with the H215O PET method. This is because of the fact that errors associated with the physical factors (attenuation correction error, scatter and PVE) are similarly included in the IMP-TLU, ARG and [123I]IMP microsphere methods. In addition, ROIs were applied to the same SPECT data set for the comparison analyses.
The institution dependence of the slopes of the regression analysis shown in Fig. 2 (Niigata showed significant difference from others) is probably due to [123I] IMP-microsphere protocol differences between institutions. The integration period of the input function corresponded to the SPECT MST in Kyoto (MST and the integration period, 5 min). On the other hand, Tohoku and Niigata performed a delayed SPECT scan at MST = 40 and 30 min, respectively, well after the end of the input function integration periods of 8 min in Tohoku and 5 min in Niigata. The disparate (incomplete) integration period would cause systematic underestimation in the integration of the input function, and, therefore, systematic overestimation is expected in rCBF, with proportionately larger errors for shorter integration periods (i.e., more overestimation in Niigata than Tohoku). Planar images collected at the end of the blood sampling period were used in the IMP-microsphere method to calibrate the delayed SPECT images back to the input function integration period (Kuhl et al., 1982). Despite this correction, a systematic error (underestimation) can be expected in the rCBF estimates when using delayed SPECT scans, as demonstrated by Takahashi (1994). Again, this effect is expected to be more pronounced in Niigata, with the shorter input function integration period of 5 min, compared to 8 min in Tohoku. Another error source might be due to intravascular radioactivity when calibrating SPECT data with the planar image. Blood radioactivity, particularly in extracranial vessels, would be another error source in the microsphere calculation (Ito et al., 1995b), which would overestimate the global CBF in the calibration procedure of using the planar image. These factors can cause systematic errors in Niigata and Tohoku with different magnitudes, and, thus, might be the reason for the institution dependency.
While the procedures for the IMP-ARG and IMP microspheres methods may appear technically very similar and provide similar results, the IMP-ARG method has several advantages over the [123I]IMP microsphere method in a routine clinical setting. Firstly, arterial input function can be estimated from single blood sampling, whereas the [123I]IMP microsphere method requires continuous blood withdrawal from an arterial line, which is more laborious and invasive. Secondly, correction for the clearance of [123I]IMP from the brain is included in the mathematical formulation in the IMP-ARG method, and, thus, acquisition of planar images can be avoided. Thirdly, the use of the standard input function obviates the need for separating the lypophilic fraction.
Comparison with 133Xe-Kanno-Lassen method
Four institutions demonstrated that rCBF values calculated by the IMP-TLU and IMP-ARG methods were significantly correlated with those measured by the 133Xe-Kanno-Lassen technique in most studies (23 of 29 subjects). The correlations were, however, not as good as comparisons against the H215O PET or the [123I]IMP-microsphere techniques. As demonstrated in previous works, this can be attributed to limitations of the 133Xe Kanno-Lassen technique: (a) large error sensitivity to the gray and white matter mixture, i.e., PVE (Iida et al., 1995); (b) systematic overestimation in the area of small structure (Rezai et al., 1988; Iida et al., 1995); (c) large error sensitivity to ambiguous Vd of 133Xe (Gong et al., 1994); and (d) errors in determination of the input function from the end-tidal radioactivity (Hansen et al. 1990; Hazelrig et al., 1985). In this project, large rCBF values (e.g., >60 ml/min/100 g) were unexpectedly obtained by the [133Xe]-SPECT method in several white matter and infarcted regions, possibly caused by the above error sources.
Of the four institutions, Ehime selected the largest size ROIs, and this might be the reason for the nonsignificant correlation in the combined subject comparisons (error sources described above would be maximized with large ROIs).
Correction for the Paco2 appeared to be important, particularly in the 133Xe Kanno-Lassen method, as demonstrated by the Yamagata group (Komatani et al., 1990). Paco2 was not monitored in two institutions. The mask system for breathing the 133Xe is likely to cause a change in respiration conditions in some studies (Komatani et al., 1990), and, hence, change in Paco2, resulting in a global change of rCBF.
The cortical rCBF values obtained by the IMP-TLU and IMP-ARG methods were significantly smaller than those determined by the [133Xe] technique. This is mainly due to the poor spatial resolution of the SPECT camera. The limited resolution causes gray matter and white matter mixing, and, therefore, the [123I]IMP technique provides rCBF values that were nearly equal to an average over the given ROI, and is often considerably smaller than the microscopic rCBF of the cortical gray matter, which may be measured only by an in vitro microsphere experiment. On the other hand, the 133Xe technique is rather insensitive to this underestimation of the radioactivity counts and provides rCBF values that were highly weighted to the high flow areas (e.g., cortical gray matter) (Rezai et al., 1988; Iida et al., 1995). It is worth noting that the rCBF values calculated by the [123I]IMP techniques were underestimated only by 6% compared with the H215O PET method (see Table 4), and the 133Xe provide rCBF values that are highly overestimated compared with those by the H215O PET technique. Another reason is probably due to the smaller first-pass extraction fraction of [123I]IMP compared with 133Xe. This may cause underestimation of rCBF by ∼30% at rCBF = 80 ml/min/100 g with [123I]IMP, whilst 133Xe has almost the maximum first-pass extraction fraction (approximately unity) for a wide rCBF range and, therefore, provides significantly larger rCBF values than does the [123I]IMP technique.
Cross calibration
The cross calibration between the SPECT scanner and the well counter is an important procedure. Despite relatively simple and standard reconstruction methods employed in each institution, systematic errors in image reconstruction and individual differences in sensitivity between SPECT scanners can be eliminated. The nonsignificant correlation in the combined subject comparison in Tokyo is probably due to lack of the attenuation correction. Significant correlation would probably have been achieved with proper attenuation correction. The reason for significantly smaller Vd values in one institution (Akita) compared with the other nine is probably due to the scatter correction performed in Akita. Note that the two institutions of Gunma and Fujita used the same SPECT scanner as Akita, but employed a conventional reconstruction program without scatter correction, and yielded Vd values significantly greater than those obtained in Akita. These results demonstrate that while the methods are not overly sensitive to the exact reconstruction and attenuation correction methods used, large variations from standard reconstruction techniques, such as no attenuation correction or scatter correction, can influence the accuracy of the rCBF and Vd estimates.
Advantages and disadvantages
Similar to reference methods, the IMP-ARG and IMP-TLU methods provide absolute quantitation of rCBF over a range of blood flows in both normal subjects and patients with cerebrovascular disease. However, the studies can be performed with conventional SPECT scanners and do not require frequent arterial blood sampling. This allows the technique to be much more readily used in assessing patients with cerebrovascular disease in routine clinical practice. The ability of this technique in differentiating normal from ischemic region is thought to be similar to that of other SPECT techniques, particularly the IMP microsphere methods. However, further studies are required to fully investigate the clinical utility of rCBF quantitation, and particularly the usefulness of the added information provided by the Vd map from the IMP-TLU method. Similar to other SPECT techniques and, to a lesser extent, PET techniques, there are a number of limitations of the two methods presented in this paper. Quantitative rCBF values obtained by the [123I]IMP SPECT methods were shown to have poorer contrast between high rCBF and low CBF areas compared with those obtained by the H215O PET method. The lower contrast may reduce accurate delineation between normal and ischemic areas. In addition, the normal rCBF value in the cortical gray matter (Table 4) appeared to be ∼6% smaller than those obtained by the H215O method. These are probably due to several limitations: (a) poorer spatial resolution of SPECT (12–18 mm FWHM) compared with PET [8–10 mm full width at half maximum (FWHM)], (b) lower first-pass extraction fraction of [123I]IMP compared with H215O and 133Xe (see Fig. 7), (c) Compton scatter, and (d) errors in the attenuation correction. Scatter and limited spatial resolution reduce the image contrast, hence gray matter counts are likely to be underestimated and white matter counts overestimated (if a uniform cylinder is used for cross calibration, as in this study). It may be possible to reduce these effects with more accurate reconstruction algorithms incorporating accurate scatter corrections and instruments with improved spatial resolution.
Conclusion
The IMP-TLU and ARG methods are found to be reliable and robust in providing quantitative rCBF values for a heterogeneous patient population. The validity of these two methods was also demonstrated with a variety of SPECT systems and reconstruction programs. Of the two methods, the simpler IMP-ARG method would be the choice for routine use in a clinical environment, unless the Vd map is required. Further improvement of the image reconstruction technique would be highly desired in SPECT for more accurate quantitation of rCBF in clinical study.
Footnotes
Acknowledgment:
We wish to particularly thank the staff of the 10 participating institutions for their tremendous help and commitment. We also wish to thank Mr. Stefan Eberl, M.Sc, from Royal Prince Alfred Hospital, Sydney, Australia, for invaluable advice on design of the dataanalysis. Thanks are also given to Mrs. Yuko Miura, M.Sc, from the Department of Radiology and Nuclear Medicine, Research Institute for Brain and Blood Vessels, Akita, Japan, for advice on the statistical analysis, and Mr. Hiromi Nishimura, B.Sc, from Department of Neurosurgery, Research Institute for Brain and Blood Vessels, Akita, Japan, for help with programming. We wish to thank also Miss Mayumi Nakazawa and Mr. Yoshihiro Onishi from Nihon Medi-Physics, Hyogo, Japan, for helping with the secretarial work.