Cell death is one of the pathophysiological hallmarks after stroke. Markers to image cell death pathways in vivo are highly desirable. We previously showed that fluorescently labeled Annexin A5 (An×A5), which binds specifically to phosphatidylserine (PS) on dead/dying cells, can be used in experimental stroke for monitoring cell death with optical imaging. Here we investigated whether dual-labeled An×A5 (technetium and fluorescence label) can be used for single-photon emission computed tomography (SPECT) of cell death in the same model. C57Bl6/N mice were subjected to 60-minute middle cerebral artery occlusion (MCAO) and underwent SPECT imaging at 24, 48, and 72 hours afterwards. They were injected intravenously with either PS-binding An×A5 or the nonfunctional An×A5 (negative control), labeled with 99mTc and Alexa Fluor 568, respectively. After SPECT imaging, brain sections were cut for autoradiography and fluorescence microscopy. Ethanol-induced cell death in the femur muscle was used as positive control. We detected dual-labeled An×A5 in the model of ethanol-induced cell death in the femur muscle, but not after MCAO at any time point, either with SPECT or with ex vivo autoradiography or fluorescence microscopy. Dual-labeled An×A5 appears to be unsuited for visualizing death of brain cells in this MCAO model.
Death of brain cells is a hallmark of stroke as well as of many other neurologic and neurodegenerative diseases.1 So far, the cellular mechanisms underlying cell death in the brain are only partly understood.1,2 One of the limitations of current research in models of neurologic diseases is that most of the data for death of brain cells are acquired at a single time point at which the experiment must be terminated and the animals killed to allow histologic or biochemical analysis of the specimen.3 This limits our ability to study the time course of cell death cascades and their dynamics in the same animal. The distribution of dead cells in different brain areas, and cell-type identity are therefore only poorly understood.3
To date, there is no established imaging marker that enables specific in vivo visualization of the molecular targets involved in cell death after stroke. Such a marker would be highly desirable, as it could serve as a noninvasive tool for diagnosis and for monitoring therapy. Its major challenge is that it has to reach its target cells in the brain parenchyma in sufficient numbers to be detectable.
Annexin A5 (An×A5) is a 36kDa protein that specifically binds to phosphatidylserine, which is translocated to the outer leaflet of a cell when cell death occurs. Annexin A5 imaging has already been extensively studied and successfully established in cancer (for review see Vangestel et al4 or Yang et al5), atherosclerosis (for review see Laufer et al6), and myocardial infarction (for review see Wolters et al7). In stroke, Blankenberg et al showed that two patients with acute stroke had regions of 99mTc-HYNIC-An×A5 uptake, which correlated with sites of restricted diffusion on magnetic resonance imaging. They also used 99mTc-HYNIC-An×A5 in the rat to visualize response to Anti-FasL antibody treatment after 2 hours middle cerebral artery occlusion (MCAO). Tracer uptake correlated well with infarct size and number of TUNEL (terminal deoxynucleotidyl transferase-mediated dUTP nick end labeling)-positive cells.8 In another study, the same group showed that 99mTc-HYNIC-An×A5 was used to monitor protective effects of minocycline treatment in a permanent MCAO model in the mouse.9 We recently reported that noninvasive imaging using An×A5 was indeed specific to dead/damaged cells after focal cerebral ischemia in the mouse. To show this, we used an An×A5 that cannot bind phosphatidylserine as a control protein and showed that the ratio between ipsilateral and contralateral hemisphere was only significantly higher in animals receiving intact An×A5. We also compared the near-infrared signal of intravenously injected Cy5.5-An×A5 to intravenously injected propidium iodide and ex vivo TUNEL staining and infarct distribution assessed by triphenyl tetrazolium chloride. The majority of the cells displaying An×A5 signal was also positive for propidium iodide and TUNEL.10
From these results, we inferred that An×A5 might be a promising marker to visualize cell death in stroke. However, near-infrared imaging is not suited to visualize cell death in the brain in patients. The aim of this study was therefore to investigate whether dual-labeled An×A5 (technetium and fluorochrome) is suitable and specific to visualize cell death after experimental cerebral ischemia and to characterize the time course of phosphatidylserine translocation in this model. We used 99mTc(CO)3-HIS-cys-An×A5-AF568, which has six histidine residues on the N-terminus of An×A5 (HIS-tag) and is a ‘second generation’ An×A5. This ‘second generation’ An×A5 derivative has a single cysteine residue at its concave site which allows for site-specific conjugation of different radiometal binding ligands via sulfide formation through thiol chemistry. Thereby, the radioisotope is located outside the binding region of the protein and does not affect its binding properties.11 We have previously shown that 99mTc(CO)3-HIS-cys-An×A5 is superior to ‘first generation’ 99mTc-HYNIC-An×A5 in terms of in vivo affinity, distribution in the body, stability, and radiolabeling yields.11 In addition to its radioactive label, it also has a fluorescent tag that can be visualized in fluorescent microscopy.
In contrast to the previous results, we show here that single-photon emission computed tomography (SPECT) imaging of dual-labeled An×A5 is not suited to visualize death of brain cells in a 60-minute mouse model of focal cerebral ischemia in vivo. We show that 99mTc(CO)3-HIS-cys-An×A5-AF568 cannot be detected in the brain by SPECT and autoradiography after cerebral ischemia, while it can be visualized after ethanol-induced cell death in the femur muscle.
MATERIALS AND METHODS
Animals and Ethical Statement
All procedures were performed in accordance with the German animal welfare laws (Landesamt fuer Gesundheit und Soziales Berlin) and approved under the animal research licenses G0199/11. Local guidelines for premature euthanasia were followed when animals showed signs of distress in our daily health check. Animals were housed under standard conditions with free access to food and water. Animals were randomly assigned to experimental groups and investigators were masked to the experimental groups while analyzing the results.
Radiochemical Synthesis
HIS-cys-An×A5-AF568 was prepared as previously described.11 The 99mTc(CO)3+ precursor was obtained by adding 1 mL of 99mTc-pertechnetate solution (1.0 to 1.5 GBq) to an IsoLink kit (Paul Scherrer Institute, Villigen-PSI, Switzerland), which was then heated at 90°C for 20 minutes. After cooling, 99mTc(Co)3+ precursor solution was adjusted to pH 7.5 with 0.1mL HCl. Approximately, 400 μL of the solution was then added to 70 μg HIS-cys-An×A5-AF568. The solution was incubated at 37°C for 1 hour under a stream of nitrogen to reduce the total volume of the reaction mixture to 50 to 100 μL. The solution was then purified and buffers were changed using Amicon Ultra-0.5 centrifugal filters (10 kDa exclusion, Millipore, Schwalbach, Germany). The solution was centrifuged at 12,000 r.p.m. for 10 minutes; this was followed by two rinse steps with 0.2 mL of 0.9% saline for 5 minutes each, yielding 99mTc(CO)3-HIS-cys-An×A5-AF568 in 0.9% saline solution. Total yield was 70.99% ± 8.88%. 99mTc(CO)3-HIS-cys-M1234-An×A5-AF568 was prepared in the same way using 70 μg HIS-cys-M1234-An×A5-AF568. Total yield was 77.21% ± 3.03%. Only fresh eluate was used for experiments.
High-Performance Liquid Chromatography
Purity of 99mTc(CO)3-HIS-cys-An×A5-AF568 was assessed by high-performance liquid chromatography using a solvent pump (LC-10), a UV detector (SPD-M10A) at 254 nm and a NaI(Tl) detector (Shimadzu, Duisburg, Germany) in series. Analysis was performed on Aeris Widepore 3.6u XB-C18 column (Phenomenex, Aschaffenburg, Germany), eluted with a linear gradient from 0.1% trifluoroacetic acid in water (0 to 3 minutes) to 100% acetonitrile over the course of 20 minutes at a flow rate of 0.5 mL per minute. Radiochemical purity of 97.22% ± 2.13% for 99mTc(CO)3-HIS-cys-An×A5-AF568 and 97.98 ± 0.68% for 99mTc(CO)3-HIS-cys-M1234-An×A5-AF568 was achieved. Both markers were chemically pure, as no other peaks were detected using the UV detector.
Middle Cerebral Artery Occlusion
Transient MCAO was induced in twenty 10-week-old male C57BL6/N mice (Research Institute for Experimental Medicine Charité, Berlin, Germany) by inserting a silicone rubber-coated, 170 μm thick monofilament (Doccol Corporation, Redlands, USA) via the internal carotid artery as described by Engel et al.12 Mice were anesthetized with isoflurane (2% for induction and 1.5% for maintenance) under 70% N2O and 30% O2 via a face mask. After 60 minutes of ischemia, animals were re-anesthetized and the filament removed to permit reperfusion. Mice were treated with bupivacaine as a local anesthesia after surgery. During surgery and ischemia, body temperature was measured and kept constant between 37.0°C and 37.5°C with a heating pad. After surgery, the animals were allowed to wake up in a warming cage and kept there for ˜2 hours. Four animals had to be euthanized because they lost > 20% body weight after MCAO.
Ethanol-Induced Cell Death in the Femur Muscle
Ethanol-induced cell death was achieved by injecting 100 μL of 100% ethanol into the left femur muscle of eight 10-week-old male C57BL6/N mice (Research Institute for Experimental Medicine Charité, Berlin, Germany) as previously described.13 Mice were anesthetized with isoflurane (2% for induction and 1.5% for maintenance) under 70% N2O and 30% O2 via a face mask. Mice were allowed to recover for 19 hours and received subcutaneous injections of buprenorphin (0.05 mg/kg) every 8 hours for pain relief. All animals survived the procedure.
Anesthetized mice were injected intravenously with 96.43 ± 30.00 MBq 99mTc(CO)3-HIS-cys-An×A5-AF568 or 142.45 ± 23.09 MBq 99mTc(CO)3-HIS-cys-M1234-An×A5-AF568 at 24 (n = 5), 48 (n = 3), or 72 (n = 5 for 9mTc(CO)3-HIS-cys-An×A5-AF568 and n = 3 for 99mTc(CO)3-HIS-cys-M1234-An×A5-AF568) (± 2.0) hours after reperfusion after MCAO. For ethanol-induced cell death in the left femur muscle, intravenous injections were performed at 19 (± 0.5) hours after injury onset (n = 5 for 99mTc(CO)3-HIS-cys-An×A5-AF568 and n = 3 for 99mTc(CO)3-HIS-cys-M1234-An×A5-AF568). One mouse receiving 99mTc(CO)3-HIS-cys-M1234-An×A5-AF568 at 72 hours after MCAO did not survive the injection. Imaging was performed using a four-head nanoSPECT/CTplus system (Bioscan Europe, Paris, France). The anesthetized mice were positioned on a Minerve Small-Animal Environment System mouse bed (Bioscan Europe). Minerve's heating was used to keep the mice at normal physiologic temperature during the scan. Mice were anesthetized with isoflurane (2% for induction and 0.8% to 1.5% for maintenance) under 70% N2O and 30% O2. Breathing was controlled using a respiration pad and adjustment of isoflurane anesthesia. Sequences were as follows: for MCAO animals, head CT (projections: 240, pitch: 0.5, tube voltage: 45 kV, exposure time: 1,000 millisecond, and scan time: 2 minutes) was performed, followed by head SPECT (standard sampling quality, 256 × 256 matrix, 120 frames, and scan time: 20 minutes) for 3.5 hours. Whole-body SPECT (standard sampling quality, 256 × 256 matrix, 45 frames, and scan time: 30 minutes) was then performed, followed by whole-body CT (projections: 180 to 240, pitch: 0.5, tube voltage: 45 kV, exposure time: 1,000 millisecond, and scan time: 10.5 to 12 minutes). For animals undergoing ethanol-induced cell death in the left femur muscle, whole-body CT (projections: 180, pitch: 0.5 to 1, tube voltage: 55 kV, exposure time: 500 millisecond, and scan time: 4.5 to 6.75 minutes) was performed, followed by whole-body SPECT (standard sampling quality, 256 × 256 matrix, 30 frames, scan time: 22.5 to 25 minutes).
Image analysis was performed with VivoQuant v.1.23b6 (inviCRO, LLC, Boston, MA, USA). Three-dimensional regions of interest were outlined on each image sequence using ‘3D ROI Tool’ and ‘Connected Thresholding’ (VivoQuant, inviCRO, LLC, Boston, MA, USA).
ex vivo Biodistribution Measurements and Autoradiography Mice were killed by decapitation after SPECT imaging. To determine the biodistribution of 99mTc(CO)3-HIS-cys-An×A5-AF568 and 99mTc(CO)3-HIS-cys-M1234-An×A5-AF568, activity of organs was measured in an activity meter ISOMED 2010 (MED Nuklear-Medizintechnik Dresden GmbH, Dresden, Germany). The percentage of injected dose (%ID) and %ID/organ weight (%ID/g) in brain, muscles, kidney, liver, and lung was calculated. Brains were immediately snap frozen in ice-cold methyl butane, and coronal cryosections with a thickness of 20 μm were cut at interaural positions 6.6, 5.3, 3.9, 1.9, and 0mm (several series of each brain). One series of slices was incubated overnight on a technetium-sensitive imaging plate (Fuji Imaging plate; BAS-IP TR 2025, Duesseldorf, Germany) and digitalized with Bio-Imaging Analyzer BAS 5000 (Fuji, Duesseldorf, Germany). Target-to-background ratios were calculated by regions of interest analysis using ImageJ v.1.45 (http://rsb.info.nih.gov/ij/index.html) as follows: For MCAO animals, ratios between ipsilateral areas of the damaged striatum and cortex and mirrored contralateral areas for MCAO were calculated, both corrected by background subtraction. For animals undergoing ethanol-induced cell death in the left femur muscle, ratios between ipsilateral muscle and contralateral muscle both corrected by background subtraction were calculated.
Infarct Volumetry and Microscopy
Infarct volumes after MCAO were determined after hemalaun staining. After autoradiography, sections were rinsed in an alcohol series of decreasing concentrations before incubation with hemalaun (Merck, Darmstadt, Germany) for 5 minutes. The slides were then rinsed in 96% ethanol with 2% hydrochloric acid and incubated in 2% sodium bicarbonate. After dehydration and mounting, the sections were digitized. The area of infarction (as defined by a lower overall cell density because of cell damage) was quantified using ImageJ v.1.45 (http://rsb.info.nih.gov/ij/index.html). A correction for edema was applied by calculating the ‘indirect’ infarct volume as the volume of the contralateral hemisphere minus the non-infarcted volume of the ipsilateral hemisphere.
The AF568 label attached to An×A5 was used to investigate the slices under fluorescent microscopy using a Leica DMRE microscope (Leica Microsystems Jena GmbH, Jena, Germany).
Statistics
Normality was tested using Kolmogorov–Smirnov test and variance homogeneity using Levené test. When data were normally distributed, but variances were not homogenous across groups and more than two groups were analyzed, Kruskal–Wallis test was performed followed by post hoc Mann–Whitney U test with α-correction according to Bonferroni to adjust for the inflation of type I error owing to multiple testing (familywise error rate). For data that were distributed normally and variances that were homogenous across groups, independent t-test was performed in case of two groups and one-way analysis of variance in case of more than two groups. For correlation analysis of target-to-background ratios of MCAO animals versus infarct volumes, Spearman's rank order correlation was used because variances of target-to-background ratios for MCAO animals were not homogenous across groups. Data are expressed as mean ± s.d., except for autoradiography data after MCAO, which were expressed as medians because variance homogeneity was not met and Kruskal–Wallis test was performed. A value of P < 0.05 was considered statistically significant. When Kruskal–Wallis test was performed followed by Mann– Whitney U test, P = 0.05/k was used, with k as the number of single hypotheses. All statistical analyses were performed with SPSS v.19.0.
RESULTS
in vivo An×A5 SPECT Imaging and Ex Vivo An×A5 Autoradiography Fail to Detect Cell Death in a Mouse Model of Focal Cerebral Ischemia
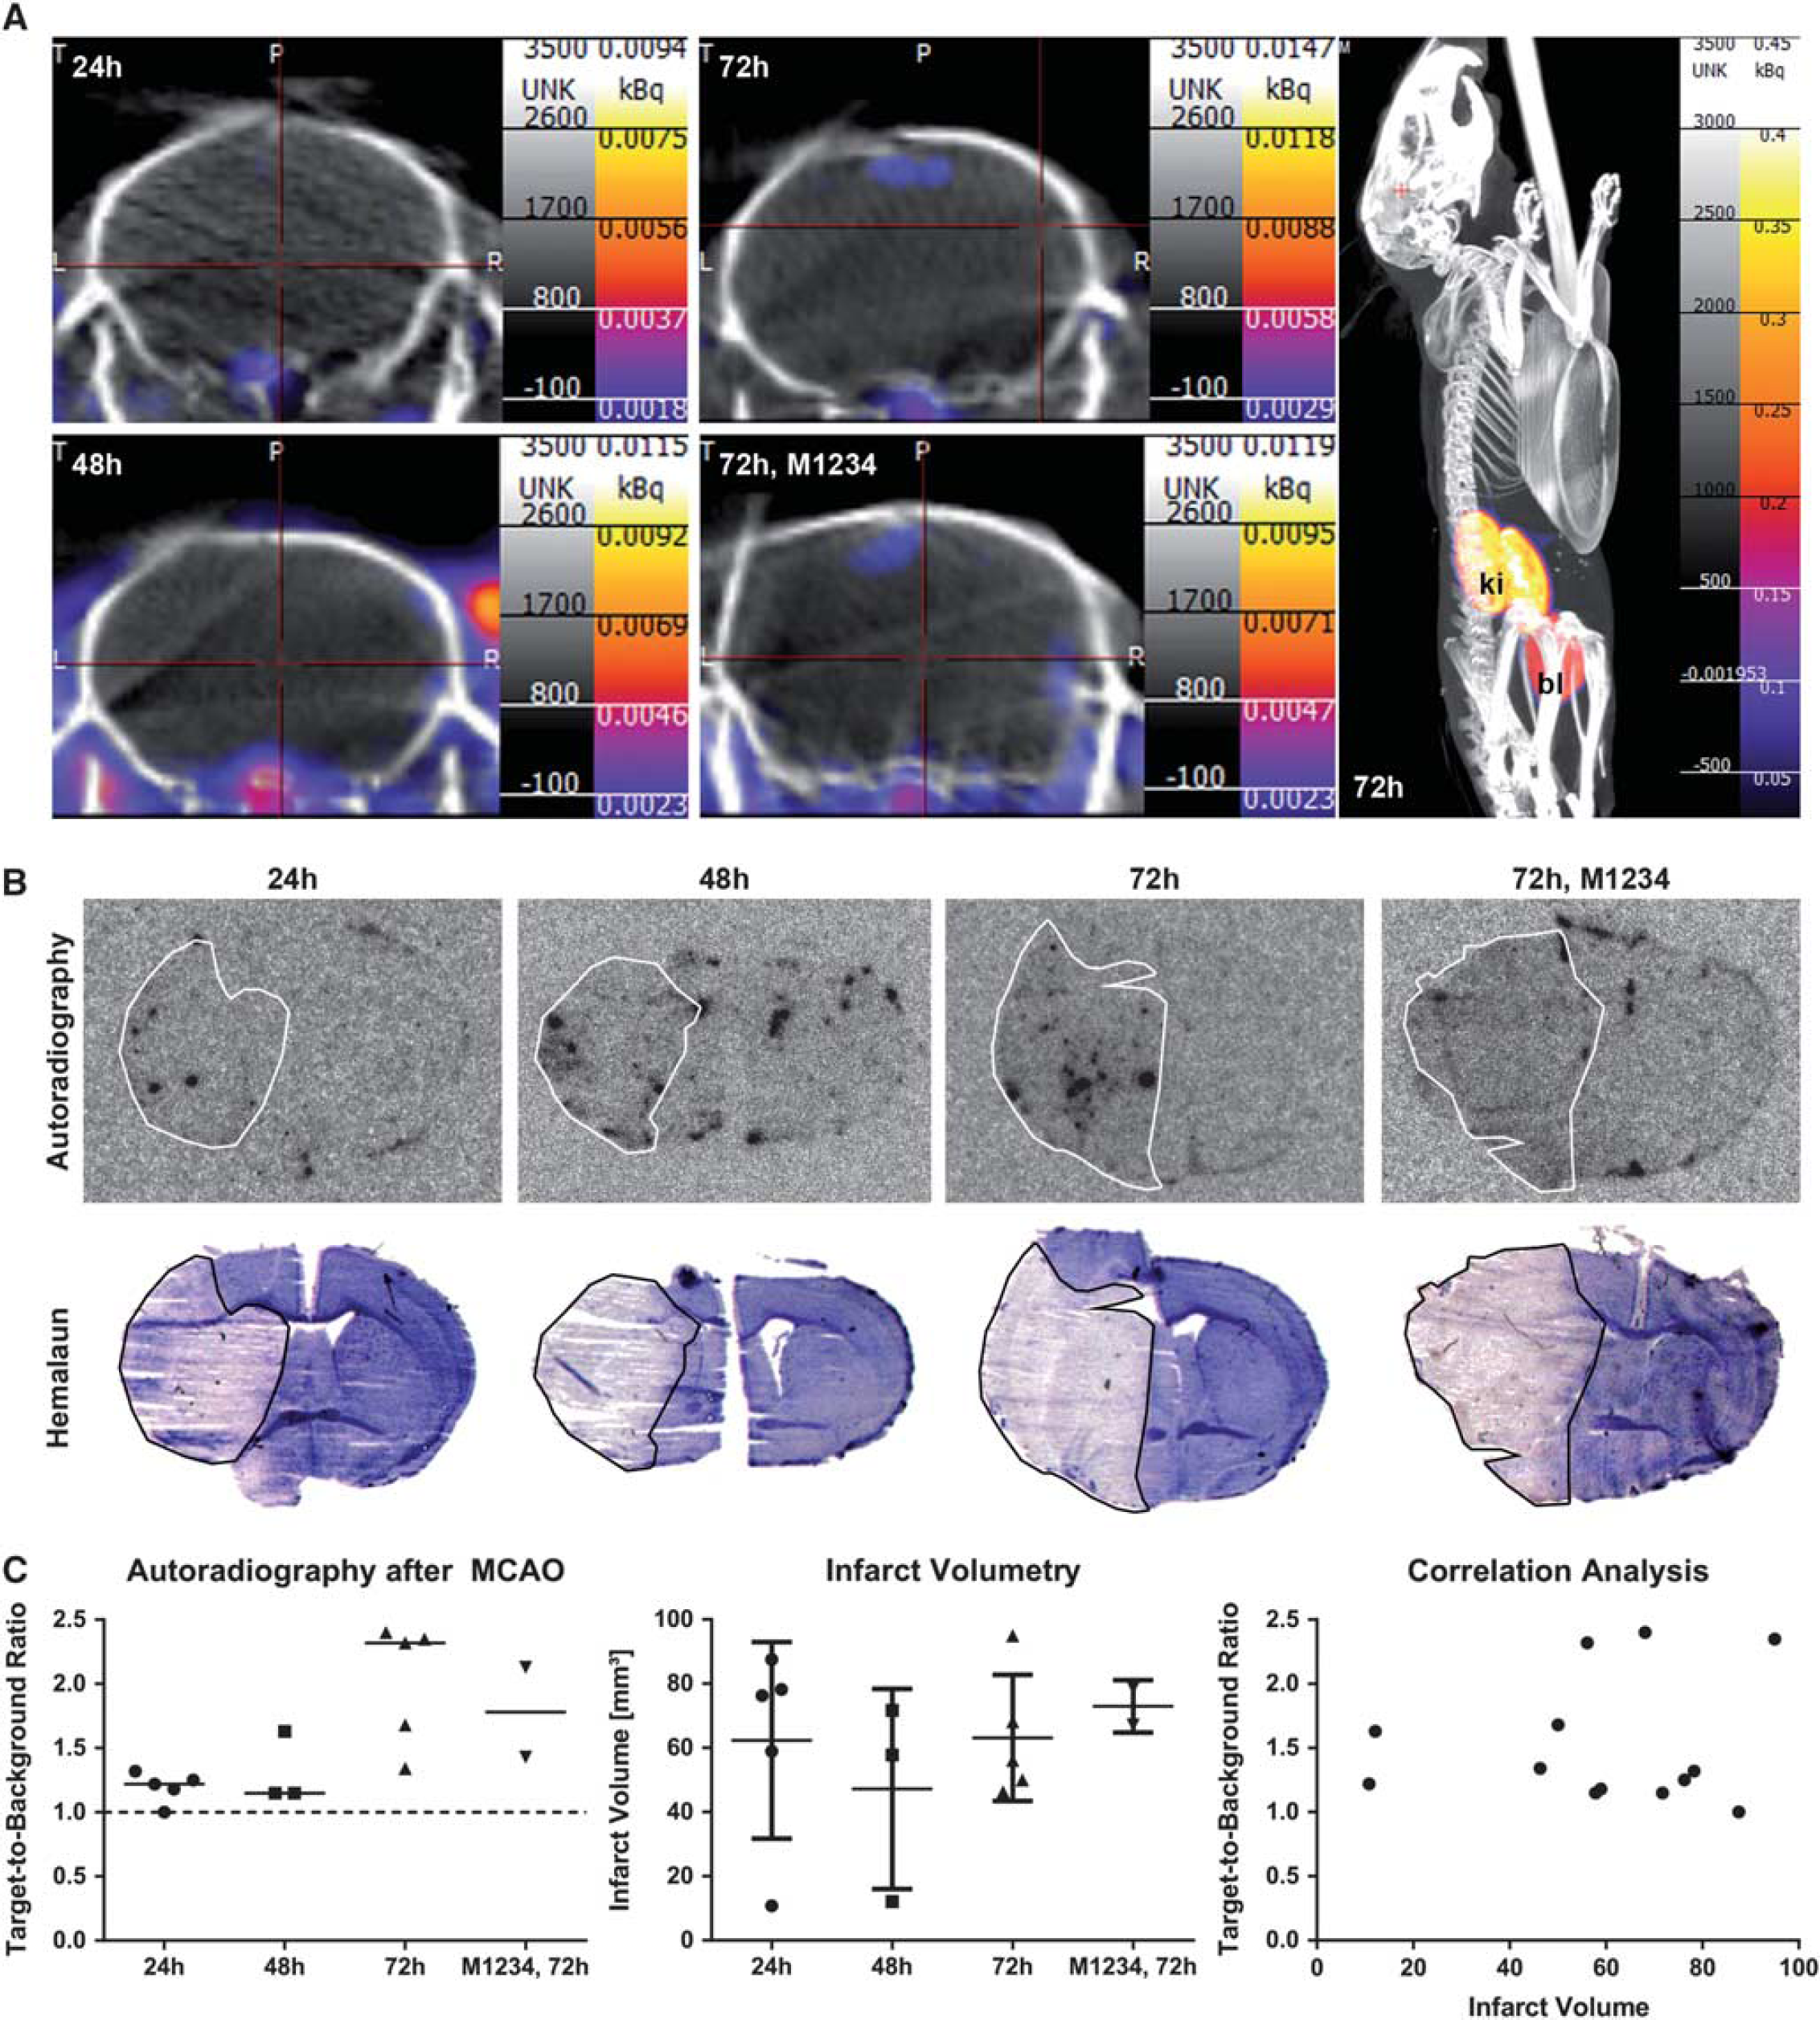
Middle cerebral artery occlusion mice received intravenous injection of 99mTc(CO)3-HIS-cys-An×A5-AF568 (HIS-An×A5) at 24, 48, or 72 hours or the nonfunctional 99mTc(CO)3-HIS-cys-M1234-An×A5-AF568 (M1234, negative control) at 72 hours after reperfusion. SPECT imaging was performed immediately after and then every 30 minutes until 3.5 hours after injection. We were not able to detect an An×A5 SPECT signal in the brain at any time point investigated (Figure 1A). However, we noted a low signal (in the range of 0.01 kBq or lower) below the brain.
In vivo An×A5 SPECT imaging and ex vivo An×A5 autoradiography after MCAO. (A) MCAO mice received intravenous injection of 99mTc(CO)3-HIS-cys-An×A5-AF568 at 24, 48, or 72 hours or the nonfunctional 99mTc(CO)3-HIS-cys-M1234-An×A5-AF568 (M1234, negative control) at 72 hours after reperfusion. SPECT imaging was performed immediately after and then every 30 minutes until 3.5 hours after injection. Representative figures show An×A5 SPECT imaging at 3.5 hours after injection on coronal sections of the brain at each time point as well as whole-body SPECT imaging at 72 hours after reperfusion. (B) Ex vivo An×A5 autoradiography (upper panel) and hemalaun staining of the ischemic infarct (lower panel) of representative brain slices at bregma zero is shown at 24, 48, and 72 hours after reperfusion as well as for the control group at 72 hours. White or black line, respectively, shows the ischemic infarct. (C) Target-to-background ratios of ex vivo An×A5 autoradiography as well as infarct volumes were not significantly different between the groups. There was also no correlation between target-to-background ratios and infarct volumes. Data are represented as medians for autoradiography and means ± s.d. for infarct volumes. An×A5, Annexin A5; bl, bladder; ki, kidneys; MCAO, middle cerebral artery occlusion; SPECT, single-photon emission computed tomography.
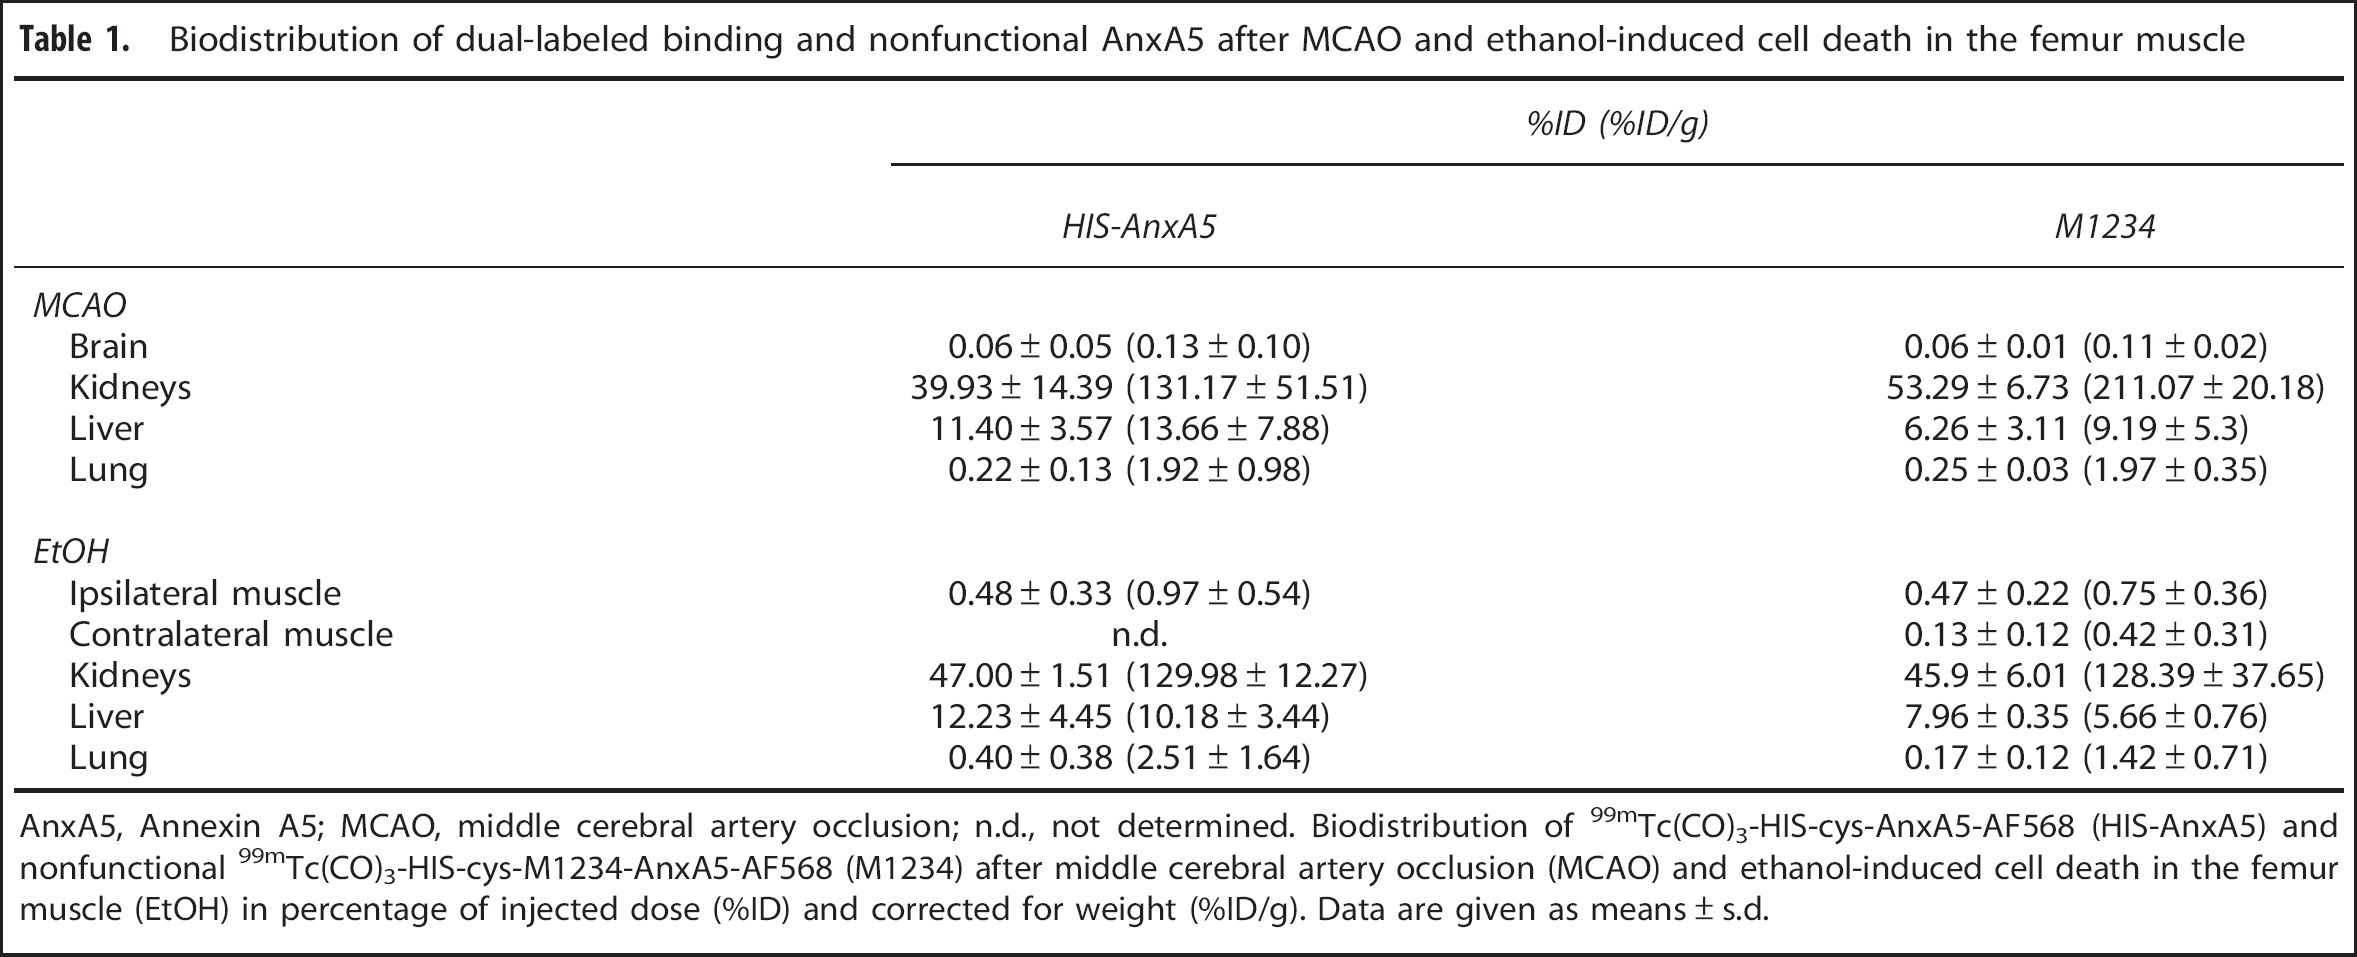
Thereafter, we performed ex vivo measurements of activity in the brain, kidney, liver, and lung. The biodistribution of 99mTc(CO)3-HIS-cys-An×A5-AF568 and 99mTc(CO)3-HIS-cys-M1234-An×A5-AF568 is shown in Table 1. For both, the highest uptake was in the kidneys (39.93% ± 14.39% of injected dose for HIS-An×A5 (n = 13) versus 53.29% ± 6.73% for M1234 (n = 2)) and the liver (11.40% ± 3.57% for HIS-An×A5 versus 6.26% ± 3.11% for M1234). Again, no uptake in the brain could be detected (0.06% ± 0.05% for HIS-An×A5 versus 0.06 ± 0.01 for M1234).
Biodistribution of dual-labeled binding and nonfunctional An×A5 after MCAO and ethanol-induced cell death in the femur muscle
%ID (%ID/g)
HIS-An×A5
M1234
MCAO
Brain
0.06 ± 0.05 (0.13 ± 0.10)
0.0610.01 (0.11 10.02)
Kidneys
39.93 ± 14.39 (131.17 ± 51.51)
53.29 ± 6.73 (211.07 ± 20.18)
Liver
11.40 ± 3.57 (13.66 ± 7.88)
6.26 ± 3.11 (9.19 ± 5.3)
Lung
0.22 ± 0.13 (1.92 ± 0.98)
0.25 ± 0.03 (1.97 ± 0.35)
EtOH
Ipsilateral muscle
0.48 ± 0.33 (0.97 ± 0.54)
0.47 ± 0.22 (0.75 ± 0.36)
Contralateral muscle
n.d.
0.13 ± 0.12 (0.42 ± 0.31)
Kidneys
47.00 ± 1.51 (129.98 ± 12.27)
45.9 ± 6.01 (128.39 ± 37.65)
Liver
12.23 ± 4.45 (10.18 ± 3.44)
7.96 ± 0.35 (5.66 ± 0.76)
Lung
0.40 ± 0.38 (2.51 ± 1.64)
0.17 ± 0.12 (1.42 ± 0.71)
An×A5, Annexin A5; MCAO, middle cerebral artery occlusion; n.d., not determined. Biodistribution of 99mTc(CO)3-HIS-cys-An×A5-AF568 (HIS-An×A5) and nonfunctional 99mTc(CO)3-HIS-cys-M1234-An×A5-AF568 (M1234) after middle cerebral artery occlusion (MCAO) and ethanol-induced cell death in the femur muscle (EtOH) in percentage of injected dose (%ID) and corrected for weight (%ID/g). Data are given as means ± s.d.
Then, we performed ex vivo An×A5 autoradiography and hemalaun staining of the ischemic infarct (Figure 1B). Interestingly, we found a spotty distribution of An×A5 inside the brain. This was even sometimes visible on the contralateral side (see Figure 1B, 48 hours) and was mostly confined to inside the ventricles. Furthermore, An×A5 was also observable at the rim of the slices. For autoradiography, data were distributed normally (Kolmogorov-Smirnov test, Z = 0.827, P = 0.501), but variances were not homogenous across groups (Levené test, F(3,11) = 7.725, P = 0.005). Median target-to-background ratios were 1.22 for 24 hours (n = 5), 1.15 for 48 hours (n = 3), 2.32 for 72 hours (n = 5), and 1.78 for control at 72 hours (n = 2). There was a significant effect in the omnibus test (Kruskal–Wallis test, χ2(3,N = 15) = 9.292, P = 0.026, η2 = 0.664). Further post hoc analysis with Mann– Whitney U and Bonferroni correction revealed no significant differences between the groups at α = 0.05/6; corrected α = 0.0083 (P = 0.881 for 24 versus 48 hours, P = 0.009 for 24 versus 72 hours, P = 0.053 for 24 hours versus control, P = 0.051 for 48 versus 72 hours, P = 0.236 for 48 versus control, P = 0.439 for 72 hours versus control, two-tailed). For infarct volumetry, data were normally distributed (Kolmogorov-Smirnov test, Z = 0.593, P = 0.874) and variances were homogenous across groups (Levené test, F(3,11) = 0.908, P = 0.468). Mean infarct volumes were 62.36 ± 30.62 for 24 hours (n = 5), 47.21 ± 31.18 for 48 hours(n = 3), 63.10 ± 19.65 for 72 hours (n = 5), and 72.96 ± 8.17 for control at 72 hours(n = 2). There was no significant effect of group attendance (one-way analysis of variance, F(3,11) = 0.445, P = 0.725, ω2 = 0.108). A Spearman's rank order correlation was run to determine the relationship between target-to-background ratios and infarct sizes for all but the M1234 control animals. We could not find a correlation between the two (rs(11)= − 0.113, P = 0.714; Figure 1C).
In Vivo An×A5 SPECT Imaging and Ex Vivo An×A5 Autoradiography are Able to Detect Cell Death in a Model of Ethanol-Induced Cell Death in the Femur Muscle
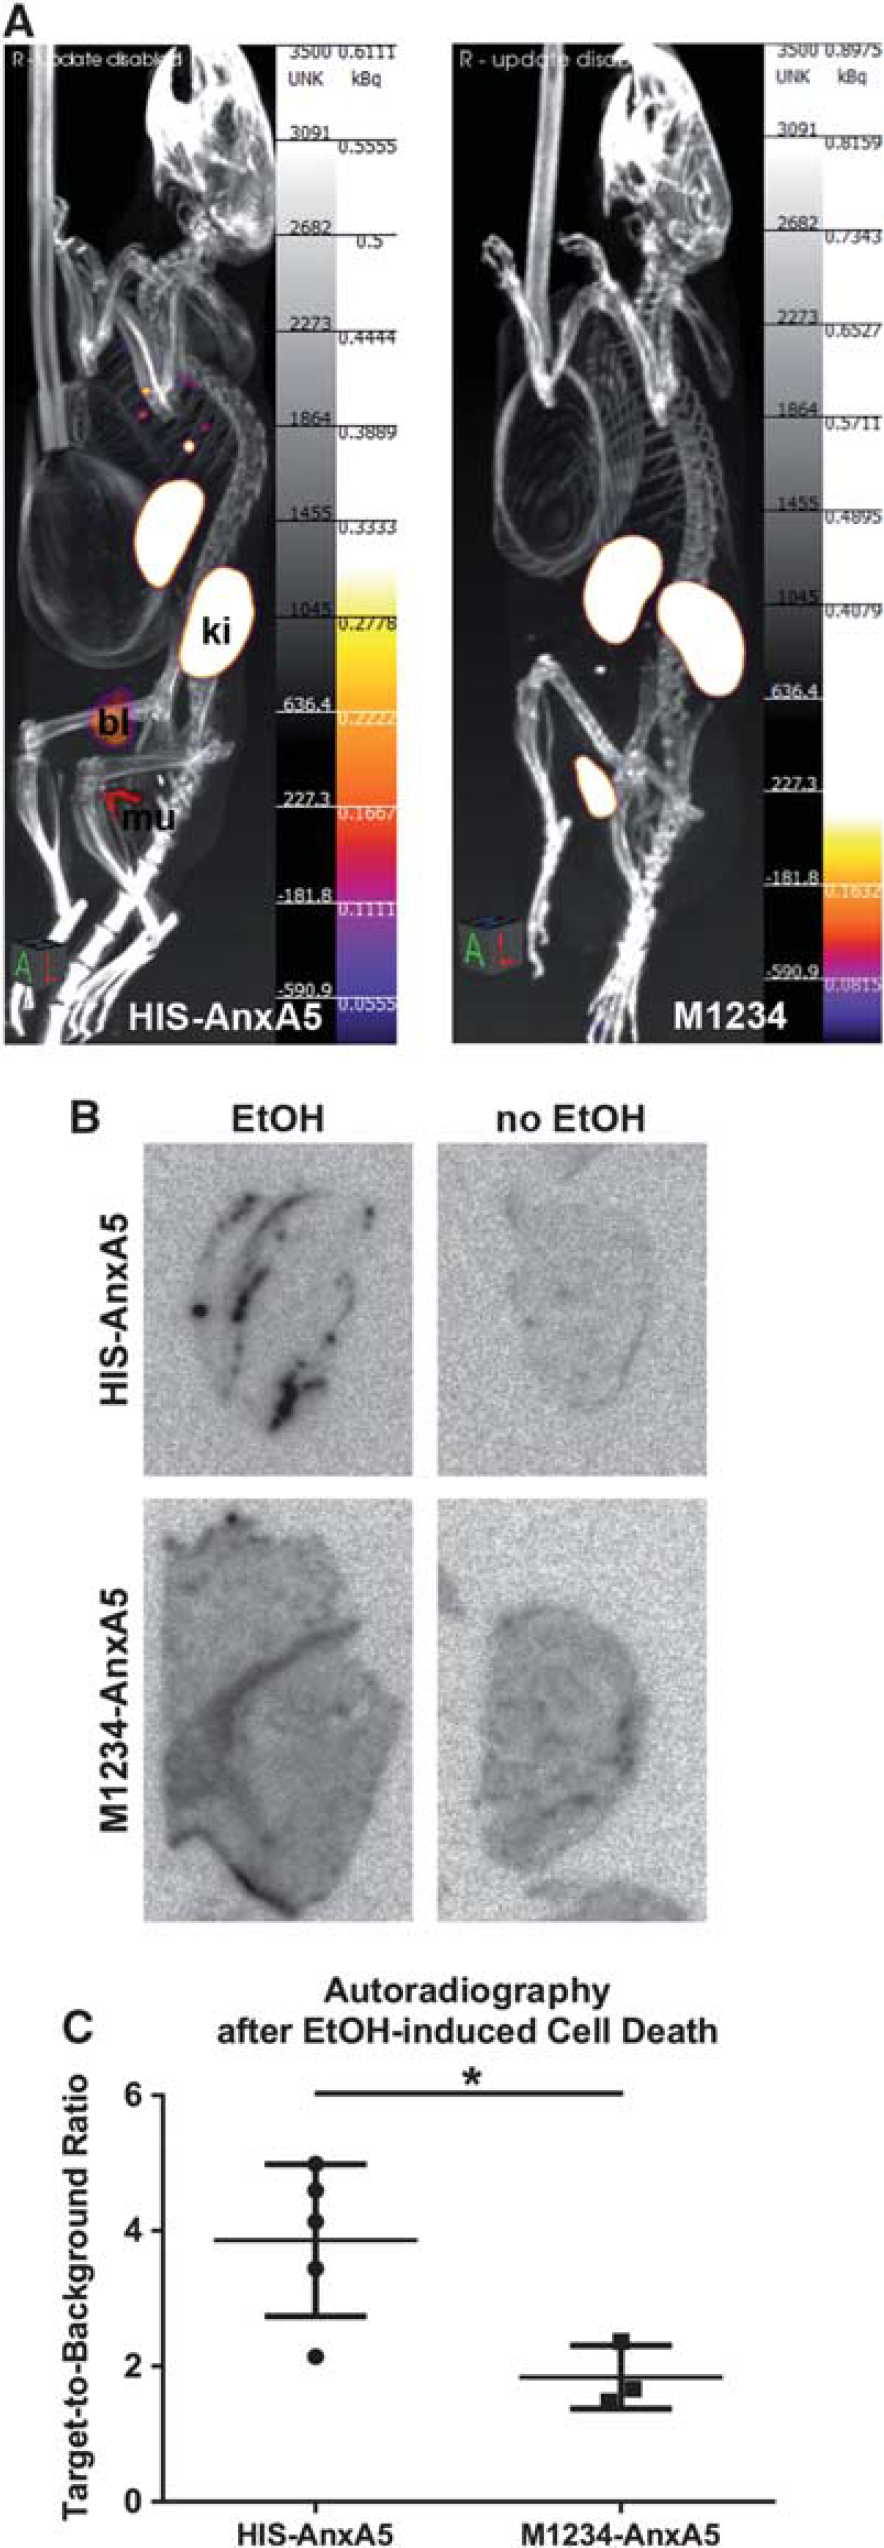
Mice received intravenous injection of 99mTc(CO)3-HIS-cys-An×A5-AF568 (HIS-An×A5) or the nonfunctional 99mTc(CO)3-HIS-cys-M1234-An×A5-AF568 (M1234, negative control) 19 hours after EtOH-induced cell death in the femur muscle. SPECT imaging was performed immediately after and then every 30 minutes until 3.5 hours after injection. Only in the ipsilateral muscle was a signal detected, but not in the contralateral muscle; and only in animals receiving HIS-An×A5, not in those receiving M1234 control (Figure 2A).
In vivo An×A5 SPECT imaging and ex vivo An×A5 autoradiography after ethanol-induced cell death in the femur muscle. (A) Mice received intravenous injection of 99mTc(CO)3-HIS-cys-An×A5-AF568 (HIS-An×A5) or the nonfunctional 99mTc(CO)3-HIS-cys-M1234-An×A5-AF568 (M1234, negative control) 19 hours after ethanol-induced cell death in the left femur muscle. SPECT imaging was performed immediately after and then every 30 minutes until 3.5 hours after injection. Representative figures show An×A5 SPECT imaging at 3.5 hours after injection. (B) Ex vivo An×A5 autoradiography of representative slices of ipsilateral and contralateral muscles is shown for HIS-An×A5 and M1234 control. (C) Target-to-background ratios of ex vivo An×A5 autoradiography were significantly larger in the ipsilateral muscles receiving functional An×A5 compared with control (*P = 0.016). Data are represented as means ± s.d. An×A5, Annexin A5; bl, bladder; ki, kidneys; mu, muscle; SPECT, single-photon emission computed tomography.
Thereafter, we performed ex vivo measurements of activity in the muscles, kidney, liver, and lung. The biodistribution of HIS-An×A5 and M1234 control is shown in Table 1. As for the MCAO animals, the highest uptake for both was in the kidneys (47.00% ± 1.51% of injected dose for HIS-An×A5 (n = 5) versus 45.90% ± 6.01% for M1234 (n = 3)) and the liver (13.23% ± 4.45% for HIS-An×A5 versus 7.96% ± 0.35% for M1234). More importantly, uptake into the ipsilateral muscle was detected (0.48% ± 0.33% for HIS-An×A5 versus 0.47% ± 0.22% for M1234).
We then performed ex vivo An×A5 autoradiography of slices of ipsilateral and contralateral muscle (Figure 2B). Data were distributed normally (Kolmogorov-Smirnov test, Z = 0.577, P = 0.894) and variances were homogenous across groups (Levené test, F(1,6) = 2.007, P = 0.206). Mean target-to-background ratios of 99mTc(CO)3-HIS-cys-An×A5-AF568 were significantly higher (3.86 ± 1.12, n = 5) compared with M1234 control (1.84 ± 0.47, n = 3) (independent t-test, t(6) = 2.898, P = 0.027, and r = 0.762; Figure 2C).
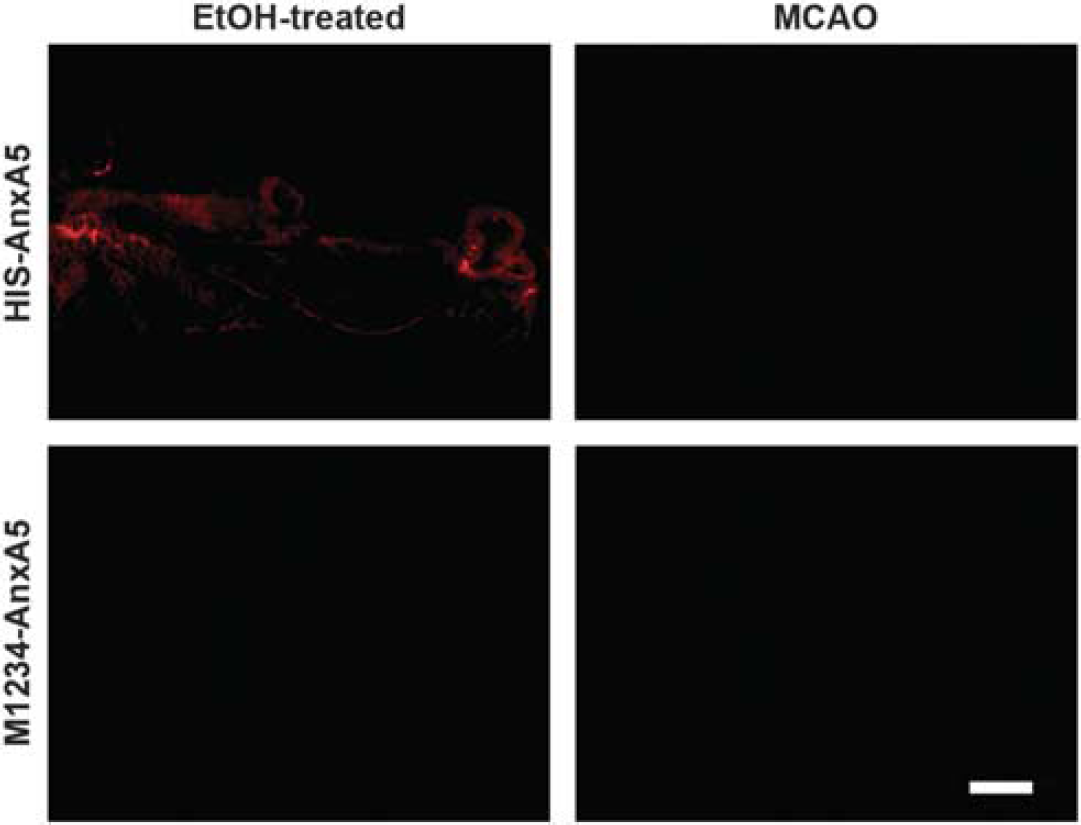
Since the injected An×A5 is fluorescently labeled with AF568, we were also able to perform fluorescence microscopy. Only animals undergoing ethanol-induced cell death in the left femur muscle injected with 99mTc(CO)3-HIS-cys-An×A5-AF568 displayed fluorescent spots on the tissue (Figure 3).
Microscopy of intravenously injected An×A5 after MCAO or ethanol-induced cell death in the femur muscle. MCAO mice or mice undergoing ethanol-induced cell death in the left femur muscle received intravenous injection of 99mTc(CO)3-HIS-cys-An×A5-AF568 (HIS-An×A5) or nonfunctional 99mTc(CO)3-HIS-cys-M1234-An×A5-AF568 (M1234, negative control). After SPECT imaging and ex vivo autoradiography, slices were used for microscopy. Representative figures show MCAO mice receiving HIS-An×A5 or M1234 at 72 hours after reperfusion and mice undergoing ethanol-induced cell death in the left femur muscle receiving HIS-An×A5 or Ml234 at 19 hours after induction of cell death in the femur muscle. Scale bar, 200 μm. An×A5, Annexin A5; MCAO, middle cerebral artery occlusion; SPECT, single-photon emission computed tomography.
DISCUSSION
The objective of this study was to investigate the suitability of 99mTc(CO)3-HIS-cys-An×A5-AF568 for visualizing cell death after murine focal cerebral ischemia in vivo. Annexin A5 has been widely used for imaging cell death under various disease conditions. It had been described earlier for use in stroke both in animal models and in humans.8,9 Our results do not support the notion that the dual-labeled An×A5 used here is suited for imaging cell death after focal cerebral ischemia in vivo in the mouse.
In the present study, we intravenously injected 99mTc(CO)3-HIS-cys-An×A5-AF568 and the nonfunctional control 99mTc(CO)3-HIS-cys-M1234-An×A5-AF568 into mice at 24, 48, and 72 hours after reperfusion after MCAO. Strikingly, using in vivo SPECT imaging we found no accumulation of the marker at any of the time points investigated. Based on our previous results using a near-infrared marker for An×A5,10 we expected specific binding of An×A5 to dead/dying cells in the hemisphere ipsilateral to the infarct. Also, 99mTc-labeled An×A5 had been used in two previous studies investigating stroke patients and MCAO in rats8 and mice.9 In contrast, we used an HIS-tagged ‘second generation’ An×A5 previously shown to be superior to ‘first generation’ 99mTc-HYNIC-An×A5 in terms of in vivo affinity, distribution in the body, stability, and radiolabeling yields.11 However, a study using photothrombotic stroke model also failed to detect in vivo68Ga-cys2-An×A5, another second generation An×A5; 68Ga-cys2-An×A5 was detectable only with ex vivo autoradiography.13
One of the reasons why we did not detect a signal in vivo might be that SPECT is not sensitive enough. To investigate this issue, we performed ex vivo activity measurements using an activity meter. We found An×A5 to be enriched mostly in the kidneys, resulting from high phosphatidylserine expression in the cortex of the kidneys,14 and the liver, where it was also detected in SPECT. This biodistribution was very similar to what has previously been reported.13,15,16 In the brain, we did not find any enrichment of An×A5 signal using ex vivo activity measurements. As a next step, we performed ex vivo autoradiography, which is more sensitive than SPECT imaging. We found that target-to-background ratios did not differ significantly between the groups, indicating that An×A5 could not be specifically enriched in the brain after 60-minute MCAO. Also, infarct volumes between the groups were similar and target-to-background ratios did not correlate with infarct size. We did, however, detect a low signal (in the range of 0.01 kBq or lower) below the brain. This can be attributed to salivary glands consistent with spontaneous cell death as part of the homeostatic regulation of cell number and differentiation.17 In addition, An×A5 has been shown to accumulate inside the salivary glands.18
In contrast to our findings in the MCAO model, we showed that 99mTc(CO)3-HIS-cys-An×A5-AF568 indeed binds to dead/damaged cells in a model of ethanol-induced cell death in the femur muscle. 99mTc(CO)3-HIS-cys-An×A5-AF568, but not the nonfunctional 99mTc(CO)3-HIS-cys-M1234-An×A5-AF568, was detected in vivo using SPECT imaging. We also found significantly larger target-to-background ratios compared with mTc(CO)3-HIS-cys-M1234-An×A5-AF568 in ex vivo autoradiography and a biodistribution similar to that found in the MCAO animals, in which the organs most highly enriched with An×A5 were also the kidney and liver.19–21
It is likely that An×A5 was not detected in the brain because it did not cross the blood–brain barrier (BBB). It has previously been shown that the BBB is disrupted after experimental focal cerebral ischemia in a biphasic manner.22–24 However, it should be emphasized that the BBB permeability ‘state’ is not an all-or-nothing event, but rather that the ‘tightness and selectivity’ seem to vary. Extravasation of tracers across the BBB, even if impaired, critically depends on their physicochemical properties and molecular weight. It cannot be foreseen for a particular compound and therefore needs to be evaluated.25 In the case of Annexin, however, the difference in molecular weight between the different An×A5 compounds seems to be negligible, with ˜36,500 Da for Cy5.5-An×A5 and 38,650 Da for HIS-cys-An×A5-AF568.
Furthermore, the blood half-life of the dual-labeled An×A5 used is ˜20 minutes in mice,26 which might not be enough time for An×A5 to reach the brain. We recently developed a long-circulating version of An×A5 with a blood half-life of ˜1 hour, which needs to be further investigated.16 In addition, it has been described that continuous tracer infusion or step-down infusion compared with single-bolus infusion may enhance tracer delivery.27–29 Also, intraventricular infusion of An×A5 might be a possibility to overcome the BBB. These options should be investigated in further studies.
Furthermore, we found a spotty distribution of An×A5 inside the brain. Interestingly, An×A5 signal was often located in the ventricles on both hemispheres. An×A5 was also observable at the rim of the slices. This suggests that An×A5 might have drained into the cerebrospinal fluid (CSF) via the blood–CSF barrier at the choroid plexus and the outer CSF–brain barrier between the CSF-fiMed subarachnoid space and overlying structures. In fact, the choroidal endothelium has no restrictive effect on large molecule transfer between blood and CSF. It has been shown that proteins can quickly equilibrate in the stromal compartment and fill the basolateral intercellular spaces up to the tight junction complexes.30 In our previous study on An×A5 uptake after MCAO, we found An×A5 signal at the choroid plexus.10
All in all, it seems as if near-infrared fluorescently labeled An×A5 has characteristics that allow it to cross the BBB, which might not be the case for 99mTc(CO)3-HIS-cys-An×A5-AF568. Whether An×A5 can successfully label dead cells in the brain critically depends upon its label. However, we have shown that when An×A5 reaches the brain, it binds to dead cells with a high specificity. Whether the BBB is truly the reason for insufficient accumulation of dual-labeled An×A5 remains to be elucidated in further studies, e.g., by co-administration studies using albumin or injecting An×A5 directly into the ventricle.
In conclusion, our study indicates that the dual-labeled An×A5 applied is not suited to visualize death of brain cells in a 60-minute mouse model of focal cerebral ischemia in vivo. Whether this is because of a lack of tracer penetration into the brain cannot be inferred from our study and might be the subject of further study.
Footnotes
CPR is the inventor for the following patents: US 5834196 ‘Method for detecting and/or optionally quantifying and/or separating apoptotic cells in or from a sample’ and US 7511016 ‘Annexins, derivatives thereof, and annexin-cys variants, as well as therapeutic and diagnostic uses thereof’.
SchubertAEmoryL. Cellular mechanisms of brain injury and cell death. Curr Pharm Des2012; 18: 6325–6330.
3.
ZilleMFarrTDPrzesdzingIMullerJSommerCDirnaglU. Visualizing cell death in experimental focal cerebral ischemia: promises, problems, and perspectives. J Cereb Blood Flow Metab2012; 32: 213–231.
4.
VangestelCPeetersMMeesGOltenfreiterRBoersmaHHElsingaPH. In vivo imaging of apoptosis in oncology: an update. Mol Imaging2011; 10: 340–358.
5.
YangTJHaimovitz-FriedmanAVerheijM. Anticancer therapy and apoptosis imaging. Exp Oncol2012; 34: 269–276.
6.
LauferEMWinkensHMCorstenMFReutelingspergerCPNarulaJHofstraL. PET and SPECT imaging of apoptosis in vulnerable atherosclerotic plaques with radiolabeled Annexin A5. Q J Nucl Med Mol Imaging2009; 53: 26–34.
7.
WoltersSLCorstenMFReutelingspergerCPNarulaJHofstraL. Cardiovascular molecular imaging of apoptosis. Eur J Nucl Med Mol Imaging2007; 34(Suppl 1): S86–S98.
8.
BlankenbergFGKalinyakJLiuLKoikeMChengDGorisML. 99mTc-HYNIC-annexin V SPECT imaging of acute stroke and its response to neuroprotective therapy with anti-Fas ligand antibody. Eur J Nucl Med Mol Imaging2006; 33: 566–574.
9.
TangXNWangQKoikeMAChengDGorisMLBlankenbergFG. Monitoring the protective effects of minocycline treatment with radiolabeled annexin V in an experimental model of focal cerebral ischemia. J Nucl Med2007; 48: 1822–1828.
10.
BahmaniPSchellenbergerEKlohsJSteinbrinkJCordellRZilleM. Visualization of cell death in mice with focal cerebral ischemia using fluorescent annexin A5, propidium iodide, and TUNEL staining. J Cereb Blood Flow Metab2011; 31: 1311–1320.
11.
De Saint-HubertMMottaghyFMVunckxKNuytsJFongeHPrinsenK. Site-specific labeling of ‘second generation’ annexin V with 99mTc(CO)3 for improved imaging of apoptosis in vivo. Bioorg Med Chem2010; 18: 1356–1363.
12.
EngelOKolodziejSDirnaglUPrinzV. Modeling stroke in mice—middle cerebral artery occlusion with the filament model. J Vis Exp2011.
13.
BauwensMDe Saint-HubertMCleynhensJVandeputteCLiJDevosE. In vitro and in vivo comparison of 18F and 1231-labeled ML10 with 68Ga-Cys2-An×A5 for molecular imaging of apoptosis. Q J Nucl Med Mol Imaging2013; 57: 187–200.
14.
Sterin-SpezialeNKahaneVLSettonCPFernandezMCSpezialeEH. Compart-mental study of rat renal phospholipid metabolism. Lipids1992; 27: 10–14.
15.
FalborgLWaehrensLNAlsnerJBluhmeHFrokiaerJHeegaardCW. Biodistribution of 99mTc-HYNIC-lactadherin in mice—a potential tracer for visualizing apoptosis in vivo. Scand J Clin Lab Invest2010; 70: 209–216.
16.
HaeckelAApplerFFiggeLKratzHLukasMMichelR. XTEN-Annexin A5: XTEN allows complete expression of long-circulating protein-based imaging probes as recombinant alternative to PEGylation. J Nucl Med2014; 55: 508–514.
17.
DeLongMJ. Apoptosis: a modulator of cellular homeostasis and disease states. Ann N Y Acad Sci1998; 842: 82–90.
18.
KartachovaMSValdes OlmosRAHaasRLHoebersFJvan den BrekelMWvan ZandwijkN. Mapping of treatment-induced apoptosis in normal structures: 99mTc-Hynic-rh-annexin V SPECT and CT image fusion. Eur J Nucl Med Mol Imaging2006; 33: 893–899.
19.
BernackiJDobrowolskaANierwińskaKMałeckiA. Physiology and pharmacological role of the blood-brain barrier. Pharmacol Rep2008; 60: 600–622.
20.
CardosoFLBritesDBritoMA. Looking at the blood-brain barrier: molecular anatomy and possible investigation approaches. Brain Res Rev2010; 64: 328–363.
21.
AbbottNJPatabendigeAADolmanDEYusofSRBegleyDJ. Structure and function of the blood-brain barrier. Neurobiol Dis2010; 37: 13–25.
22.
HarhausenDSudmannVKhojastehUMullerJZilleMGrahamK. Specific imaging of inflammation with the 18 kDa translocator protein ligand DPA-714 in animal models of epilepsy and stroke. PLoS One2013; 8: e69529.
23.
HuangZGXueDPrestonEKarbalaiHBuchanAM. Biphasic opening of the blood-brain barrier following transient focal ischemia: effects of hypothermia. Can J Neurol Sci1999; 26: 298–304.
24.
PillaiDRDittmarMSBaldaranovDHeidemannRMHenningECSchuiererG. Cerebral ischemia-reperfusion injury in rats—a 3 T MRI study on biphasic blood-brain barrier opening and the dynamics of edema formation. J Cereb Blood Flow Metab2009; 29: 1846–1855.
VangestelCPeetersMOltenfreiterRD'AsselerYStaelensSVan SteenkisteM. In vitro and in vivo evaluation of [99mTc]-labeled tricarbonyl His-annexin A5 as an imaging agent for the detection of phosphatidylserine-expressing cells. Nucl Med Biol2010; 37: 965–975.
27.
CarsonREChanningMABlasbergRGDunnBBCohenRMRiceKC. Comparison of bolus and infusion methods for receptor quantitation: application to [18F]cyclofoxy and positron emission tomography. J Cereb Blood Flow Metab1993; 13: 24–42.
28.
KnightRAKarkiKEwingJRDivineGWFenstermacherJDPatlakCS. Estimating blood and brain concentrations and blood-to-brain influx by magnetic resonance imaging with step-down infusion of Gd-DTPA in focal transient cerebral ischemia and confirmation by quantitative autoradiography with Gd-[(14)C]DTPA. J Cereb Blood Flow Metab2009; 29: 1048–1058.
29.
MertenCLKniteliusHOAssheuerJBergmann-KurzBHeddeJPBewermeyerH. MRI of acute cerebral infarcts, increased contrast enhancement with continuous infusion of gadolinium. Neuroradiology1999; 41: 242–248.
30.
StrazielleNGhersi-EgeaJF. Physiology of blood-brain interfaces in relation to brain disposition of small compounds and macromolecules. Mol Pharm2013; 10: 1473–1491.