
Abstract
Cerebral infarction initiates a cascade of molecular events, leading to proteolytic cell death. Matrix-degrading metalloproteinases (MMPs) are neutral proteases involved in extracellular matrix damage. Type IV collagenase is an MMP that increases cerebral capillary permeability after intracerebral injection and may be important along with plasminogen activators (PA) in secondary brain edema in stroke. Therefore, we measured MMPs and PAs in spontaneously hypertensive (SHR) or Wistar-Kyoto (WKY) rats with permanent middle cerebral artery occlusion (MCAO). Brain tissue was assayed for MMPs and PAs at 1, 3, 12, and 24 h and 5 days after occlusion, using substrate gel Polyacrylamide electrophoresis (zymography). SHR showed an increase in 92-kDa type IV collagenase (gelatinase B) in the infarcted hemisphere compared with the opposite side at 12 and 24 h (p < 0.05). Gelatinase A remained the same in both infarcted and normal tissue until 5 days after injury, when it increased significantly (p < 0.05). Urokinase-type PA was increased significantly at 12 and 24 h and 5 days, while tissue-type PA was decreased significantly at 1, 12, and 24 h in the ischemic compared with the nonischemic hemisphere. Gelatinase B was markedly increased in SHR at 12 and 24 h compared with WKY (p < 0.05). Secondary vasogenic edema is maximal 1–2 days after a stroke, which is the time that gelatinase B was elevated. The time of appearance of gelatinase B suggests a role in secondary tissue damage and vasogenic edema, while gelatinase A may be involved in tissue repair.
Keywords
Glutamate release, ion shifts, and calcium overload occur within minutes after occlusion of a cerebral blood vessel (Choi, 1988; Siesjo and Bengtsson, 1989; Ginsberg and Pulsinelli, 1994). These early events initiate increases in cytokines, immediate early genes, and free radicals (Chan et al., 1991; An et al., 1992; Iadecola et al., 1994; Kinouchi et al., 1994). At a later time, proteases that participate in the final disruption of cell membranes and damage to the extracellular matrix are produced. As a consequence of the disruption of the extracellular matrix, the blood-brain barrier is opened, allowing vasogenic brain edema to accumulate.
Cerebral blood vessels are surrounded by a basal lamina composed of type IV collagen, fibronectin, heparan sulfate, and laminin (McArdle et al., 1984). Intracerebral injection of activated 72-kDa type IV collagenase (gelatinase A) caused an increase in capillary permeability and a thinning of the basal lamina (Rosenberg et al., 1992). This suggested that endogenous production of matrix-degrading metalloproteinases (MMP) and urokinase-type plasminogen activator (uPA) could participate in a proteolytic cascade. Cancer cells employ such a proteolytic cascade to digest basement membranes, allowing metastatic cells to spread across blood vessels (Li-otta et al., 1980). During hemorrhagic injury in rat brain, increases occur in 92-kDa type IV collagenase (gelatinase B) and uPA, which are maximal at 16–24 h (Rosenberg et al., 1994). Both the MMP and uPA genes have AP-1-binding sites in their promoter regions that bind dimers formed from products of the immediate early genes c-fos and c-jun and initiate production of MMP and uPA (Sato and Seiki, 1993). Cytokines act similarly (Brenner et al., 1989). Ischemic injury causes an increase in both the early immediate genes and various cytokines, including tumor necrosis factor-α (Liu et al., 1993, 1994). Therefore, we hypothesized that proteolytic cascade enzymes were induced by ischemic injury. Brain tissue from rats subjected to permanent middle cerebral artery occlusion (MCAO) was tested by zymography for MMP and uPA from 1 h to 5 days after ischemia.
METHODS
Animal preparation
Thirty-three adult spontaneously hypertensive (SHR) or Wistar–Kyoto (WKY) rats were used in the study. They had permanent MCAO as previously described (Barone et al., 1991). In brief, SHR or WKY, weighing 250–350 g, were anesthetized with sodium pentobarbital (60 mg/kg IP) before surgery to occlude the middle cerebral artery. Animals were housed and cared for in accordance with the Guide for the Care and Use of Laboratory Animals (Bethesda, MD: Office of Science and Health Reports, DRR/NIH, 1985). Procedures using laboratory animals were approved by the Institutional Animal Care and Use Committee of SmithKline Beecham Pharmaceuticals.
Briefly, after a 2- to 3-mm craniotomy over the right MCA and removal of the dura, the hooked tip of a platinum-iridium wire mounted on a micromanipulator was placed under the MCA and the artery was pulled 0.5–1.0 mm away from the brain surface. The artery was then simultaneously occluded and cut dorsally to the lateral olfactory tract at the level of the inferior cerebral vein. Later, rats that had recovered were overdosed with pentobarbital and forebrains were removed and dissected as described previously at different times after MCAO (Liu et al., 1993, 1994; Barone et al., 1991). An ipsilateral hemisphere (ischemic cortex) and an identical segment from the contralateral cortical hemisphere (nonischemic cortex) were dissected and immediately frozen in liquid nitrogen and stored at −80°C.
Twenty-one SHR were studied. Control tissue for time 0 was obtained from unoperated rats (n = 3). Three SHR were studied at 1, 3, 12, and 24 h and 5 days after surgery. WKY rats were studied at 12 (n = 3) and 24 (n = 6) h after surgery. An additional three SHR rats were studied at 24 h for comparison of the effect of ischemia on proteolytic cascade enzyme production between SHR and WKY. Three WKY were studied 24 h after sham-operation.
Proteolytic enzyme measurements
Brain tissue was removed and sectioned into four pieces. One section was in the region of maximal damage from the infarction. Another was dorsal to that region in the ipsilateral hemisphere. Two additional sections were taken from the opposite hemisphere in the same regions as on the infarcted side. Zymograms were done as described earlier (Rosenberg et al., 1994). Brains were removed, frozen, and trimmed to obtain tissue from the regions of interest. Tissue samples were immediately weighed, and a volume of 0.5% Triton X-100 in 20 mM phosphate-buffered saline (pH 7.0) was added to bring the final concentration to 400 mg/ml. Tissue samples were minced and left in solution at 4°C for 24 h. After centrifugation, the supernatant was drawn off and stored at −70°C for zymography. Sodium dodecyl sulfate (SDS) was added for electrophoresis: Five microliters of supernatant was mixed with 3 μl TRIS buffer (1.5 M, pH 8.8) and 2 μl of SDS buffer (55% distilled water; 12.5% of 0.5 M TRIS-HCl, pH 6.8; 10% glycerol; 20% SDS in a 10% w/v solution; and 2.5% bromophenol blue in a 0.05% w/v solution). Polyacrylamide minigels (10%) were prepared with gelatin copolymerized into the gels. Protein standards and HT1080 fibrosarcoma cell media were treated similarly before loading onto the gels. Following electrophoresis, all gels were agitated in 2.5% Triton X-100 to remove SDS and incubated at 37°C for 24 h. For detection of PAs, casein and plasminogen were copolymerized into the gels instead of gelatin. Gels were stained for 1 h in 50% methanol/1% acetic acid with 0.125% Coumassie G-250, then destained in 10% acetic acid. Protease activity on the zymograms appears as a clear zone where the enzyme has dissolved the substrate.
Data analysis
Dried gels were scanned by computer (HP ScanJet IIc; Hewlett-Packard, Palo Alto, CA, U.S.A.). Computer image analysis software (NIH Image: vl.56) was used to analyze gels on a Macintosh Power PC computer. Images were analyzed with the electrophoretic gel lane calculation option in the program. Standardization was done with an optical density step tablet. Protein content was assayed by the micro BCA method (Pierce, Rockford, IL, U.S.A.). Results were expressed as area of lysis zone absorbance divided by protein content.
Statistical analysis of the data was done by either an analysis of variance (ANOVA), with the Waller-Duncan K ratio used to correct for multiple t tests, or, when appropriate, by Student's t test, using Statistical Analysis System (SAS, Cary, NC, U.S.A.). Significance was taken as p < 0.05.
RESULTS
A representative zymogram of rat brain tissue removed and processed at different times in the infarct is shown in Fig. 1. The lower band at 72 kDa in the zymograms shows gelatinase A in the tissue. Low levels of gelatinase A are seen in both hemispheres until 5 days after infarction. The upper band at 92 kDa represents gelatinase B, which is seen to be present hours after injury. In unoperated SHR, low levels of both gelatinase A and B were found.
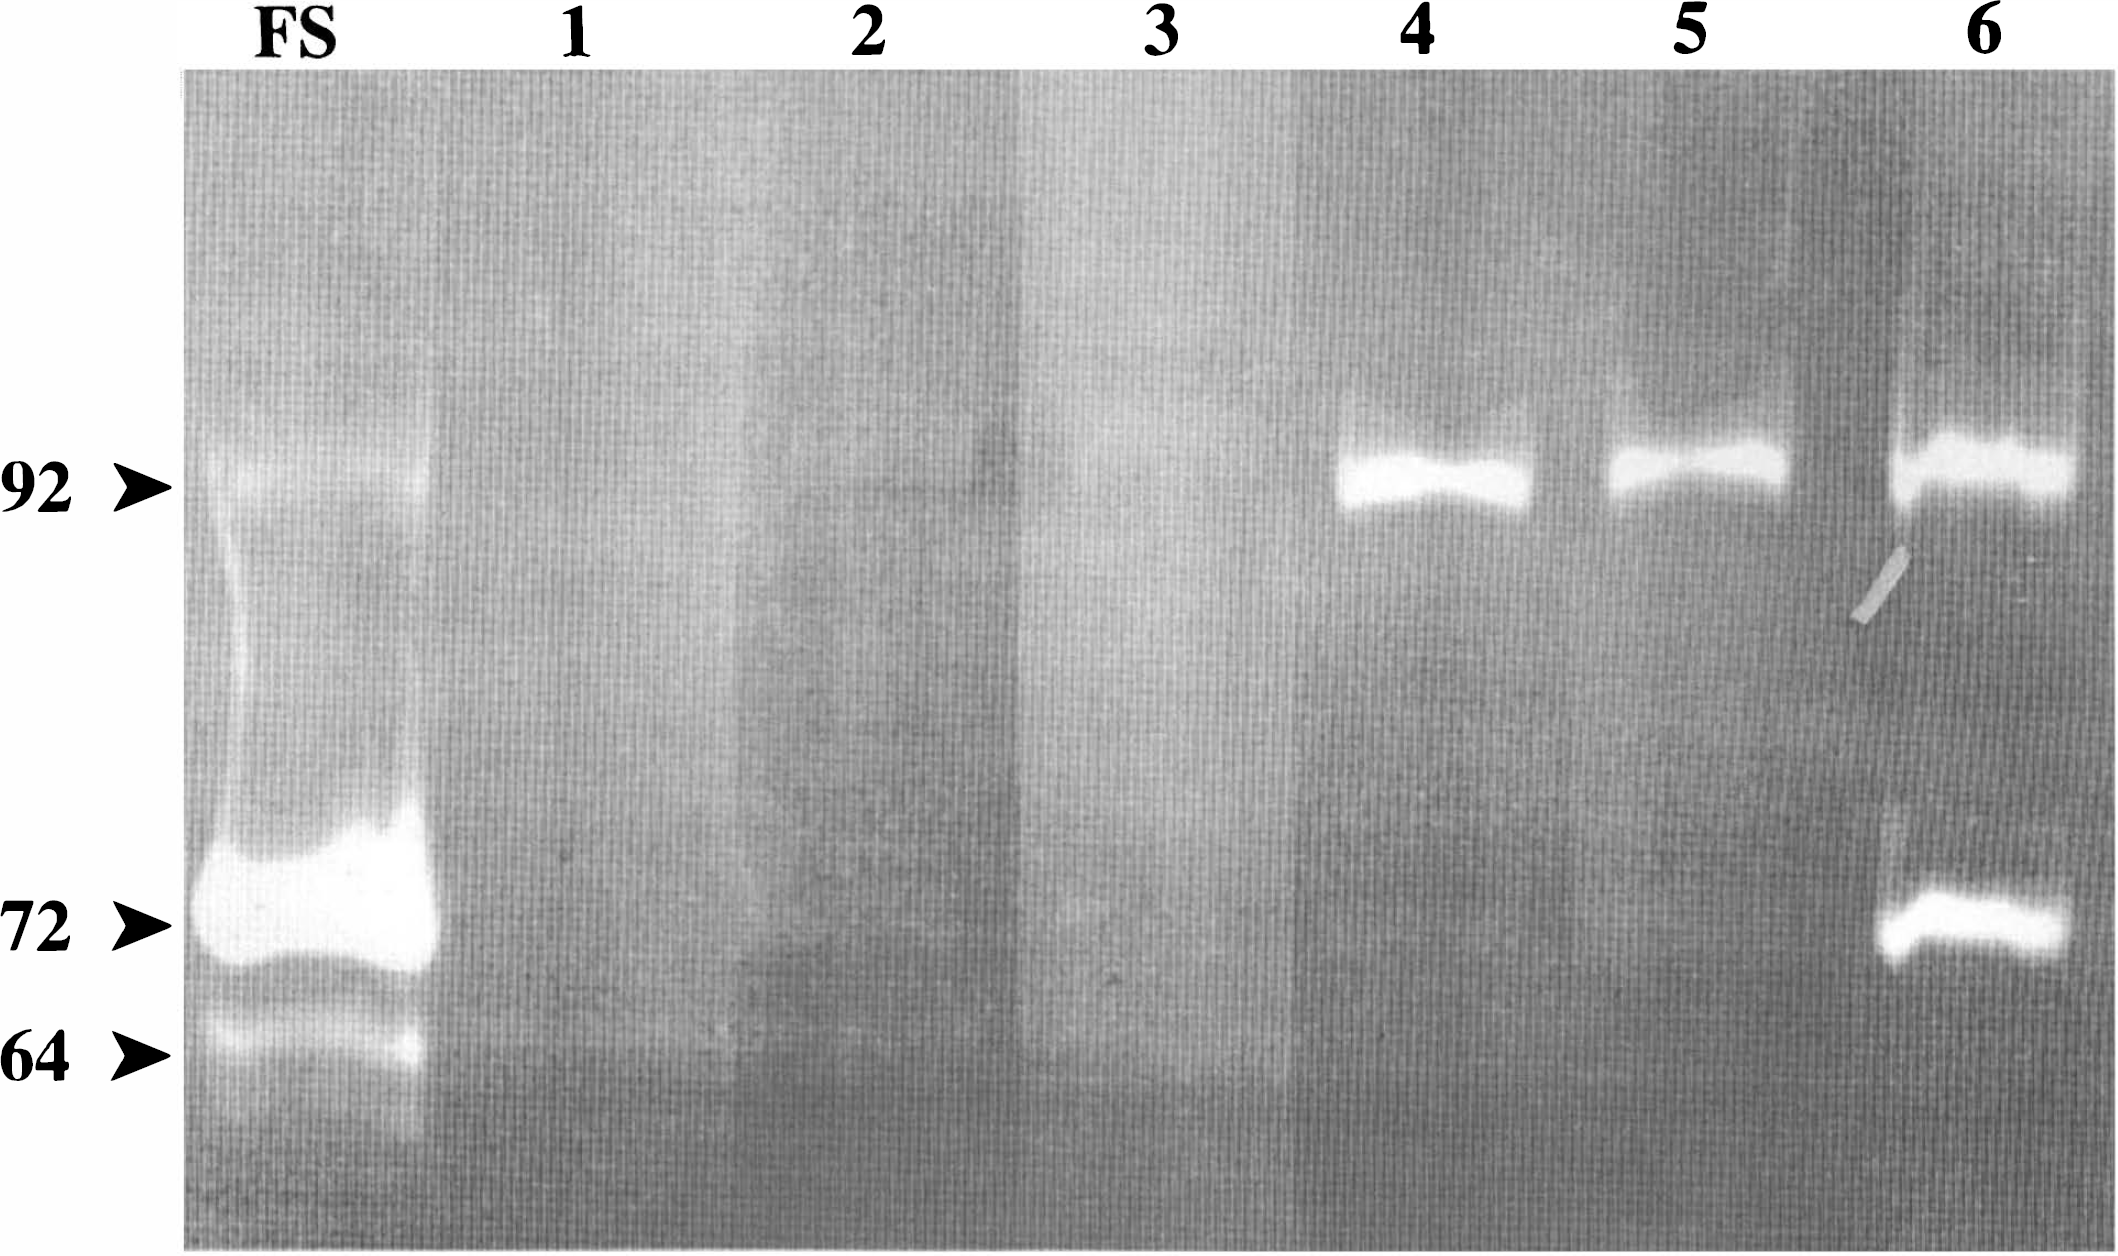
Gelatin zymogram of rat brain tissue from spontaneously hypertensive rats (SHR) with permanent middle cerebral artery occlusion (MCAO). The lane labeled FS is the fibrosarcoma-conditioned medium from HT1080 cells. Lanes are as follows: 1, SHR without surgery; 2, 1 h after MCAO; 3, 3 h; 4, 12 h; 5, 24 h; and 6, 5 days. The upper band is 92 kDa from gelatinase B and the lower band is 72 kDa from gelatinase A. The 64-kDa band in the HT1080 is an active form of the enzyme.
Measurements of the area of lysis in the zymographic gels revealed that gelatinase A was significantly increased over the unoperated control rats at 5 days (p < 0.05), while all other values were similar to those in the uninjured hemisphere (Fig. 2). Gelatinase B in the region of the infarcted tissue in SHR was significantly elevated at 12 and 24 h only (p < 0.05). The value of gelatinase B at 5 days was also elevated compared with sham-operated controls, but it failed to reach statistical significance (Fig. 3).
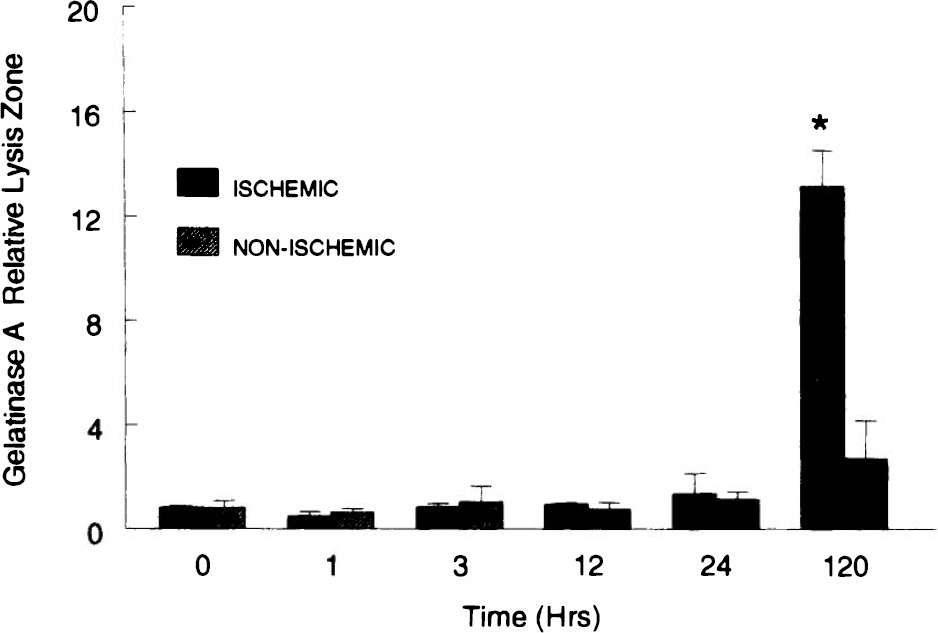
Amount of gelatinase A in brain tissue from spontaneously hypertensive rats (SHR) after right middle cerebral artery occlusion (MCAO) for the time shown. Tissue was taken from regions in the right hemisphere (ischemic) or from the opposite side (nonischemic). The values for the ischemic hemisphere were compared statistically using analysis of variance with corrections for multiple comparisons. *Significant increase seen at 5 days (p < 0.05). Error bars show mean ± standard deviation.
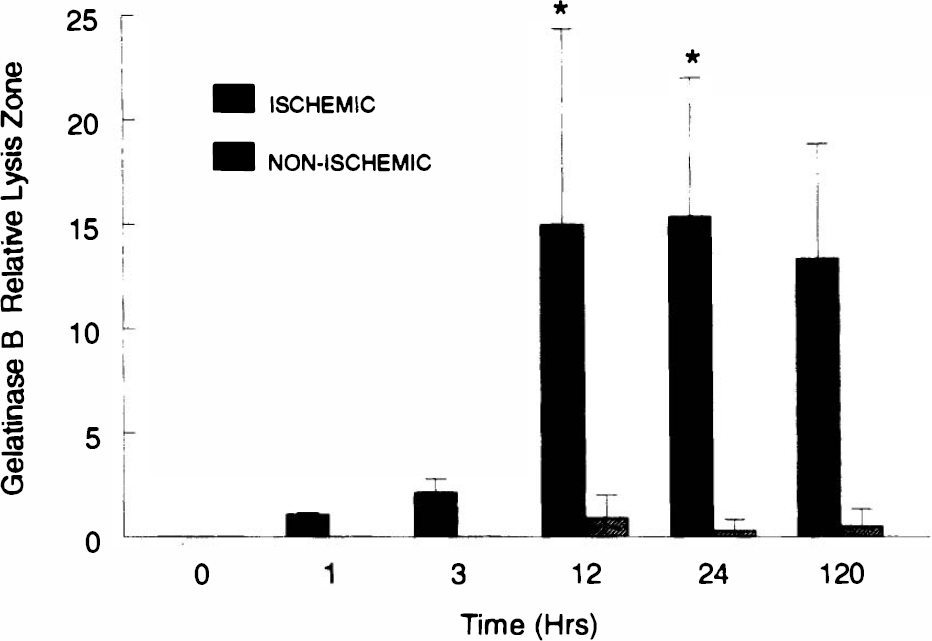
Gelatinase B in spontaneously hypertensive rats (SHR) subjected to permanent right middle cerebral artery occlusion (MCAO) and studied at the times shown. Unoperated rats (time 0) showed no gelatinase B activity on zymograms. Values for right (ischemic) hemisphere represented by solid bars and for left (nonischemic) by stripped bars. No gelatinase B activity was seen in the nonischemic hemisphere at 1 and 3 h. *Significant increases in gelatinase B compared with controls at time 0 (p < 0.05). Error bars show mean ± standard deviation.
A casein/plasminogen zymography gel for detection of uPA is shown in Fig. 4. Two distinct bands are observed. The upper band represents tissue-type plasminogen activator (tPA), while the lower band is from uPA. uPA rose in the infarcted brain tissue, reaching significant levels by 12 h and maximal values at 5 days (Fig. 5). tPA was highest in unoperated brain tissue and reduced in ischemic tissue at 1, 12, and 24 h (Fig. 6).
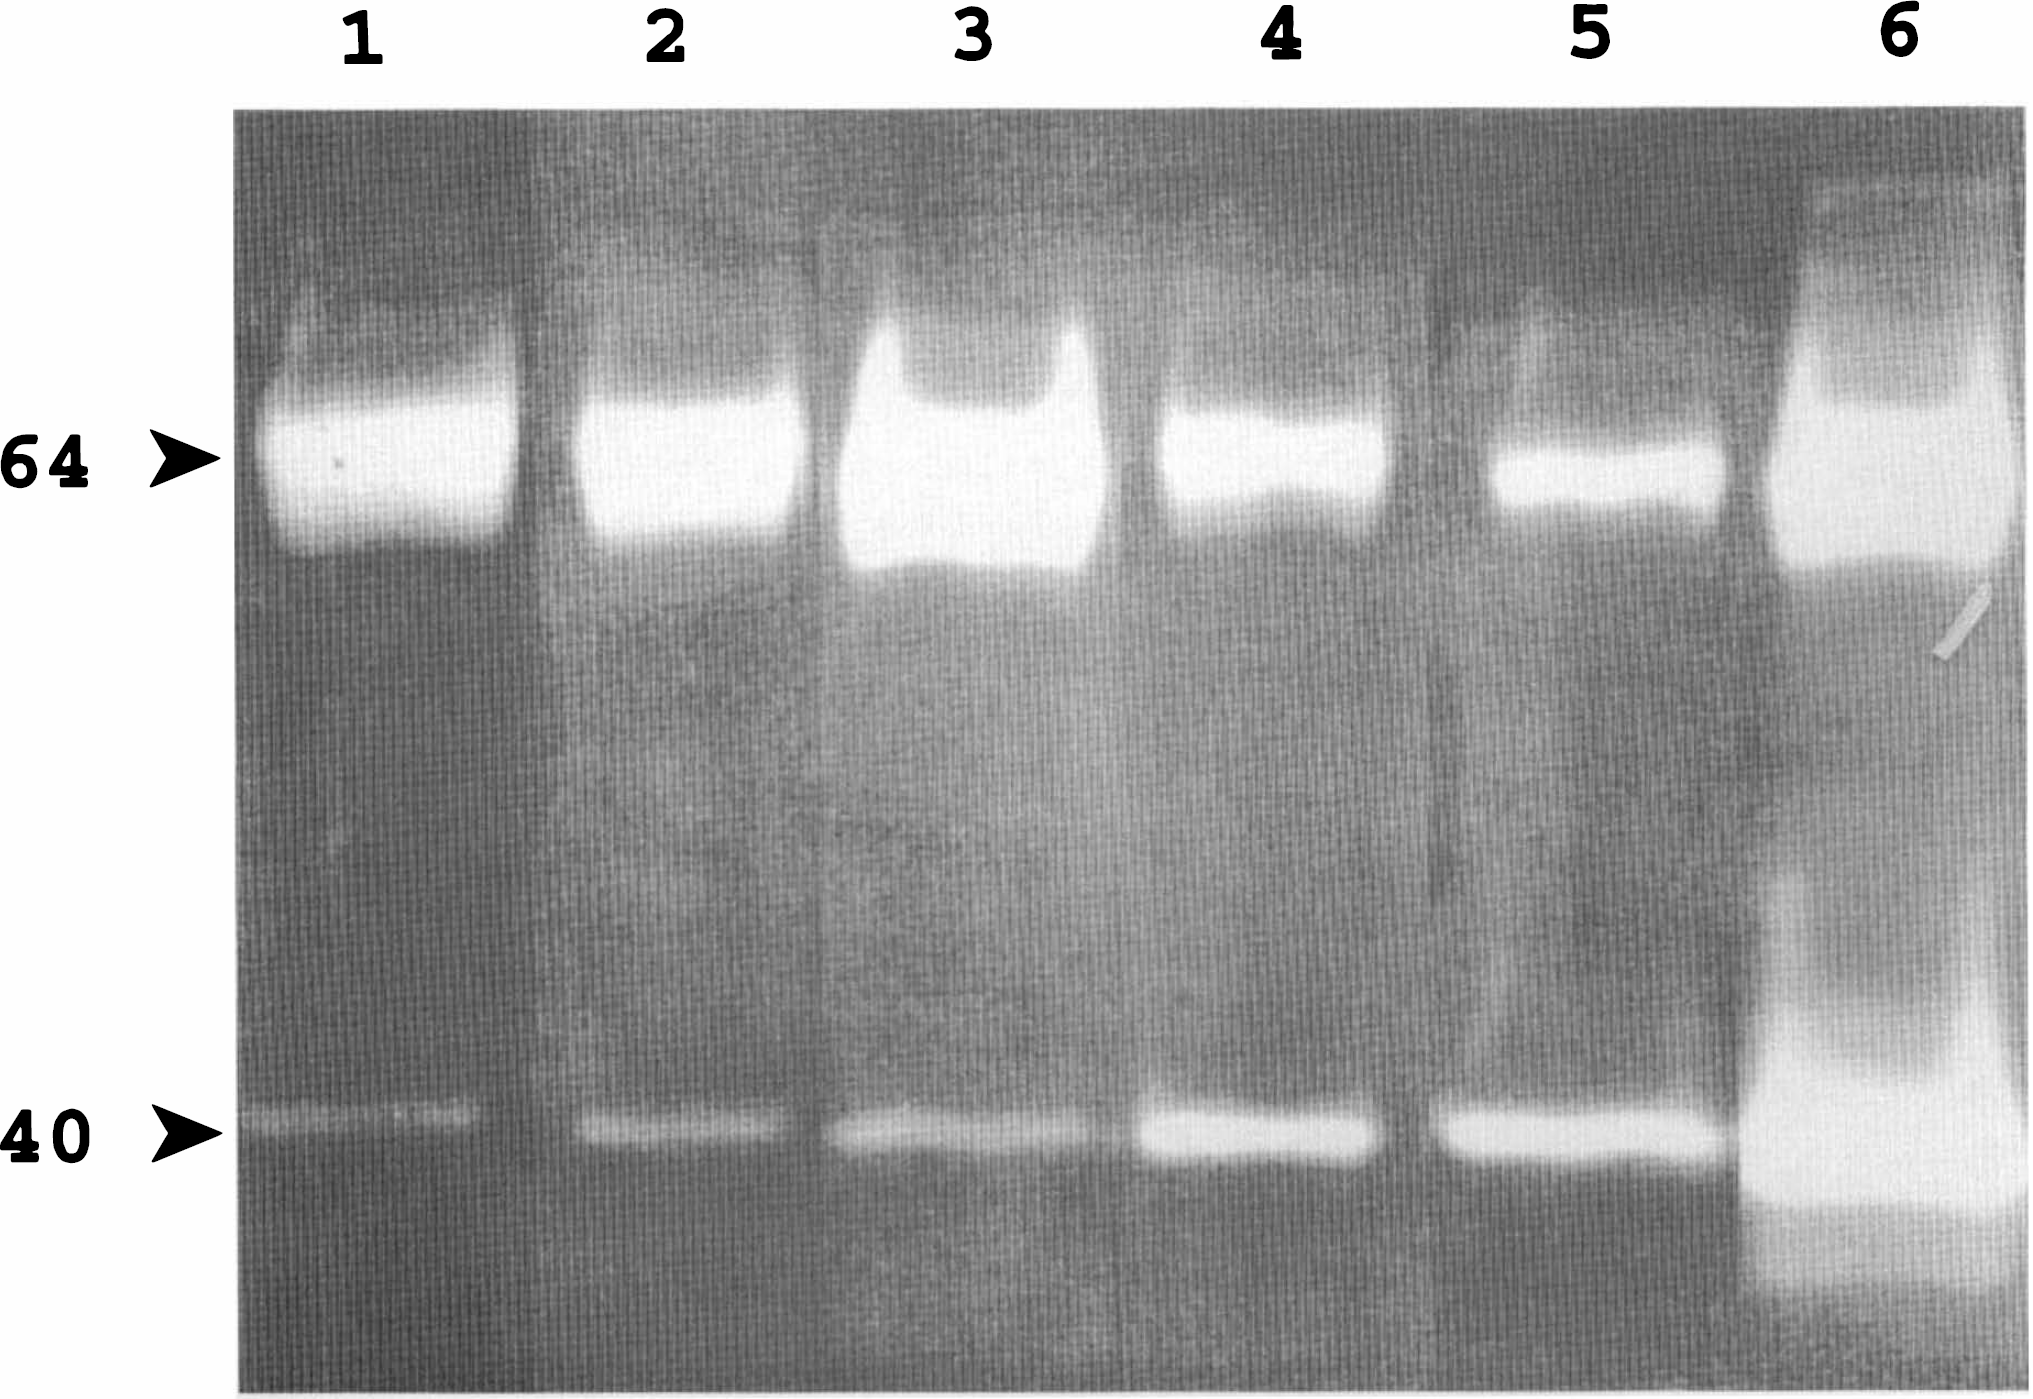
Casein/plasminogen zymogram of brain tissue from spontaneously hypertensive rats (SHR) with permanent middle cerebral artery occlusion (MCAO). Lanes are as follows: 1, SHR without surgery; 2, 1 h after occlusion; 3, 3 h; 4, 12 h; 5, 24 h; and 6, 5 days. The upper band, with a molecular weight around 64 kDa, represents tissue-type plasminogen activator (tPA). The 40-kDa band represents urokinase-type plasminogen activator (uPA). The decrease in tPA at 24 h and the increase in uPA at 12 and 24 h and at 5 days are clearly seen.
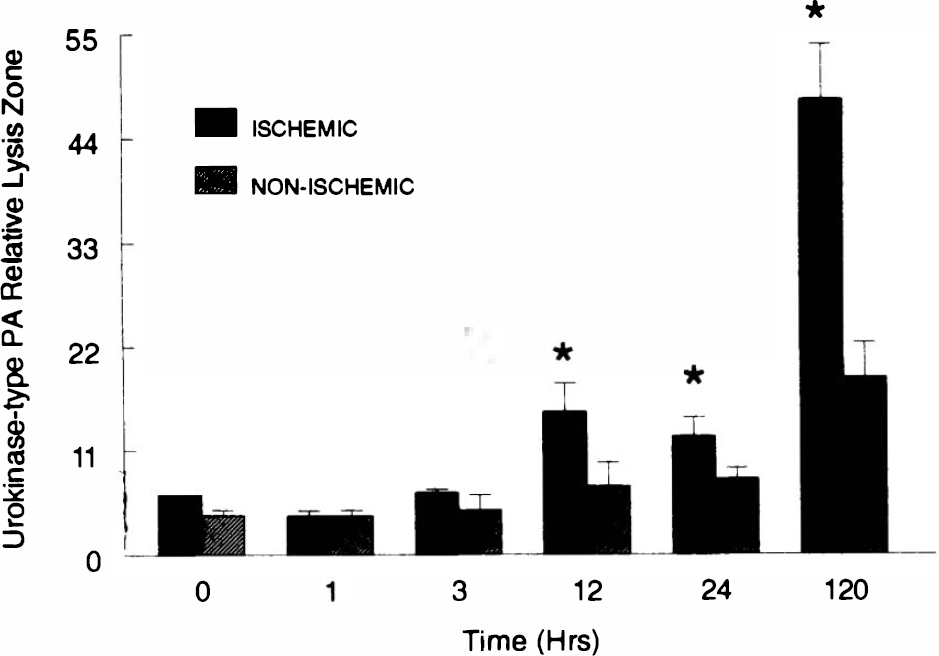
Urokinase-type plasminogen activator determined by zymography in spontaneously hypertensive rats (SHR) with right middle cerebral artery occlusion (MCAO). Time after ischemic occlusion shown. Right hemisphere (ischemic) shown as solid bar, and left (nonischemic) as hatched bar. *Significantly different from sham-operated controls (p < 0.05). Error bars show mean ± standard deviation.
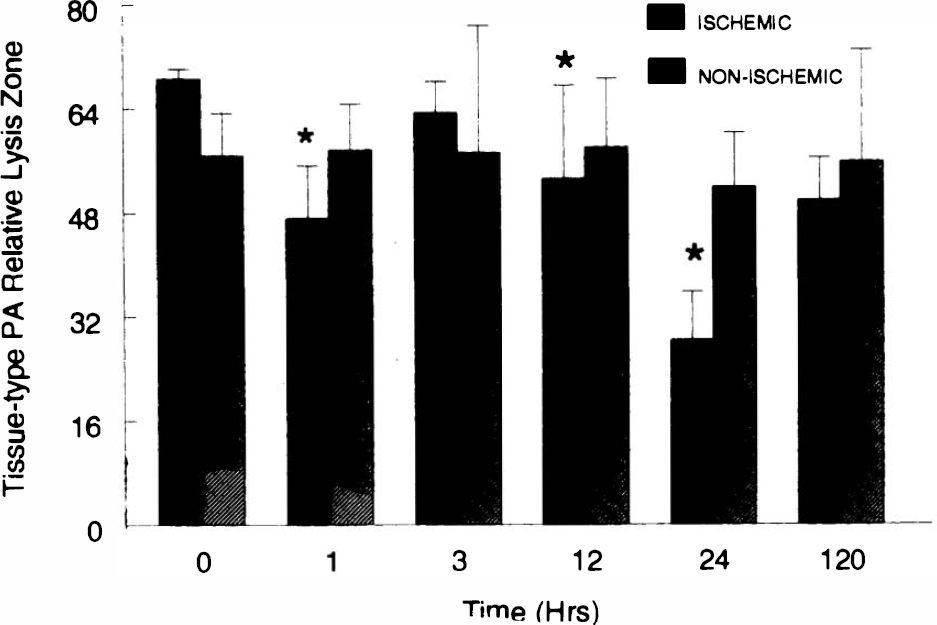
Tissue-type plasminogen activator in spontaneously hypertensive rats (SHR) with right middle cerebral artery occlusion (MCAO). Values are from zymograms of right hemisphere (ischemic) or left (nonischemic) tissue. *Significantly less than sham-operated controls (p < 0.05). Error bars show mean ± standard deviation.
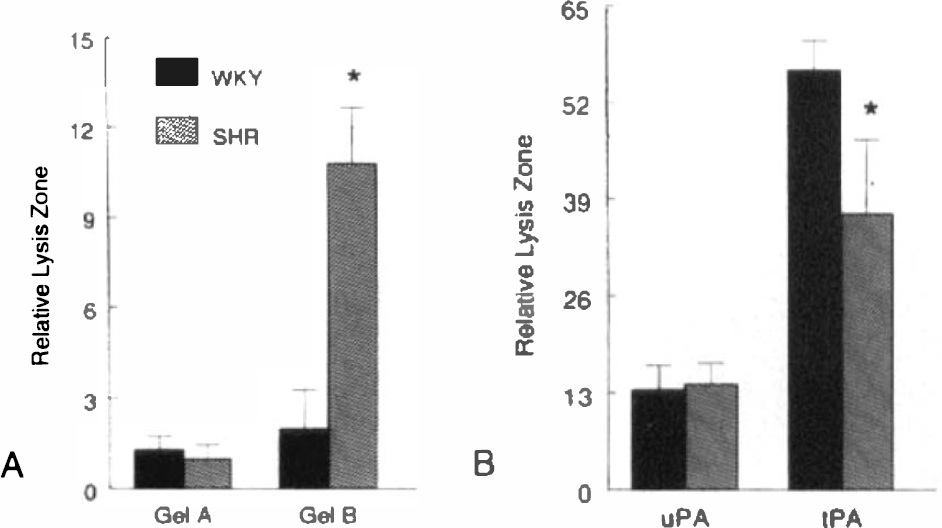
Comparison of proteolytic enzyme production in SHR and WKY was done 24 h after infarct. No differences were noted in the levels of gelatinase A between the two species. At 24 h, SHR had markedly higher levels of gelatinase B than WKY in the region of the infarct (Fig. 7A). This increase in gelatinase B in SHR was seen at 12 h and was absent in sham-operated WKY (data not shown). One data point, which was far from the median values (29.3 compared with 4, 0, 1, 3, and 2), was removed prior to statistical comparison of SHR and WKY. Similarly, the highest data point in the SHR group was removed (22.5 compared with 9, 14, 10, 8, and 12). Urokinase values in infarcted tissue were similar in the two rat strains, while tPA was lower in SHR than in WKY (Fig. 7B).
DISCUSSION
Permanent occlusion of the middle cerebral artery in SHR caused an increase in the levels of proteolytic cascade enzymes gelatinase B and urokinase. Increases in gelatinase B occurred 12 h after MCAO and remained significantly elevated at least for 24 h. Gelatinase A, however, remained unchanged until 5 days after the ischemic event. uPA was increased at 12 and 24 h, reaching maximal levels at 5 days. The time of maximal increases in the enzymes corresponds with the time of vasogenic edema (Menzies et al., 1993).
Intracerebral injection of activated gelatinase A opens the blood-brain barrier by attacking the extracellular matrix around cerebral capillaries (Rosenberg et al., 1992). Gelatinases A and B are produced by different gene mechanisms, but both attack macromolecules in the basal lamina (Woessner, 1991). Although a direct link between gelatinase B production and blood-brain barrier damage remains to be established, the production of gelatinase B when the blood-brain barrier is open suggests an association.
Gelatinase B began to increase around 3 h after the onset of ischemia. Immediate early genes or cytokines are elevated at that time and may have stimulated MMP production by acting on the promoter region of the gene (Liu et al., 1994). The long delay before an increase in gelatinase A eliminates a role in acute injury but suggests that it is involved in the recovery phase. Tumor necrosis factor-α induces the production of gelatinase B 24 h after intracerebral injection and causes secondary opening of the blood-brain barrier; capillary damage is blocked by a synthetic inhibitor of MMP (Rosenberg et al., 1995).
Other investigators have studied the effect of ischemia on the blood-brain barrier. Around 24 h after a permanent MCAO, there is an increase in brain water that corresponds with opening of the blood-brain barrier (Menzies et al., 1993). The increase in brain water resolves over several days, while the increase in capillary permeability persists longer. In an earlier study of blood-brain barrier damage, using a model of intracerebral hemorrhage, capillary permeability to radiolabeled sucrose was increased for 7 days, resolving by 14 days. In the hemorrhagic model, secondary vasogenic brain edema resolved by 48 h, though the blood-brain barrier remained open longer (Rosenberg et al., 1990, 1993).
MMP are a gene family of zinc-containing enzymes (Sato and Seiki, 1993). The promoter region of the gelatinase B gene has an AP-1 binding site which responds to many stimuli, including Fos/Jun dimers and cytokines (Lefebvre et al., 1990). Gelatinase B is released into the extracellular space in a latent form. Proteases and free radicals are possible activators of the latent enzymes, but the mechanisms of activation in vivo are poorly understood. Several cytokines are increased in ischemia (Rothwell and Relton, 1993; Feuerstein et al., 1994), particularly tumor necrosis factor-α and interleukin-1β, which are significantly elevated 3–6 h post-ischemia, peaking at 12 h (Liu et al., 1993).
The cell types involved in production in gelatinase B and uPA in vivo are uncertain. Antibodies to gelatinases and cDNA probes for the genes are not available for the rat, and studies localizing the enzymes cannot be done. In culture, many cells produce MMP, including microglial cells, astrocytes, endothelial cells, and mononuclear cells; stimulation with phorbol esters, cytokines, or lipopolysaccharides is required (Gottschall and Yo, 1995; Colton et al., 1993).
Gelatinase A was increased at 5 days, suggesting that it is involved in remodeling of the extracellular matrix. This is the time of elevation of transforming growth factor-β, which is activated by plasmin and induces extracellular matrix production (Wang et al., 1995). uPA was markedly increased at 5 days. Gelatinases and plasminogen activators act in cascade to attack the basal lamina (Reich et al., 1988; Reith and Rucklidge, 1992). Such a process is important in angiogenesis, which is beginning around that time (Folkman and Shing, 1992).
An interesting finding is that SHR produce much higher amounts of gelatinase B after MCAO than WKY. SHR have an exaggerated release of tumor necrosis factor-α after intracisternal or systemic injection of lipopolysaccharide (Hallenbeck et al., 1991; Siren et al., 1993). SHR have pathological changes in the blood vessels, including thickening of the basal lamina around capillaries (Fredriksson et al., 1988). Gelatinases may play a role in the fibrosis that appears after breakdown and repair of the extracellular matrix around the cerebral capillaries. Another difference between SHR and WKY was the lower levels of tPA in SHR. The significance of this observation will remain uncertain until the role of tPA in the brain is determined.
Our results suggest that gelatinases and uPA participate in secondary tissue damage after permanent MCAO. Elevated levels of gelatinase B occur when the blood-brain barrier is open, and gelatinase A is elevated when tissue repair is occurring. Activation of proteolytic enzymes may cause hemorrhagic transformation of the tissue after stroke. Agents that block the production or action of MMP may interfere with the development of secondary extracellular matrix disruption after stroke and enhance recovery.
Footnotes
Acknowledgment:
This study was supported by an NIH grant (RO1 NS21169-07) and a Merit Review from the Veterans Health Administration to G.A.R. Ray White provided excellent technical support. Parts of the report were presented as an abstract at the 1995 meeting of the American Neurological Association in October in Washington, DC.