
Abstract
Over the past decade the New Zealand Government's national mental health plans have emphasized developing community mental health services, developing the mental health workforce, strengthening the primary health sector's responsiveness to people with mental health problems, and coordinating care provision across the health and social service sectors [1–3]. These plans have also highlighted the need to improve mental health service provision for specific groups in the community, especially Māori, Pacific peoples, children and young people, and older people.
The epidemiological evidence used to inform the plans' development was drawn from the limited information available from New Zealand community surveys and records of inpatient or outpatient contacts within specialist mental health services [4, 5]. The former data are based on regional surveys undertaken more than a decade ago [6–8], with limited participation by Māori and Pacific peoples. Consequently, the information may no longer be relevant and representative at a national level. The latter data are unlikely to be representative of the extent of need for the whole New Zealand population, as they do not include information about the majority of people with mental disorders who do not have contact with specialist mental health services.
Estimates of psychiatric morbidity and service use have also been based on the results from surveys in Australia [9], Canada [10] and the US [11–13]. The population demographics and health service structures in these countries are very different from those in New Zealand, and it is uncertain how applicable the results from such overseas studies are to New Zealand.
Since the mid 1990s, several important initiatives have been introduced in New Zealand to improve the accessibility, effectiveness and appropriateness of mental health services [14–17]. New national data on health service use for mental health and substance use problems are needed to guide further implementation of national mental health strategies and provide baseline data to evaluate these initiatives' impact.
One major aim of Te Rau Hinengaro: The New Zealand Mental Health Survey (NZMHS) was to address this information gap. The specific objective was to describe the patterns of and barriers to health service use for people with mental disorders for the total New Zealand, Māori and Pacific populations, living in New Zealand. In this paper, information is presented on the 12 month and lifetime health service use for mental health and substance use problems. Detailed information about health service use for Māori, Pacific peoples and Others is presented elsewhere [18–23].
Method
Sample
The NZMHS was a nationally representative household survey of people aged 16 years and over. Face-to-face interviews were carried out between October 2003 and December 2004. The survey was approved by all 14 regional health ethics committees, with the Auckland Y committee serving as the lead committee. Written informed consent was obtained from all participants before the interview began. Māori and Pacific people were oversampled.
The interview consisted of two parts. Part 1 included core diagnostic sections, health services, suicidal behaviour and demographics and was administered to everyone (n = 12 992). Part 2 consisted of additional diagnostic sections and other measures of mental and physical health and was administered to a subsample (n = 7435), called the long-form subsample. A detailed report of methods is given elsewhere [24, 25]. The response rate was 73.3%.
Interview
The interview was based on version 15 of the World Mental Health Composite International Diagnostic Interview (WMH-CIDI) [26], a fully structured lay interview. Version 20 is now known as the CIDI 3.0. (http://www.hcp.med.harvard.edu/wmh/).
Diagnoses
Although ICD-10 [27] and DSM-IV [28] diagnoses can both be made from the CIDI 3.0 only DSM-IV diagnoses are reported here, using hierarchy rules. A psychosis screener section is included in the CIDI 3.0, but this does not generate specific diagnoses such as schizophrenia or other related psychoses. For this reason patterns of health service use associated with specific psychotic disorders are not presented in this paper.
Categorization of health and non-health services
At the end of each diagnostic section participants were asked about treatment contact. In the health services section of the interview, participants were asked if they had ever seen any of the listed professionals for a mental health reason (‘for help with your emotions, nerves, mental health, or problems with alcohol or drugs’) or had sought help in other ways such as through helplines or self-help groups. For this paper service sectors were placed in three nested categories:
the mental health specialist sector; the general medical sector, including general practitioners, other medical doctors, general nurses, occupational therapists and any health-care professional.
the health sector; the non-health sector, which included:
the human services sector (religious or spiritual advisors, social workers or counsellors in any setting other than a specialty mental health setting); the complementary or alternative medicine (CAM) sector, which included any other type of healer such as a herbalist or homeopath, participation in an Internet support group, or participation in a self-help group.
Sociodemographic correlates
Individual-level correlates are age at interview, sex, educational qualifications and equivalized household income. These sociodemographic correlates are described in more detail in other studies [24, 25].
Analyses
Data were weighted to account for different probabilities of selection that arose from oversampling Māori and Pacific people and the selection of one person per household, differential non-response, and residual differences in age, sex and ethnicity between the sample and the 2001 census population. Additional weights were used to account for selection into the short and long-form sections of the interview. Analyses were carried out in SUDAAN 9.0.1. Taylor series linearization [29] was used to approximate the variance of estimates. For prevalences with less than 30 events in the numerator, confidence intervals were calculated according to a method by Korn and Graubard [30, 31].
Survival analysis was used for time to treatment. Age-of-onset is reported in whole years so discrete time analyses were carried out with 1 year intervals. If a participant reported that their disorder had ended but did not report ever making treatment contact, they contributed only the time from onset to recency to the analysis, that is, the disorder's duration. The median onset age or the median time to treatment was obtained by recalibrating the treatment onset curve to be 100% at the largest observed duration [32].
Results
Probability of 12 month use of mental health services
In this survey, 4.9% (4.5, 5.4) of the population had ever been admitted overnight to a hospital or other facility to receive help for a mental health or substance use problem. Of people with any DSM-IV mental disorder in the past 12 months, 1.8% (1.3, 2.6) had been admitted within that period.
Use of services by people with a diagnosed disorder by sector
Table 1 presents 12 month mental health service use in separate sectors for people who met criteria within the 12 months before the interview for mood, anxiety, substance use and eating disorders. The visits reported are for any mental health problems or alcohol or drug problems, which makes them all mental health visits regardless of the sector in which they occurred. Of 12 month cases, 38.9% had at least one mental health visit to any provider, 16.4% had a mental health visit to a mental health specialist, 35.7% had a mental health visit within the health sector and 10.3% had a mental health visit to the non-healthcare sector.
Prevalence of 12 month mental health service use in separate service sectors by 12 month disorders
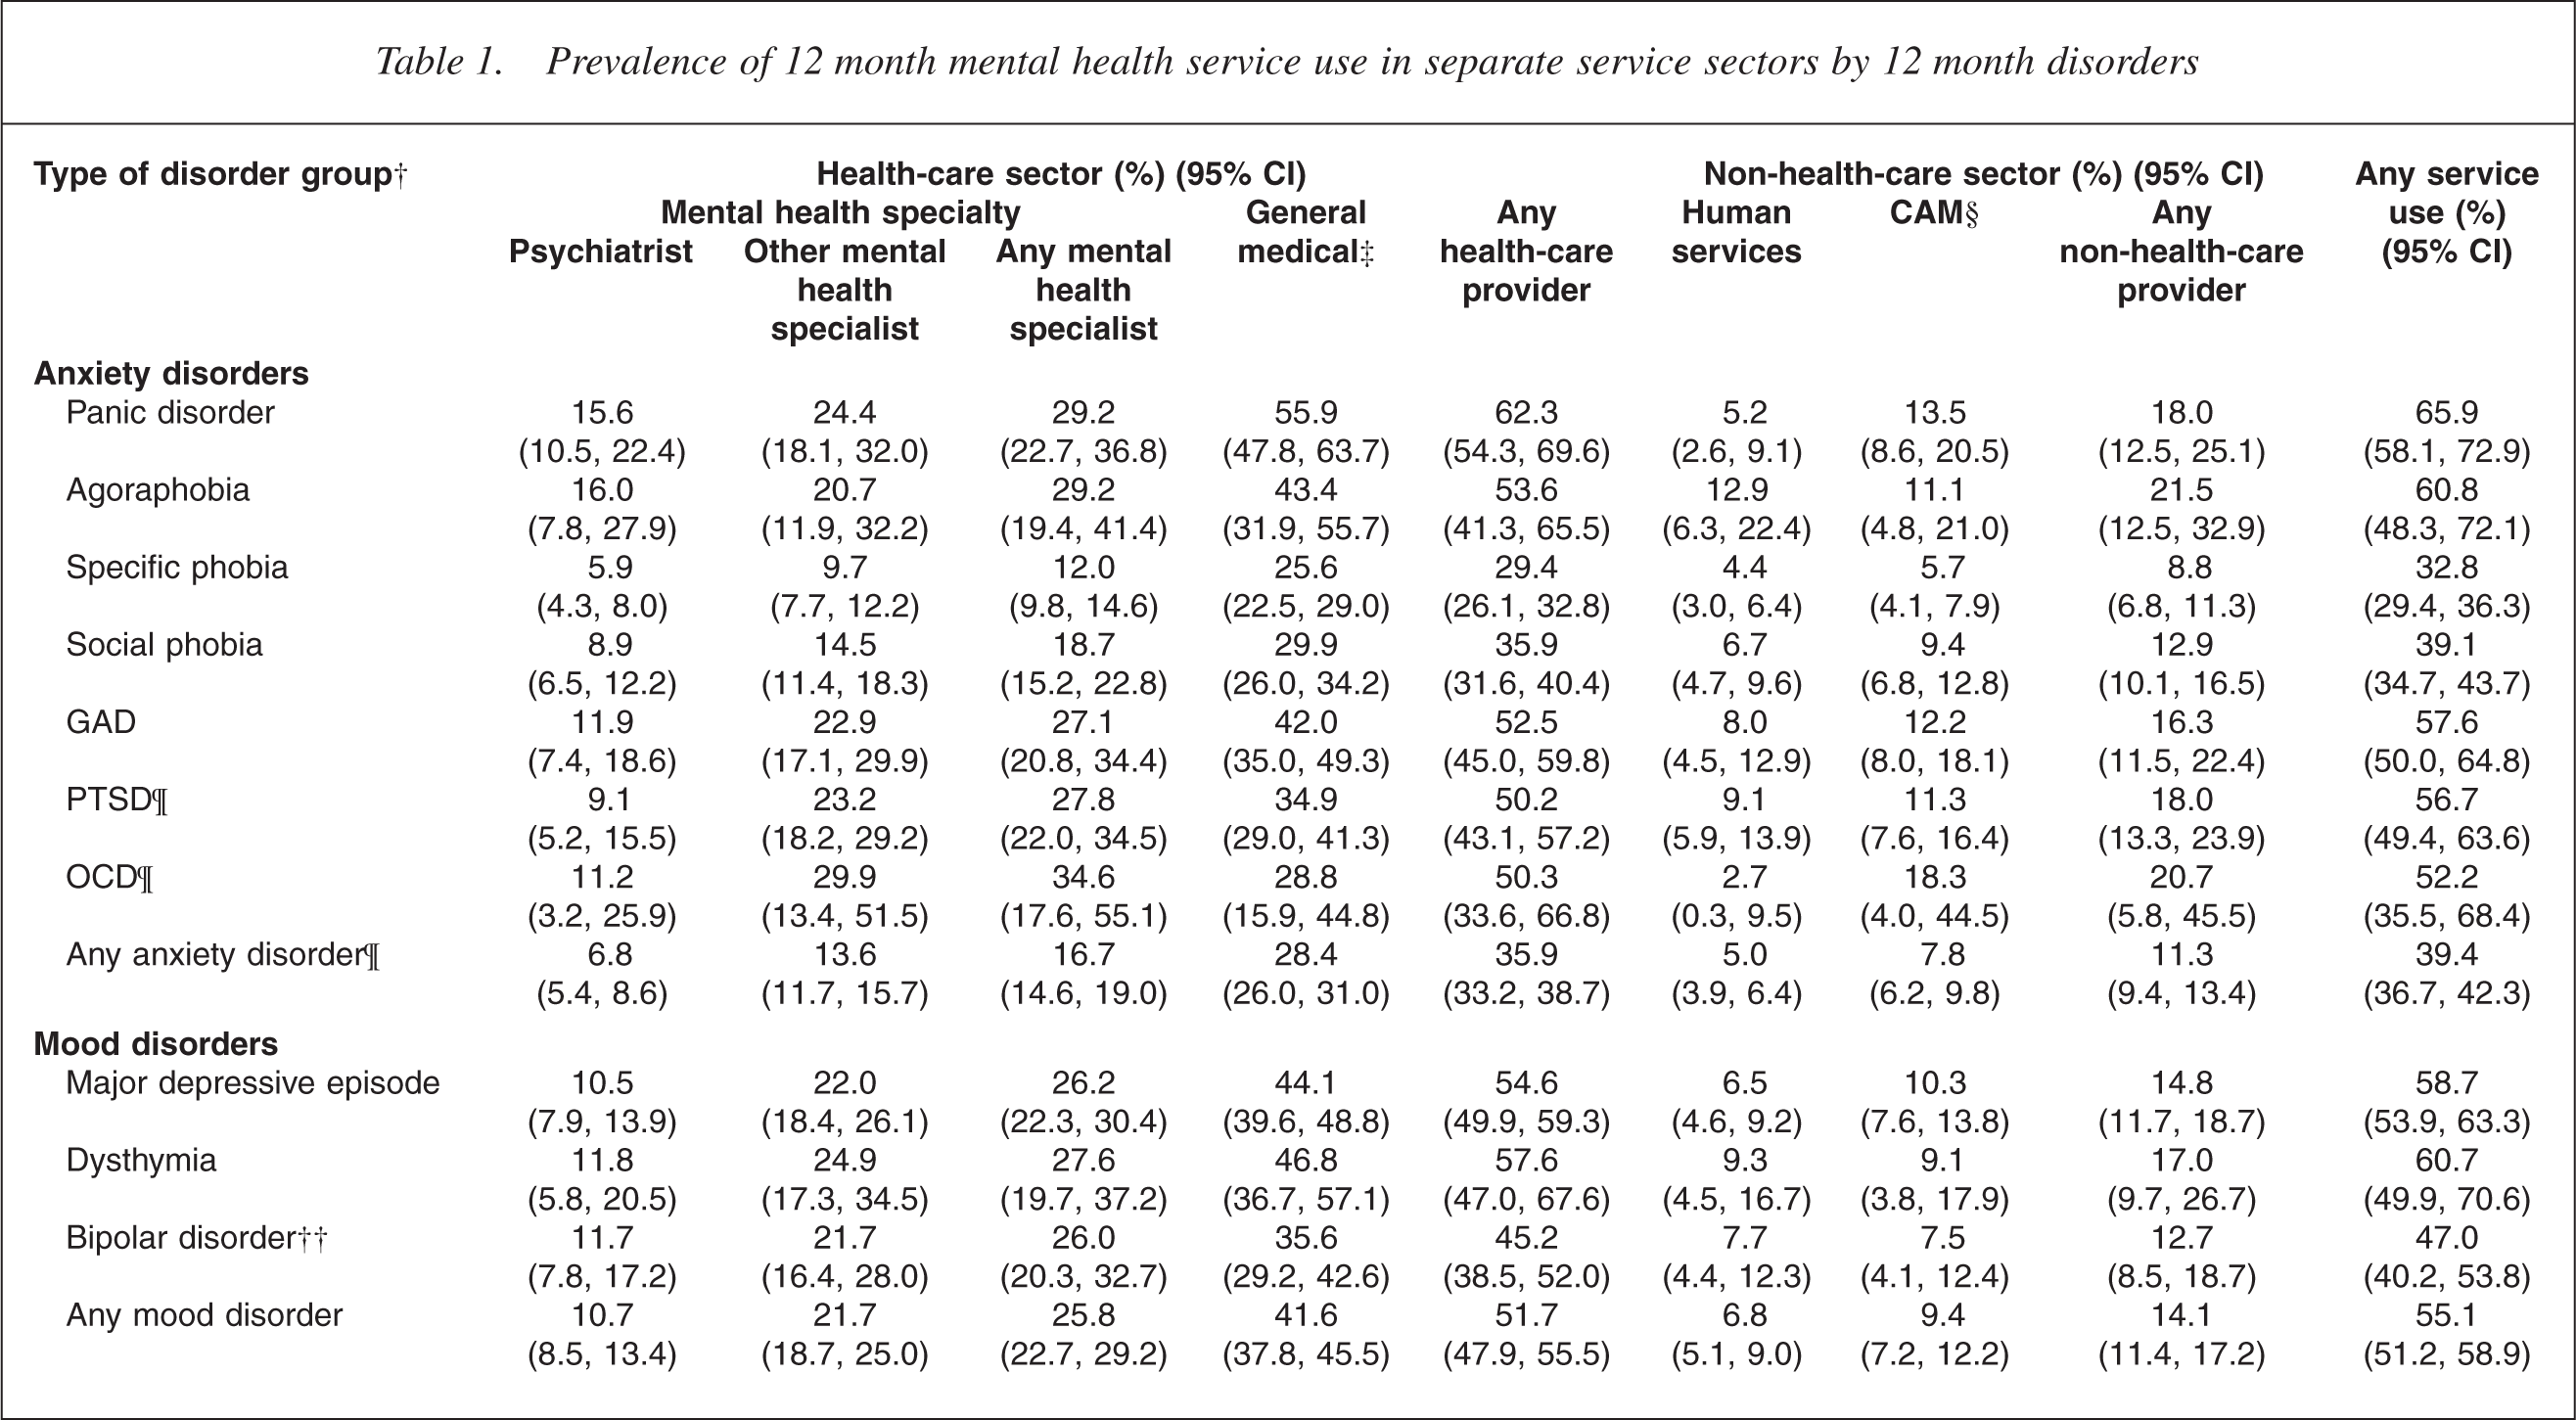
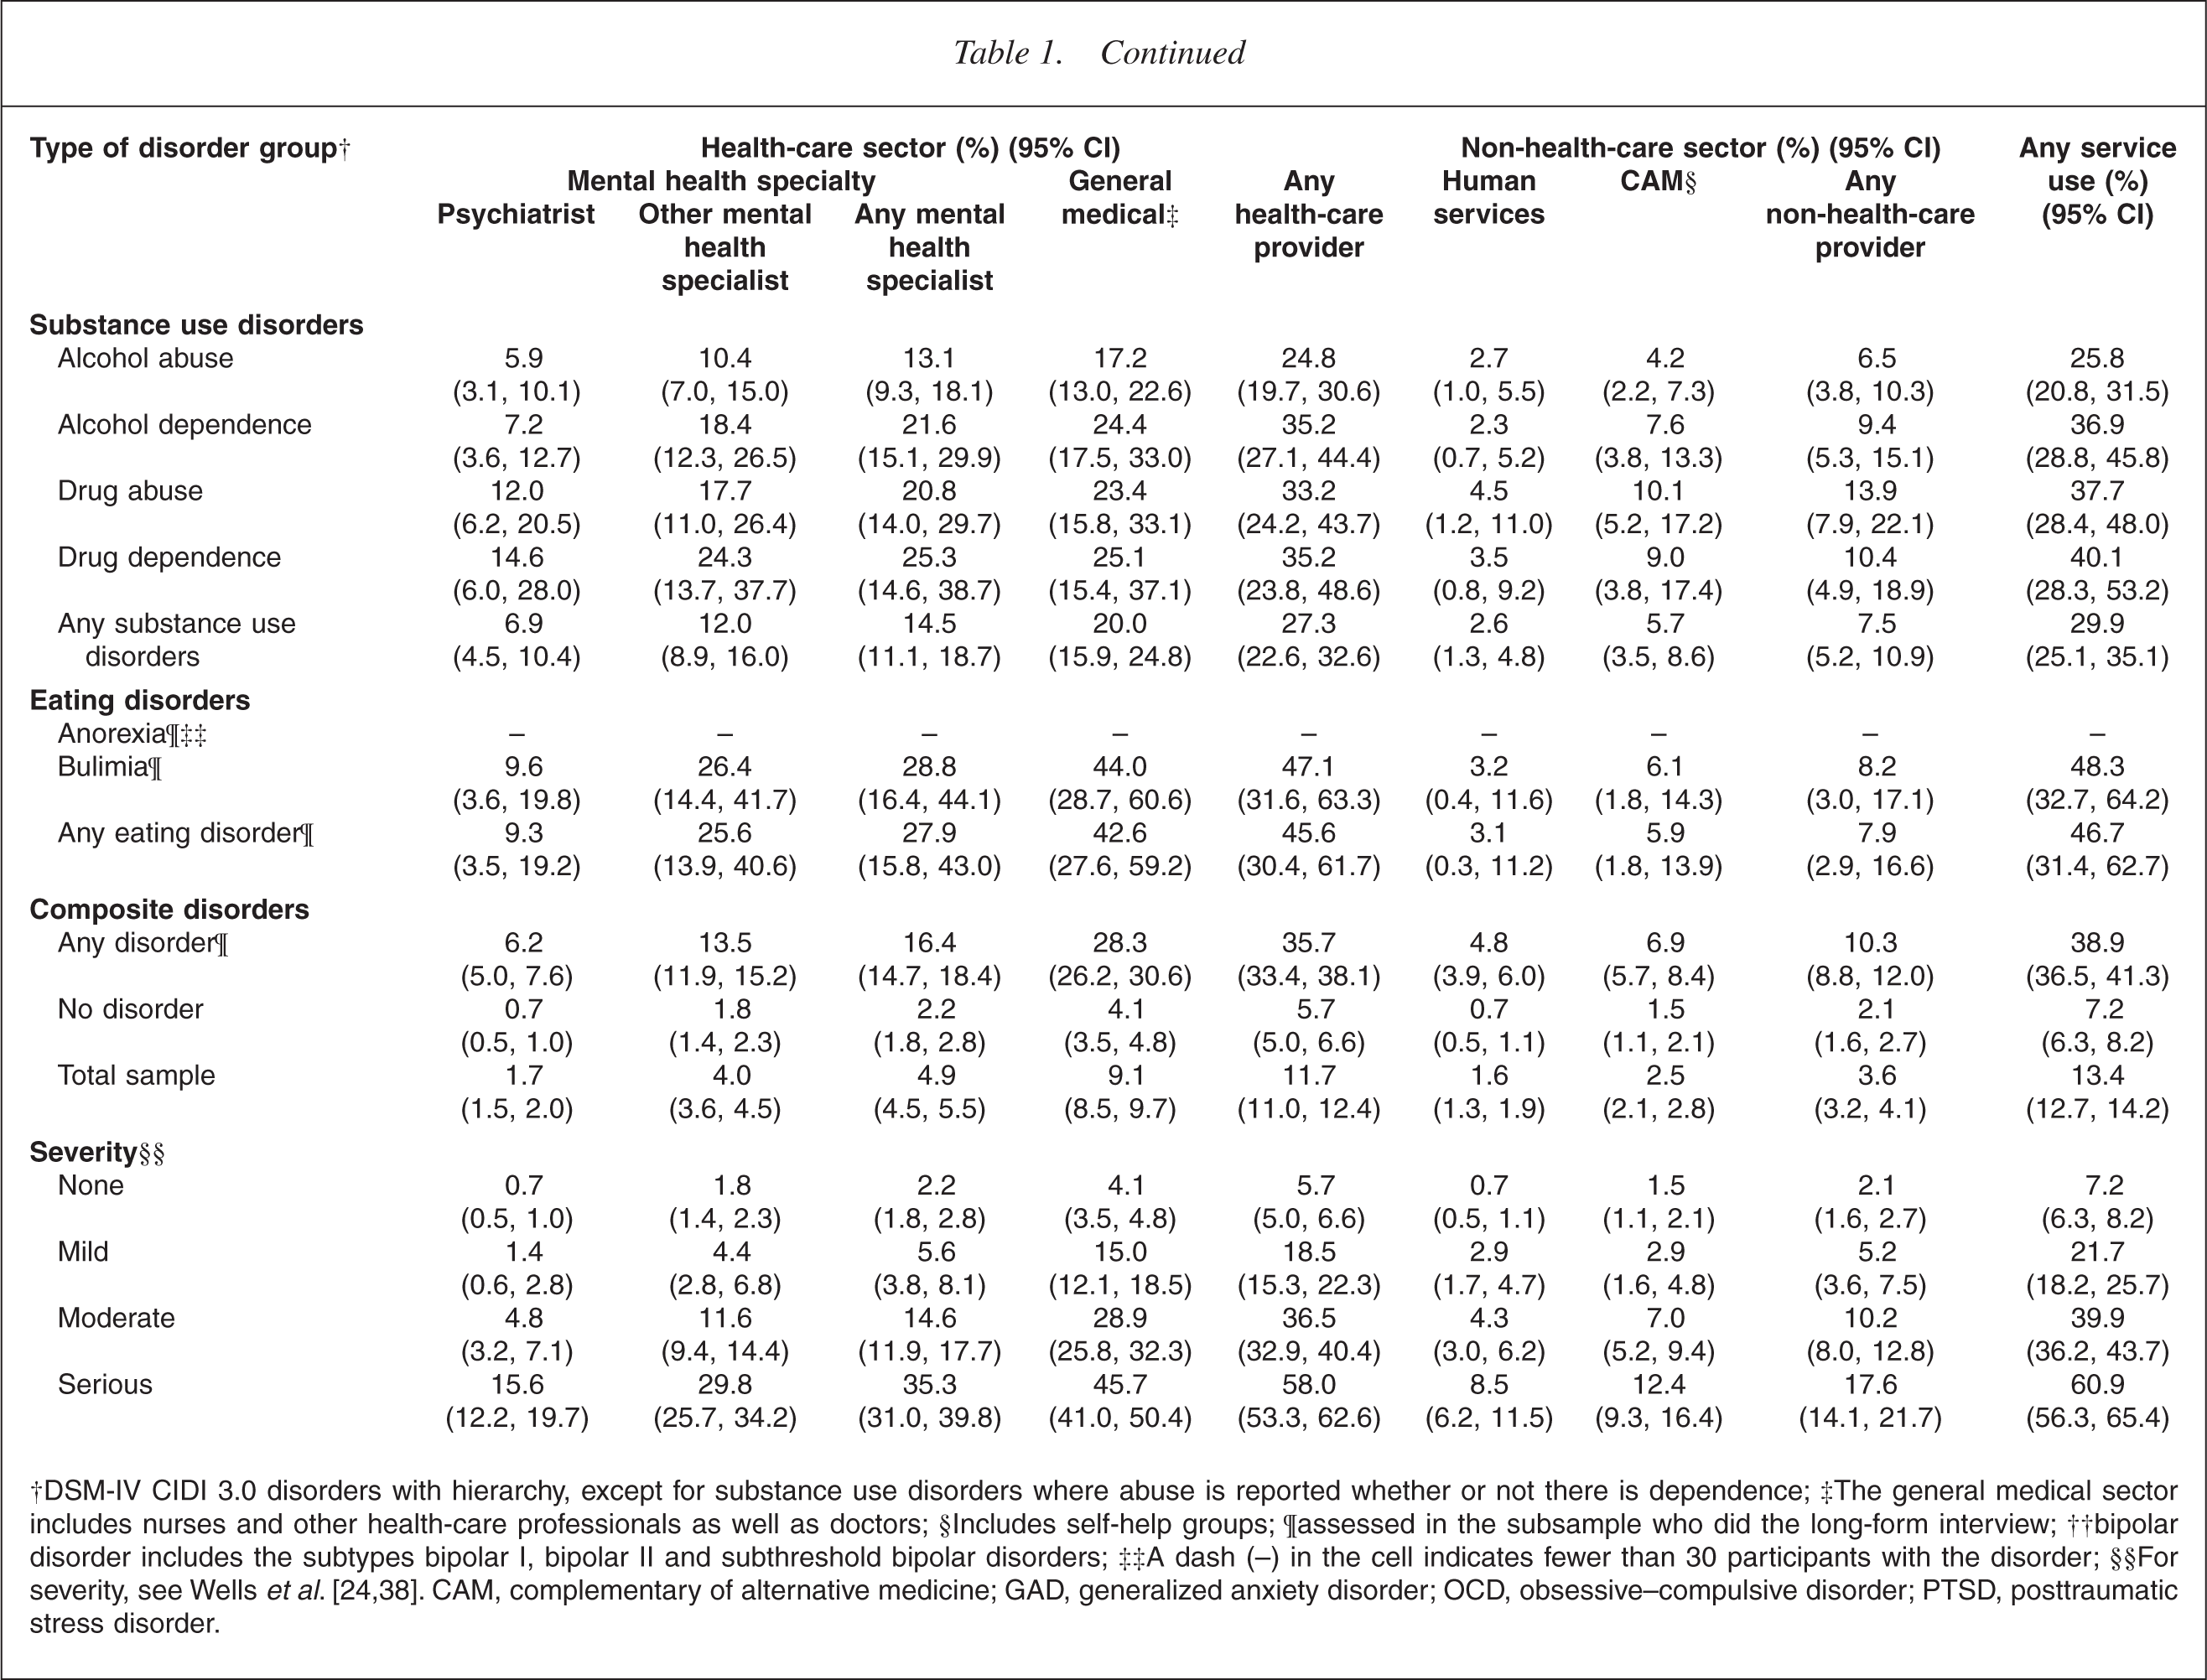
†DSM-IV CIDI 3.0 disorders with hierarchy, except for substance use disorders where abuse is reported whether or not there is dependence; ‡The general medical sector includes nurses and other health-care professionals as well as doctors; §Includes self-help groups; ¶assessed in the subsample who did the long-form interview; ††bipolar disorder includes the subtypes bipolar I, bipolar II and subthreshold bipolar disorders; ††A dash (–) in the cell indicates fewer than 30 participants with the disorder; §§For severity, see Wells
In the general medical sector it is important to note the majority of visits were with general practitioners. The structure of the questionnaire does not allow a distinction to be made between visits in the last 12 months to GPs and other doctors (other than a psychiatrist), although this distinction is possible for visits ever (i.e. lifetime visits). Therefore, it was not possible to determine what percentage of those visiting the general medical sector in the past 12 months had been seen in primary care. However, for the New Zealand health system (where the general practitioner acts as the gateway to other medical specialists) it can be reasonably assumed that most of these people did see a general practitioner. Of the population, 23.2% (21.8, 24.6) stated that they, at some time in their lives, had a mental health visit with a general practitioner. A very small percentage, 1.3% (1.1, 1.5) had ever visited both a general practitioner and another medical practitioner (other than a psychiatrist), and only 0.6% (0.4, 0.8) had ever visited only another medical practitioner. That is, of those in the population who had ever visited a medical practitioner other than a psychiatrist for a mental health problem, 92% visited only a general practitioner.
Use of services by people without a diagnosed disorder
Some people who did not have a diagnosed 12 month disorder had mental health visits within the 12 months before interview; 7.2% had any mental health visit. Although the percentages are small, the numbers with mental health visits within this no disorder group were moderately large, because 79.3% of the population were without diagnosed disorder. This group may include people with a history of mental disorder, but which is currently in remission, subthreshold cases, or people with disorders or behavioural problems that were not assessed in the interview.
Use of services by specific disorder
Panic disorder is associated with the highest rate of visits by participants:
across all service sectors, 65.9% reported a mental health visit within the 12 months before the interview. For major depressive disorder, 58.7% reported a mental health visit. For substance use disorders, the percentage with mental health visits was low (29.9%), although higher for drug disorders than for alcohol disorders. For eating disorders, 46.7% reported a mental health visit.
Use of services by severity
Table 1 shows the visits to the service sectors by severity of disorder. Participants with moderate and serious disorders accounted for the highest proportions of mental health visits across all service sectors. These differences in proportions of visit by severity are statistically significant for any disorder and for anxiety, mood, substance and eating disorders, for all sectors within health care (p ≤ 0.01 for all disorders, except eating disorders where p ≤ 0.05). The differences in proportions of visit by severity are also statistically significant for any disorder and each disorder group for the summary categories of any non-health-care provider (p ≤ 0.001 for all) and any service use (p ≤ 0.001 for all).
Distribution of participants in treatment sectors
Table 2 presents the distribution of participants by number of visits in the treatment sector, namely the percentage with only one visit, the percentage with two to four visits and so on. Another perspective is given by the proportion of all visits to the sector provided to participants in the various categories of individual level visits. In other words, of the total number of visits, what proportion was made by people who had only one visit or two to four visits, or any other category of number of visits.
Distribution of participants by numbers of visits in each service sector and proportions of all visits to each treatment sector provided to participants
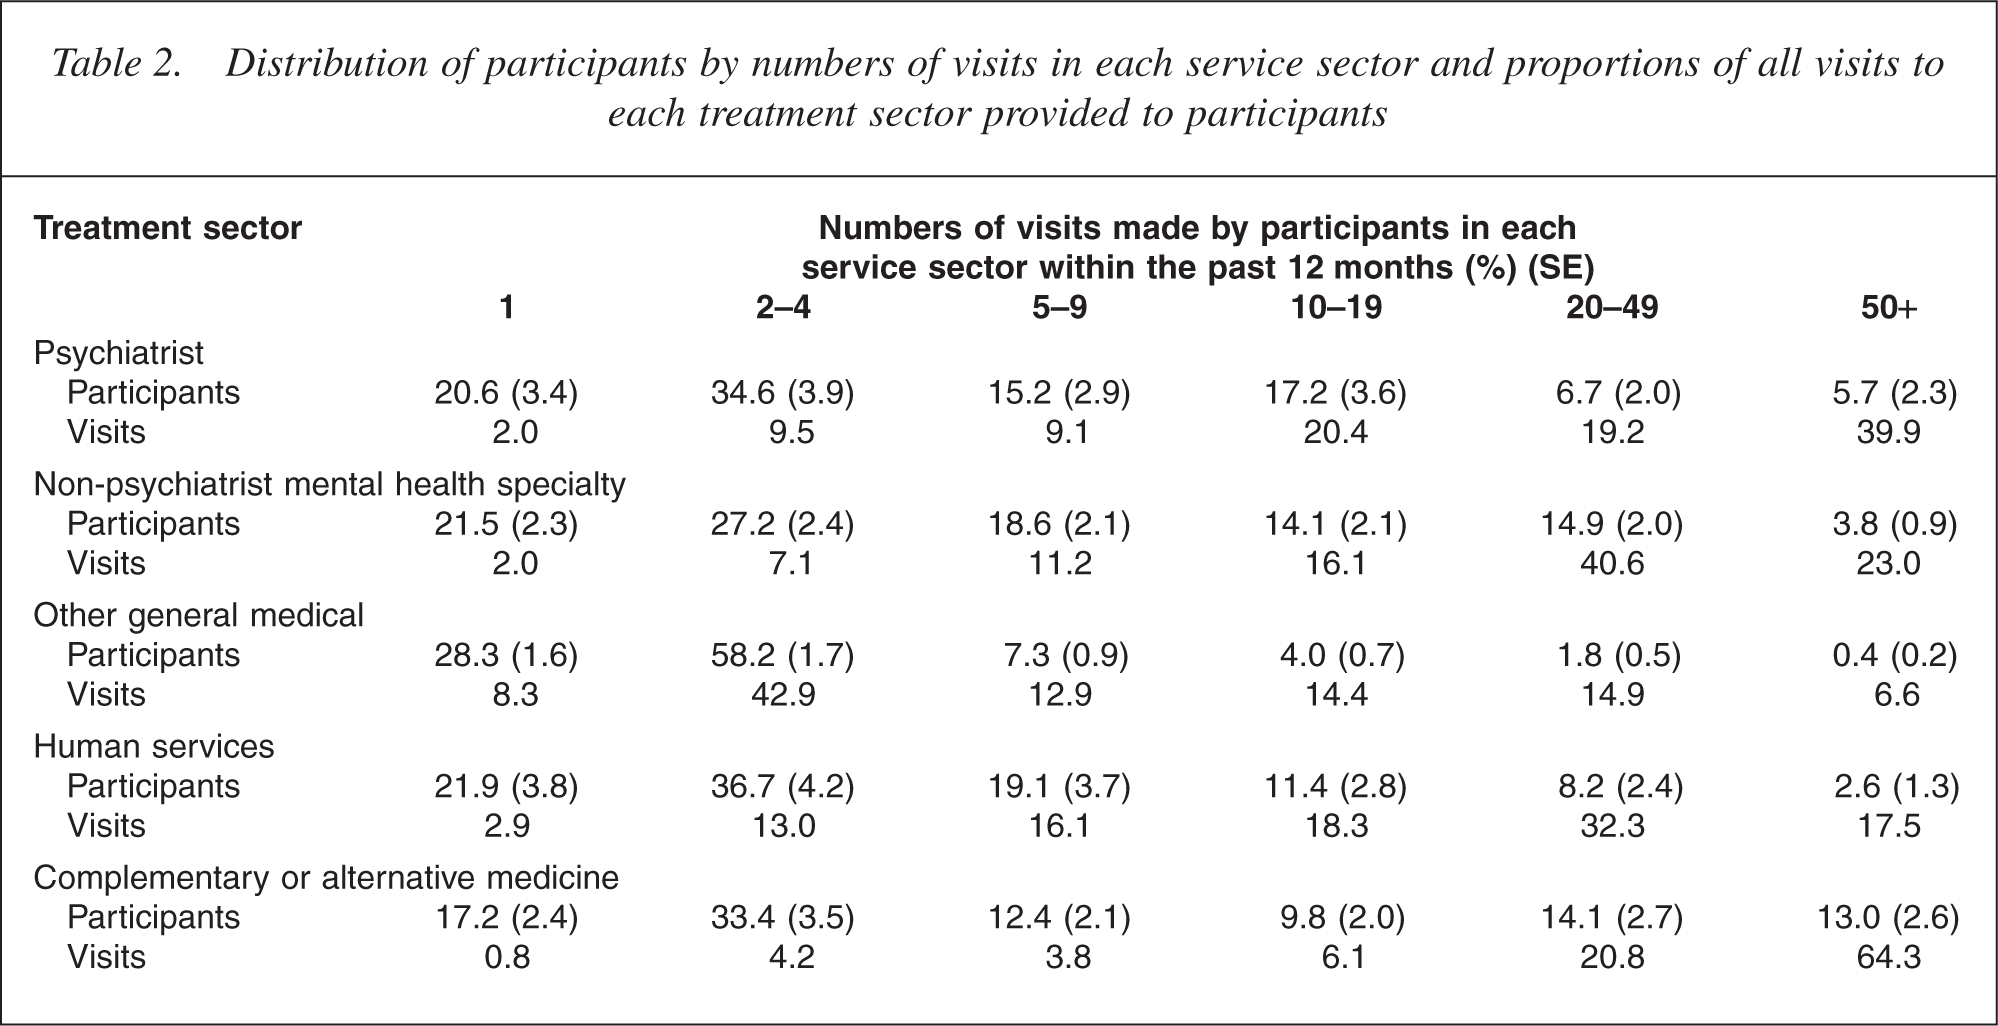
The majority of participants who had treatment in the past 12 months recalled 1–4 visits, regardless of the treatment sector. Moderate numbers of participants had 5–9 visits (15.2%) and 10–19 visits (17.2%). Small numbers of participants had 20–49 visits (6.7%) and 50 or more visits (5.7%). However, it is notable that the latter two groups accounted for large proportions of the total number of visits to psychiatrists: participants who attended for 20–49 visits accounted for 19.2% of total visits and participants who attended for 50 or more visits accounted for 39.9% of total visits. Similar patterns are seen for visits to other mental health specialists, and practitioners in the human services and CAM sectors: a small number of participants accounted for the largest proportion of visits.
Sociodemographic correlates of treatment contact
Table 3 presents the demographic correlates of 12 month service use by people with a disorder in the past 12 months. Table 3 presents the percentages of those participants who met criteria for a 12 month mental disorder who had:
visited a professional in the health-care or non-health-care sector (‘any visit’); had any visit and had visited a professional in the health-care sector (‘any health-care visit’); and had any health-care sector visit and had visited a mental health professional in the specialty mental health sector visit (‘any mental health specialty visit’).
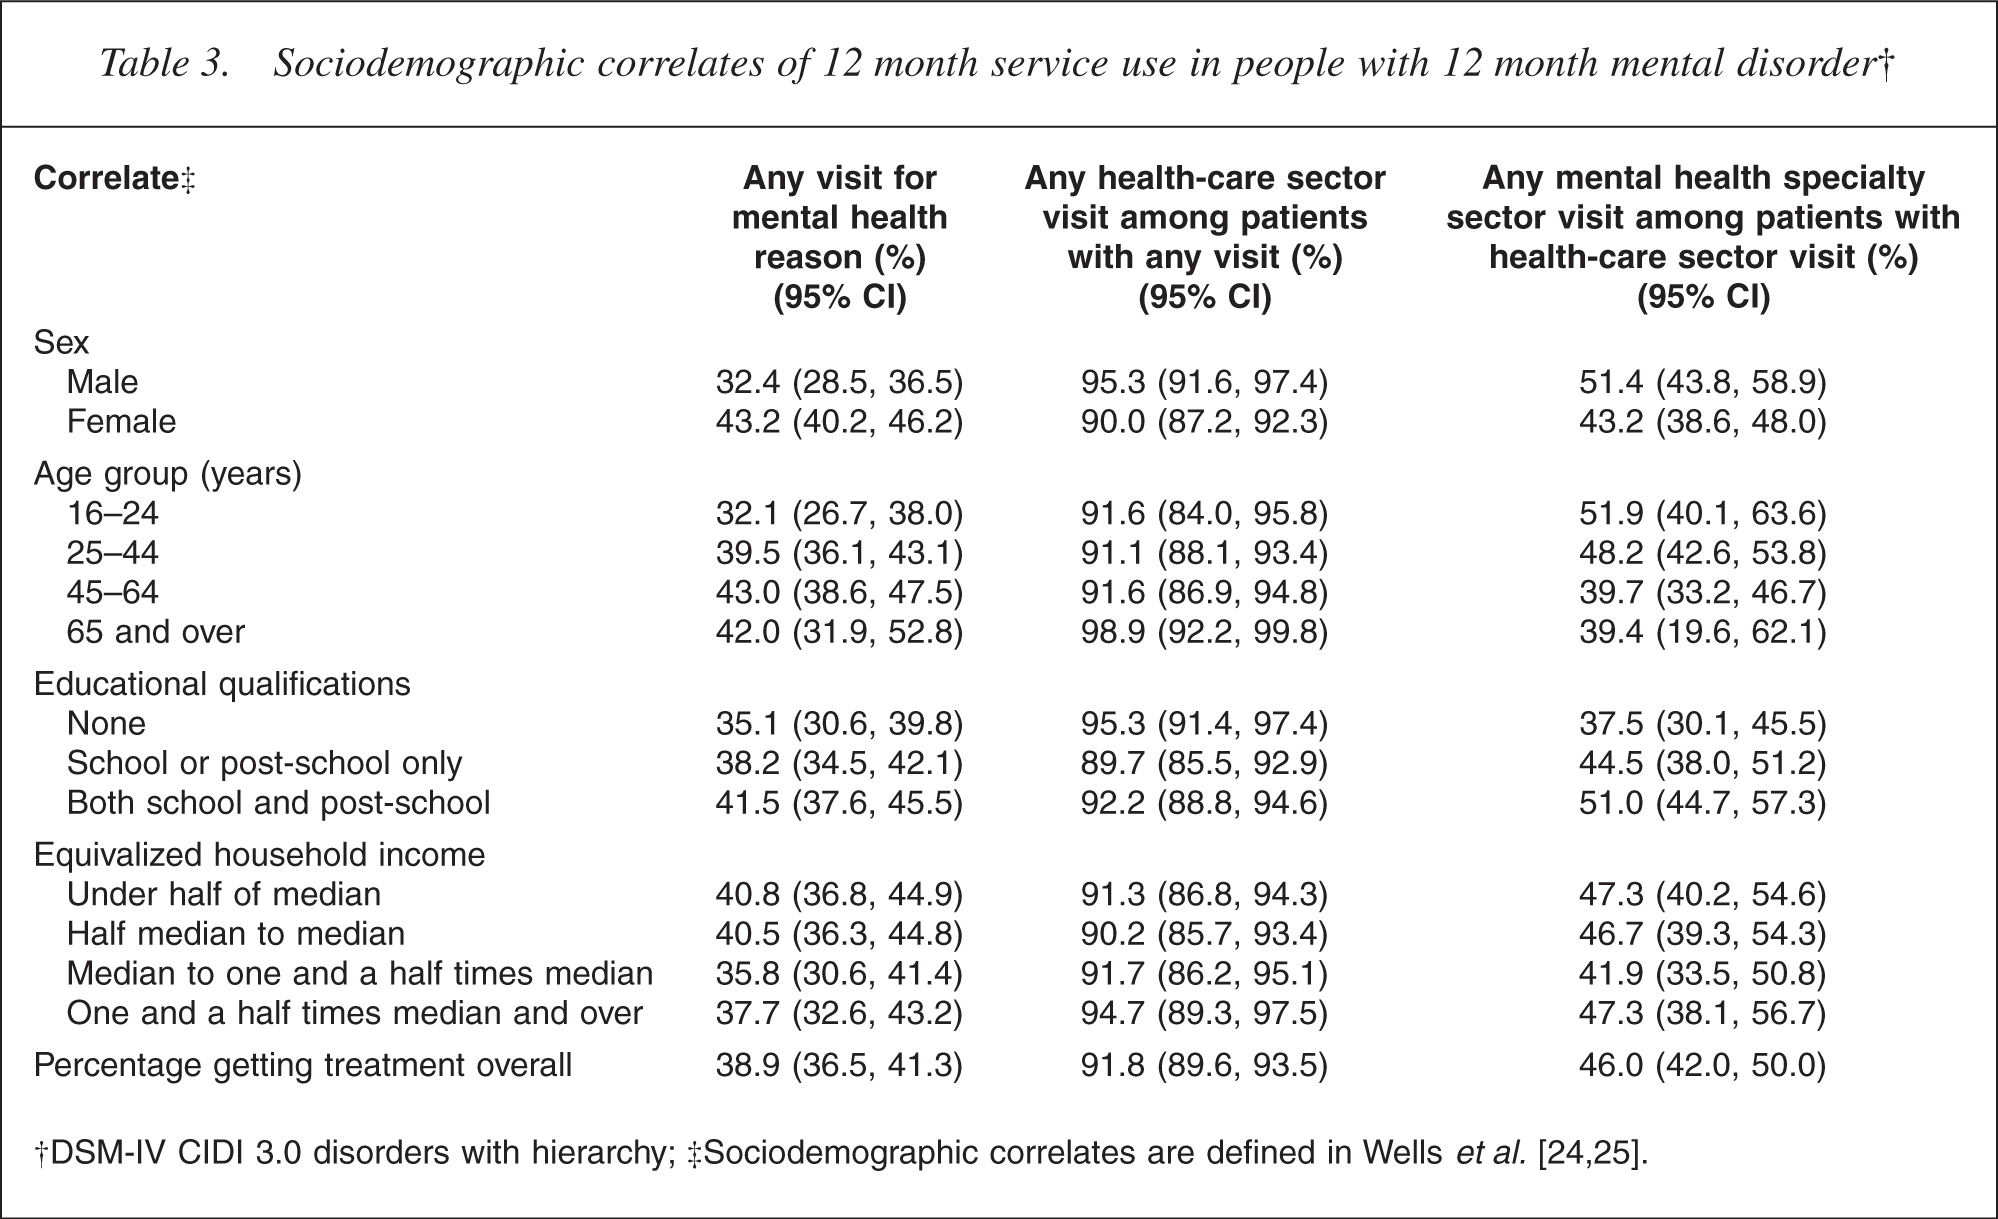
Table 1 presents the absolute percentages of participants who made a particular type of visit. Table 3 presents a series of conditional percentages. For example, for those with any 12 month disorder, 38.9% made a mental health visit to any sector in the past 12 months. Of these people with any visit, 91.8% had made a visit to the health-care sector. Of those who made a health-care visit, 46.0% had made a visit to the mental health speciality sector. It is evident the majority of people who made mental health visits contacted the health-care sector, not just the human services or CAM sector. Of those with a mental health visit in the health sector, a mental health practitioner saw just under half.
Table 3 shows that the youngest group was less likely than other age groups to have any visit for a mental health reason (p = 0.03). However, among those in this group who did have a mental health visit, there appears to be no difference compared with other age groups in the proportion who made a visit to the health-care sector. Nor were there age group differences in the proportion seen in the mental health speciality sector, among those seen in the health sector.
Males had lower percentages of any mental health visits than females (p λτ 0.0001). In those people who made a visit for a mental health reason and who made this visit within the health-care sector, males had higher rates of health-care sector visits than females (p = 0.007). Among those people who made a health sector visit for a mental health reason and who made the visit to the mental health specialty sector, the percentage of males with a mental health specialty visit was marginally higher than for females, but the difference was not significantly different (p = 0.08). This suggests females make greater use of the non-health-care sector for mental health visits than males.
Compared with participants with higher educational qualifications, participants with lower educational qualifications had lower percentages of:
any visit for a mental health reason; any health-care sector visits among those with any visit for a mental health reason; and any mental health specialty sector visits among those with healthcare sector visit.
However, this is significant only for any mental health specialty visit (p = 0.03).
No clear pattern of differences in percentages of visits by equivalized household income existed.
Cumulative lifetime probabilities of treatment contact
Survival curves were used to estimate the percentage of cases that would eventually make treatment contact for each disorder assessed. These cumulative lifetime probabilities of treatment contact are presented in Table 4, which shows:
the percentage with a lifetime diagnosis of specific disorder who made treatment contact at the age of onset of that disorder (that is, the reported age of onset equalled the reported age of first treatment contact); the percentage with a lifetime diagnosis of specific disorder who will ever make treatment contact; and the median duration of delay to first treatment contact, reported in years.
Of the anxiety disorders, panic disorder is associated with the highest percentage making treatment contact at the age of onset (33.2%) and the shortest median duration of delay (3 years) until treatment contact. Of the mood disorders, for major depressive episode 45.0% made treatment contact in the year of onset and 97.0% ever made treatment contact. The median duration of delay to treatment is 1 year, which is the shortest for all the disorders. This finding contrasts with that for bipolar disorder where the median duration of delay is 13 years. This difference between the two mood disorders may be a consequence of how time to first treatment contact is defined for bipolar disorder, for which it is based on episodes of hypomania or mania, not episodes of depression. The lower rates of contact within the year of age of onset and ever for bipolar disorder, compared with major depression, may also in part be a consequence of the broad definition of bipolar disorder, which includes subthreshold bipolar disorder, a milder and perhaps less disabling subtype of bipolar disorder. For substance use disorders, the percentages making contact at the age of onset were low. The majority of people with these disorders eventually made treatment contact, with the median duration of delay varying from 3 years for drug dependence to 16 years for alcohol abuse. For bulimia, 26.8% of cases made treatment contact in the year of onset and 98.7% eventually made treatment contact, with a median duration of delay to first treatment contact of 10 years. The estimates for anorexia must be regarded cautiously, as they are based on a very small number of cases.
Percentage who made treatment contact and median duration of delay among cases of mental disorder† who would ever make treatment contact
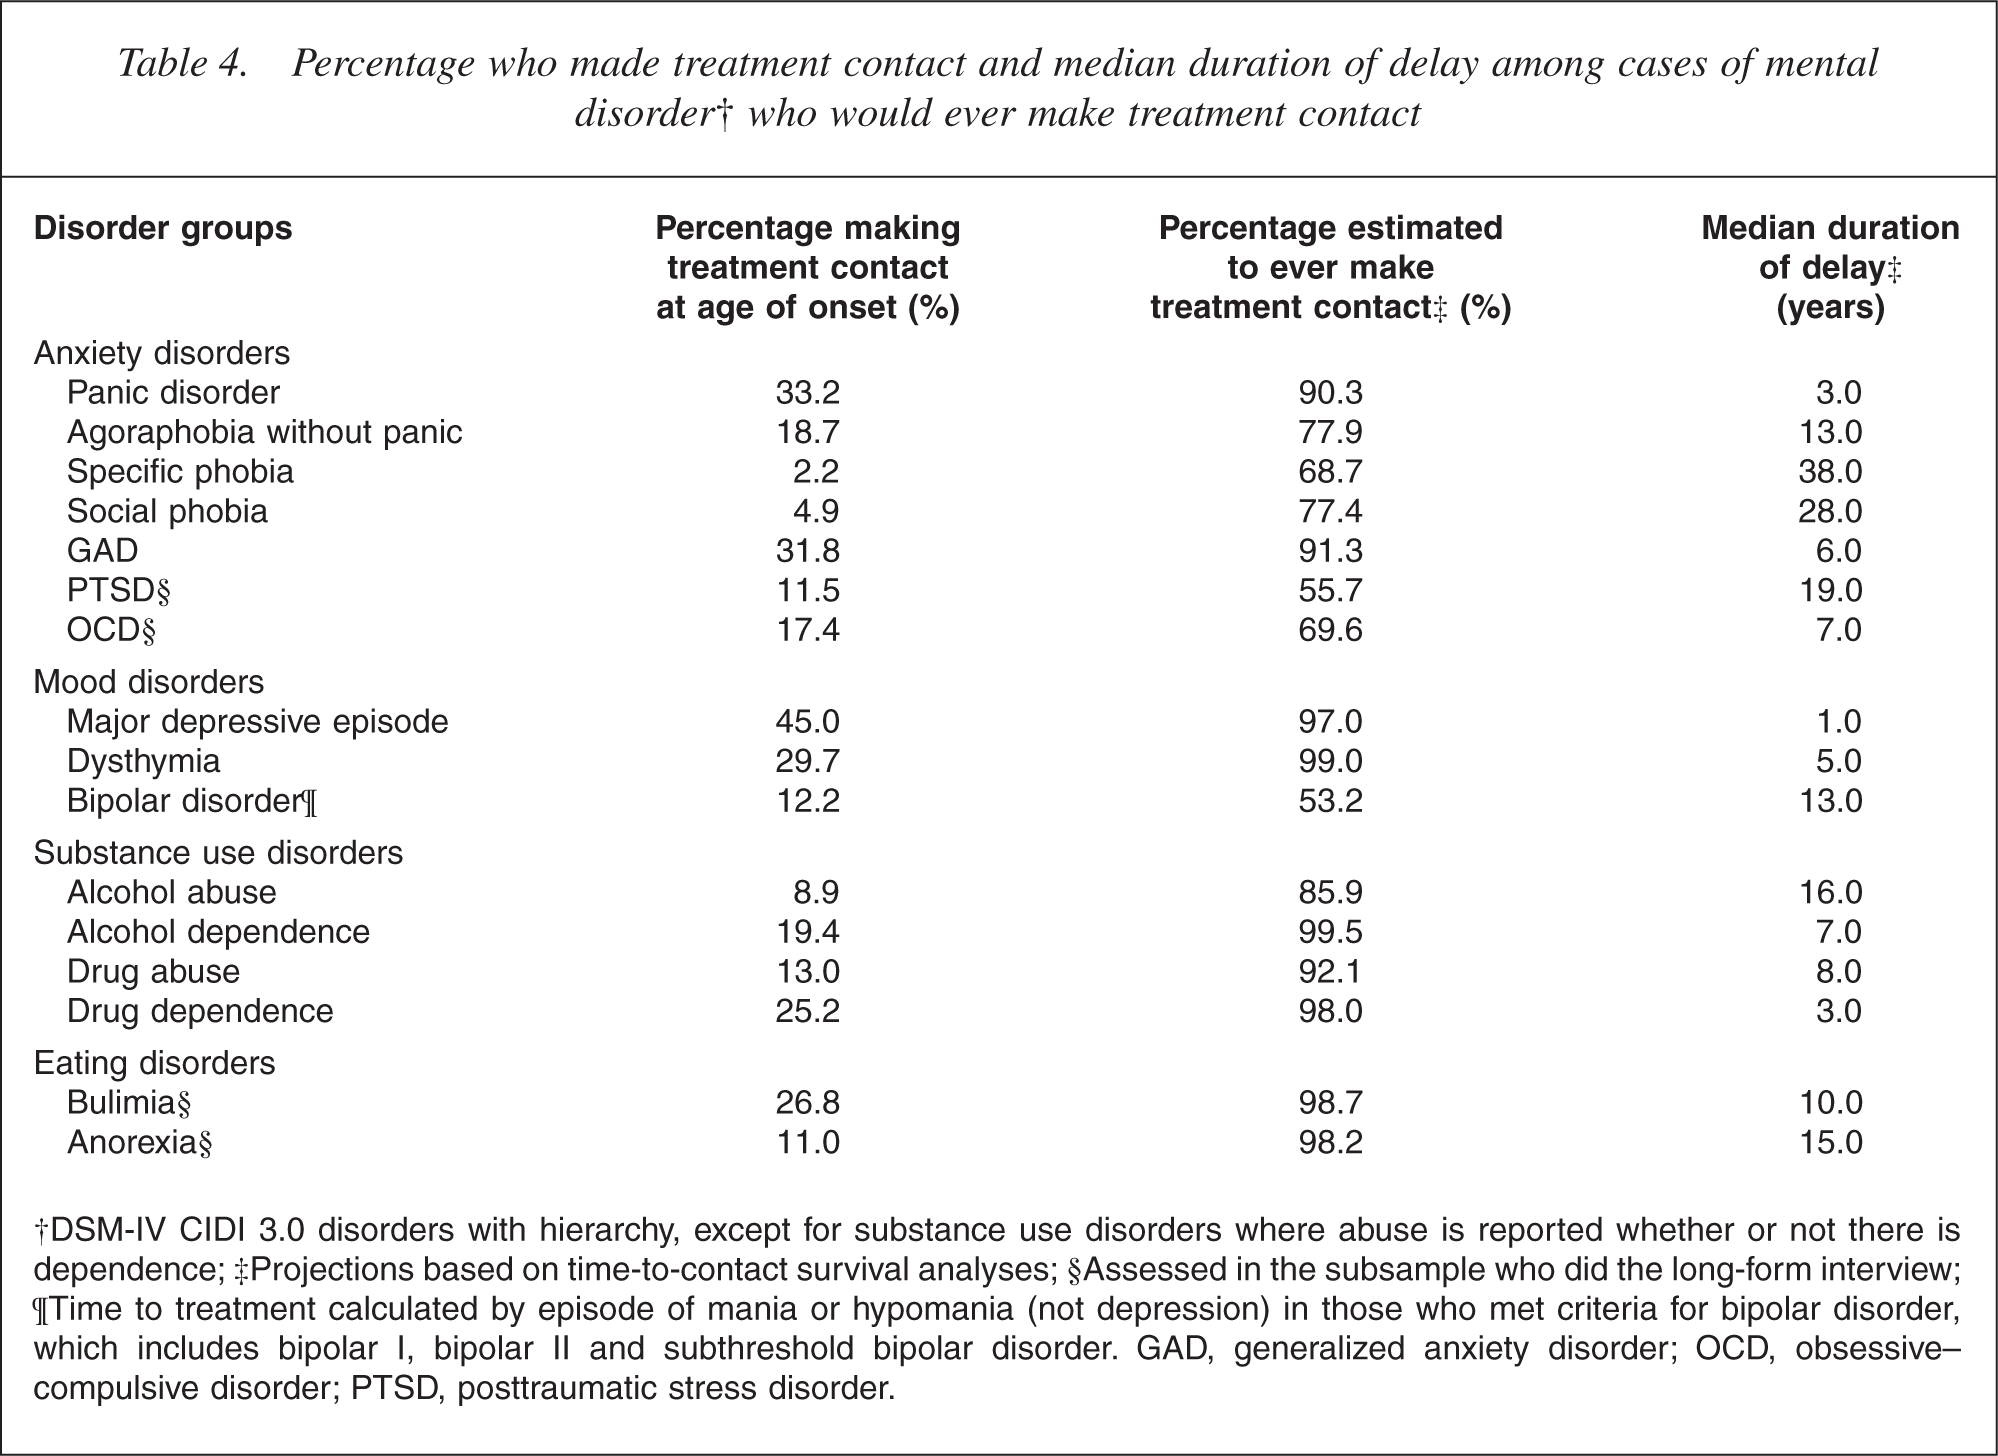
†DSM-IV CIDI 3.0 disorders with hierarchy, except for substance use disorders where abuse is reported whether or not there is dependence; ‡Projections based on time-to-contact survival analyses; §Assessed in the subsample who did the long-form interview; ¶Time to treatment calculated by episode of mania or hypomania (not depression) in those who met criteria for bipolar disorder, which includes bipolar I, bipolar II and subthreshold bipolar disorder. GAD, generalized anxiety disorder; OCD, obsessive– compulsive disorder; PTSD, posttraumatic stress disorder.
Discussion
This survey shows that not quite 40% of people with a mental disorder in the past 12 months made a mental health visit within that period. However, the majority of lifetime cases do eventually make treatment contact, if their disorder continues, although the median duration of delay can be long and varies greatly, depending on the disorder.
The patterns of these findings are broadly consistent with previous New Zealand community studies and overseas studies. The Christchurch Psychiatric Epidemiology Study showed that of the participants with mental disorder during the past 6 months, only 29% had visited a health service or professional for a mental health consultation, although 75% had sought health care, over that period. Mental health consultations were more commonly reported with general practitioners than mental health specialists, who saw only 7.0% of those with recent disorder [6]. The findings from the Christchurch Psychiatric Epidemiology Study were similar to those in the multicentre US Epidemiologic Catchment Area Study, where only 19% of participants with an active disorder had an inpatient treatment in the past 12 months or an outpatient consultation in the past 6 months [11, 33].
More recent overseas studies have shown similar patterns to the above studies and provided more detailed information about the unmet need for mental health services. The US National Comorbidity Survey (NCS) found that only 25% of participants with a 12 month mental disorder received outpatient treatment in the 12 months before interview [13]. In the Australian National Mental Health Survey only 35% of people with a mental disorder in the 12 months before the survey had consulted someone for a mental problem during that year; most had seen a general practitioner [9].
When comparisons are made with developed countries in the WMH Survey Initiative [34], it is evident that, within New Zealand, the proportion with a mental health visit is very similar, with severity groupings. In New Zealand, 58.0% of participants with any serious disorder had a mental health visit to the health-care sector in the past 12 months. This compares with 52.3% in the US, 53.9% in Belgium, 63.3% in France, 49.7% in Germany, 50.2% in the Netherlands and 64.5% in Spain. Comparisons between New Zealand and other WMH Survey Initiative countries for moderate and mild disorders show broadly similar rates.
As the diagnoses at interview vary among the different WMH Survey Initiative sites, it is best to compare the proportions of visits across sectors for the total sample. It should also be remembered that the New Zealand sample included people aged 16 years and over, whereas the European Study of the Epidemiology of Mental Disorders (ESEMeD) [35] and US NCS-R [36] included people aged 18 years and over. The ESEMeD proportion of visits for the total sample was 6.4%, which is lower than New Zealand's 11.7%. Proportions of visits were generally lower in New Zealand than in the US (NCS-Replication). For the total sample, in New Zealand 13.4% had a mental health visit in the past 12 months compared with 17.9% in the NCS-R. Proportions of visits were lower in New Zealand than in the US for the mental health specialty sector (US, 8.8%; NZ, 4.9%), general medical providers (US, 9.3%; NZ, 9.1%), any health-care providers (US, 15.3%; NZ, 11.7%) and non-health-care sector (US, 5.5%; NZ, 3.6%).
New Zealand data on the percentage ever making treatment contact and duration of delays to treatment contact can also be compared with US (NCS-R) data [37]. For panic disorder, 90.3% (NZ) and 95.3% (US) eventually make treatment contact. For major depressive episode, 97.0% (NZ) and 88.1% (US) eventually make treatment contact. These findings are broadly similar. However, differences exist between the two countries for the percentages ever making treatment contact for substance use disorders: alcohol abuse, 85.9% (NZ) and 52.7% (US); alcohol dependence, 98.0% (NZ) and 69.8% (US); drug abuse, 92.1% (NZ) and 57.0% (US); and drug dependence, 98.0% (NZ) and 76.9% (US).
Although differences exist between the US and New Zealand in the percentages ever making treatment contact, the percentages for people making contact within the 12 months of age of onset are very similar: panic disorder, 33.2% (NZ), 33.6% (US); major depressive disorder, 45.0% (NZ) and 37.4% (US); alcohol abuse, 8.9% (NZ) and 12.4% (US); alcohol dependence, 19.4% (NZ) and 20.7% (US); drug abuse, 13.0% (NZ) and 12.5% (US); and drug dependence, 25.2% (NZ) and 26.5% (US).
These findings suggest a significant unmet need for treatment for people with mental disorder in the New Zealand community as in comparable countries. Other similarities and differences in aspects of service use between countries will be described in future papers on 12 month service use to be published by the WMH Survey Initiative.
Footnotes
Acknowledgements
Te Rau Hinengaro: The New Zealand Mental Health Survey was funded by the Ministry of Health, Alcohol Advisory Council and Health Research Council of New Zealand. The survey was carried out in conjunction with the World Health Organization World Mental Health Survey Initiative. We thank the WMH staff for assistance with instrumentation, fieldwork and data analysis. These activities were supported by the US National Institute of Mental Health (R01MH070884), the John D and Catherine T MacArthur Foundation, the Pfizer Foundation, the US Public Health Service (R13-MH066849, R01- MH069864, and R01 DA016558), the Fogarty International Center (FIRCA R01-TW006481), the Pan American Health Organization, Eli Lilly and Company, Ortho-McNeil Pharmaceutical, Inc., GlaxoSmithKline, and Bristol-Myers Squibb. WMH publications are listed at ![]() .
.
Other members of the NZMHS Research Team are J Baxter, TK Kingi, K Scott, R Tapsell, S Foliaki, D Schaaf, MH Durie, C Tukuitonga and C Gale.
We thank the Kaitiaki Group and Pacific Advisory Group for their input and support for this survey and we thank all the participants.