
Abstract
There is growing attention in epidemiological research to social or contextual factors that may be associated with psychiatric disorders but are independent of individuallevel risk factors [1, 2]. The neighbourhood or community in which people live may influence mental health through differences in: the availability and accessibility of health services; infrastructure (recreational facilities, transport, commercial facilities); employment opportunities; community socioeconomic status; norms of behaviour and attitudes (e.g. health behaviours such as smoking or violence); exposure to stressors and social disorder; social capital (availability of social support, community connectedness); and physical characteristics (design and planning of the built environment, pollution) [1,3–5]. Increasingly, governments are using community-level interventions to increase community capacity and promote social and health outcomes for individuals [6, 7]. In part, the growing focus on social context in mental health research also reflects the availability of computer software to support appropriate statistical analysis of multilevel data [2, 8, 9].
There is evidence for geographical variation in the prevalence of severe or psychotic disorders [10, 11]. However, a considerable number of international studies have failed to demonstrate substantial area-level variation in the prevalence and distribution of common mental disorders (anxiety and depression) or in measures of psychological distress [3, 9,12–14]. Further, differences at the area level in the prevalence of common mental disorders are largely explained by models that incorporate individual-level risk factors [3, 12]. Rather than being a consequence of specific contextual influences, such results suggest that apparent area effects may reflect the clustering of similarly at-risk individuals [4, 12].
In a recent editorial, Weigh [15] suggested several possible reasons for the failure to find area effects in mental health. These included limitations in the definition of area used, with most studies using administrative boundaries such as wards or postcodes. It may be critical to consider ecologically meaningful contexts [1]. The areas that have been studied have also been large, generally representing 1000s of residents, and thus area composition may be too heterogeneous.
While there is little evidence of area differences in the prevalence of common mental disorders, research has demonstrated substantial variation in mental health at the household level [9, 14, 16]. However, only a small number of studies have considered the household level. These household differences could reflect the influence of shared household-level exposures (exogenous stressors, health behaviours, nutrition), the influence of intra-household processes and interactions, the genetic similarity within families, and/or assortative mating or other explanations for spousal similarity [14, 16, 17]. Importantly, significant household-level variance does provide evidence of contextual effects in the prevalence of common mental disorders. It is possible that area effects may be evident if smaller, ecologically meaningful contextual units are studied (closer in scale to households than postcodes).
Although Australian research has examined differences associated with particular area-level characteristics or risk factors, such as the urban–rural divide (see Judd et al. for review [18]), to date there has been no attempt to quantify contextual geographical effects on the distribution of common mental disorders or psychological distress using local data. The lack of geographical effects may not be universal and needs to be confirmed in data from a number of countries. One aim of this paper is to explore geographical variability in mental health using a large-scale Australian dataset and multilevel statistical techniques. Our analysis considers areas that are smaller than many previous studies (i.e. Census Collection Districts [CCDs] which represent approximately 220 households [19]). It may be that these smaller areas represent a more consistent and homogeneous context and are associated with stronger area-level effects. We will also assess the variance in mental health scores at the household level, and consider risk factors at the individual, household and area levels.
Method
Data are from the first wave of the Household, Income and Labour Dynamics in Australia (HILDA) Survey [20]. The survey utilized a multistage sampling approach (sampling households within dwellings within CCDs). The survey interviewed all household members aged 18 years and over. Fieldwork was conducted between August 2001 and January 2002.
There were 7682 responding households (response rate of 66%). Within households, there were 15 127 eligible adults: 13 969 (92%) completed a personal interview and 94% of these (13 159) returned a self-completion questionnaire. The mental health outcome measures were assessed in the self-completion questionnaire. Missing data were managed on an analysis-by-analysis basis.
The outcome measures were drawn from the Short-Form (SF)-36 (see [3] for another example of multilevel analysis using the SF-36). The SF-36 is one of the most widely used self-completion measures of health status, measuring functional health and wellbeing [21]. It comprises 36 items that measure eight important health concepts or scales (physical functioning, role-physical, bodily pain, general health, vitality, social functioning, role-emotional and mental health). The mental health scale assesses symptoms of depression and anxiety (nervousness and depressed affect) and positive aspects of mental health (feeling calm and happy). It has reasonable validity and is an effective screening instrument [21–23]. Factor analysis of the eight scales from the SF-36 yields two summary scales, the Mental Component Summary (MCS) score and the Physical Component Summary relating to physical and mental wellbeing, respectively. The MCS score is most heavily weighted on the mental health, role-emotional and social functioning scales [24]. Whereas the mental health scale assesses symptoms and affect in the past 4 weeks, the MCS scale provides a more expansive measure of the impact of mental health on functional status and daily activities. Higher scores on the scales represent better mental health.
Covariates that have been demonstrated in previous research to be associated with mental health were considered at the individual, household and area levels [3, 12, 13]. Individual-level covariates included age; gender; partnered status (married/de facto vs other); physical functioning (the physical functioning subscale from the SF-36); labour force status (employed, unemployed and not in the labour force); educational qualifications (higher degree, diploma/certificate, completed secondary school, not completed secondary school); and financial hardship in the past 12 months (number of forms of hardship reported from a list comprising: not paying utilities on time; not paying mortgage or rent on time; pawned something; went without meals; unable to heat home; asked for financial help from friends or family; and asked for help from welfare organizations). Variables representing household-level characteristics included: equivalized household income (disposable annual household income adjusted to reflect household size and composition); and housing tenure (renting vs other). At the area level, we utilized two measures. The composite index of relative social disadvantage developed by the Australian Bureau of Statistics [19] represents (in deciles) the socioeconomic circumstances of areas. The Australian Bureau of Statistics Remoteness Structure [19] represents the remoteness of CCDs, indicating distance to services. The areas included in the HILDA Survey comprise four locational categories: major city, inner regional, outer regional and remote.
Analyses
We conducted multilevel analyses to model the hierarchical nature of the data (individuals within households within areas). Multilevel models enable estimation of the variance that occurs at these different levels. The variance components or null model includes no predictors, but partitions the variance in mental health scores into components corresponding to each level of the model. Thus, unlike traditional regression models where a single random variable represents total residual variance for each respondent, in our multilevel model there are three random effects representing the variability between areas, between households and between individuals. The percentage of total unexplained or residual variance present at the higher levels of the model represents the degree of correlation between individuals within the same household or area.
Covariates, when included, were treated as fixed effects. We initially report the results of a series of univariate fixed effect models to demonstrate the relationship between each of the covariates and the measures of mental health. We then report the multilevel results, presenting the variance component or null model. Subsequent models incrementally include the individual-level, household-level and area-level covariates and assess the improvement in model fit (the extent to which previously unexplained variance is reduced by the inclusion of predictors), and the effect of the inclusion of predictors on the unexplained variance at the different levels of the model (e.g. Does inclusion of a measure of household income explain variance at the individual, household or area levels?). Our analyses utilize the person-level weights included within the HILDA Survey dataset to adjust for the unequal probability of selection and possible systematic non-response biases. Analyses were conducted using MLwiN [8].
Results
We used the standard SF-36 scoring procedures in which scale scores were only constructed for a respondent if they had non-missing responses to at least half of the items representing each scale. As a result, there were 12 939 respondents with valid scores on the mental health scale. The sample covered 488 areas (CCDs), with 7193 households (a range of 1–26 households per CCD) and between one and seven respondents per household.
Table 1 presents the results from a series of univariate models, regressing the mental health scale score on each of the covariates while controlling for the hierarchical nature of the data. The results confirmed the significance of all of the predictors. Better mental health was associated with increasing age, better physical health, greater household income and living in an area of relative socioeconomic advantage. Residing outside of major cities was also associated with more positive mental health though only the difference between major cities and inner regional locations was statistically significant. Poorer mental health was associated with female gender, unemployment and not being active in the labour force, not having a partner, lower levels of educational attainment, increasing levels of financial hardship/deprivation and rental housing tenure.
Coefficients, standard errors and t statistics (B/SE) from a series of univariate regression models on the mental health scale score
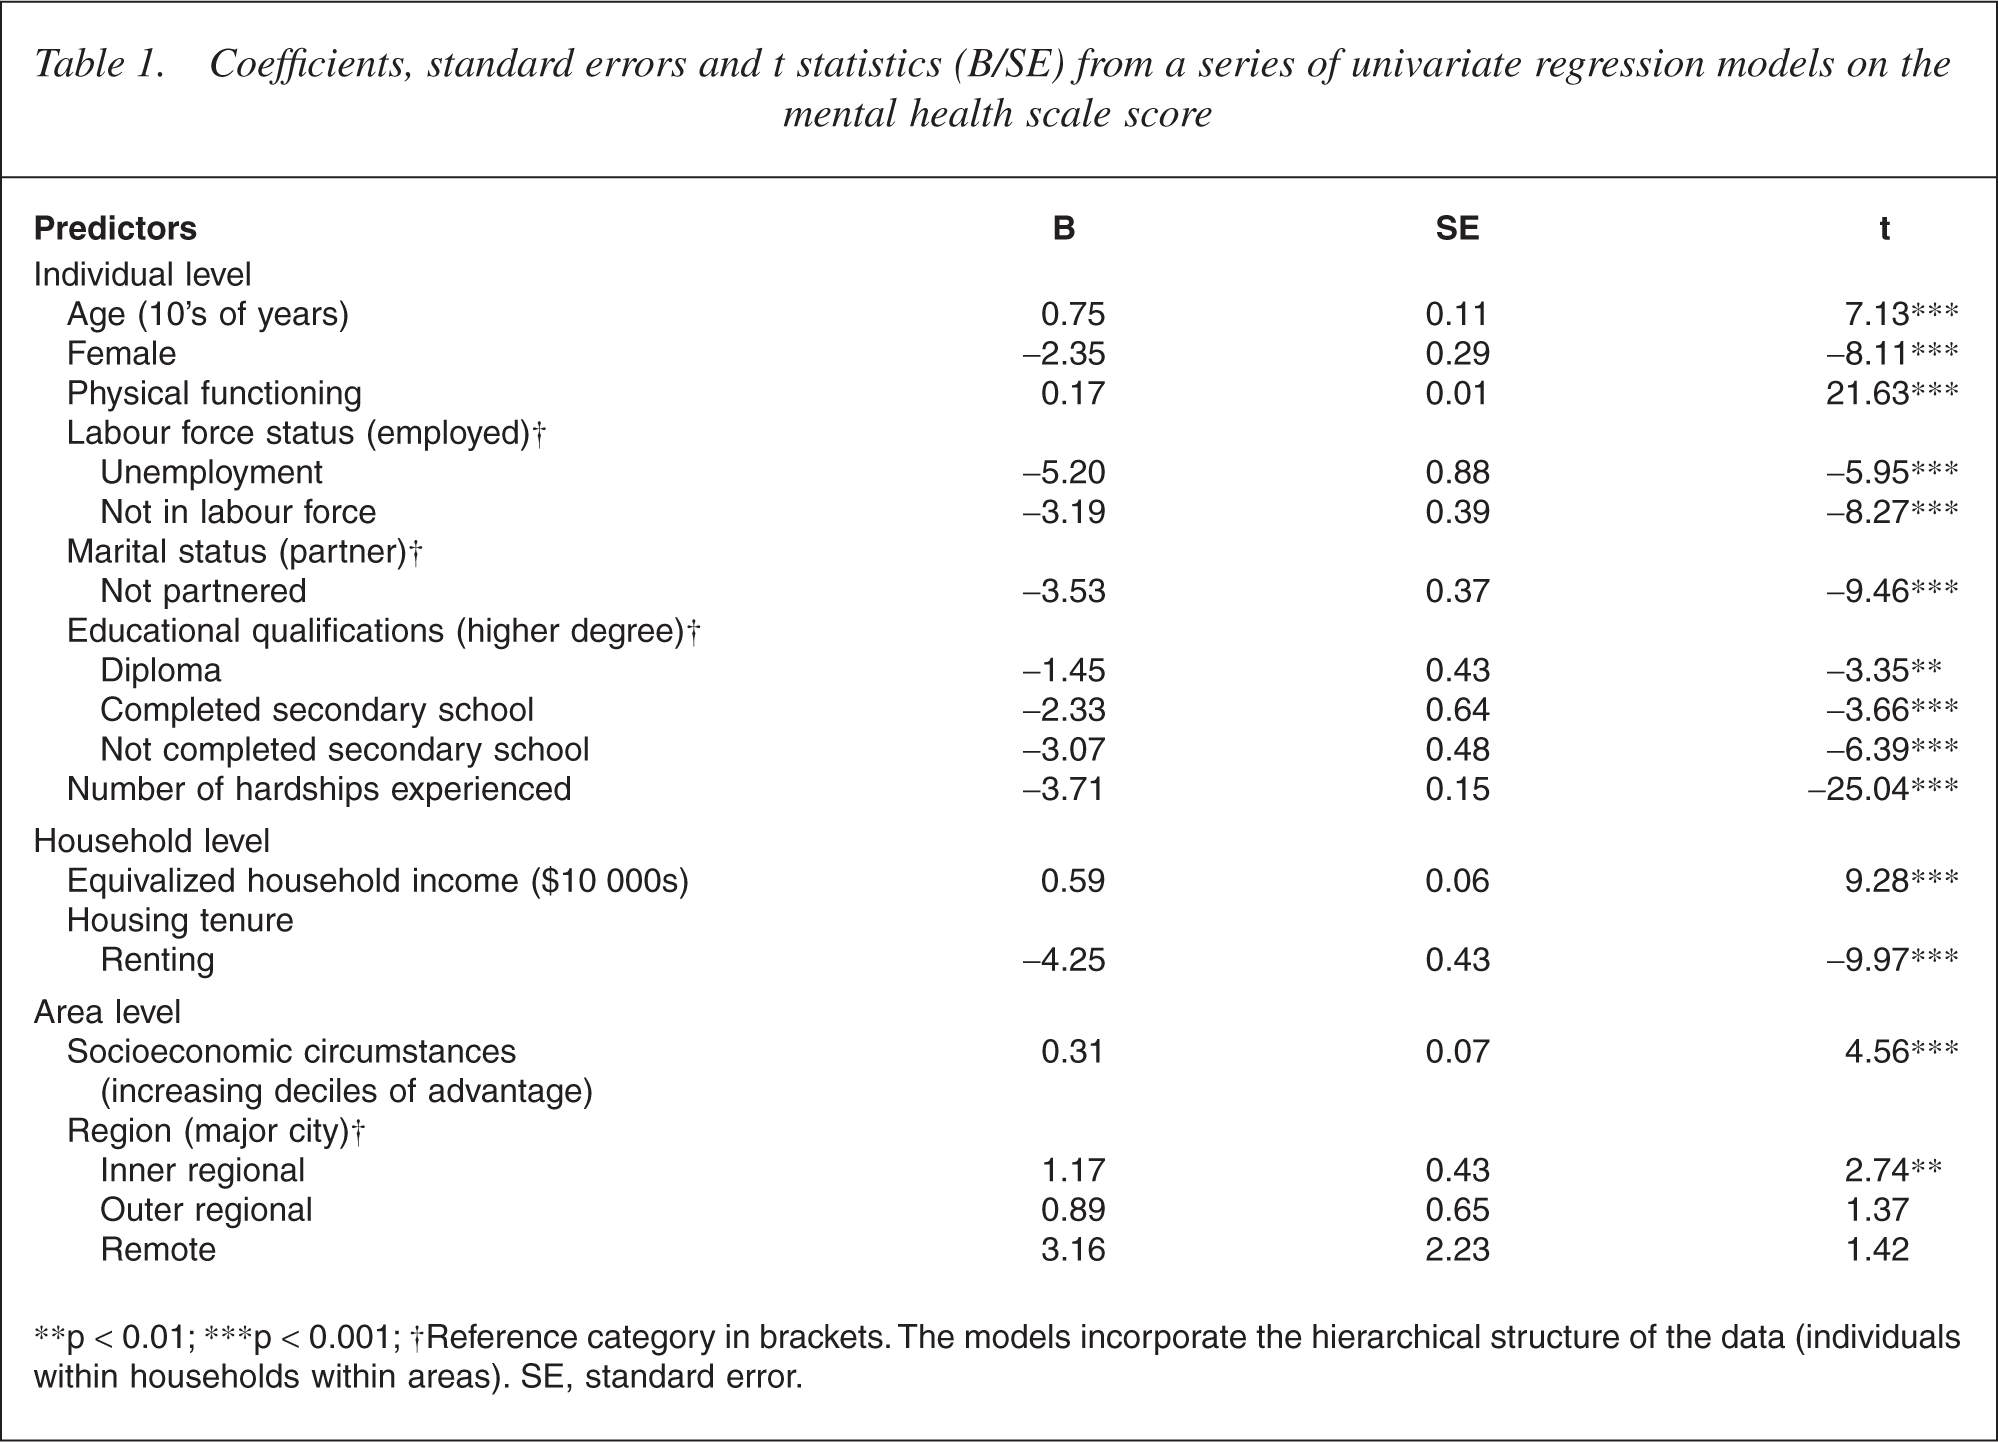
∗∗p < 0.01; ∗∗∗p < 0.001; †Reference category in brackets. The models incorporate the hierarchical structure of the data (individuals within households within areas). SE, standard error.
Table 2 presents the results from the null model. There was significant variance in the mental health scale at all levels of the model, though the majority was at the level of the individual (75.5%) and the household (23.0%). Only 1.5% of variance in the mental health scale was evident at the area level, though this was significant.
Variance and percentage of variance unexplained in mental health scale scores at individual, household and area levels, and measures of model fit, for null model and models incorporating blocks of predictors
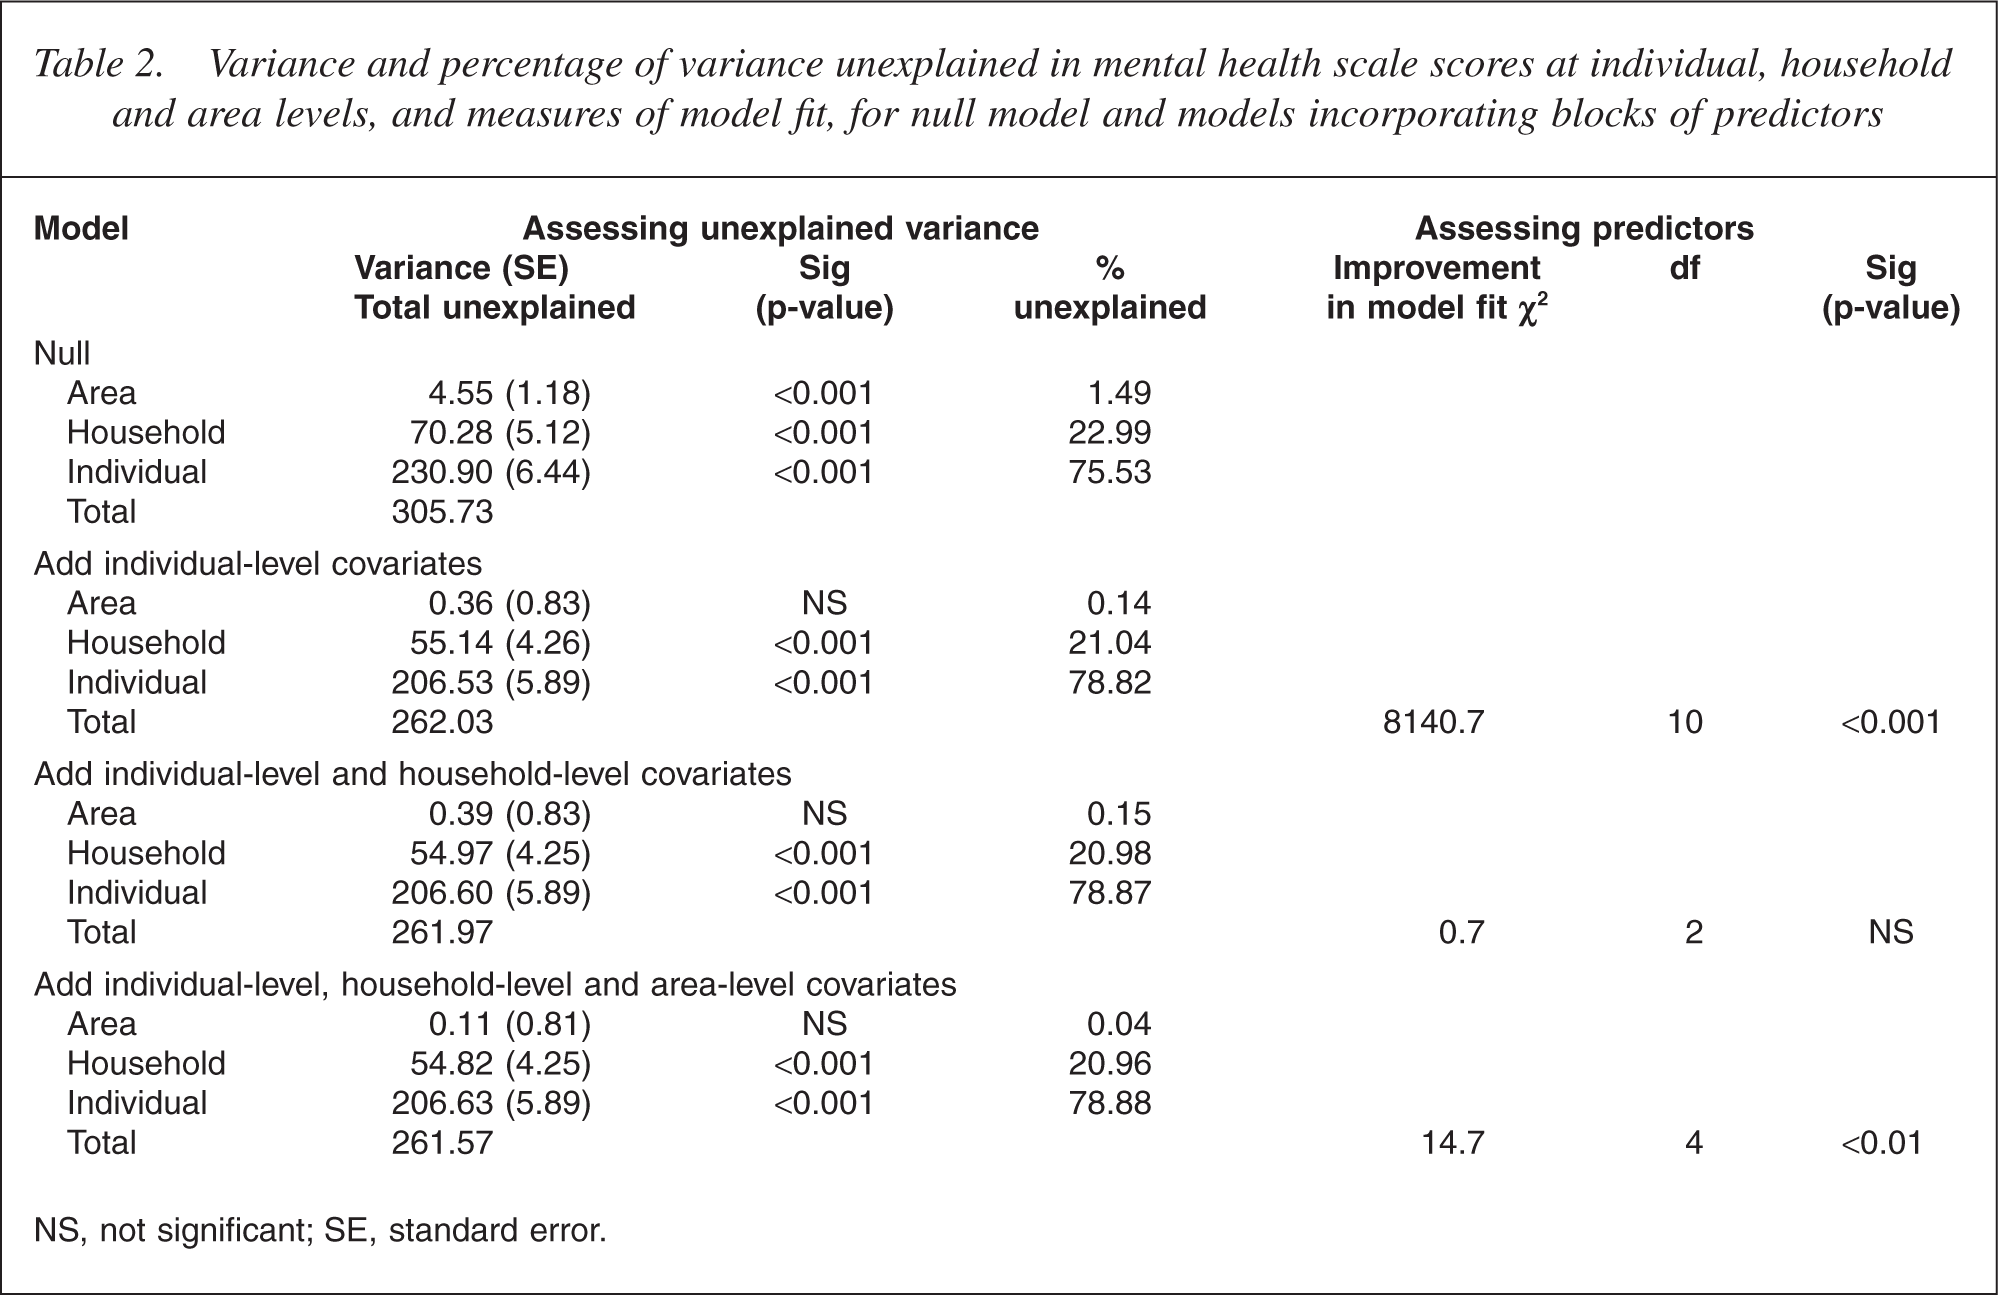
NS, not significant; SE, standard error.
The inclusion of the individual-level covariates significantly improved the overall fit of the model (Table 3), explaining 14.3% of variance in the mental health scale score (considering the reduction in the residual variance between the two models: [305.73–262.03]/305.73). The variance at the area level was no longer significant (0.1% of unexplained variance). Nonetheless, there was still significant and substantial variance at the household level (21.0%).
Coefficients, standard errors and t statistics (B/SE) from a simultaneous regression model on the mental health scale score at the individual level
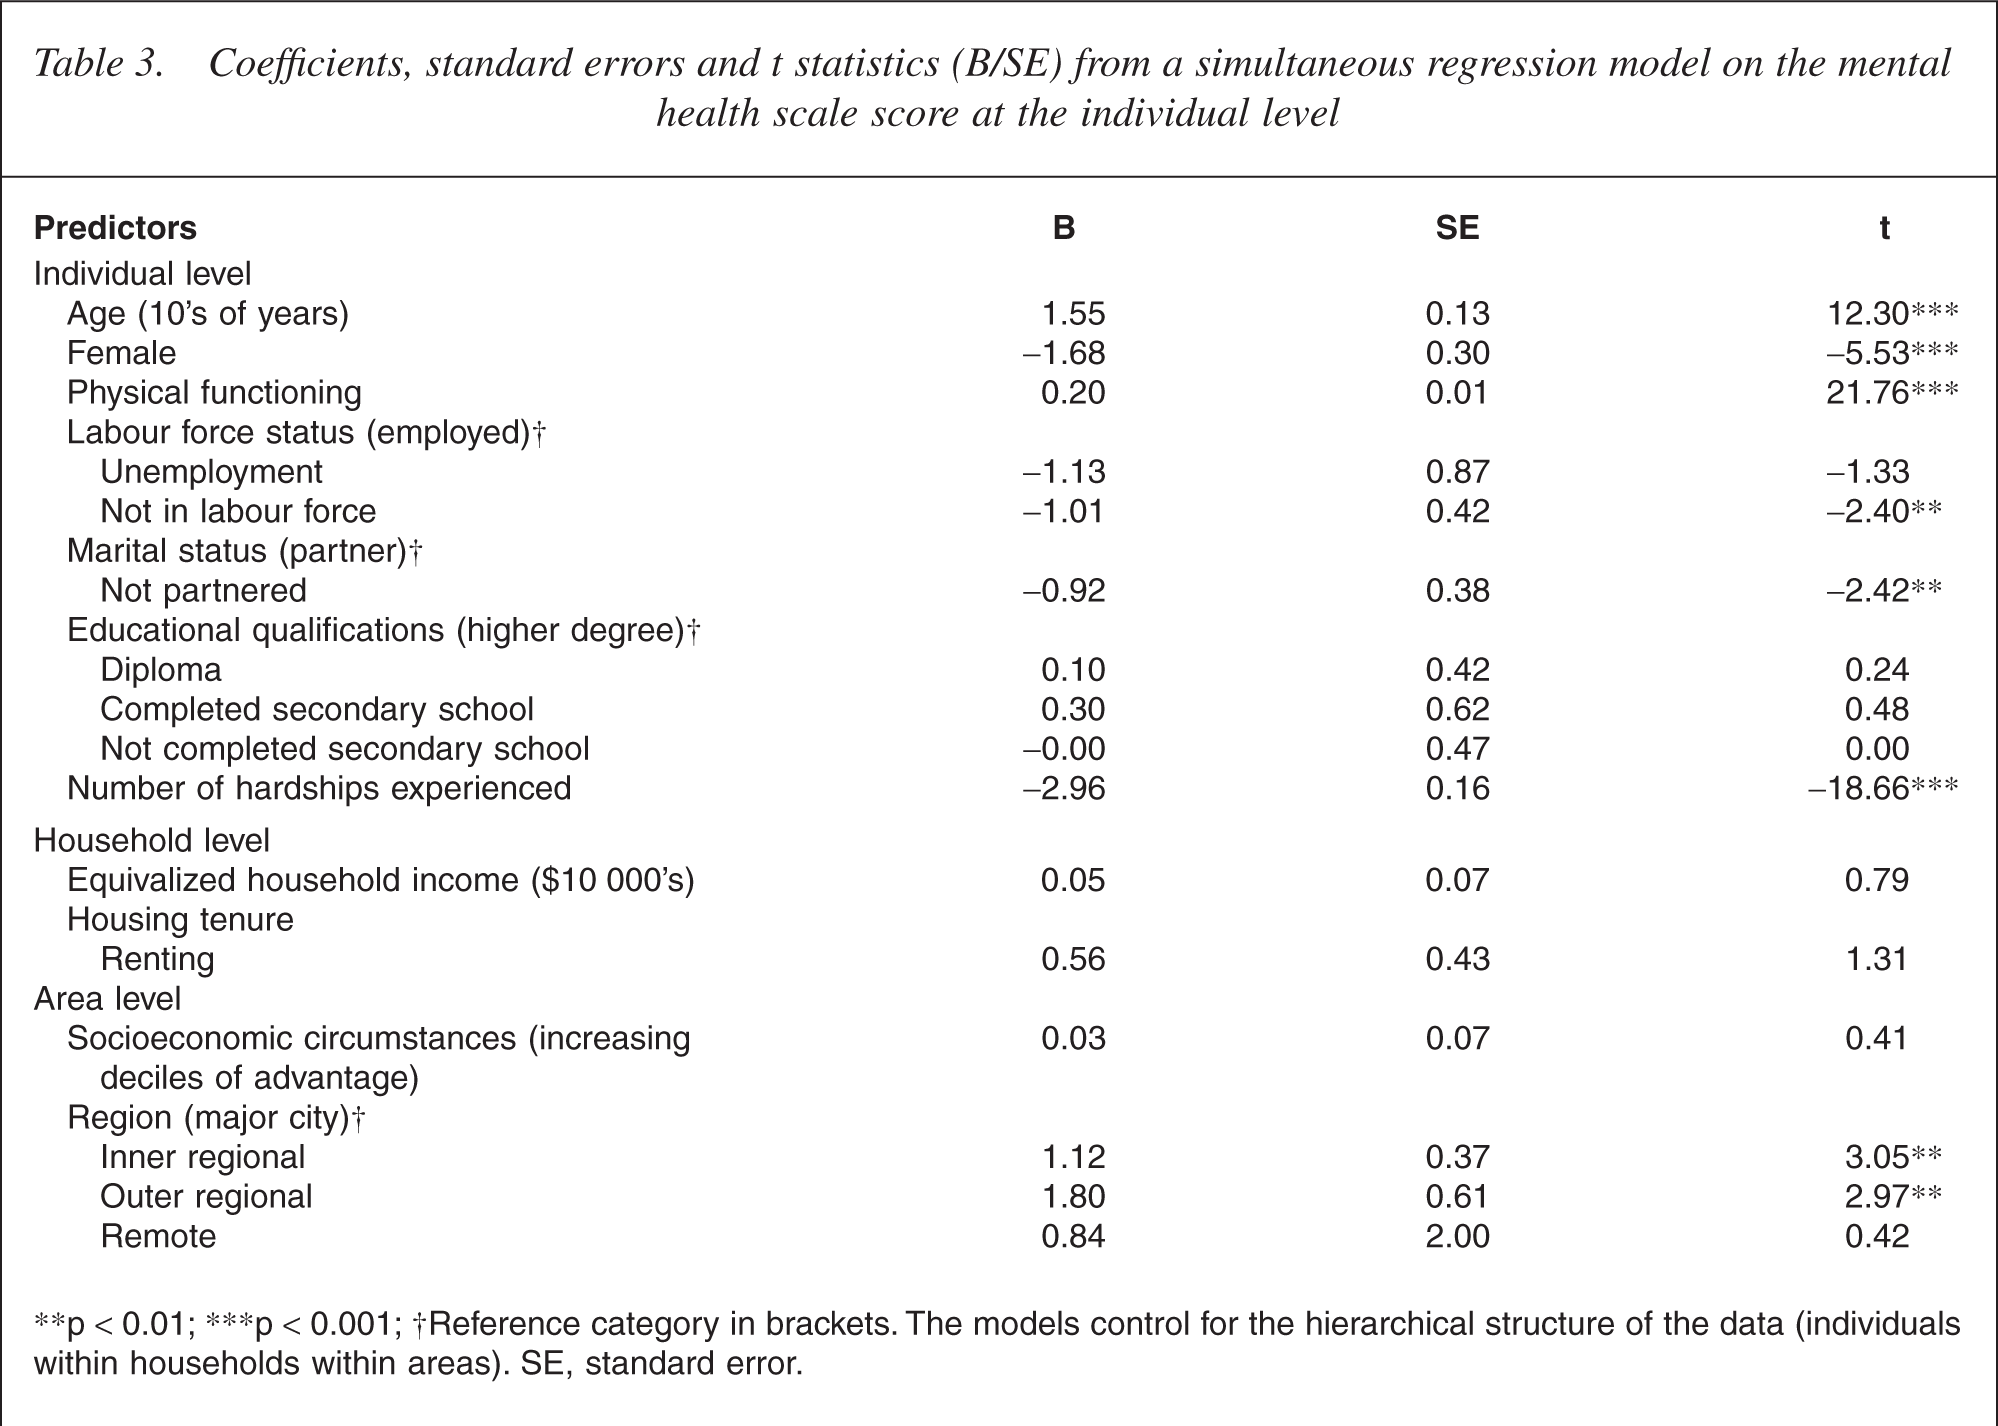
∗∗p <0.01; ∗∗∗p <0.001; †Reference category in brackets. The models control for the hierarchical structure of the data (individuals within households within areas). SE, standard error.
Expanding the model to include the household-level covariates (income and housing tenure) did not significantly improve the model fit nor alter the pattern of unexplained variance. Twenty-one per cent of unexplained variance in the mental health scale scores was evident at the household level. The further addition of the area-level covariates (measures of relative disadvantage and remoteness) did improve the overall fit of the model.
It is evident from Table 3 that many of the predictors included in the final model remained significant. However, after adjusting for the individual-level factors, the only household or area-level factor significantly related to mental health scale score was the measure of non-city residence. Residing in a regional centre was associated with better mental health than living in a major city.
Repeating these analyses with the MCS scale as the outcome measure produced an identical pattern of results.
Discussion
In this study, we examined the distribution of mental health at individual, household and area levels. Our results showed that differences at the area level were modest, but that there was significant variance (over 20%) at the household level.
This study showed that scores on the SF-36 mental health scale (and the MCS scale) were associated with a range of psychiatric risk factors, with the pattern of results consistent with expectations. The consistency between the two mental health measures suggests that, despite the differences in operationalization, they are tapping the same underlying construct. We found that measures of the socioeconomic disadvantage of communities and residing within a major city were associated with poorer mental health.
Despite the significance of the area-level covariates, the overall level of variation in mental health at the area level was modest (less than 1.5% of total variance). Further, most of this variance was accounted for by the individual-level covariates (area-level variance was reduced from 4.6 to 0.4 following the addition of individual-level covariates).
These results are consistent with most other studies that have examined area-level variation in common mental disorders or measures of psychological distress [3, 9, 12, 13, 16]. Despite our use of much smaller geographical areas than previous studies (on average 220 households with 2.6 people per household), we still failed to demonstrate substantial contextual effects. This may indicate that there is no geographical variability in the distribution of common mental disorders or it may be that the type of area examined was not appropriate. As with previous research, this study has evaluated area effects based on administrative boundaries [9]. These areas may not correspond with ecologically meaningful units [1, 15].
The area effects that we did observe seem to reflect the clustering of individual-level risk factors [4, 12]. The measures most strongly and independently associated with mental health included age, physical health and financial hardship. These are factors that may be relatively consistent within areas (i.e. some areas have high rates of poverty, the age profile of geographical locations differs with some areas having a higher proportion of older residents, etc.). However, the results from the null model demonstrate that very little variability in mental health scores occurs at the area level.
There are a number of ways in which the potential problems associated with identifying appropriate geographical areas may be resolved. It may be possible to utilize information on respondents' perceptions of their neighbourhood or data on the actual physical characteristics of neighbourhoods to define more meaningful geographical areas within the current CCDs [4]. However, this approach would restrict the power of the analysis by reducing the number of households and individuals comprising measurement of the higher level units.
Our results provide another example in which strong household-level effects are evident [9, 14, 16]. Variance in mental health scores at the household level was not greatly influenced by the inclusion of individual- and household-level covariates, suggesting that other unobserved household factors are operating [9]. This household consistency in mental health could reflect the importance of dynamic interpersonal processes within households, shared exposure to stressors or the clustering of respondents with similar individual-level risk profiles (genetic, mate selection). It may reflect the dominating influence of one household member [16]. It is possible that response contamination during completing the selfcompletion questionnaire could elevate household consistency in measures of mental health [17], though such explanations are unlikely, as consistency in the reporting of other risk factors would also be anticipated. In future research, we will explore the consistency in mental health within households in more detail.
Interpretation of the current results is limited because of the reliance on cross-sectional data as we focus on location at a specific point in time and do not consider movement or changing residence [3, 16]. The study has also explored only a restricted range of covariates [3, 15]. The models only examined main effects. It may be, for example, that area differences moderate the impact of these main effects and that cross-level interactions should be considered [3, 13]. Future research will address these limitations.
In summary, the results of this study confirm the absence of substantial area-level variation in mental health. This raises questions about whether community-level interventions represent an appropriate strategy to address mental health problems. However, the findings suggest that the household is a critical level for future research consideration. The risk and protective factors operating at the household-level seem to be of greater importance than those at the area level. This may reflect the key role of the family within our society.
Footnotes
Acknowledgements
Peter Butterworth was supported by NHMRC Public Health (Australia) Fellowship No. 316970. Bryan Rodgers was supported by NHMRC Research Fellowship No. 148948. Anthony Jorm was supported by NHMRC Research Fellowship No. 148947.
This paper uses the confidentialized unit record file from the HILDA Survey. The HILDA Project was initiated and is funded by the Commonwealth Department of Family and Community Services (FaCS) and is managed by the Melbourne Institute of Applied Economic Social Research (MIAESR). The findings and views reported in this paper, however, are those of the authors and should not be attributed to either FaCS or the MIAESR.