
Abstract
beyondblue: the national depression initiative is a national, independent, non-profit organization, which has been funded by Australian national, state and territory governments since 2000 to improve the community's response to depression. Its priority areas are community awareness and destigmatization, consumer and carer support, prevention and early intervention, primary care training and support and applied research [1]. The organization has received most of its funding from the Australian and Victorian governments, with smaller contributions from South Australia, Tasmania, Queensland, Northern Territory and the Australian Capital Territory. The states of New South Wales and Western Australia have not contributed at the time of writing.
We have previously evaluated the impact of beyondblue using data from national surveys ofmental health literacy, which were carried out in 1995 (well before beyondblue began) and in 2003–2004 (approximately 3 years after it commenced) [2]. We found that recall and recognition of beyondblue was approximately twice as high in the states that provided funding as those that did not. We therefore designated these as the ‘high-exposure’ and ‘lowexposure’ states, respectively, and used the low-exposure states as a quasicontrol group for evaluating the impact of beyondblue. We found greater changes in beliefs about treatments in the high-exposure states, particularly with respect to the benefits of counselling, medication and help-seeking in general. Recognition of depression in the vignette improved greatly at a national level, but slightly more so in the high-exposure states.
In the present paper, we report further data on the impact of beyondblue using the same methodology. Members of the public were presented with a depression vignette and asked whether they themselves or their family or friends had ever had a similar problem. We expected that if there was greater awareness or openness in the community, then more people would report contact with a depressed person. We evaluated changes in attitudes using a question asking whether the person in the vignette would be discriminated against and by a series of questions about the likelihood of long-term positive and negative outcomes.
Method
Sample
The methods of the 1995 and 2003–2004 surveys have been described in detail previously [2–4]. Briefly, the 1995 survey involved a national sample of 2031 people aged 18–74 years who were given a vignette of a person with depression or of a person with early schizophrenia. The 2003–2004 survey involved 3998 people aged 18 years or over who were given one of four vignettes: depression, depression with suicidal thoughts, early schizophrenia or chronic schizophrenia. Only the depression vignette data are used here. In 1995, there were 687 respondents in the high-exposure states and 323 in the low-exposure states who received the depression vignette. In 2003–2004, the respective numbers in the age range 18–74 years were 522 and 388.
Survey interview
Both the 1995 and 2003–2004 surveys involved an interview based on a vignette of a person with a mental disorder. On a random basis, respondents were shown a vignette of either a person with depression or one with schizophrenia. Respondents were also randomly assigned to receive either male (‘John’) or female (‘Mary’) versions of the vignette. After being presented with the vignette, respondents were asked a series of questions covering what was thought to be wrong with the person, beliefs about how the person could best be helped, knowledge of causes and risk factors, beliefs associated with stigma and discrimination, contact with people like those in the vignette and the health of the respondent. The 2003–2004 survey had additional questions, principally covering stigma and awareness of beyondblue. The questions of particular relevance to the present paper are described in detail here.
To assess beliefs about long-term outcomes, respondents were asked: ‘Suppose that John/Mary had the sort of help you think is most appropriate for his/her problems. For each of the following how do you think he/she would be in the long term, compared to other people in the community? After getting help, how likely is he/she to be violent? How likely is he/she to drink too much alcohol? To take illegal drugs? After getting help, how likely is he/she to have poor friendships? To attempt suicide? To be understanding of other people's feelings? After getting help, how likely is he/she to have a good marriage? To be a caring parent? To be a productive worker? To be creative or artistic?’. Response options were: ‘More likely’, ‘Just as likely’, ‘Less likely’, ‘Depends’ and ‘Don't know’.
To assess beliefs about discrimination, respondents were then asked: ‘Do you think that John/Mary would be discriminated against, by others in the community, if they knewthe problems he/she has had?’. Response options were ‘yes’ or ‘no’.
Towards the end of the interview, respondents were asked questions to assess their contact with people like the one portrayed in the vignette. These were: ‘Has anyone in your family or close circle of friends ever had problems similar to John's/Mary's? Have they received any professional help or treatment for these problems? Have you ever had problems similar to John's/Mary's? Have you received any professional help of treatment for these problems?’. In addition, the 2003–2004 survey had the question: ‘Have you ever had a job that involved providing treatment or services to a person with a problem like John's/Mary's?’.
Respondent mental health was assessed using the 4-NS (4 Neurotic Symptoms) [5]. This questionnaire involves asking yes/no questions about 13 symptoms in the past month. Four of these symptoms are used to measure psychological distress, namely anxiety, depression, irritability and nervousness.
Statistical analysis
Data were pooled across male and female versions of the vignette, because analysis of the 1995 survey had shown that this variable made little difference to responses. Percentage responses for the depression vignette were compared for the high- and low-exposure states in 1995 and 2003–2004.
Percentages were calculated applying survey weights to give better population estimates. For these percentages, 95% confidence intervals were estimated using the Complex Samples procedure in SPSS 12.0. For the 2003–2004 survey, we took account of the geographic clustering in the sample as well as the survey weights in estimating confidence intervals. However, sample clustering information was not available for the 1995 survey. This means that the confidence intervals are more accurate for the 2003–2004 survey and are likely to be narrower than they should be for the 1995 survey. However, we found that taking account of the clustering had only a small effect on the confidence intervals for the 2003–2004 survey, so that the 1995 confidence intervals are likely to be affected little by ignoring clustering.
Results
Contact with depression
Table 1 shows the percentage of the population reporting contact with someone like the person in the vignette. There were increases in the percentages reporting that they personally or their family or friends had been affected, and these increases were greater in the high-exposure states. Table 1 also shows the percentages reporting that they worked in a job providing services to someone like the person in the vignette. These data were only collected in the 2003–2004 survey, but show no difference between the high- and low-exposure states.
Percentage of population reporting contact with a person like the one described in the vignette
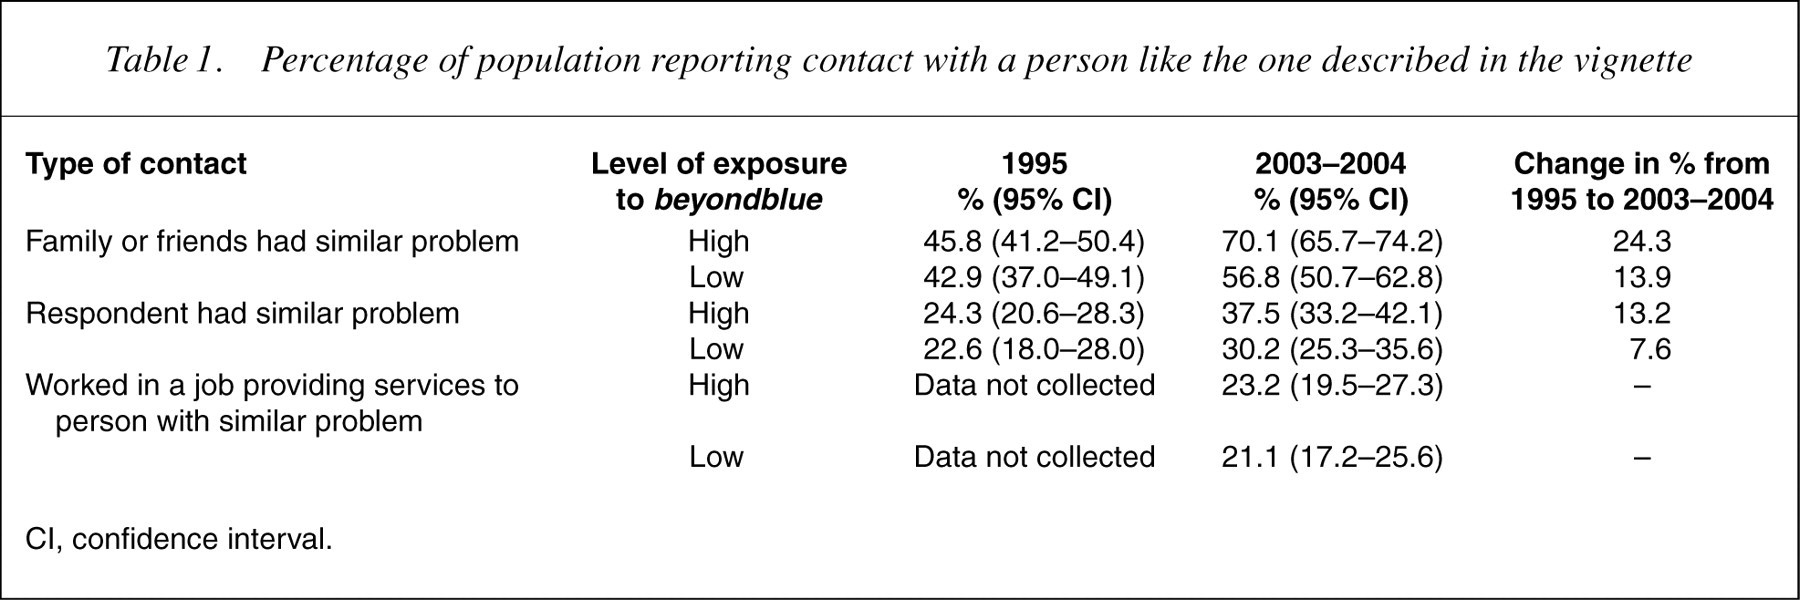
CI, confidence interval.
There were also increases in reports of having been treated for a problem like the one in the vignette. For personally having been treated, there was a greater increase in the high-exposure states compared to the low-exposure states (14.6% vs 6.0%). For having family or friends who had been treated, the increase was similar in high- and low-exposure states (23.0% vs 19.3%).
There are a number of potential explanations for the changes reported in Table 1. One explanation is that there has been a real increase in the prevalence of depression. To assess this possibility, Table 2 shows the prevalence of the 4-NS symptoms. There was very little change in current symptoms and little difference between the high- and lowexposure states.
Percentage of population reporting symptoms of psychological distress
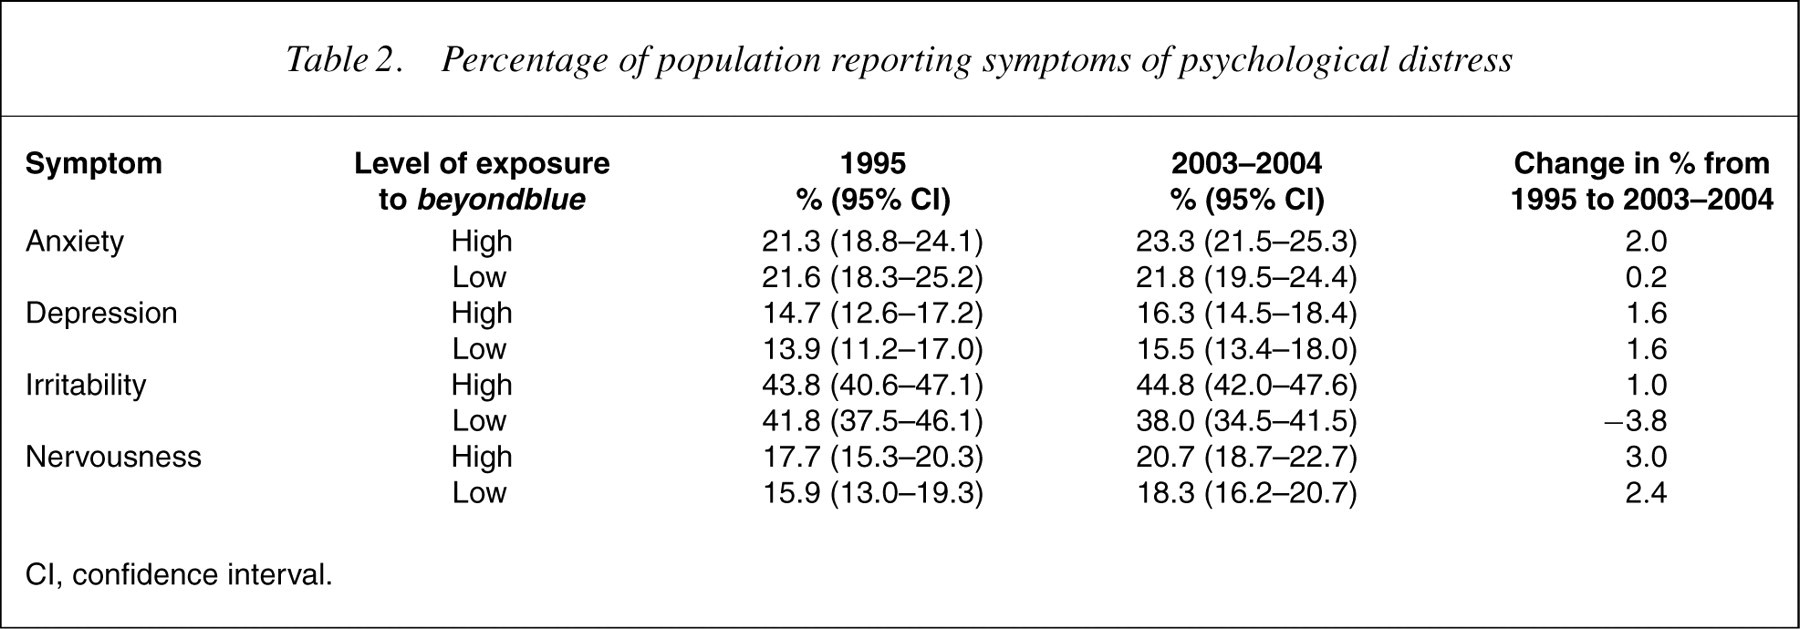
CI, confidence interval.
Beliefs about discrimination
Table 3 shows the percentage believing that the person in the vignette would be discriminated against. This belief showed an increase in the high-exposure states, but virtually no change in the low-exposure states.
Percentage of population believing that the person described in the vignette would be discriminated against
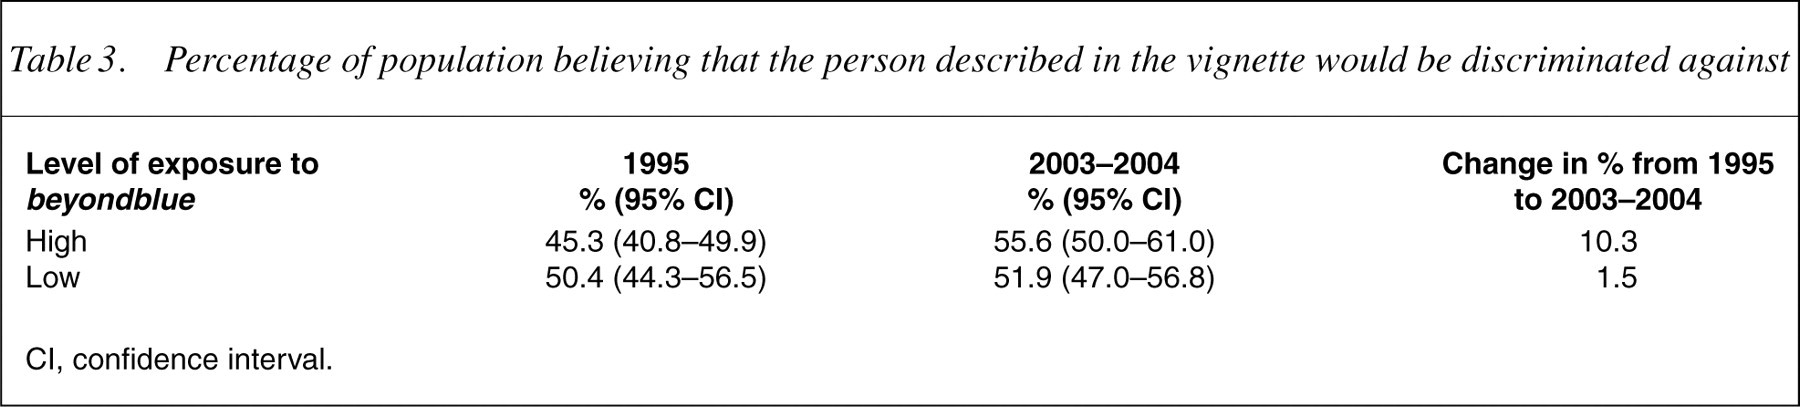
CI, confidence interval.
Beliefs about long-term outcomes
Table 4 shows data on belief that negative outcomes were ‘more likely’ for the person in the vignette, while Table 5 shows the data on belief in positive outcomes. Changes over the 8-year period were generally minimal. However, there was some overall increase in the belief that the person is at risk of attempting suicide. Also, the highexposure states showed an increase in the belief that the person would be more understanding of other people's feelings.
Percentage of population believing in negative long-term outcomes for person in depression vignette
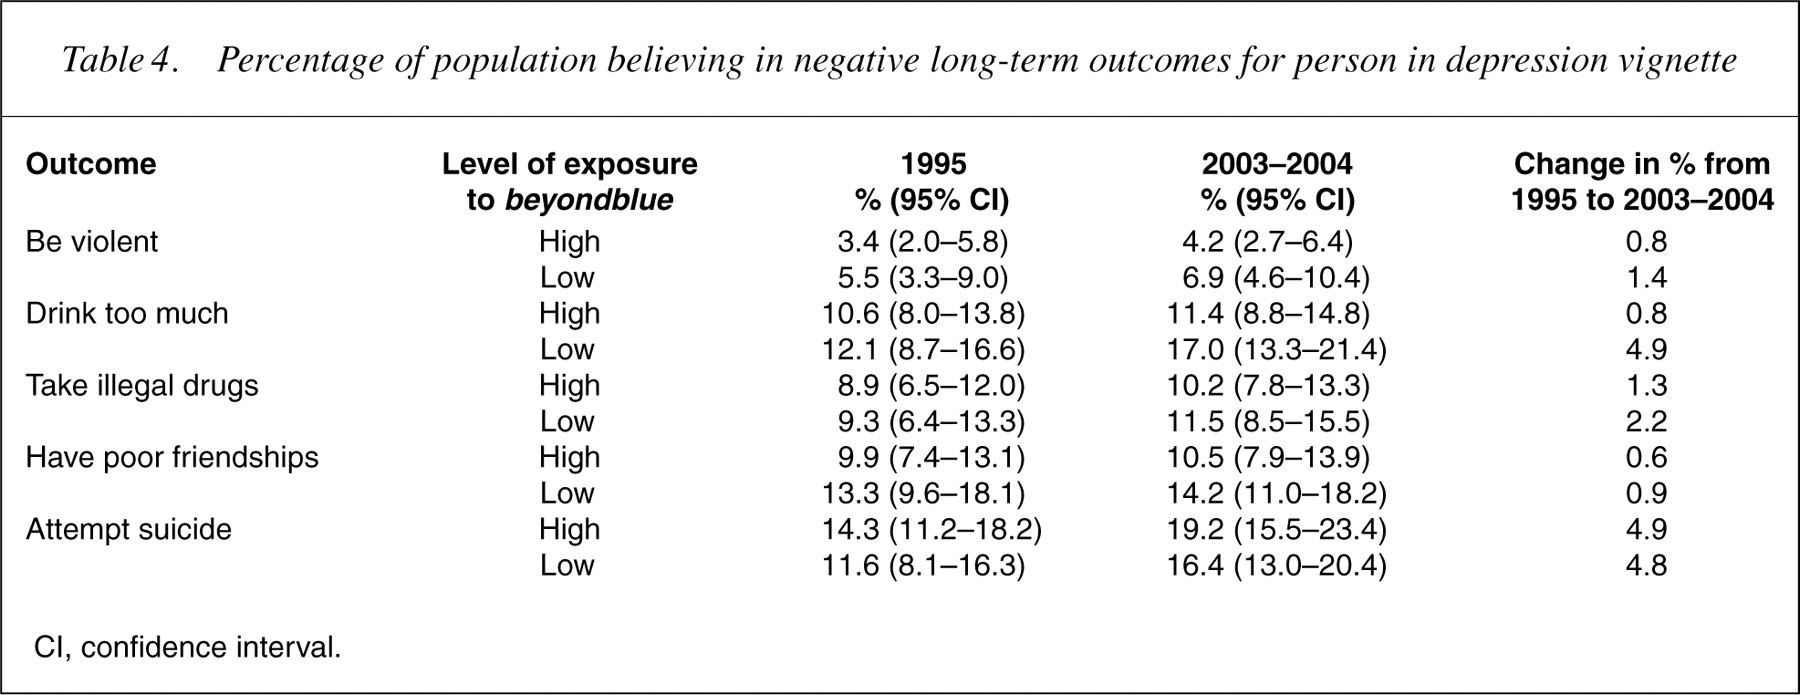
CI, confidence interval.
Percentage of population believing in positive long-term outcomes for person in depression vignette
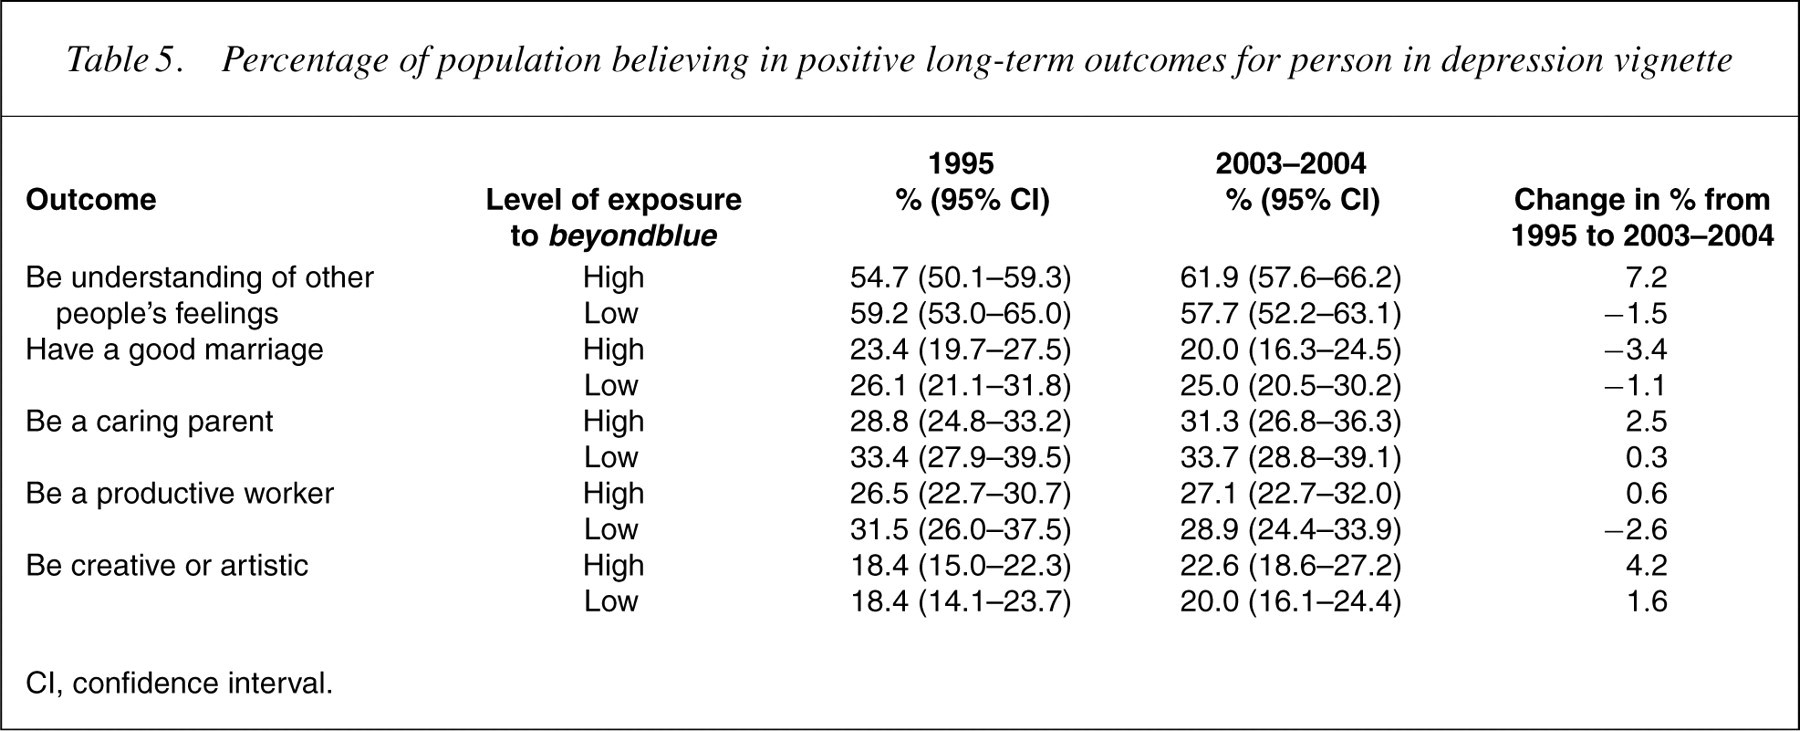
CI, confidence interval.
Discussion
This study has shown an increase in the percentage of people reporting that they personally have had a problem like the one in a depression vignette or that a family member or friend has had such a problem. This change has occurred over 8 years, but similar trends have been reported in Australia over shorter time periods [1]. It is of particular interest that the change has been approximately twice as great in the states with high exposure to the messages of beyondblue than in the states with low exposure. A possible reason for this change is that there really has been an increase in the prevalence of depression in the community. However, we also found no change on a questionnaire asking about symptoms of psychological distress in the previous month. It thus appears that reports of lifetime depression in oneself or close others have increased, while current symptoms have not. Although these findings seem on the surface to be contradictory, it is well known that reports of lifetime prevalence of depression involve substantial under-reporting [6]. Greater awareness or openness about depression in the community might well increase lifetime reports, even when there is no real change in prevalence. It is also noteworthy that the high- and low-exposure states did not differ in the percentage of people reporting that they had provided treatment or services for people with a problem like the one in the vignette. It is likely that professional experience with depression would be more accurately recalled and would, therefore, not increase with greater awareness or openness.
Another change observed was in the belief that the person in the vignette would be discriminated against by others in the community. This change was largely confined to the high-exposure states. It is important to note that the survey question we used did not ask about actual experiences of discrimination, but rather about perceptions of it occurring to a hypothetical person. We therefore interpret the responses as indicating increased awareness of discrimination as an issue for people with depression in the high-exposure states. A potential paradox is that the high-exposure states have increased in the belief that discrimination would occur, while at the same time being more willing to report depression in oneself and others. However, the survey did not require disclosure to anyone but the survey interviewer, and there was no possibility of this resulting in discrimination. In fact, in a post-hoc analysis we found quite a small association between believing in discrimination and reporting depression.
The data on beliefs in long-term positive and negative outcomes showed few changes. There was some increase in the belief that the person in the vignette would be at greater risk of suicide attempts, with this increase seen in both high- and low-exposure states. Such a belief is realistic and has been found previously to be stronger in health professionals than in the public [7]. The other change was that people in the high-exposure states became more likely to believe that the person in the vignette would be more understanding of other people's feelings. It is unclear why beyondblue's messages might change this particular belief.
Conclusion
As in the previous study [2], we have found that beyondblue appears to have produced some positive changes. These changes reflect a greater awareness or openness about depression and sensitivity to the issue of discrimination. At the time our second survey was carried out, beyondblue had completed only three of its initial 5 years. Since then, the Australian government has committed to further funding of its activities. Monitoring of longerterm changes in mental health literacy and attitudes appears warranted.
Declaration of interest
beyondblue contributed to the funding of the 2003– 2004 survey to allow inclusion of specific items about awareness of this organization. All authors have served on committees for beyondblue and have received grants from the organization.
The 1995 survey was carried out with funding from a National Health and Medical Research Council Unit Grant. The 2003–2004 survey was carried out as part of the Australia–Japan Partnership, a cross-national study of mental health literacy in both countries. This survey was funded by the Australian Department of Health and Ageing, aNational Health and Medical Research Council Program Grant, and beyondblue: the national depression initiative. We wish to thank our colleagues who were involved in the 1995 survey and Kelly Blewitt for research assistance with the 2003–2004 survey.