
Abstract
The TracerCAD system is one of the leading prosthetic CAD systems in the world and is increasingly used in clinics to replace traditional methods of residual limb shape capture. Accurate dimensional capture of the residuum is arguably the most important process in the production of a prosthetic socket. TracerCAD system accuracy has previously been tested on a cylindrical model but not a trans-tibial shape. Residual limbs are irregular in shape therefore it is important to assess if shape has an effect on the accuracy of data collected when using TracerCAD. The objective of this study is to investigate the accuracy of the TracerCAD system in measuring a model of a trans-tibial stump of known dimensions and volume. A model of a trans-tibial stump was produced and filled with plaster and measured using a data acquisition system with an accuracy of five micron (0.005 mm). The model was repeatedly traced using the TracerCAD system by an individual user. The mean value of measures taken by the dynamic indicator was calculated and compared to individual and mean values of TracerCAD measurement. Results showed that the TracerCAD measurement was not as consistent on the more complex trans-tibial model as for the cylindrical model.
Introduction
In contemporary practice, prosthetists design sockets on an individually customized basis for every level of amputation. For socket production, a model of the residual limb is made using a plaster cast. Material may then be added to the model over areas which are pressure intolerant and removed from areas which are loaded for weight bearing. Both the plaster casting and modification procedures are subjective and performed on the basis of skill and judgement of the prosthetist.
Traditional socket manufacturing methods are plagued by inherent difficulties in quantifying and recording the modifications used to produce comfortable sockets (Saunders et al. 1989). In addition, plaster casts often carry additional roughness beyond that present in the limb itself (Hastings et al. 1998). With traditional techniques, the biggest issue in socket design is in capturing an appropriate shape and volume match of the residual limb. This is due to plaster tools being rudimentary and lacking accuracy. Additionally, conventional techniques do not help in measuring and calculating the socket fit. The biggest challenge is to develop techniques that offer good solutions and also enable the prosthetist to quantify the procedure and the results.
Klasson (1995) believed that there was much to be gained in improved function with less tissue stress in weight bearing and stabilising if surface matching can be improved. Klasson stated that even pressure distribution is not possible to achieve through modification of the cast in the plaster room.
CAD technology was introduced into the field of prosthetics more than two decades ago and it was hoped that it would allow an opportunity to quantify, and facilitate better understanding of, prosthetic socket fit. Boone (1989) stated that original CAD/CAM systems may have been a little ahead of their time, were perhaps introduced too early as computer processing techniques, and software was not as sophisticated as today.
The result was that many of those who did adopt early CAD/CAM technology under-utilized the systems and in the long term, users drifted back to more familiar traditional methods of manufacture.
There is no question that current CAD systems have developed and will continue to influence the fields of prosthetics and orthotics (Brncick 2000). Current systems still, however, do not guarantee a good clinical result (Ross 2003/4).
The TracerCAD system is one of the most widely used CAD/CAM systems available. The system is currently employed in clinical practice in several prosthetic and orthotic centres in the UK and throughout the world.
TracerCAD allows a prosthetist an alternative method of producing a prosthetic socket. The system features a hand held ‘pen’ which is passed over the patient's stump to capture or ‘trace’ its shape which is recorded on computer. A range of on-screen modification tools allows the user to then modify the shape displayed on the computer screen. When modification is complete, a positive model may be produced using a computer controlled carving machine.
Lilja and Oberg (1995) called for individual evaluation of the performance of each new CAD/CAM system before it is taken into practice. This will assure the accuracy needed for making an impression. Brncick (2000) agrees that both clinician and patients will benefit from further research in this field.
McGarry and McHugh (2005, 2007) investigated the repeatability and accuracy of the TracerCAD scanning technique on a simple cylindrical model of determinable volume. This study concluded that differences may exist in tracing results due to the ‘hands on’ nature of the tracer design. This may be due to pressure applied during the trace, or individual marking of landmarks, which may alter the position of measurement or the axis on which the measurement takes place.
TracerCAD showed varying results between ML and AP dimensions taken on the same trace when traced by different users. ML and AP dimensions varied when compared to each other and when compared to those taken by metrology. Mean differences between AP and ML diameters were less than 1mm. When compared to metrology results (repetition), the mean volume percentage difference varied by up to −1.96%.
It is debatable whether such differences are clinically significant in the manufacture of prosthetic sockets as it has yet to be established whether a patient could detect such differences in the fit of the prosthesis. However, it may be that, in the process of digitizing a limb, differences may occur between users when tracing due to the fact that landmarks may be applied differently or different pressure may be applied by different users.
One opinion may be that the basis for measuring a patient's residual limb should be repeatable and accurate, independent of the prosthetist who takes the measurement. If we introduce variation in the scanning technique then this will lead to different scans being taken. If a patient is cast ten times, each cast and, therefore, each digital map will be slightly different (Smith and Burgess 2001).
He et al. (1999) argue that since capturing data is the necessary first stage of any CAD/CAM process, with the resulting socket depending upon the data acquired, the accuracy and precision of the way we acquire the data is central to the final socket production. Quality management promotes a common sense approach that ‘the most important key to success is to do it right from the beginning’ (Klasson 1995).
A further purpose of research into CAD is to discuss the quality of the fit of prosthesis and what conditions are necessary to achieve at a good fit. There are individual variables, but if questions in relation to the quality of prosthetic fit are answered step by step in physical terms, then we have a much better background for education for applied research and development, and much better tools for high quality daily practice (Klasson 1995). The objective of this study is to investigate the accuracy of the TracerCAD system in measuring a model of a trans-tibial stump of known dimensions and volumes. Errors of measurement are compared to those of the cylindrical model previously reported by McGarry and McHugh (2005, 2007). A hard model was used because, at this stage, the inherent accuracy of the system is being tested.
Method
A plaster of Paris cast replicating the dimensions of a rectified trans-tibial stump was produced to the dimensions shown (Figure 1). A hexagonal mandrel pole was used to ensure that alignment could be reproduced as demonstrated by Convery et al. (2003).
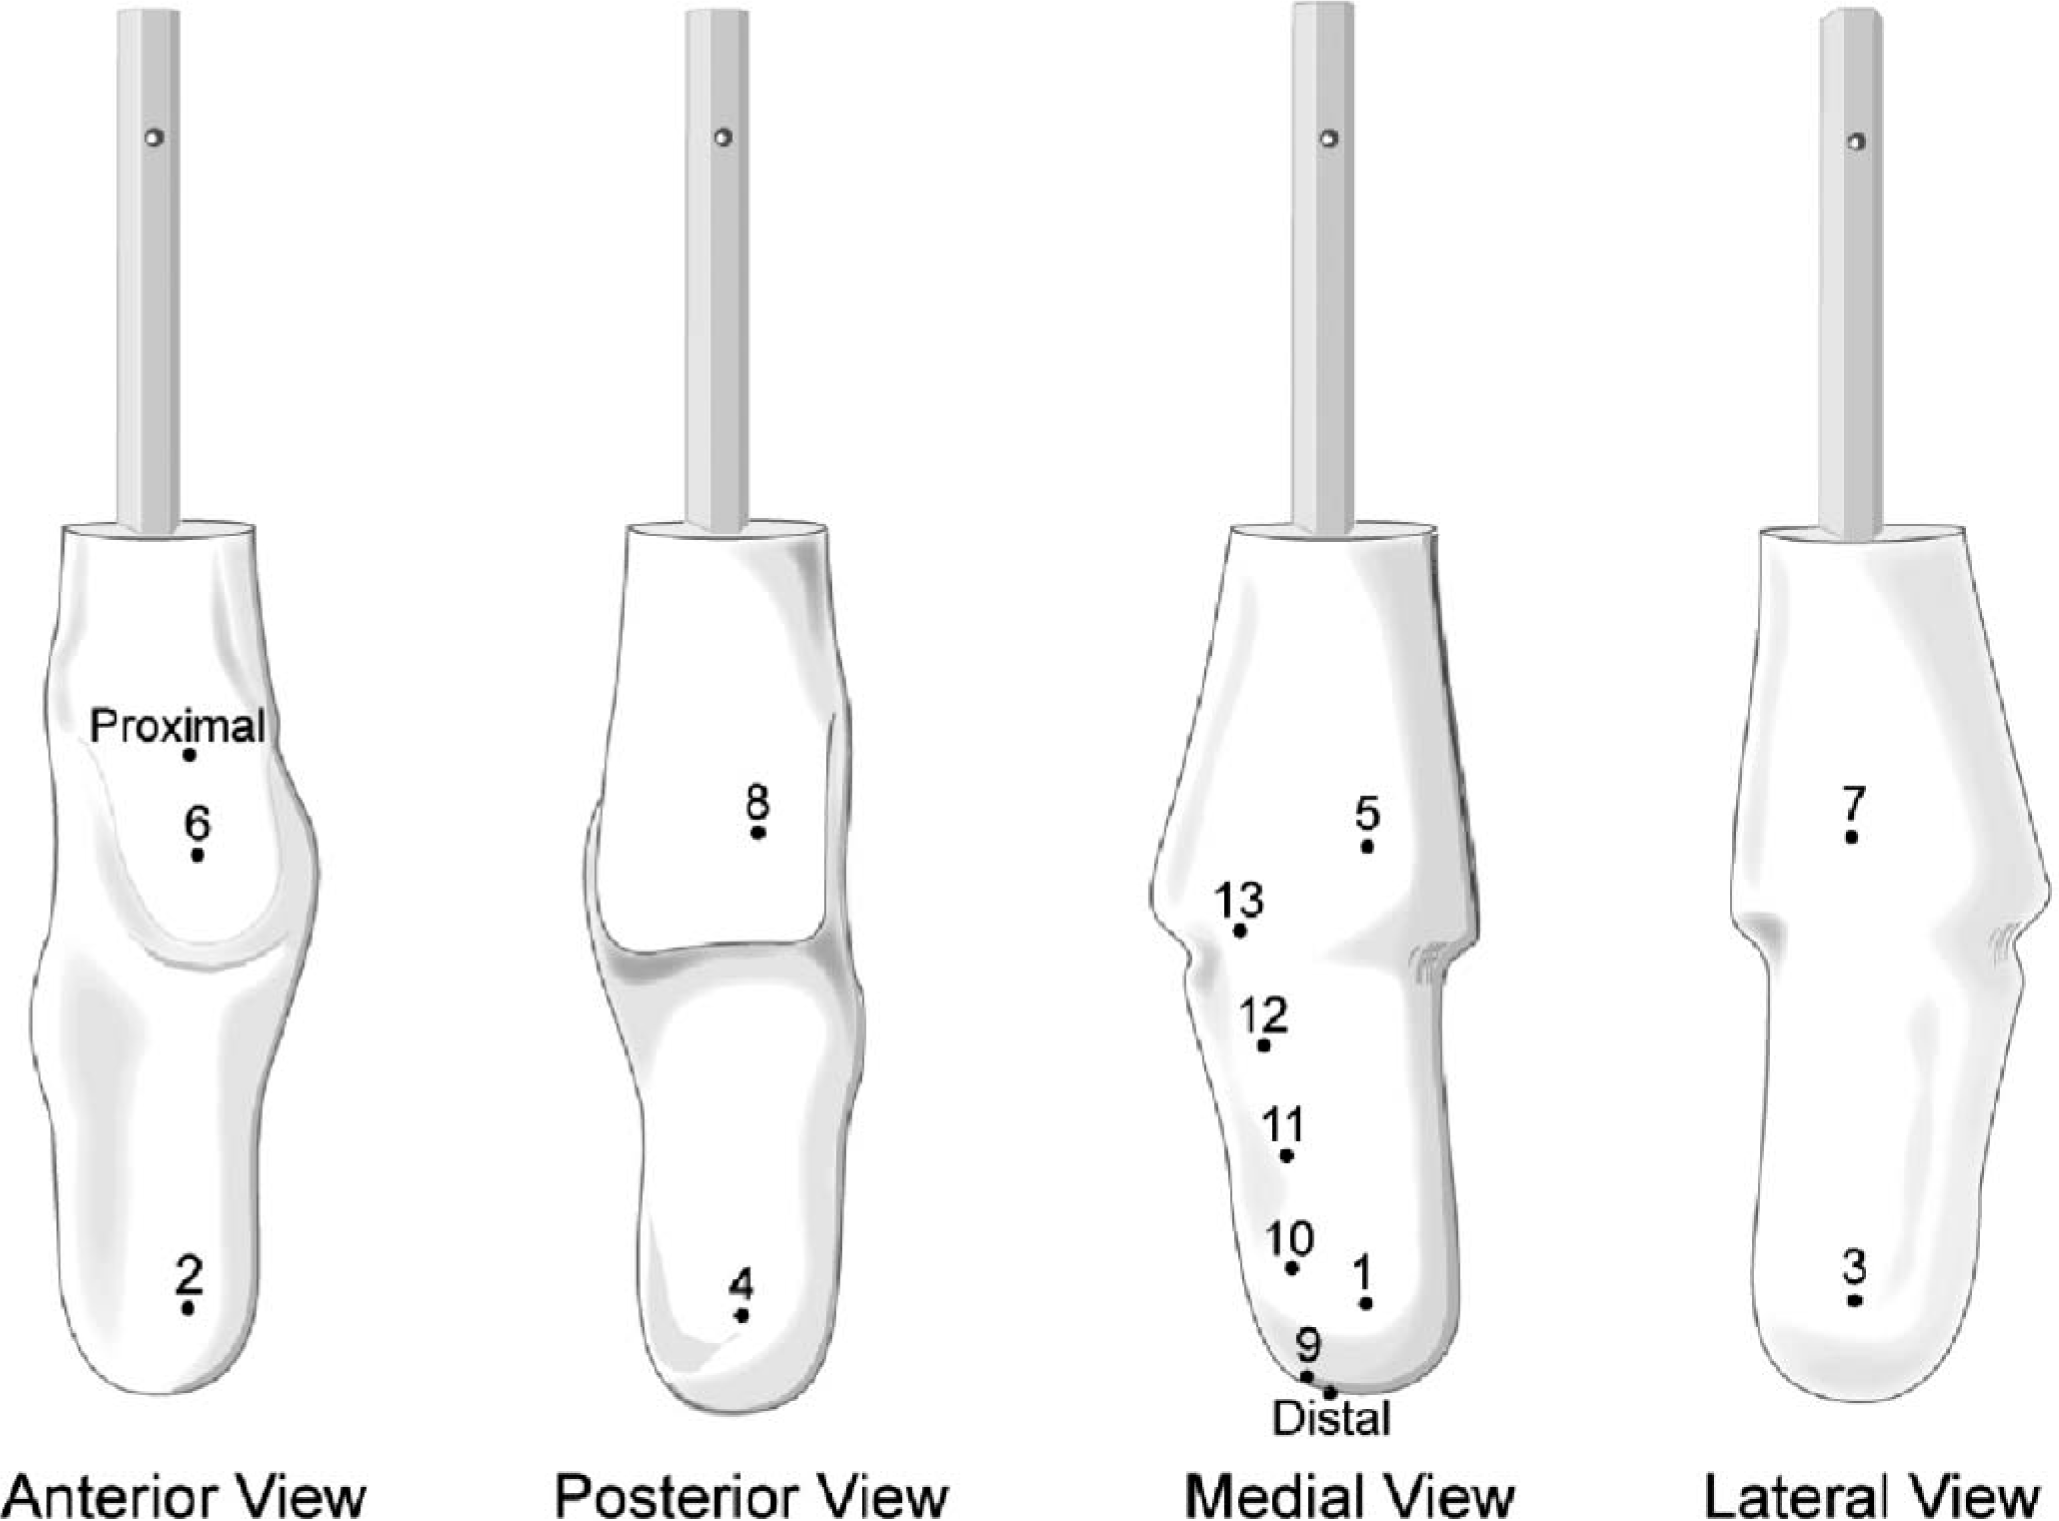
Plaster of Paris trans-tibial model.
The model was placed into the Deckel CNC machine (Figure 2) for accurate placement of datum lines and reference points to allow the model to be measured. All measurements were repeated three times. The data was then plotted and landmarks positioned to calculate AP, ML diameters, circumferences and volumes between levels (Figures 2, 3 and 4).
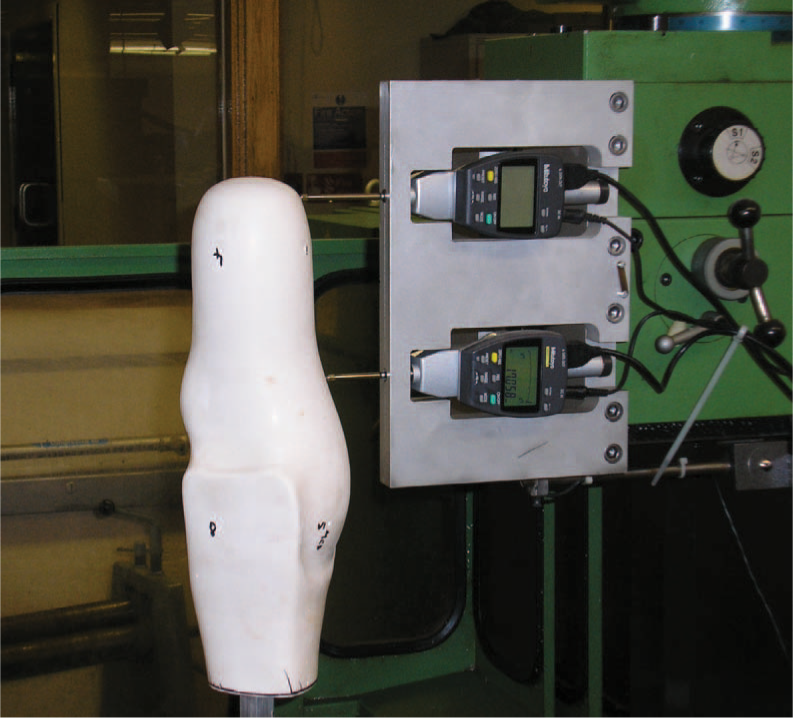
Placement of reference landmarks by CNC milling machine (Deckel™) and a displacement tool (Mitutoyo, series 543 1DF Dynamic Indicator™ and data acquisition software).
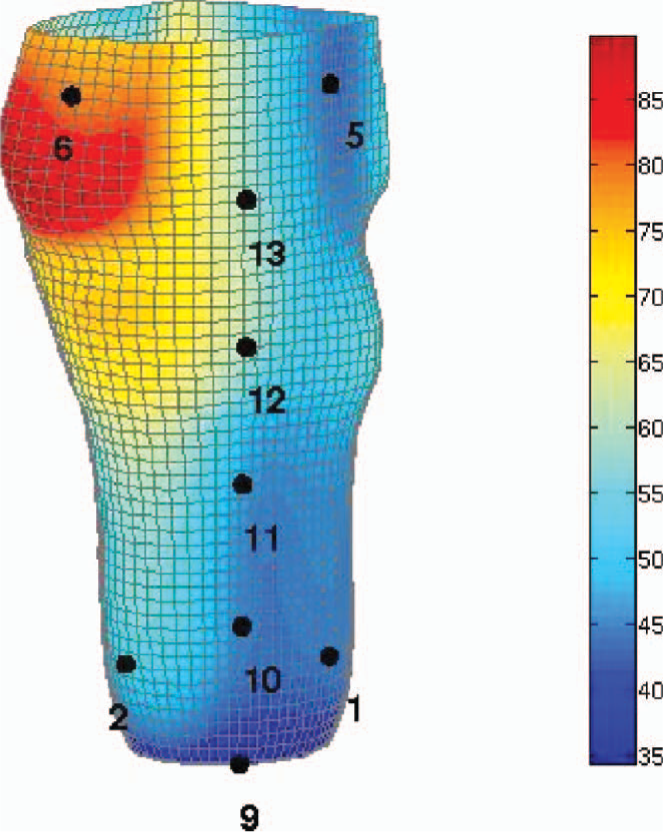
Measured data plotted and landmarks positioned.
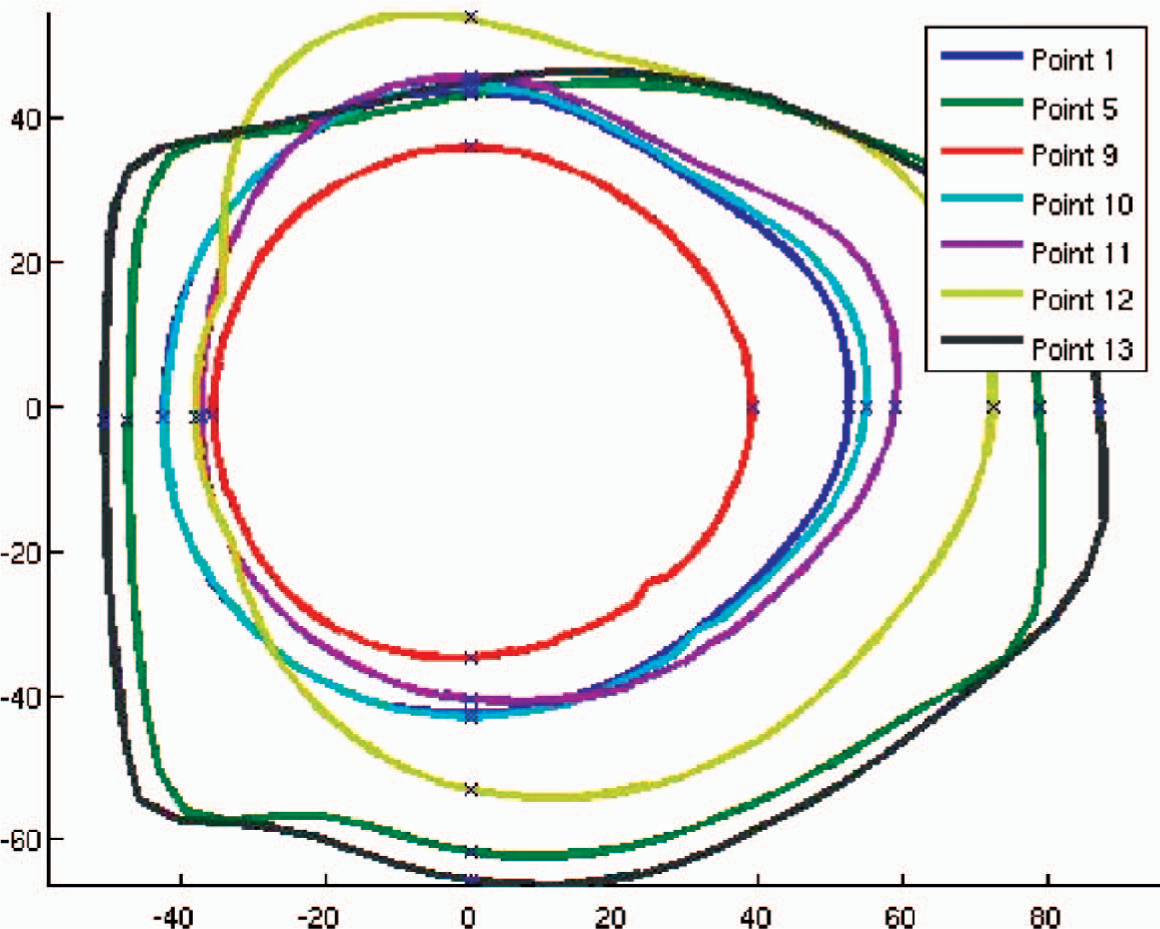
Transverse sections of measured data plotted at individual landmark levels.
The distal (D) and proximal (E) landmarks were precisely indicated on the model. Two rings of four landmarks were marked proximally and distally on the cast at 90 degree intervals. The proximal ring also served as the medial (landmark 5), anterior (landmark 6) and lateral (landmark 7) reference lines. Additionally landmarks were also accurately measured and marked at 50 mm intervals on the model. The diameters and circumference of the shape was measured on each of these intervals from the dynamic indicator scan (Figure 1).
The volume of the shape was then determinable between any two points between landmark 9 and 13 on the model. A vice was constructed in wood to hold the model, receiver and transmitter in the desired position to eliminate error due to the relative movement of these items during the procedure as described by McGarry and McHugh (2005). The room was a large clinical area and all items which might cause interference were removed. The shape was then scanned using the TracerCAD system a total of 30 times. Volume, circumferences & diameters at three levels were indicated and recorded. All tracings were carried out following a strict protocol to minimize the possibility of error. As TracerCAD calculates volumes from a fixed point to the end of the model, it was necessary to calculate the volumes of intermediate sections of the model by subtraction.
Results
Discussion
Mean diameters, circumferences and volumes of the model were determined by the dynamic indicator and recorded. Individual dynamic indicator scans were compared and subtracted to show minimal variation of measurement. Differences between measures were never greater than 0.06 mm (coefficient of repeatability 0.04 mm). Thus a mean of the dynamic indicator measurements at each level was sufficiently accurate to be used for comparison to the TracerCAD measurements.
TracerCAD diameters were analysed for measurement repeatability at each landmark level (Table I). Dimensions varied by a maximum of 8.3 mm (mean 99.29, range 98.4 – 106.7, coefficient of repeatability 4.27 mm) and by a minimum of 2 mm (mean 98.09, range 97.6 – 99.6, coefficient of repeatability 1.1 mm). Measurement repeatability for the more complex shape of the trans-tibial cast was poorer than that of a simple cylindrical model where dimensions varied by a maximum of 4.4 mm (mean 58.4, range 57.7 – 62.1 SD 1.08, coefficient of repeatability 2.99 mm) and by a minimum of −0.3 mm (mean 57.89, range 57.7 – 58, coefficient of repeatability 0.25 mm).
Mean, maximum, minimum, standard deviation and coefficient of repeatability of TracerCAD AP, ML and volume measured at levels 9 – 13 (mm).
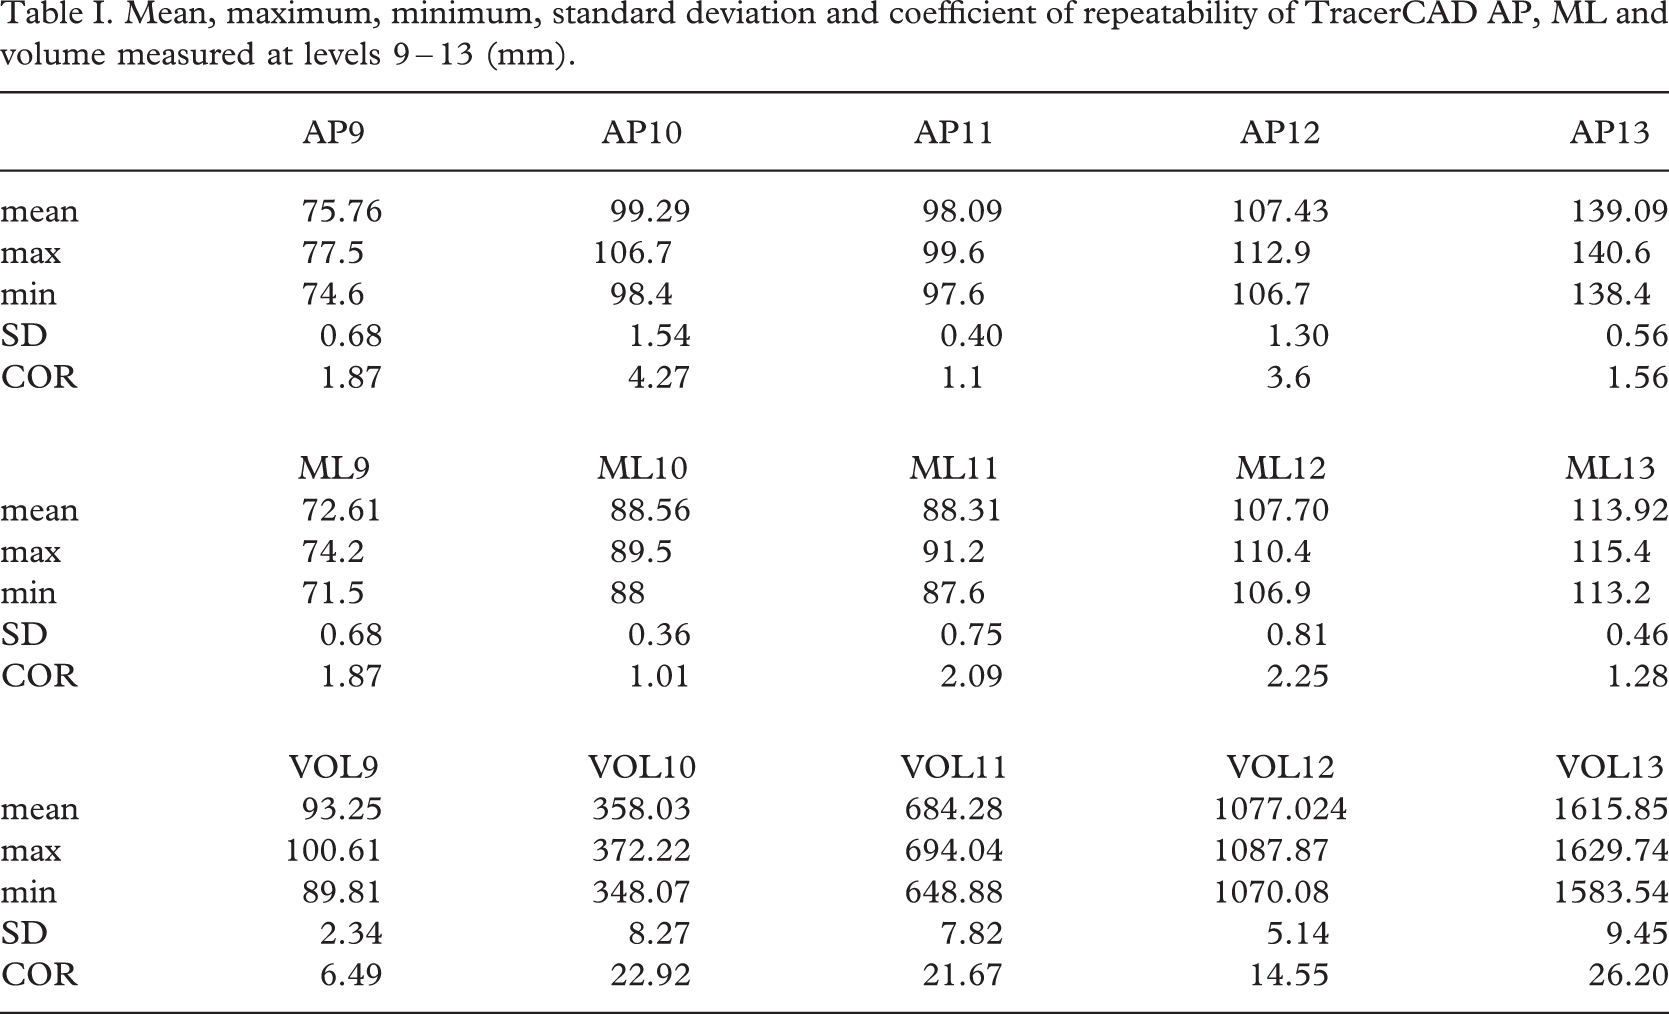
Differences between TracerCAD diameters have increased notably more on the more detailed TT model. This may be caused by a bridging effect of the TracerCAD Pen on the hard model over the more complex shape or may be due to the pressure applied by the user.
TracerCAD AP mean diameter (Table II) differed from the dynamic indicator AP mean diameter by a maximum of 3.04 mm (Range 1.13 – 3.04 mm). During individual tracings it is important to note that in one location this range increased to a maximum of 9.37 mm and a minimum of −0.03 mm.
Comparison of TracerCAD and dynamic indicator: AP, ML diameters and circumferences (mm).
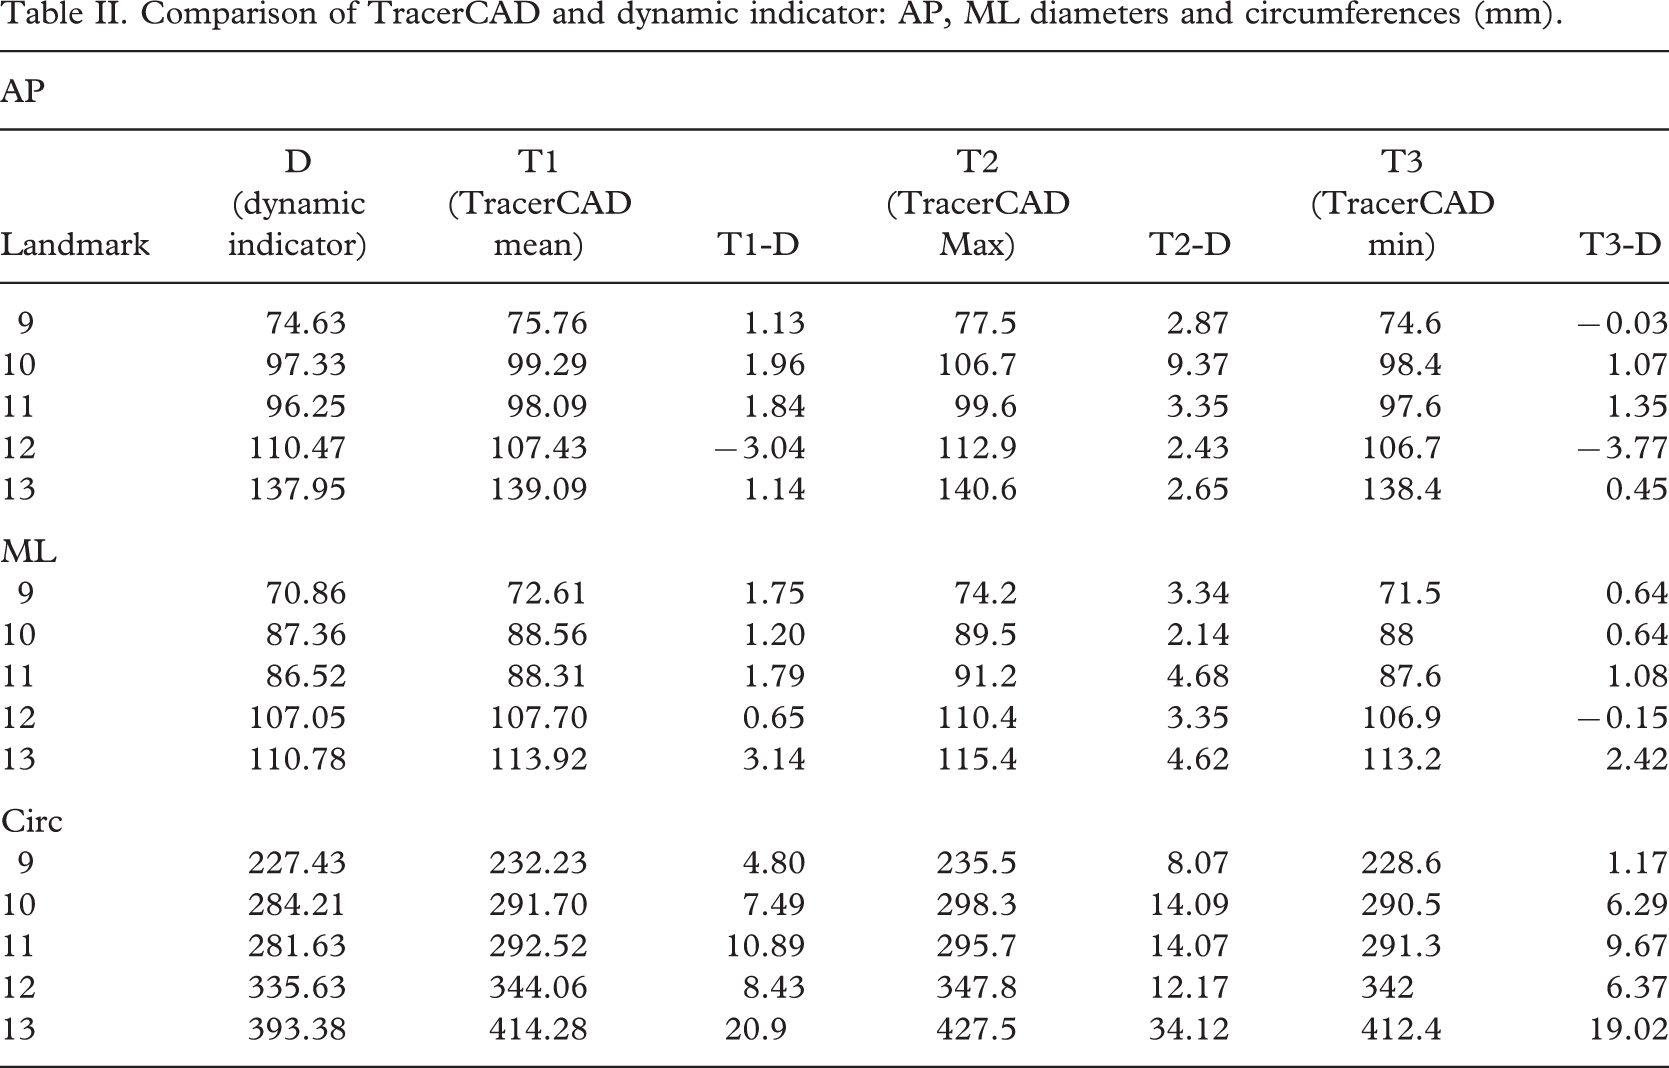
TracerCAD ML mean diameter differed from the dynamic indicator AP mean diameter by a maximum of 3.14 mm and by a minimum of −0.6 mm. On individual tracings this range increased to a maximum of 4.68 mm and a minimum of 0.15 mm.
In a previous study (McGarry and McHugh 2005) on a cylindrical model, TracerCAD AP and ML mean diameters varied from mean measures taken on a cylindrical model by less than 1 mm. This range increased to a maximum of −1.64 on individual tracings.
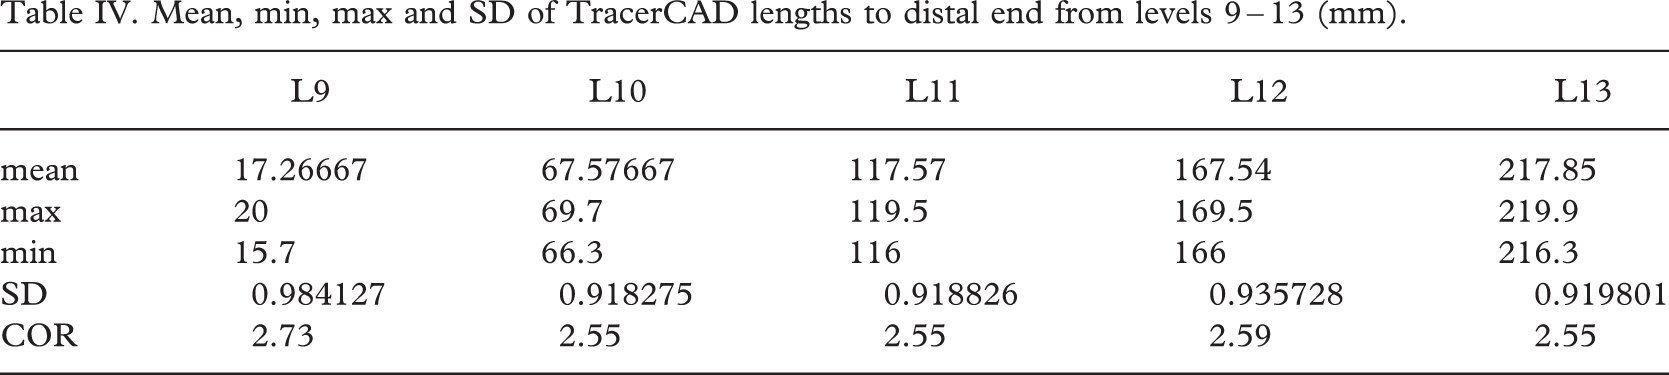
AP and ML discrepancies may be due to the manual positioning of landmarks by examining their distances from the distal end (Table IV). Although care was taken to ensure exact positioning of each landmark at the corresponding point on the model, a maximum coefficient of repeatability of 2.73 mm resulted. This may result in measurements being taken at differing levels and could account for some discrepancy between dynamic indicator AP and ML and TracerCAD diameters.
During the test procedure, landmarks were carefully added to precisely indicated model positions. No such indication exists in the clinical situation when marking landmarks on a patient. Logically, this is likely to have an adverse effect on the precision of landmark positioning and the measures that result. Measurements may be recorded at incorrect levels or at a different angle than intended. If not identified, measurements could be misinterpreted by the prosthetist resulting in incorrect modification of the model, and ultimately reducing the chance of optimal prosthetic fit.
Inaccuracies in the TracerCAD AP and ML measurements would result in the on screen model having a different shape to the actual model, since diameters at levels measured are different. On a simple cylindrical model, errors in the diameter measurement cause the cross section of the digital model to be elliptical and not circular. Discrepancies may be less easily identified and corrected on more complex shapes such as the stump. However, such distortion may result in sockets which do not match the underlying shape of the stump, which could affect the pressure distribution at the stump socket interface. If the affected socket fit is compromised, this may undermine user confidence and perhaps explain one reason why some prosthetists revert to the original plaster of Paris cast method for shape capture of the residuum.
Mean circumferences ranged by a maximum of 20.9 mm and by a minimum of 4.80 mm when compared to dynamic indicator measurements (Table II). On individual tracings this range increased to 34.12 mm. Should a prosthetist create a socket of circumference that is 34.12 mm larger than required, this will lead to a socket that is too large at that level. Additionally, because the error is not consistently applied to other circumferences at all levels, this makes it harder to identify, and consequently more difficult to solve.
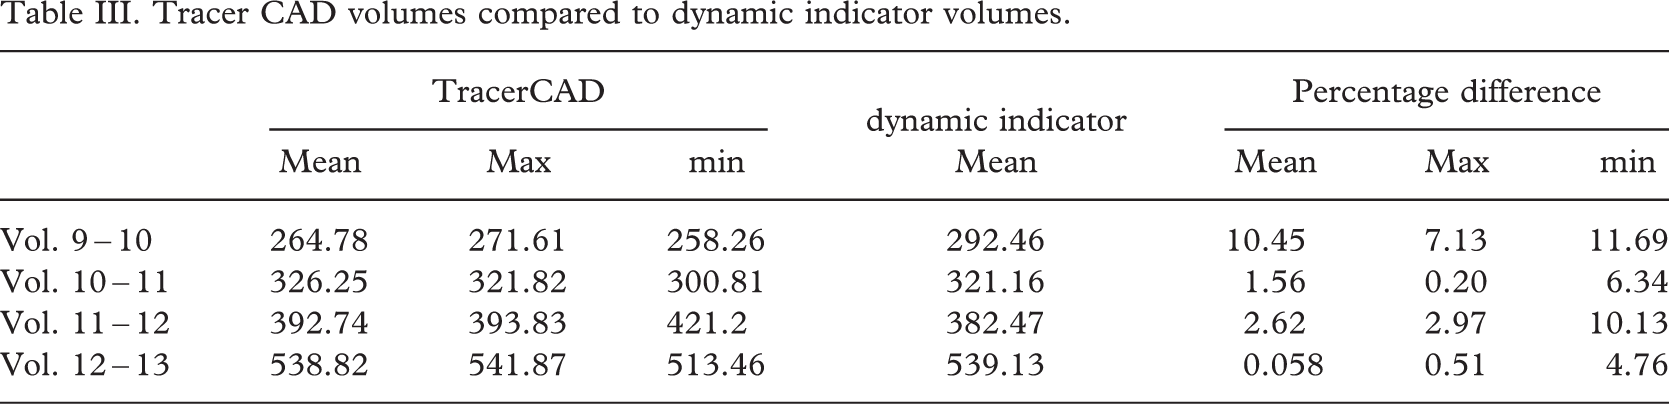
In the clinical situation, a prosthetist would only scan an individual once, rather than take the mean value of 30 traces, and therefore the individual peak value could be the one which is utilized to make a prosthetic socket. Comparison shows (Table III), that increased accuracy is obtained by retracing the model a number of times which assists in averaging any spurious errors made in individual traces.
Perhaps it may be argued that future CAD systems allow the user to sample multiple inputs of data. This will have the desired effect of reducing individual error and promote increased accuracy. This argument may have implications in both contact and non contact data capture depending on the accuracy of future systems.
The volume is derived from the diameters and the lengths between known points. It must be therefore that factors affecting the length and the diameter of each segment affect the volume calculated.
When volumes were compared on a simple cylindrical model (McGarry and McHugh 2005) the difference in average volume between measured results and TracerCAD scans was between 0.20% and −1.96%. Individual trace volumes varied between −0.0085% and −4.50%. Individual tests showed that all maximum volume percentage differences measured greater than 3%.
On the more complex trans-tibial model the mean volume difference varied between 0.06% and 10.45%, individual TracerCAD volumes varied by a maximum of 11.69% (Table III).
Tracer CAD volumes compared to dynamic indicator volumes.
Most volumes measured by TracerCAD were different from those of the actual model. This may in part be due to manual positioning of landmarks. If the distance between landmarks is not absolutely constant, then the volume measured will not be the same. Where landmarks are closer together, smaller volumes will be measured and vice versa (Table IV).
Mean, min, max and SD of TracerCAD lengths to distal end from levels 9 – 13 (mm).
Volume differences are important when considering prosthetic fit. Lilja and Oberg (1997) equated the volume of one terry towelling sock to an increase of approximately 5% of typical residual limb volume. Maximum TracerCAD volume variations on individual tracings of a trans-tibial cast would be clinically significant at 11.69% as at least two socks would be required between these landmarks to provide an optimal fit. However, clinically the picture becomes less clear when this variation is not consistently affecting all other volumes on the same trace (Table III). Mean TracerCAD volumes varied between 10.45% (volume 9 – 10) and 0.057% (volume 12 – 13). The range increased when minimum and maximum TracerCAD volumes were compared to dynamic indicator volumes. (Range 0.51 – 11.69%)
To illustrate the clinical relevance and complexity of incorrect volume capture, an example is given of two individual traces (Table V). The approximate number of socks required based on approximately 5% volume per sock is also indicated.
Individual TracerCAD tracings 17 and 21: Volume comparison.
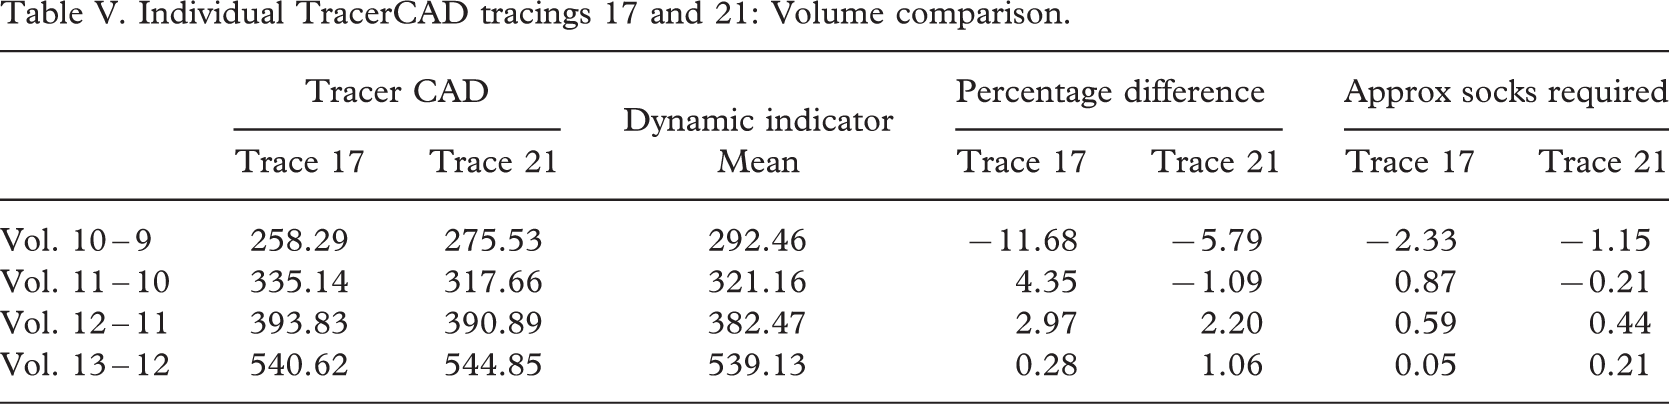
This table illustrates the complexity of volume variation at each level. Clinically this would be difficult to identify, and compensate for given that the percentage difference is not constant over the entire model. Both individual tracings also illustrate that the model appears to have the largest difference in volume at the most distal part of the cast. This may be due to a bending moment on the cast as the prosthetist applies pressure during the trace. More consistent results are shown on the more proximal volumes; however, sockets manufactured using either trace may prove to be too tight distally causing discomfort to the user, resulting in unsuccessful fitting of the prosthesis.
All tests were carried out on a hard model. Logically one might expect increased error from tissue deformation when tracing a prosthetic residual limb.
Manual tracing of the model may result in greater pressure being applied than optimally preferred. This may also result in an incorrect volume being recorded, as both ML and AP diameters may be affected.
A non-contact scanning system may solve some of the problems associated with tracing as it is a challenge for the operator to maintain a consistent pressure during the tracing process (Zheng et al. 2001).
In producing prosthetic sockets which are compatible with liner technology it may be necessary to reduce a socket by a percentage value. Whilst the TracerCAD may currently be one of the most convenient methods of completing this task, difficulties may be experienced in replication of socket fit should values vary from the initial digital mapping or tracing method.
It is debatable whether the above differences in socket dimensions, are significant in the manufacture of prosthetic sockets as it has yet to be established whether a patient could detect such differences in the fit of the prosthesis.
However, the ideal way in which to capture the shape of the stump is still debated. One opinion may be that the basis for measuring a patient's residual limb should be repeatable and accurate, in spite of the prosthetist who takes measures. If variations are introduced in the scanning technique then this leads to variation in the starting ‘digital’ map. This means that if a patient is cast or scanned a number of times, each cast and, therefore each digital map will be slightly different (Smith and Burgess 2001).
Conclusion
This experiment was designed to investigate the repeatability and accuracy of the TracerCAD scanning technique on a trans-tibial model of determinable volume.
Differences between TracerCAD diameters have increased on the more detailed trans-tibial model when compared to the cylindrical model (McGarry and McHugh 2005, 2007). TracerCAD results showed varying results between ML and AP model dimensions which may affect the final shape and volume of the digitized model.
Application of landmarks may also have an effect on the actual measurement taken. The circumference and volume of the model is derived from the diameters between known points. It must be therefore that factors affecting the position of the landmark and the diameter at that point also affect the circumference and volume calculated.
Prosthetists should note that differences may exist in tracing results due to the ‘hands on’ nature of the tracer design. This may be due to pressure applied during the trace (not tested in this paper), or individual marking of landmarks. Incorrect positioning of landmarks may affect the position of measurement, or the axis on which the measurement is taken.
Individual trace discrepancies are relevant since each patient is measured only once. In the clinical situation, measurement of stump volume is important in determining the correct volume of the socket. If incorrect, this could lead to a socket which is either too loose or tight. If volume measurement is inconsistent, determining the optimum volume and therefore ideal fit of the prosthesis, when using Tracer CAD is made more difficult.