
Abstract
The objective of this study was to investigate the variation of measurements recorded when four different users of the TracerCAD system trace a model of known dimensions and volume. This complements a previous study where the accuracy and consistency of a single user was measured. Landmarks were added to indicate proximal, distal, anterior, medial and lateral regions of a specially manufactured cylindrical nylon 6.6 model. Four circumferential lines were added at regular intervals along the length of the cylinder with a view to calculating diameters and volumes relative to these landmarks. The model was measured using a comparator with guaranteed accuracy to one hundredth of a millimetre, and was traced using the TracerCAD system by four different users. The difference in mean volume between measured results and TracerCAD scans of differing users ranged to −3%. Individual trace volumes varied by up to −7.85%. In all volumes measured, 11 out of 12 maximum volume percentage differences measured greater than 2%, and of these, seven results showed maximum volume percentage difference to measure greater than 4%.
Keywords
Introduction
There are a number of different CAD/CAM systems designed for use in prosthetics and orthotics. The TracerCAD system is one of the most widely used CAD/CAM systems available. The system is currently employed in clinical practice in several prosthetics and orthotics centres in the UK and throughout the world.
TracerCAD allows a prosthetist an alternative method of producing a prosthetic socket. The system features a hand held ‘pen’ which is passed over the patient's stump to capture or ‘trace’ its shape and recorded on computer. A range of on-screen modification tools allows the user to then modify the shape displayed on the computer screen. When modification is complete, a positive model may be produced using a computer controlled carving machine.
McGarry and McHugh (2005) investigated the repeatability and accuracy of the TracerCAD scanning technique on a model of determinable volume. This study concluded that differences may exist in tracing results due to the ‘hands on’ nature of the tracer design. This may be due to pressure applied during the trace or individual marking of landmarks, which may alter the position of measurement or the axis on which the measurement takes place.
TracerCAD showed varying results between ML and AP dimensions taken on the same trace. ML and AP dimensions varied when compared to each other and when compared to those taken by metrology. Mean differences between AP and ML diameters were less than 1 mm when compared to metrology results; similarly the mean volume percentage difference varied by up to −1.96%. It is debatable whether such differences are clinically significant in the manufacture of prosthetic sockets as it has yet to be established whether a patient could detect such differences in the fit of the prosthesis. However, it may be that, in the process of digitizing a limb, differences may occur between users when tracing due to the fact that landmarks may be applied differently and different pressure may be applied by different users. Klasson (1985) pointed out that the ability to reproduce a prosthetic socket will be a key feature of the future of CAD systems in prosthetics. However, Brncick (2000) states that prosthetists have not yet been able to quantify how a socket fits, and are therefore unable to classify the very fundamental concepts of what constitutes a good fitting socket. Furthermore he argues that if the perfect socket can be supplied to one patient, why is it not possible to do this for all patients? Additionally why does it not seem possible to replicate a good socket for the same patient with subsequent prostheses?
One opinion may be that the basis for measuring a patient's stump should be repeatable and accurate, in spite of the prosthetist who takes measures. If a variation is introduced in the scanning technique then this will lead to different scans being taken. If a patient is cast ten times, each cast and therefore each digital map will be slightly different (Smith and Burgess 2001).
He et al. (1999) and Hastings and Vannah (1998) both argue that since getting hold of data is the necessary first stage of any CAD/CAM process, with the resulting socket depending upon the data acquired, the accuracy and precision of the way the data is acquired is central to the final socket production.
It is still debated as to which is the best method for acquisition of data (Johansson and Oberg 1998). Contacting methods may seem less alien to prosthetists and patients, but may introduce dimensional errors due to deformation of the soft tissues, while non-contacting optical scanning may enable measurement of greater precision (Lilja and Oberg 1995).
The aim of this study is to compare the repeatability of a series of tracings of a model of known dimensions. A hard model was used because, at this stage, the inherent accuracy of the system is being tested. Four different users were selected, each with differing experience in using TracerCAD.
Method
A solid cylinder was manufactured in natural Nylon 6.6 to the dimensions shown in Figure 1.
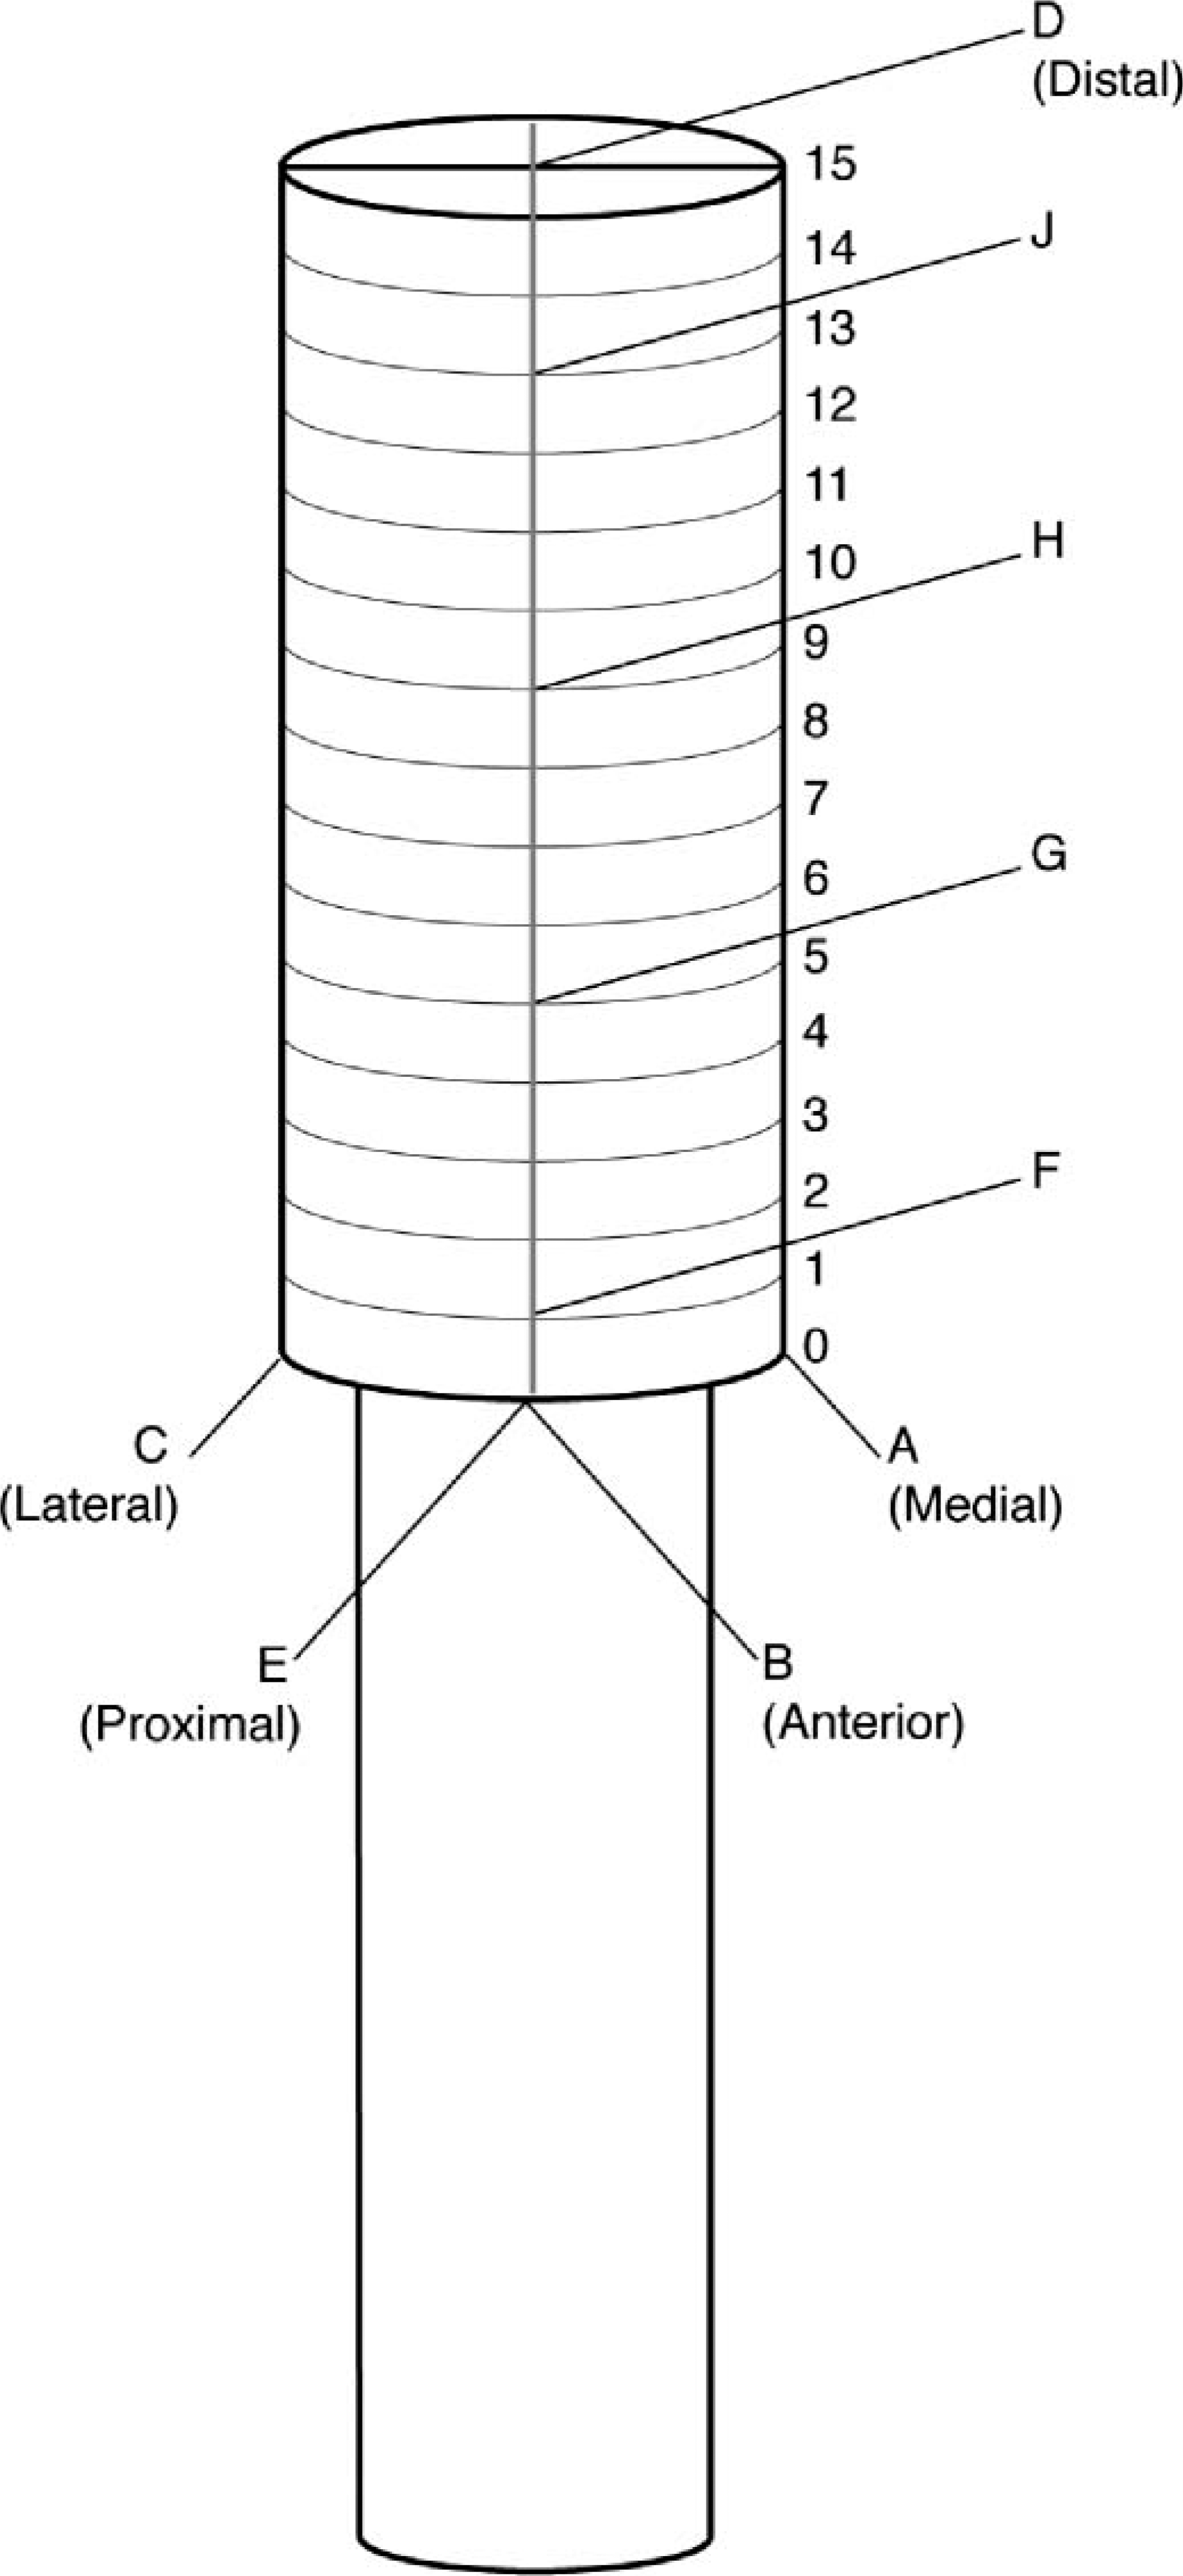
Test model.
The model was given to a metrology laboratory for accurate placement of datum lines and reference points to allow the model to be measured. All measurements were repeated ten times.
Three datum lines, (A, B, and C) were marked along the length of the cylinder at 90° intervals to be used as medial (A), anterior (B) and lateral (C) reference lines. Fourteen circumferential lines were accurately measured and marked at 10 mm intervals on the model. The diameter of the shape was measured on each of these intervals from point 1 to point 14 on datum lines A and B. As both points 0 and 15 lay on the edge of the model, both were discounted to avoid possible error.
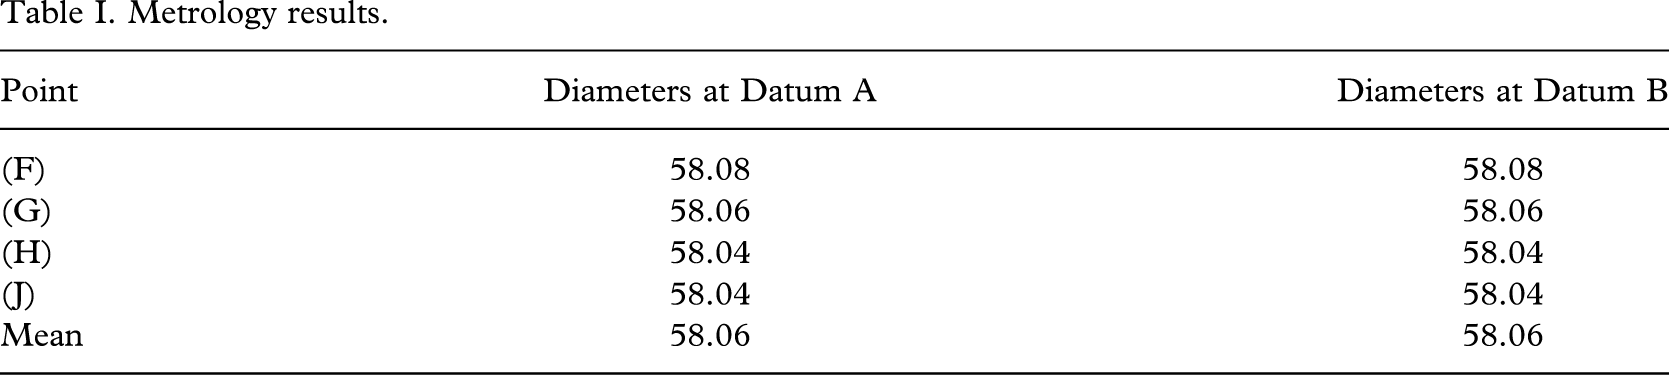
The volume of the shape was then determinable between any two points between 1 and 14 on the model. This was completed by the metrology laboratory using a comparator accurate to 10 microns (Table I). The comparator was routinely checked at regular stages throughout the measuring procedure to ensure accuracy.
Metrology results.
The distal (D) and proximal (E) landmarks were also precisely indicated. Four further reference points, (F, G, H, J) were also marked precisely to enable comparison of data at these levels. These points were identified as follows:
(F) Intersection of the 10 mm line (1) and anterior line (B),
(G) Intersection of the 50 mm line (5) and anterior line (B),
(H) Intersection of the 90 mm line (9) and anterior line (B),
(J) Intersection of the 130 mm line (13) and anterior line (B).
The ML diameters and the AP diameters were re-measured to check that the model was truly cylindrical. Diameter measurements were taken at the levels of F, G, H, and J in both AP and ML planes using an electronic digital calliper with resolution and accuracy as follows:
No difference was noted between AP and ML dimensions.
A vice was constructed in wood (Figure 2) to hold the model, receiver and transmitter in the desired position in order to eliminate error due to the relative movement of these items during the procedure. The room was a large clinical area and all metal objects were removed as far as was practical, to reduce the chance of interference. Medial, anterior and lateral reference points were identified using the intersection of the 40 mm point and lines A, B, and C respectively. The distal landmark was marked on the model at the intersection of datum line B with the 0 mm circumferential line.
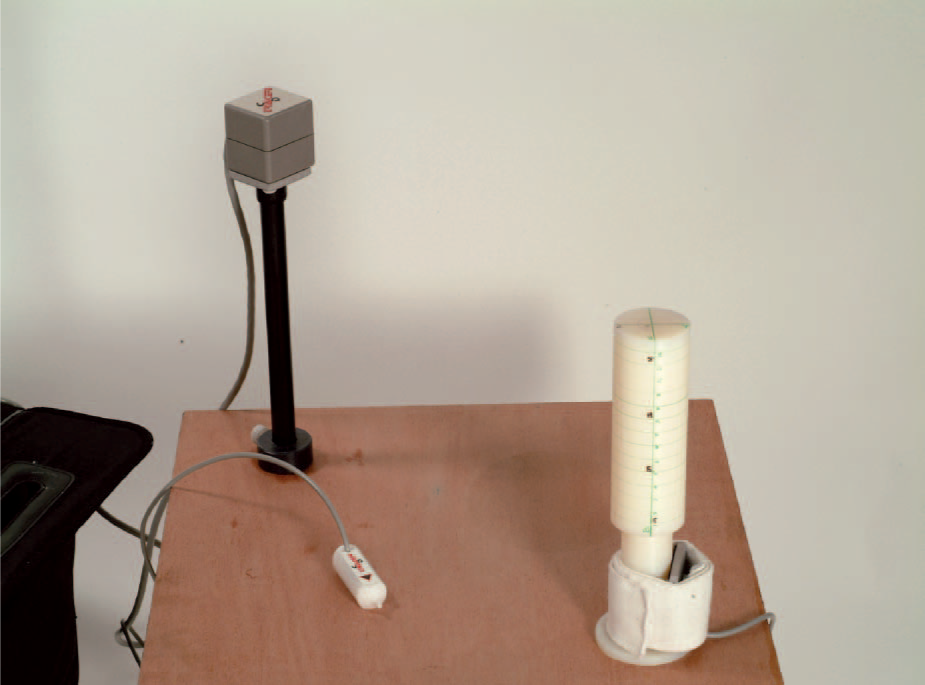
Vice constructed in wood.
The shape was then scanned using the TracerCAD system a total of 15 times by each of four different individuals of different expertise in using the system and in prosthetics.
Volume, circumferences and diameters at three levels were indicated and recorded.
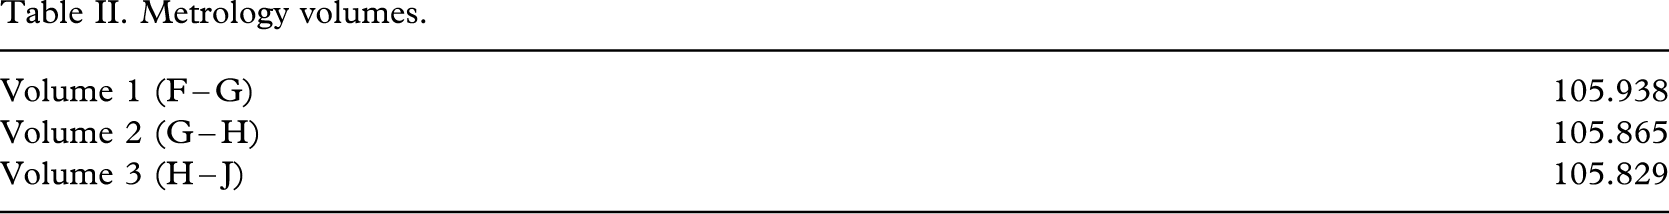
All tracings were carried out following a strict protocol to minimize the possibility of error. As TracerCAD calculates volumes from a fixed point to the end of the model, it was necessary to calculate the volumes of intermediate sections of the model by subtraction. For example: Volume JF – Volume JG=Volume 1, Volume JG – Volume JH=Volume 2, and Volume JH=Volume 3. Metrology volumes have already been calculated (Table II).
Metrology volumes.
Results
The diameters determined by the comparator are listed in Table I. Although every effort was made to produce a true cylinder it can be seen that the resulting model was slightly tapered. The maximum difference in diameters was less than 0.1% of the mean diameter. However, for best accuracy, the model was treated as the frustum of a cone rather than a cylinder for volume calculation.
The volume of the model at regular levels F – G, G – H, H – J was calculated using the mathematical formula for the frustum of a cone to one hundredth of a millimetre:

The calculated volumes are displayed in Table II.
In order to interpret the results, comparisons of AP and ML diameters were made at each of the reference points F, G, H, and J. Each volume determined by each TracerCAD user was compared to the metrology volumes 1, 2, and 3.
A comparison of diameters obtained by TracerCAD is shown in Table III.
Table of minimum, maximum, and mean discrepancies between ML and AP obtained by TracerCAD (mm).
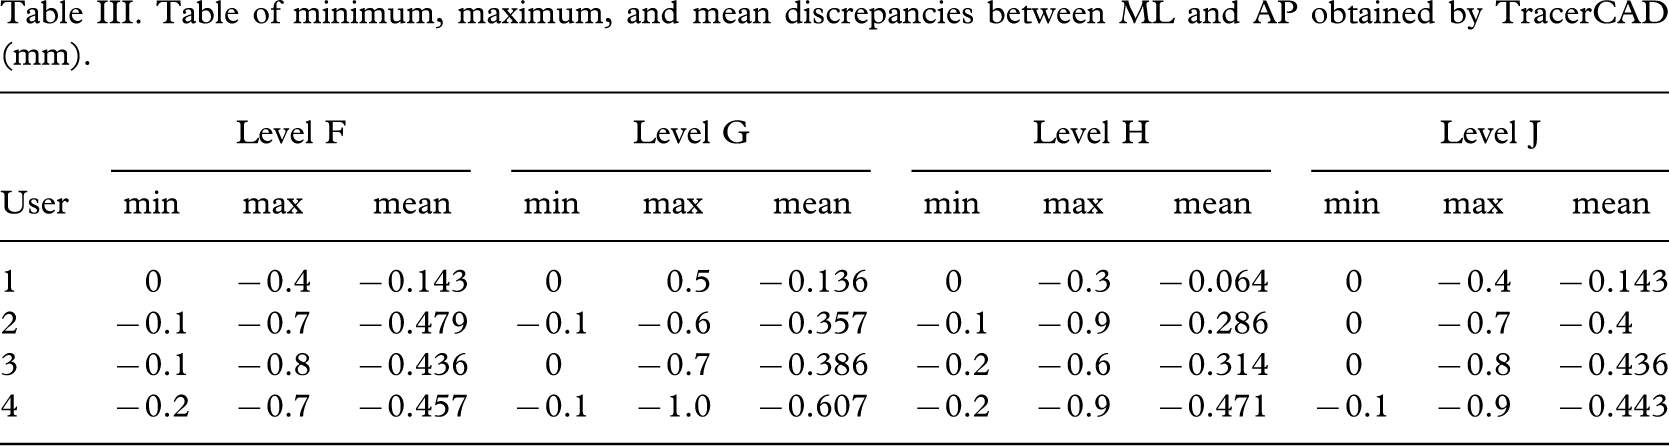
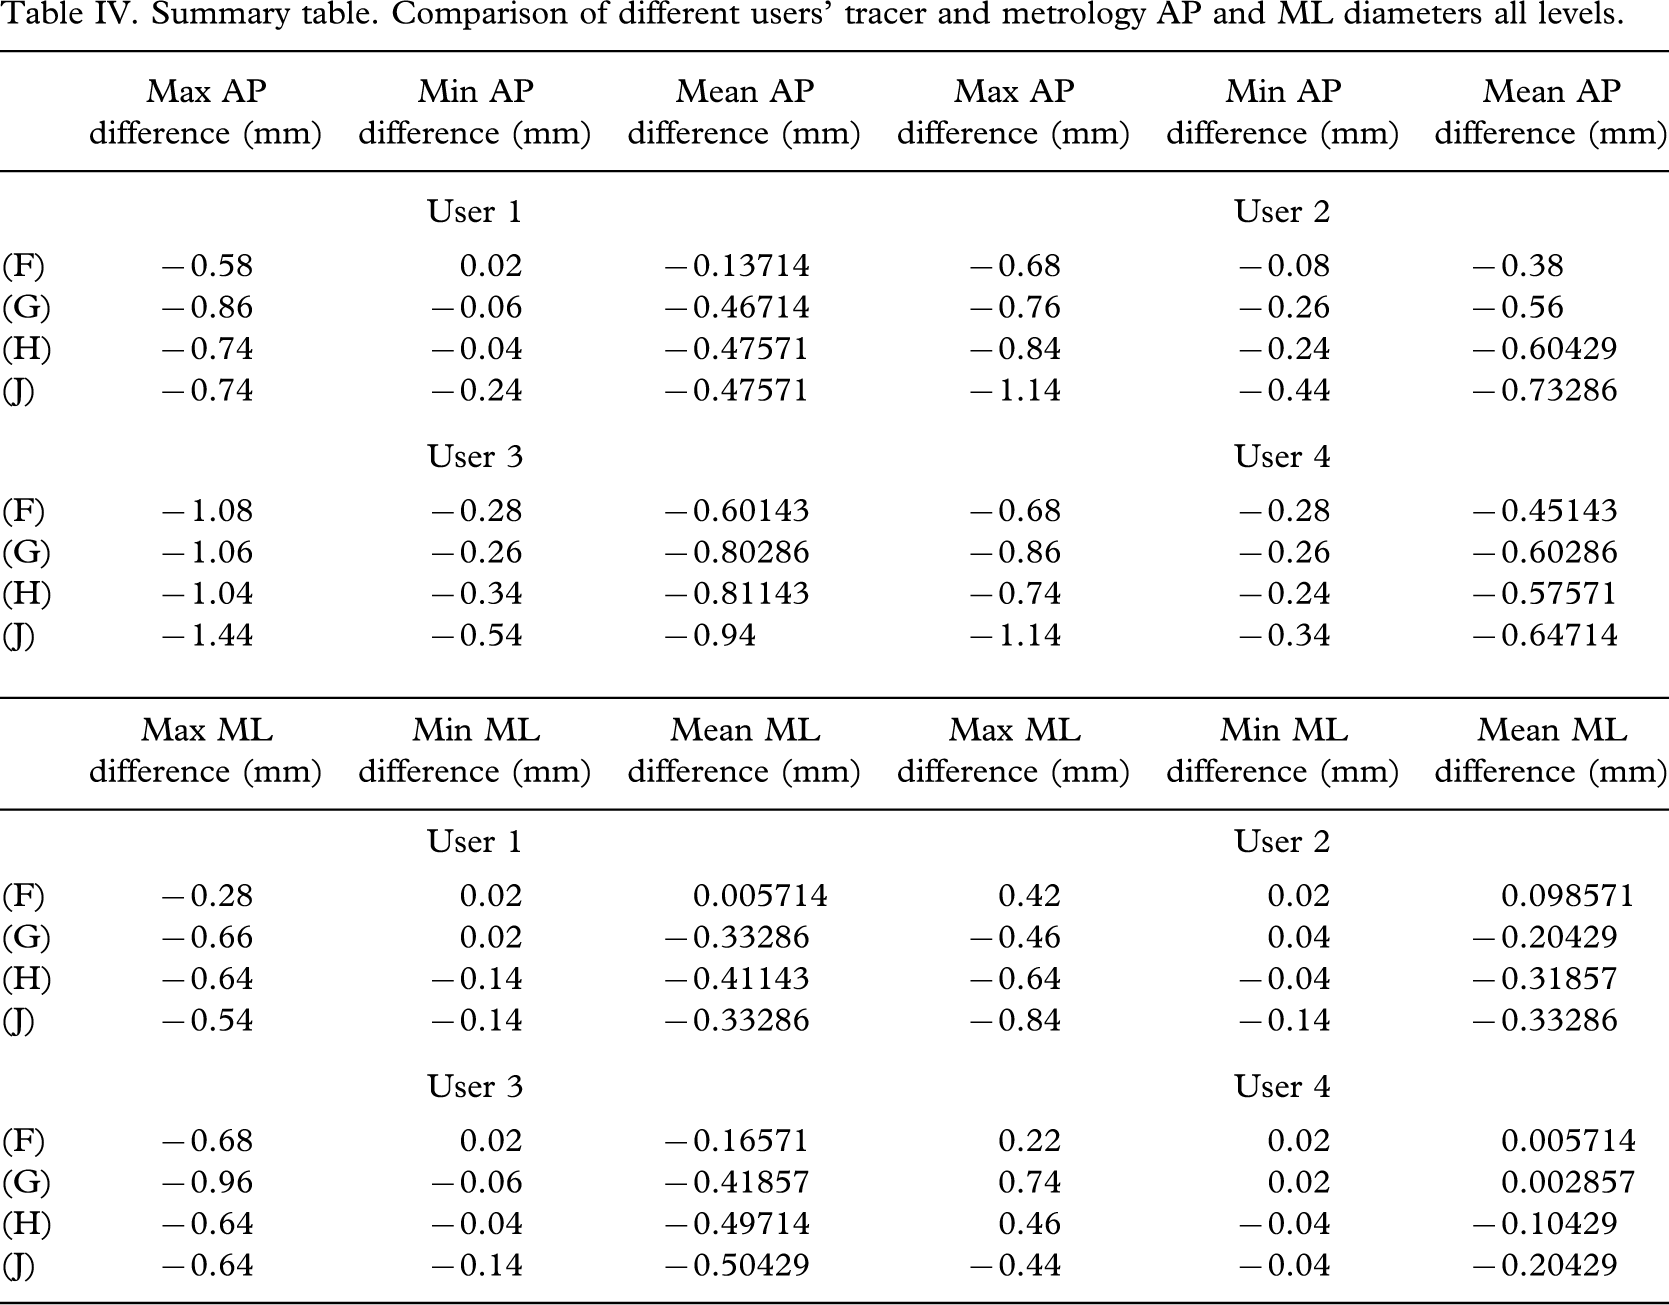
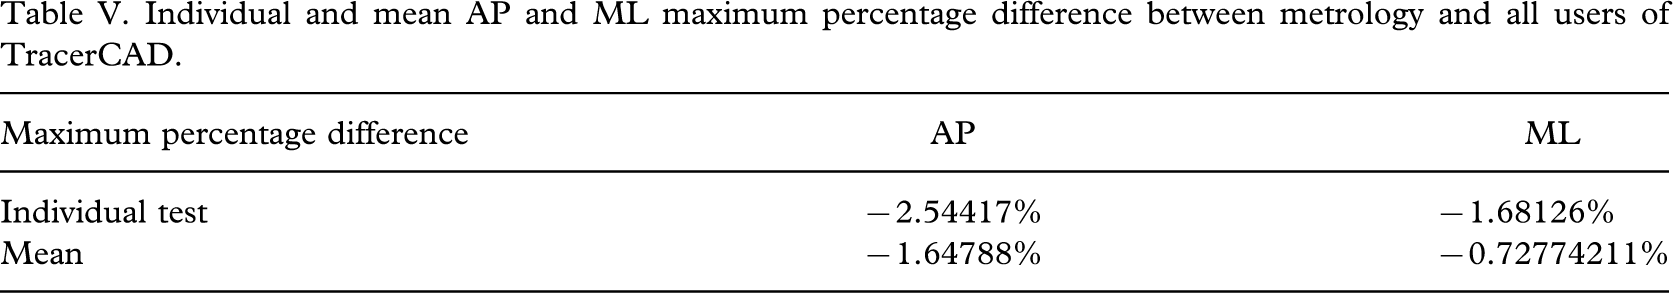
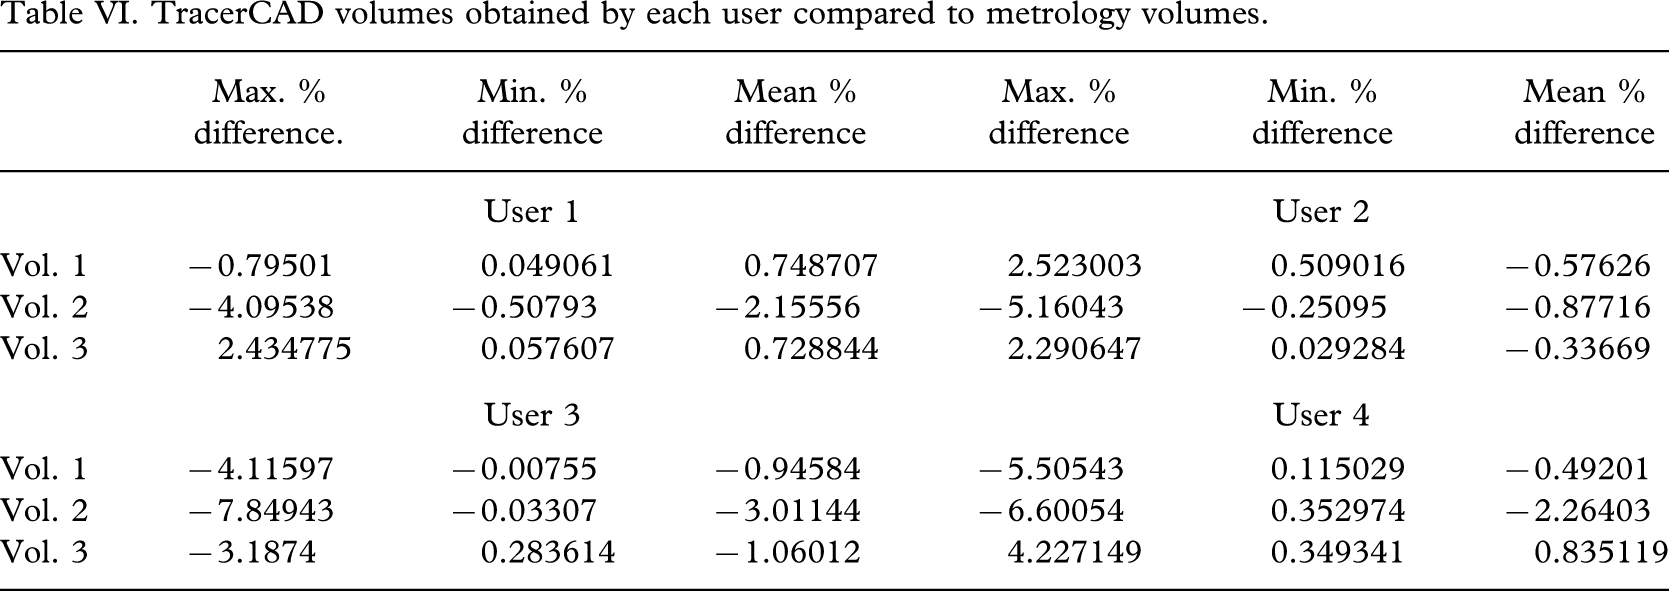
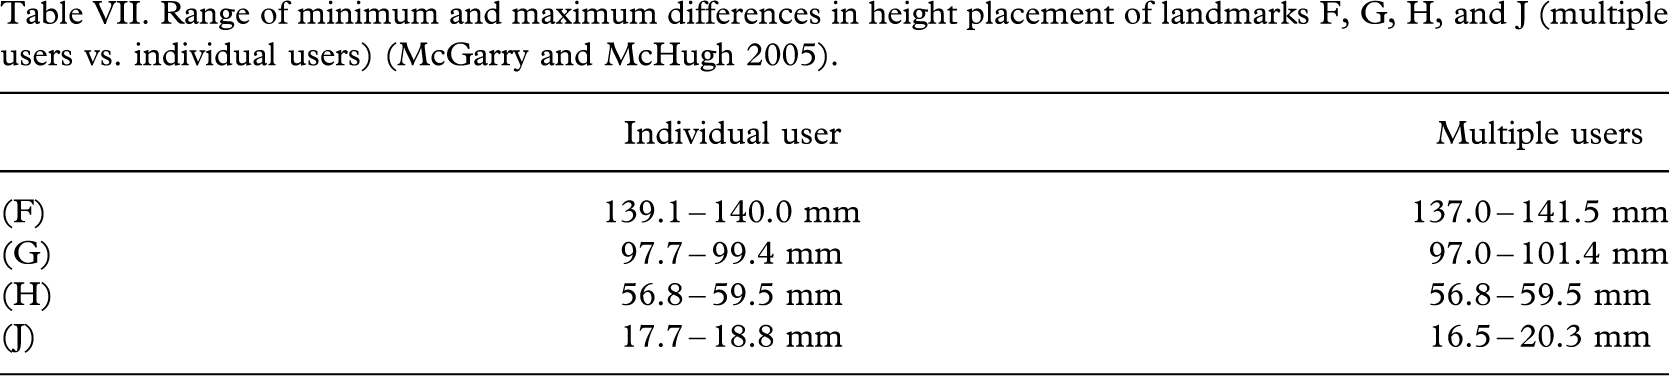
Table IV shows a comparison of TracerCAD and metrology AP and ML diameters for the different users; Table V shows the individual and mean AP and ML maximum percentage differences between metrology and all users of TracerCAD; Table VI shows the TracerCAD volumes obtained by each user compared to metrology volumes; and Table VII shows the range of minimum and maximum differences in height placement of landmarks F, G, H, and J (multiple users versus individual users) (McGarry and McHugh 2005).
Summary table. Comparison of different users' tracer and metrology AP and ML diameters all levels.
Individual and mean AP and ML maximum percentage difference between metrology and all users of TracerCAD.
TracerCAD volumes obtained by each user compared to metrology volumes.
Range of minimum and maximum differences in height placement of landmarks F, G, H, and J (multiple users vs. individual users) (McGarry and McHugh 2005).
Discussion
The AP and ML dimensions obtained using TracerCAD were different having been shown to be equal using metrology and digital calliper measurement. The maximum discrepancy was −1.0 mm; the minimum discrepancy was 0 mm (obtained in 7 of the 12 tests) (Table III).
The range of difference between the AP and ML measurements had a tendency to increase as the trace moved more distally from level F toward level J (Table III). This may be a result of an increasing bending moment on the model, which may in turn be due to the amount of distal pressure placed on the model by the user as they reach the distal portion. Should pressure increase on the distal end of a trans-tibial stump, then there may be more likelihood of the soft distal tissue deforming. This may lead to shape or volume discrepancies at the distal end of a socket.
The effect of pressure is outside the scope of this experiment. The pressure of the trace may, however, prove very important in a clinical environment since the patient's stump will consist of varying tissue density as opposed to the hard nylon model used in this study.
Most minimum and maximum discrepancies between ML and AP obtained by TracerCAD were negative when compared to metrology measurements. This means that in the majority the trace is effectively smaller than the actual model. This would have a similar effect on the volumes calculated, making them smaller (Table III).
It is important to consider that should AP and ML both be equally incorrect, then the difference between the two will still be zero. Therefore it may be more important to compare the mean AP and ML percentage difference between metrology and all users of TracerCAD.
The largest percentage difference of all users, when comparing AP metrology and AP tracer was −2.54417% or −1.44 mm and when comparing ML metrology and ML tracer was −1.68126% or −0.96 mm (Table V).
The largest percentage differences in individual tracings were significantly higher than that of the average percentage difference calculated over 15 tests (Table IV).
It should be noted that the majority of maximum percentage differences are of negative value. This should have the effect of reducing the size of the model on screen and should also affect the volumes of the model calculated in that one would expect these to be smaller.
In the clinical situation, a prosthetist would only scan an individual once, rather than take the mean value of 15 traces, and therefore the individual peak value could be the one which is utilized to make a prosthetic socket. Comparison shows (Table V) that increased accuracy is obtained by retracing the model a number of times which assists in averaging any spurious errors made in individual traces.
Perhaps it may be argued that future CAD systems allow the user to sample multiple inputs of data. This will have the desired effect of reducing individual error and promote increased accuracy. This argument may have implications in both contact and non contact data capture depending on the accuracy of future systems.
Differences between the mean TracerCAD AP diameter and the metrology AP diameter differed by a maximum of −0.94%, user 3, level J and ML diameter differed by a maximum of −0.5%, in user 4, level G (Table IV).
It can be seen that the positioning of landmarks is relatively similar by examining their distances from the distal end (Figure 1). Although care was taken to ensure exact positioning of each landmark at the corresponding point on the model, positioning varied (Table VII).
This may result in measurements being taken at differing levels and could account for some discrepancy between AP and ML metrology and TracerCAD diameters.
Table VII compares the maximum and minimum distance to the end of the model for each user. In addition, these results have been compared to those from a previous study by McGarry and McHugh (2005), which shows the same results for an individual user.
We can infer from the table that the difference between the highest and lowest point on the model marked, increases with the number of users. This is due to the increased error of not placing landmarks in the same position. If the landmarks are different, a different measurement will be taken. The Table shows therefore, that multiple users have a reduced chance of taking the same measure and indicates variation and reduced consistency between users.
The volume is derived from the diameters and the lengths between known points. It must be, therefore, that factors affecting the length and the diameter of each segment affect the volume calculated.
The difference in mean volume between measured results and TracerCAD scans of differing users was between −3.01% and −0.34%. Individual trace volumes varied between −7.85% and 0.008%. In all volumes measured, 11 out of 12 maximum volume percentage differences measured greater than 2%, and of these, seven results showed maximum volume percentage difference to measure greater than 4% (Table VI). This compares to an individual user where individual trace volumes varied between −4.50% and −0.0085% and all maximum volume percentage differences measured greater than 3%.
Most volumes measured by TracerCAD were different than those of the actual model. This may in part be due to manual placement of the landmarks. If the distance between landmarks is not absolutely constant, then the volume measured will not be the same. Where landmarks are closer together, smaller volumes will be measured and vice versa.
In relation to prosthetics, it should be noted that all differences are small and may not be significant when compared to conventional casting methods. Convery et al. (2003) quantified the variation in an individual prosthetist's rectification and suggested that the consistency of rectification of a particular prosthetist may vary by up to 2 cm. The average ML and AP diameters obtained by TracerCAD were up to 1 mm different than those obtained by metrology.
Volume matching and shape capture are crucial to the successful fit of a prosthetic socket. If stump volume is not matched on screen, increased stump socket interface forces may result. Poor socket fit may cause discomfort or tissue breakdown, ultimately leading to the rejection of the prosthesis. It is important that prosthetists are aware of how discrepancies between physical stump measures and measures on screen may affect the fit of the final socket.
In the manufacture of prosthetic sockets, it has not yet been established whether a patient would detect such discrepancies, however it would be of interest to study further the effect of shape and density of further models to investigate if discrepancies would be cumulative.
Conclusion
All minimum and maximum discrepancies between ML and AP obtained by TracerCAD were negative. We can infer from this that the trace may be effectively smaller than the actual model and one may expect that this would have a similar effect on the volumes calculated.
The largest percentage differences in all tests were significantly higher than the mean percentage difference calculated over 15 tests. It should be noted that all maximum percentage differences are of negative value. This should have the effect of reducing the size of the model on screen and should also affect the volumes of the model calculated in that one would expect these volumes to be smaller than the actual model. This may be important in the production of a prosthetic socket.
As a prosthetist would only scan a patient one time in the clinical situation, rather than take an average of a number of traces, an individual peak value could be utilized to make a prosthetic socket.
AP and ML discrepancies may be due to the manual positioning of landmarks. The difference between the highest and lowest point on the model marked, increased with the number of users. If landmarks are different, a different measurement will be taken. The study therefore concludes that multiple users have a reduced chance of taking the same measure.
The volume is derived from the diameters and the lengths between known points. It must be therefore that factors affecting the length and the diameter of each segment affect the volume calculated.
Manual tracing of the model may result in greater pressure being applied than optimally preferred. This may also result in a smaller volume being recorded, as both ML or/and AP diameters may be affected. This experiment was carried out using a hard model that would be difficult to deflect or change shape by exerting pressure.
Footnotes
Acknowledgements
The authors wish to acknowledge Dr Arjan Buis, Dr Kevin Murray and Mr Brian McLaughlin for their assistance with this project. Additional acknowledgement is extended to Mr Jimmy McGregor of the Metrology Department, University of Strathclyde, for his assistance with model measurements.