
Abstract
The objective of this study is to investigate the accuracy of the TracerCAD system in measuring a model of known dimensions and volumes. A cylindrical nylon 6.6 model was prepared. Landmarks were added to indicate proximal, distal, anterior, medial, and lateral. Four additional landmarks were added at regular intervals along the length of the cylinder with a view to calculating diameters and volumes relative to these landmarks. The model was measured using a comparator with a guaranteed accuracy of 0.01 mm and was traced using the TracerCAD system (Test 1). The test was repeated with the model rotated by 90° (Test 2), to determine whether there were any effects related to the orientation of the model in relation to the transmitter. The difference in average volume between measured results and TracerCAD scans was between 0.20% and −1.96%. Individual trace volumes varied between −0.0085% and −4.50%. In all volumes measured in Tests 1 and 2, all maximum volume percentage differences measured greater than 3%.
Keywords
Introduction
It is generally accepted that the quality of fit of a prosthetic socket to the stump has a major influence on the function of the finished prosthesis. In the process of making prostheses, different errors may arise that compromise the final prosthetic fit of the socket (Johansson and Oberg 1998).
In the last decade, CAD/CAM techniques had been introduced in the hope that such techniques would reduce errors in the production process (Johansson and Oberg 1998). The hope also existed that the new technique could be used to complement traditional prosthesis making and be used to give a better understanding of what constitutes an optimal prosthetic socket fit (Lilja and Oberg 1995).
However, CAD/CAM systems have already been criticized as being capable of faster production prosthetic sockets without generally improving the socket fit (Hastings and Vannah 1998). Despite being warned by Michael (1989) that computerization will become commonplace in prosthetics and orthotics in the future, and that practitioners should embrace this new technology, prosthetists have been slow to use the systems due to a lack of understanding of the new technology (Steele 1994).
In order to understand and improve CAD/CAM systems in relation to socket fit, a period of intense exploration and experimentation must be undertaken. This is important in determining what technology has to offer prosthetics and orthotics, and to record successive iterations for future enhancements (Michael 1989). The prosthetics and orthotics industry must advance and take advantage of new technology. Many times, however, as technology strides forward; clinicians are left behind due to a lack of understanding (Steele 1994).
If CAD/CAM is to be used in research and practice, it is necessary to evaluate different kinds of errors associated with this technique. It is important that all new technical systems in prosthetics and orthotics are evaluated with respect to errors of measurement, by independent research groups (Lilja and Oberg 1995).
At present, there are currently a number of different CAD/CAM systems for use in prosthetics and orthotics. The TracerCAD system is one of the leading CAD/CAM systems available. The system is currently employed in clinical practice in several prosthetics and orthotics centres in the UK and throughout the world.
TracerCAD allows a prosthetist an alternative method of producing a prosthetic socket. The system features a hand-held ‘pen' which is passed over the patient's stump to capture or ‘trace' its shape, which is then recorded on a computer. A range of on-screen modification tools allows the user then to modify the shape displayed on the computer screen. When modification is complete, a positive model may be produced using a computer-controlled carving machine.
The aim of this initial study is to compare the repeatability and accuracy of a series of tracings of a model of known dimensions. The initial objective is to evaluate the system. Once this has been completed, further studies will aim to enhance the understanding of socket fit with the aid of CAD/CAM technology.
Method
For ease of calculation of true diameters and volumes, a solid cylinder was manufactured in natural nylon material type 6.6, as shown in Figure 1. The model was given to a metrology laboratory for accurate placement of datum lines and reference points to allow the model to be measured. All measurements were repeated 10 times.
Three datum lines (A, B, and C,) were marked at 90° intervals to be used as medial (A), anterior (B), and lateral (C) reference lines. Fourteen (14) regular 10 mm intervals were accurately measured and marked onto the model (points 0–15.) The diameter of the shape was measured on each of these intervals from point 1 to point 14 on datum lines A and B. As both points 0 and 15 lay on the edge of the model, both were discounted to avoid possible error.
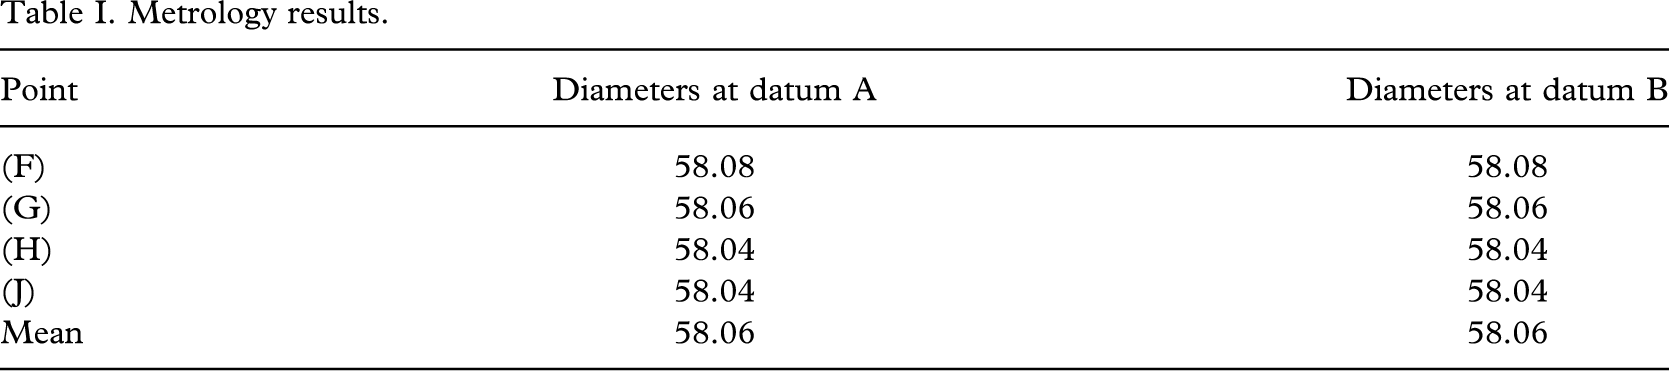
The volume of the shape was then determinable between any two points between 1 and 14 on the model. This was completed by the metrology laboratory using a comparator measuring device accurate to 10 μm (Table I). The comparator was routinely checked at regular stages throughout the measuring procedure to ensure accuracy. The distal (D) and proximal (E) landmarks were also precisely indicated.
Four (4) further reference points, (F, G, H, J,) were also marked precisely to enable comparison of data at these levels. These points were identified as follows:
F: intersection of the 10 mm line (1) and anterior line B;
G: intersection of the 50 mm line (5) and anterior line B;
H: intersection of the 90 mm line (9) and anterior line B;
J: intersection of the 130 mm line (13) and anterior line B.
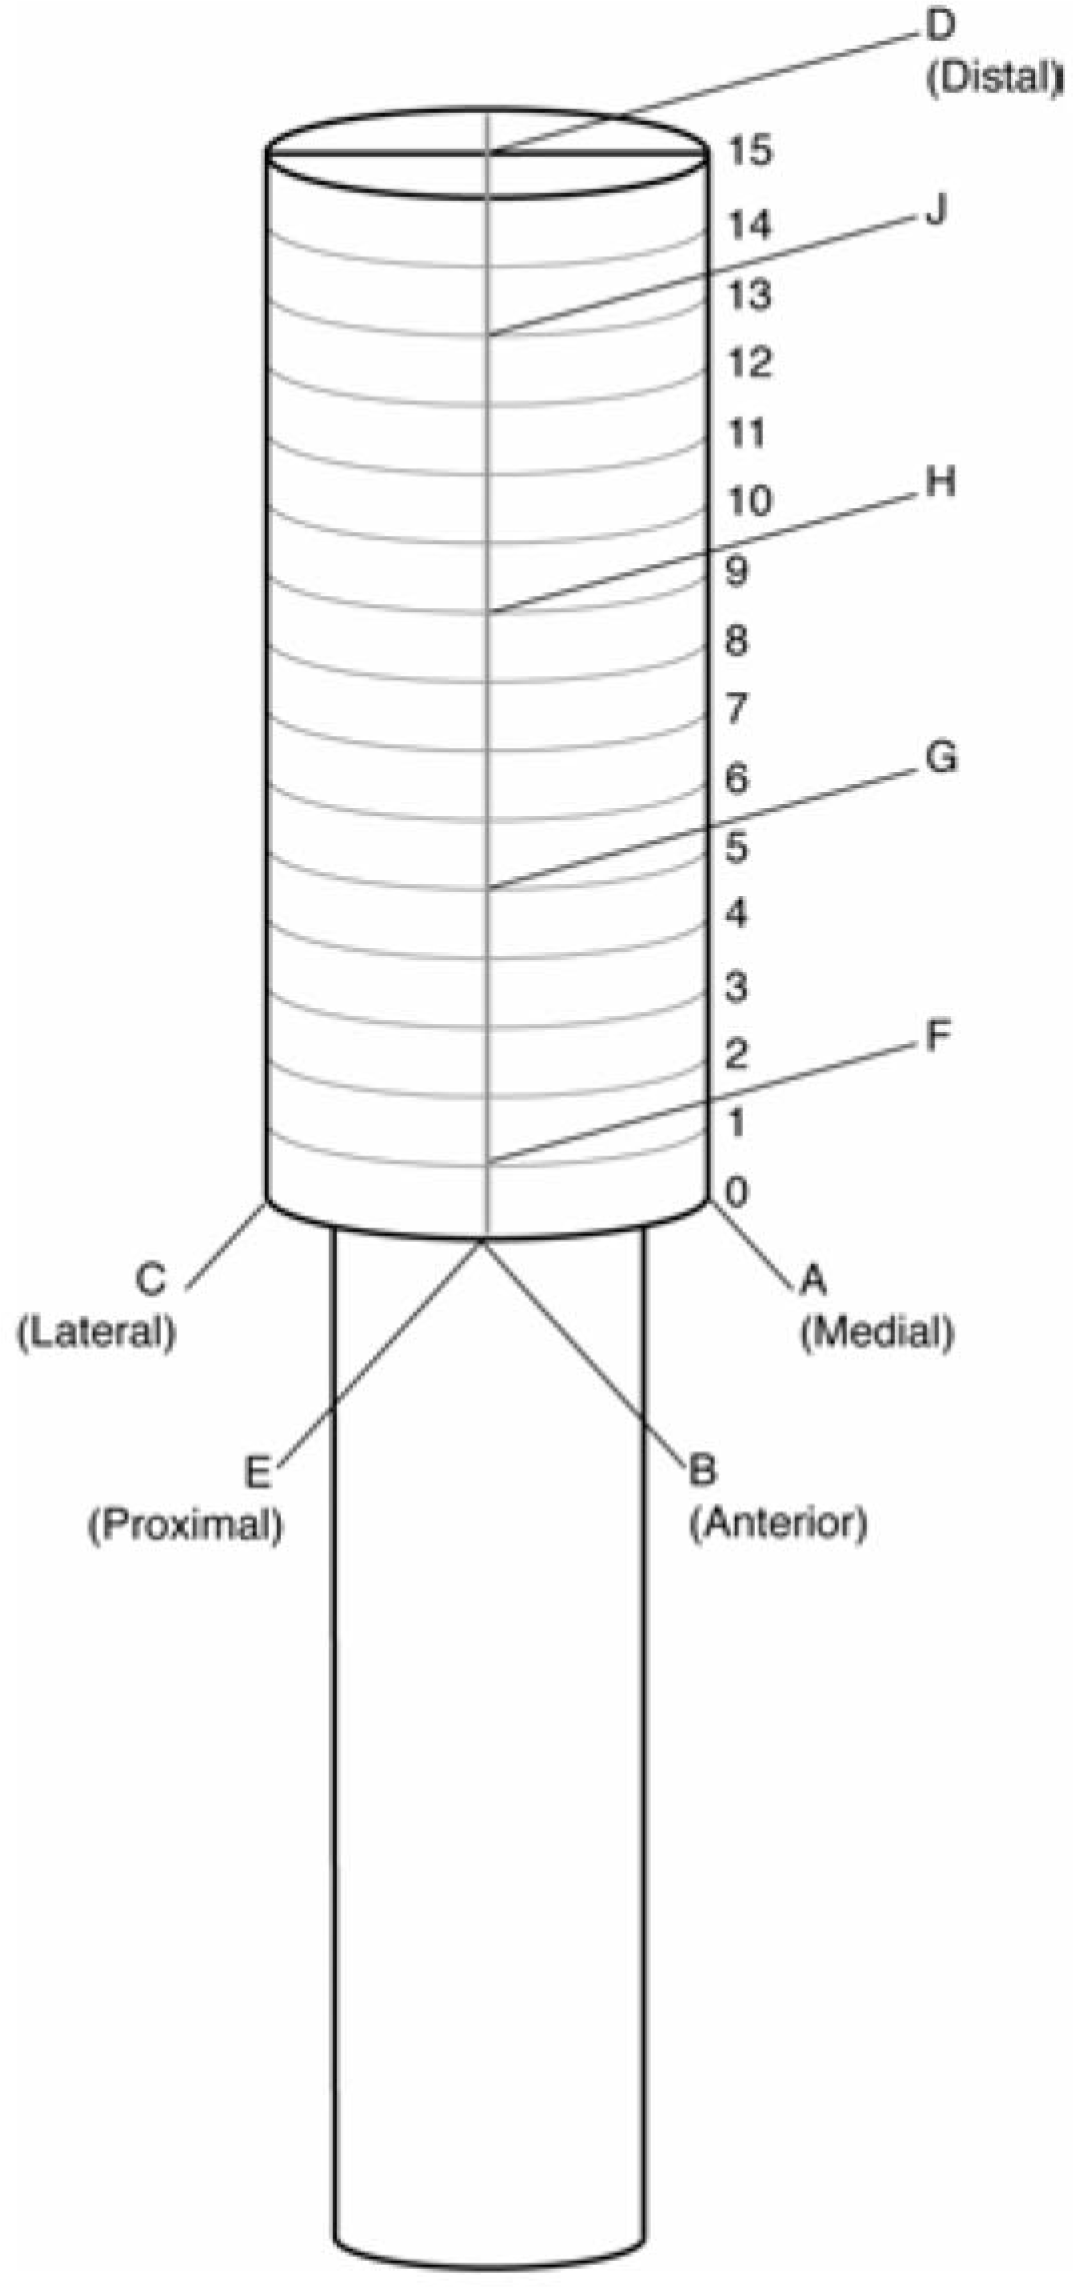
Test cylinder.
Metrology results.
The ML diameters and the AP diameters were re-measured to check that the model was truly cylindrical. Diameter measurements were taken at the levels of F, G, H, and J in both AP and ML planes using an electronic digital calliper with a resolution and accuracy as follows:
measuring range: 0–500 mm; resolution: 0.01 mm;. measuring range: 300–500 mm accuracy: 0.05 mm.
No difference was noted between the AP and ML dimensions.
A vice was constructed in wood to hold the model, receiver, and transmitter in the desired position to eliminate error due to the relative movement of these items during the procedure (Figure 2). The room used was a large clinical area, and all metal objects were removed as far as was practical, to reduce the chance of interference. Medial, anterior, and lateral reference points were identified using the intersection of the 40 mm point and lines A, B, and C, respectively. The proximal landmark was marked on the model at the intersection of datum line B with the 0 mm circumferential line. The shape was then scanned using the TracerCAD system a total of 14 times by one individual and volume, circumferences and diameters at three levels indicated and recorded. Once traced, the model was then rotated through 90° and traced a further 14 times. All tracings were carried out following a strict protocol to minimize the possibility of error.
Results
The diameters determined by the comparator are listed in Table I. Although every effort was made to produce a true cylinder, it can be seen that the resulting model was slightly tapered. The maximum difference in diameters was less than 0.1% of the mean diameter. However, for best accuracy, the model was treated as the frustum of a cone rather than a cylinder for volume calculation.
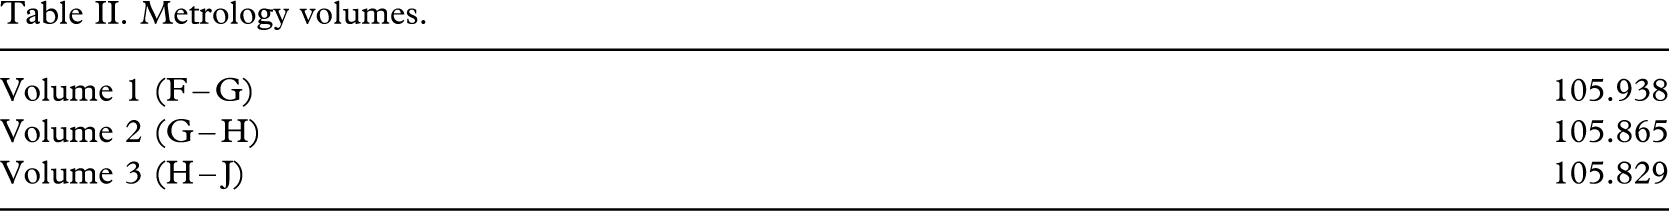
The volume of the model at regular levels F-G, G-H, and H-J was calculated using mathematical formulae for the frustum of a cone to one-hundredth of a millimetre (Table II).

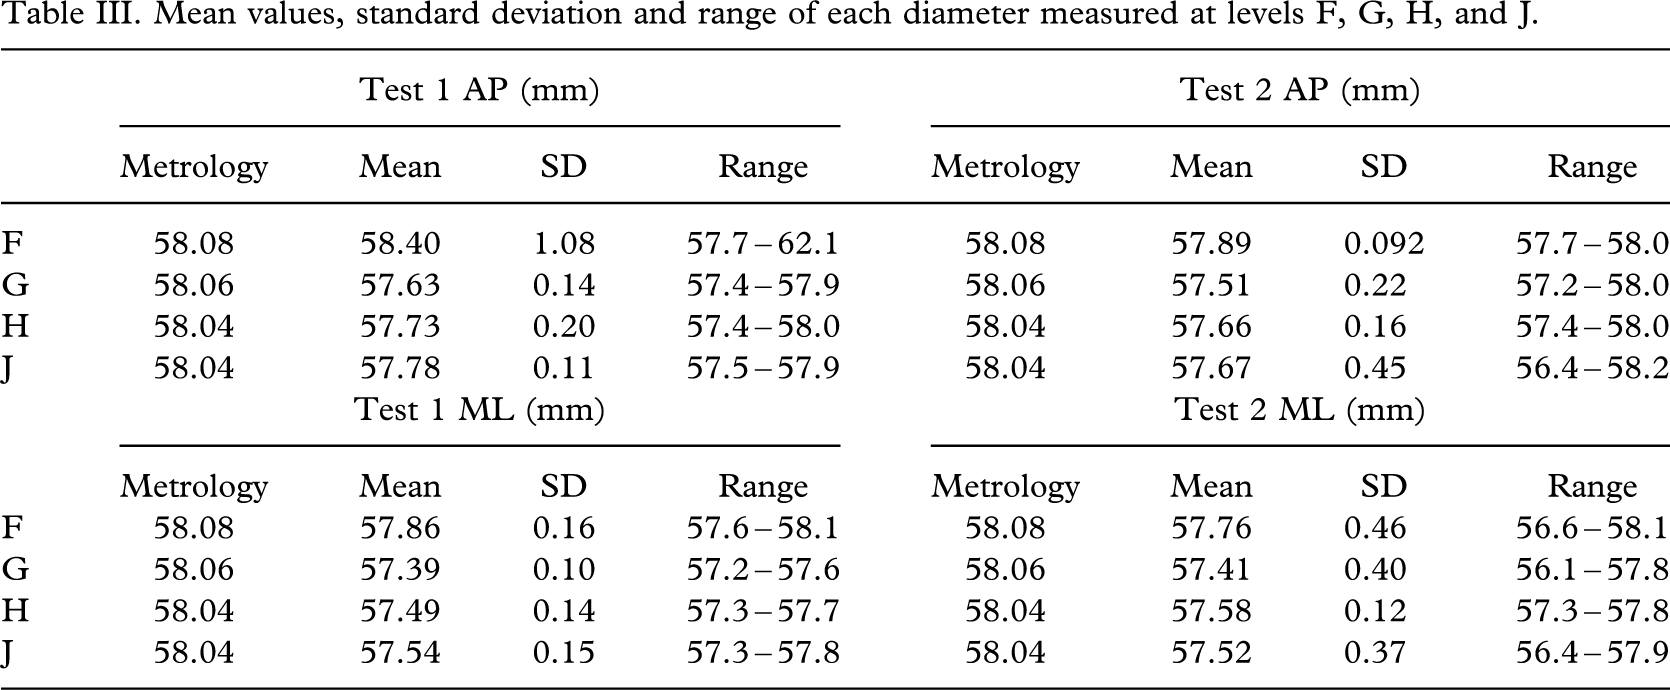
In order to interpret the results, comparisons of AP and ML diameters were made at each of the reference points F, G, H, and J. Each volume determined by TracerCAD was compared with the metrology volumes 1, 2, and 3. The mean values, standard deviation and range of each diameter measured at levels F, G, H, and J are listed in Table III (see also Tables IV and V).
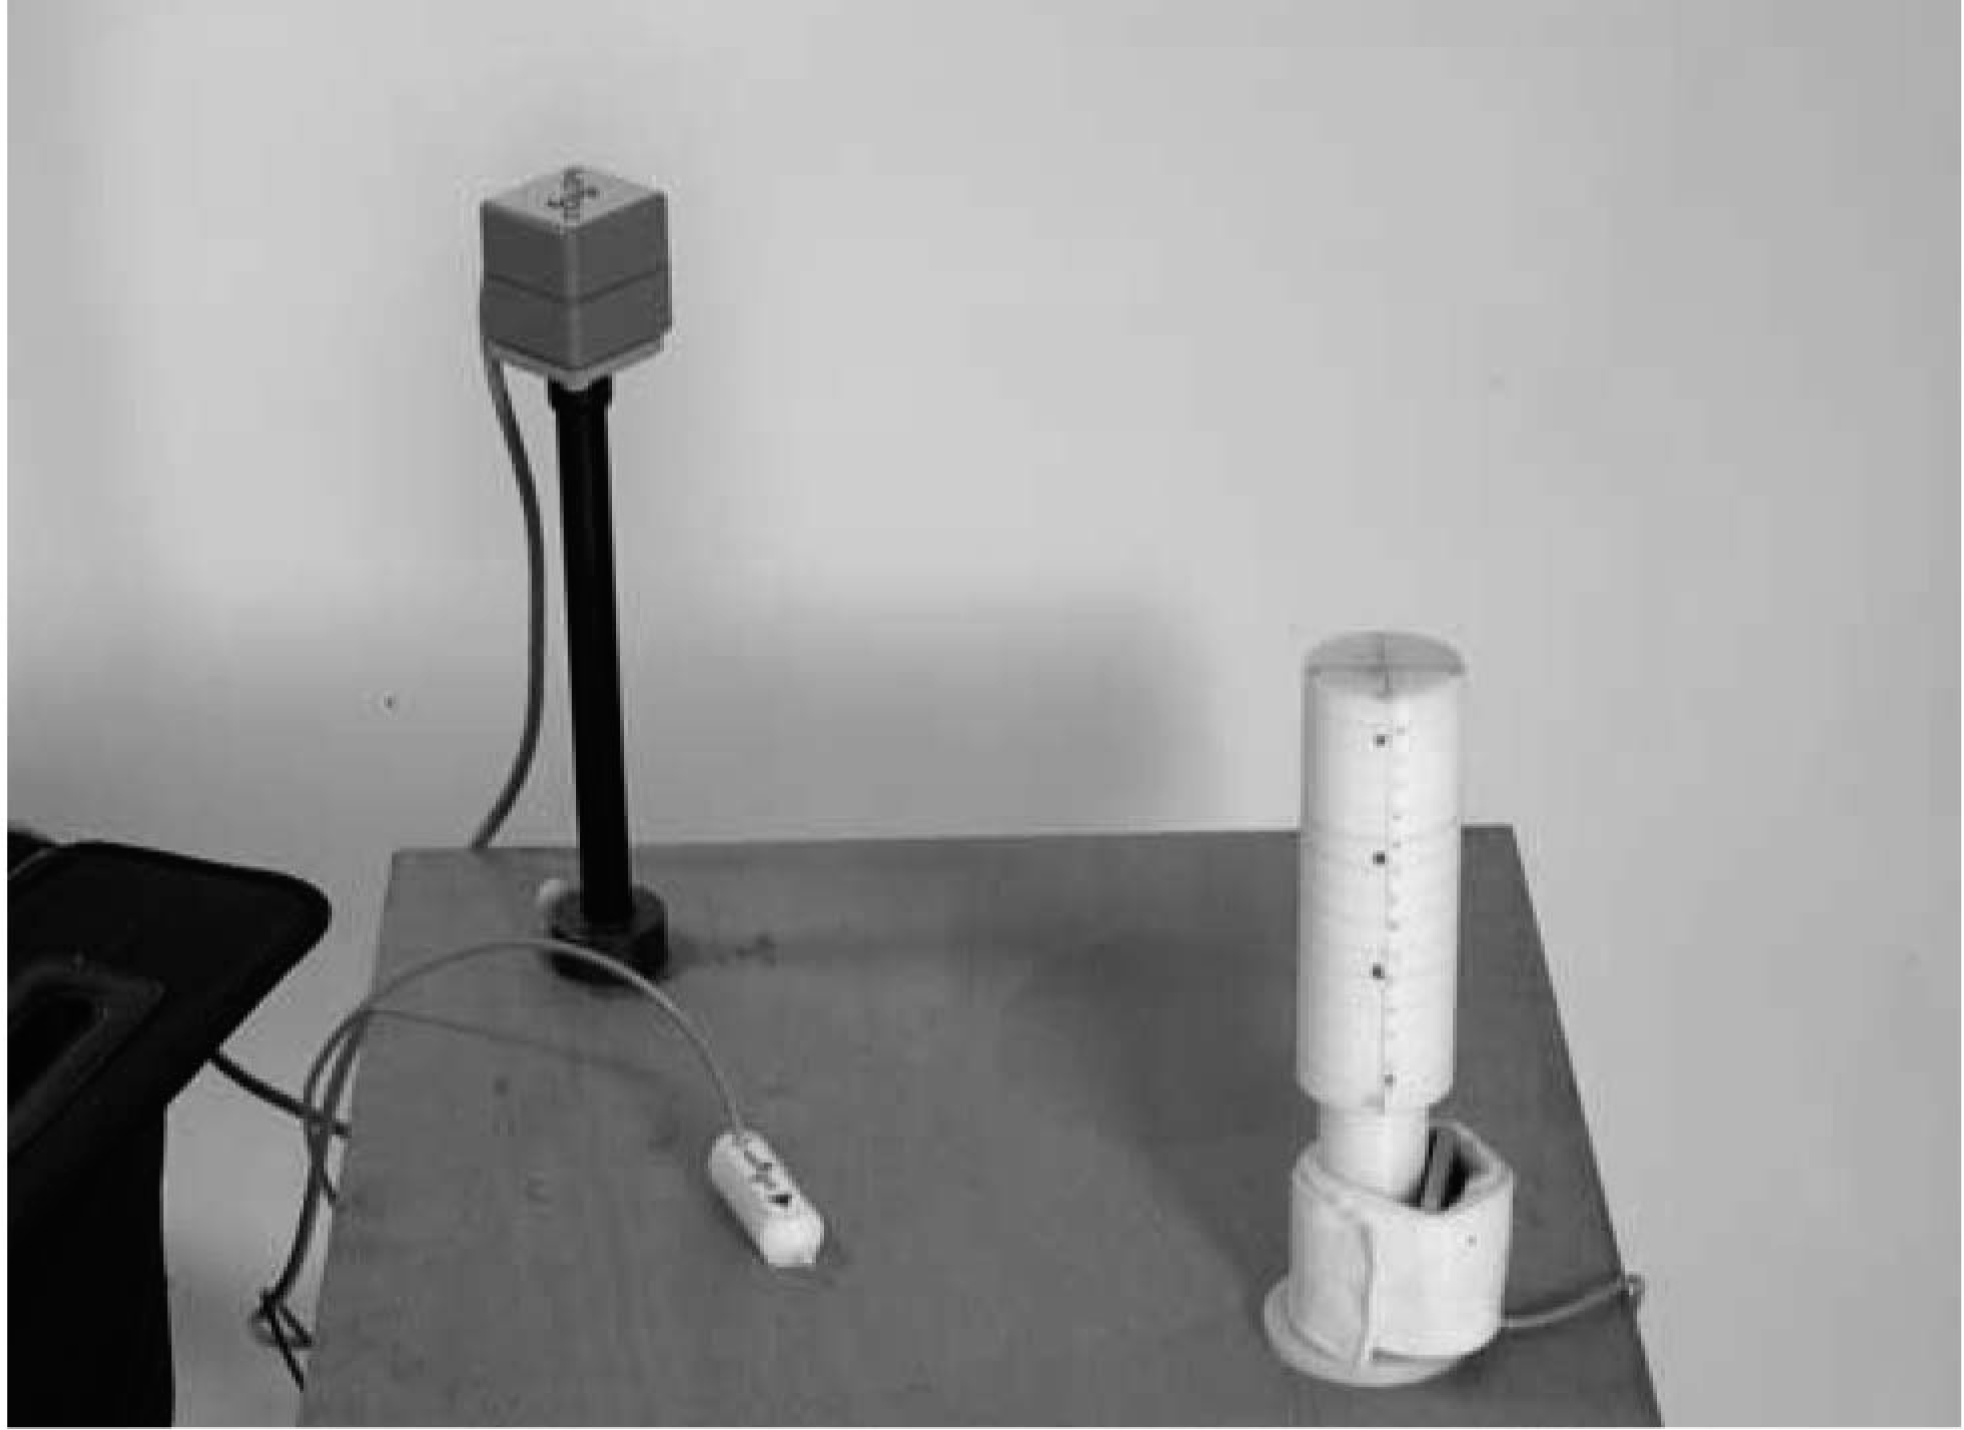
Vice constructed in wood.
Metrology volumes.
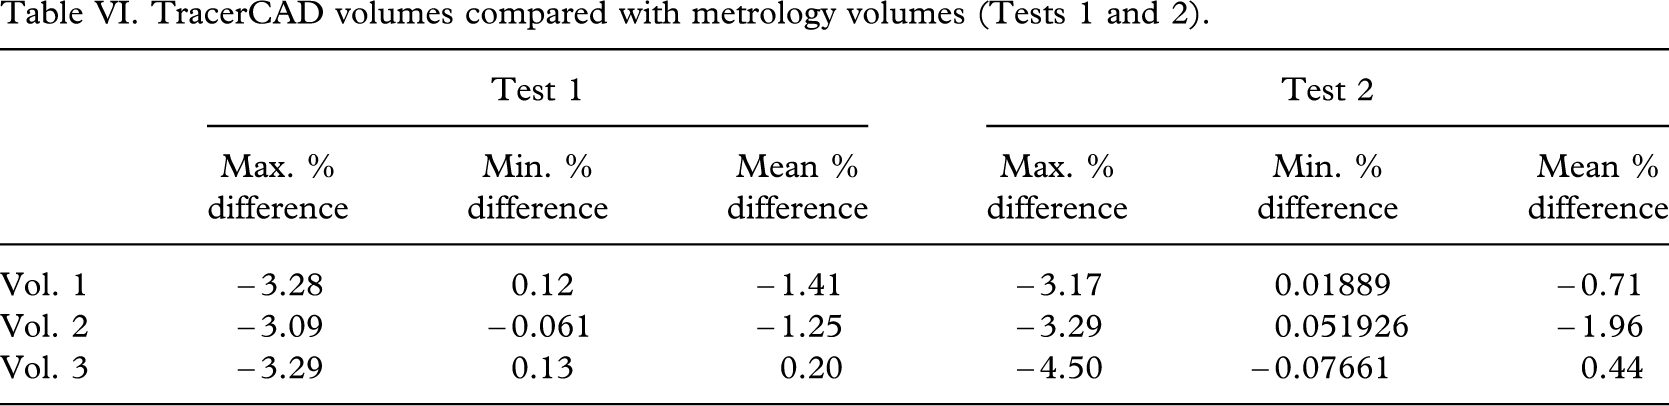
As TracerCAD calculates volumes from a fixed point to the end of the model, it was necessary to calculate the volumes of intermediate sections of the model by subtraction. For example: Volume JF – Volume JG = Volume 1, Volume JG – Volume JH = Volume 2, and Volume 3 = Volume JH. Metrology volumes have already been calculated (Table VI).
Discussion
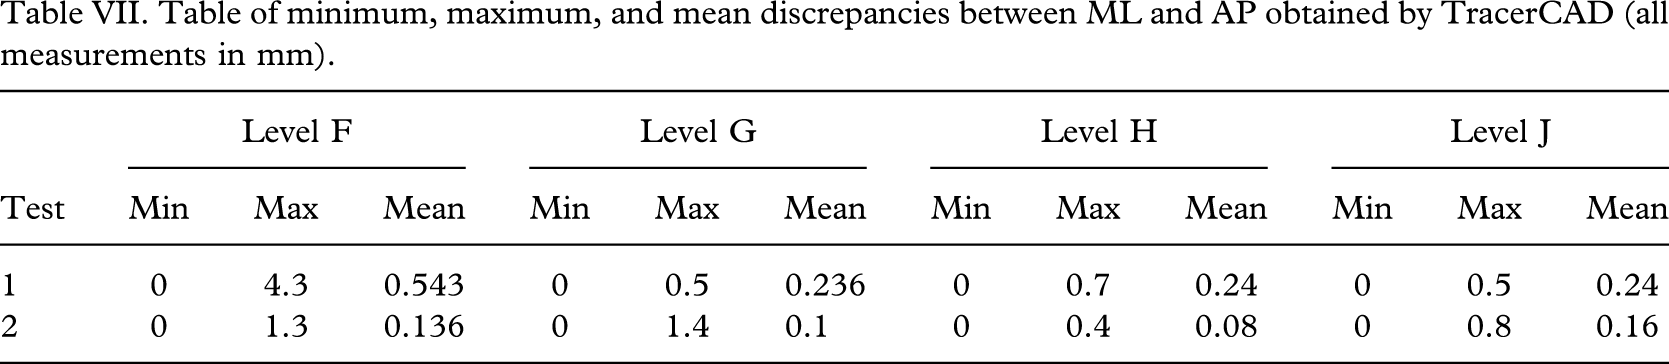
The AP and ML dimensions obtained using TracerCAD were different, having been shown to be equal using metrology and digital calliper measurement. The maximum discrepancy was 4.3 mm, obtained in Test 1, level F, although this did appear to be a spurious result, as the next highest discrepancy in all other tests was 1.4 mm, Test 2, level G. The minimum discrepancy was 0 mm, obtained in 10 of the 12 tests (see Table VII).
The difference between TracerCAD AP and ML measurements did not vary significantly between Test 1 and Test 2 if the maximum value for Test 1 level F was discarded. The next highest value in this test was 0.8 mm (Table VII). The range of difference between the AP and ML measurements did not significantly vary between levels F, G, H, and J in Tests 1 and 2 (Table IV).
The maximum percentage difference between AP metrology and AP tracer was − 0.95%. The actual maximum difference between these measures was 4.03 mm or 6.47% (Test 1 level F) (Table V). This did not reflect other results recorded; the next highest value was − 1.64 mm (Test 2 level G).
Inaccuracies in the TracerCAD AP and ML measurements would result in the on-screen model having a different shape to the actual model, since diameters at the levels measured were different. On a simple cylindrical model, errors in the diameter measurement cause the cross-section of the digital model to be elliptical and not circular. Discrepancies may be less easily identified and corrected on more complex shapes such as the stump. However, such distortion may result in sockets which do not match the underlying shape of the stump, which could affect the pressure distribution at the stump socket interface.
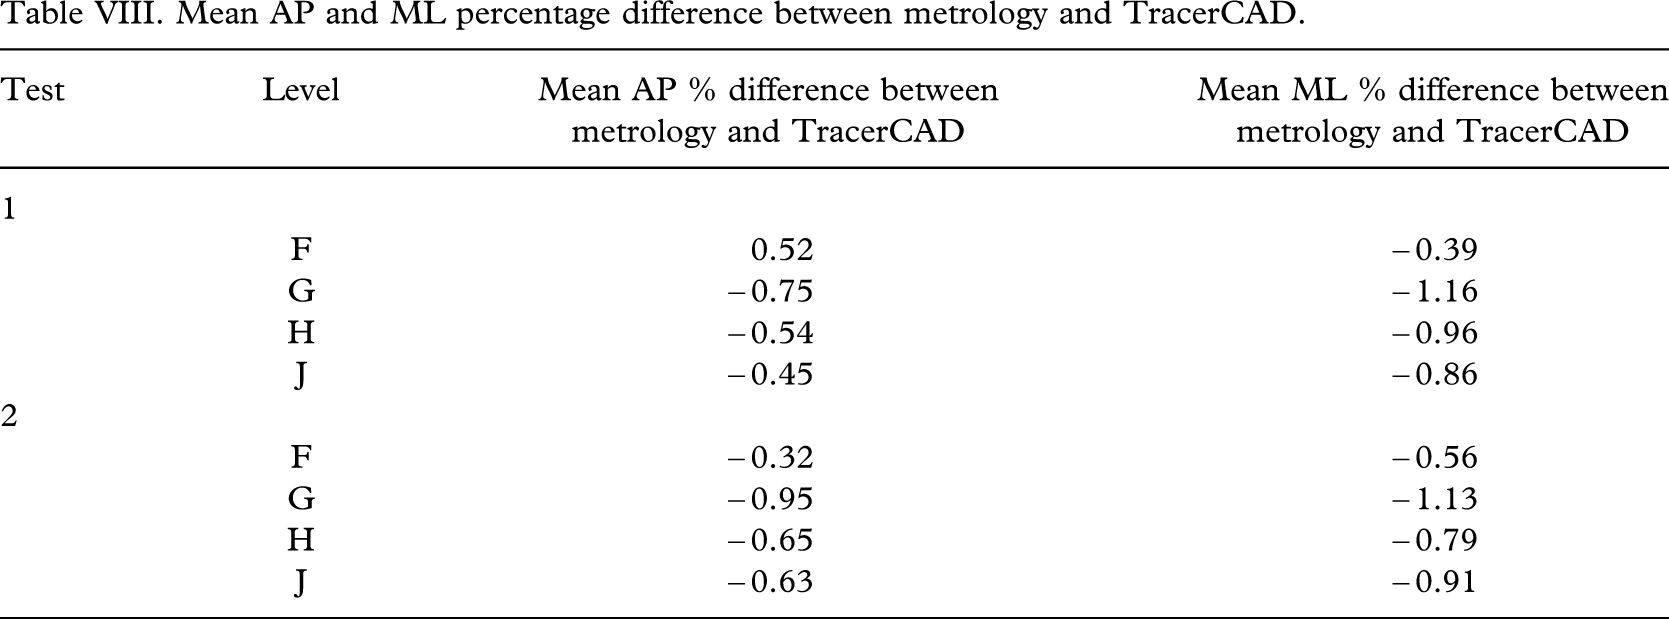
Differences between the average TracerCAD ML diameter and the metrology ML diameter differed by a maximum of −1.12925%, in Test 2, level G (Table VIII).
Mean values, standard deviation and range of each diameter measured at levels F, G, H, and J.
Summary table: comparison of TracerCAD AP and ML diameters measured at all levels (Tests 1 and 2).
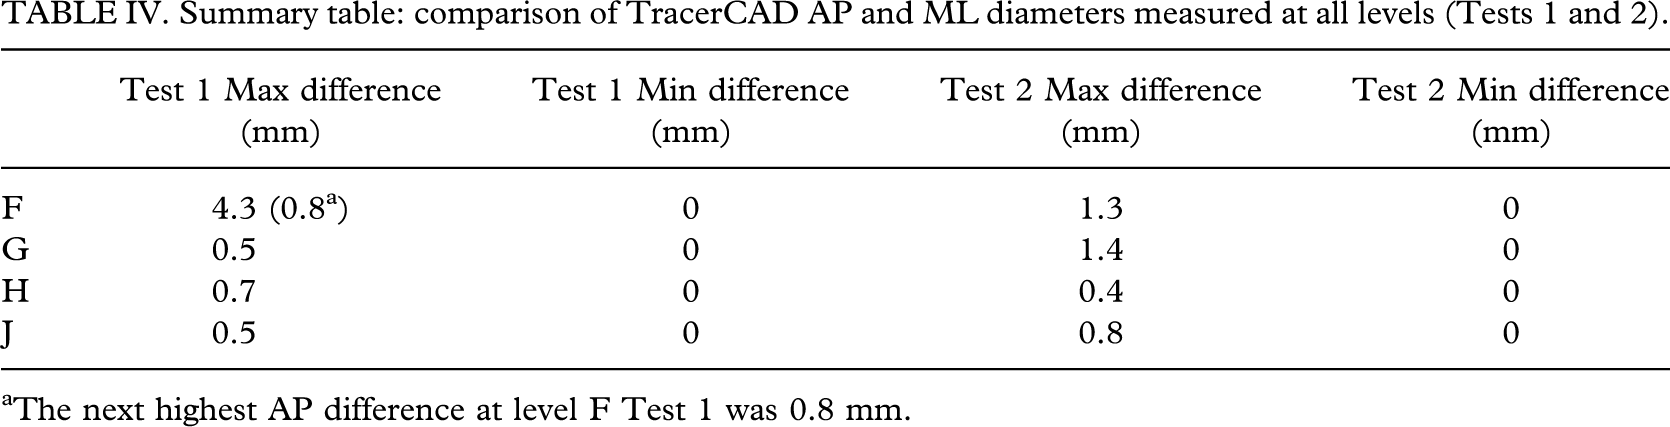
The next highest AP difference at level F Test 1 was 0.8 mm.
Summary table: comparison of tracer and metrology AP and ML diameters (Tests 1 and 2, all levels).
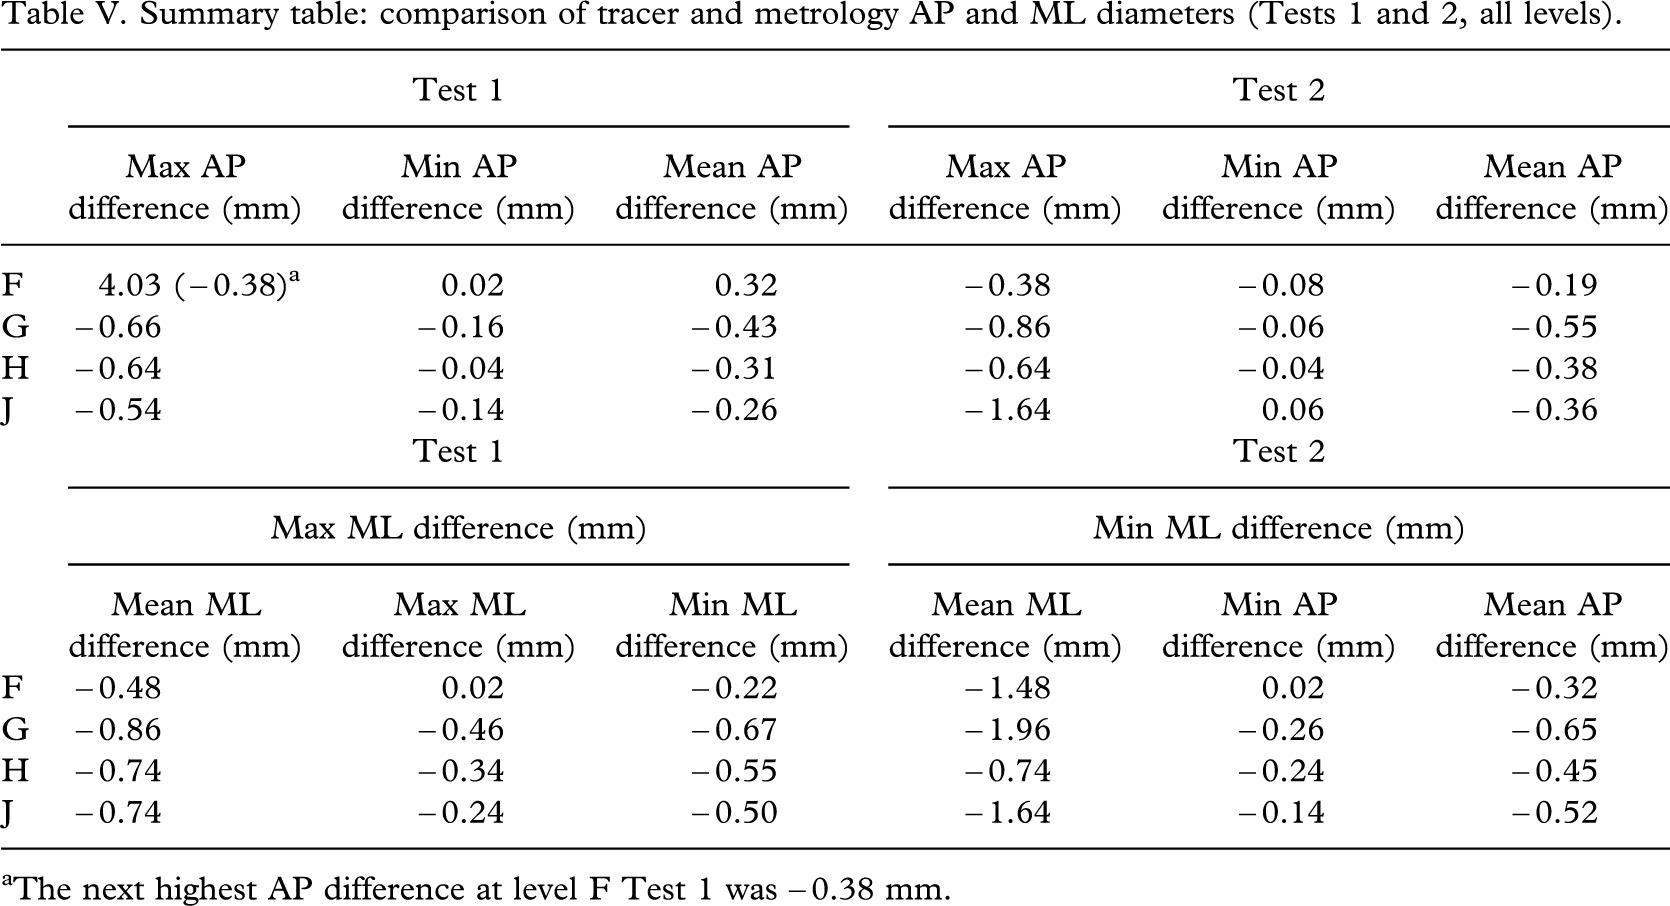
The next highest AP difference at level F Test 1 was − 0.38 mm.
TracerCAD volumes compared with metrology volumes (Tests 1 and 2).
All ML and AP average percentage differences were negative when compared with metrology measures (∗except AP level F, Test 1, Table VIII). This means that in most cases, the resulting traces are comparatively smaller in both ML and AP dimensions.
Applying this to prosthetics, it should be noted that these differences are small and may not be significant when compared with conventional casting methods. Convery et al. (2003) quantified the variation in an individual prosthetists rectification and suggested that the consistency of rectification of a particular prosthetist may vary by up to 20 mm. The mean ML and AP diameters obtained by TracerCAD had less than 1 mm difference compared with those obtained by metrology. In the manufacture of prosthetic sockets, it has not yet been established whether a patient would detect such discrepancies, but it would be interesting to further study the effect of rectification of this model to investigate if discrepancies would be cumulative.
Table of minimum, maximum, and mean discrepancies between ML and AP obtained by TracerCAD (all measurements in mm).
Mean AP and ML percentage difference between metrology and TracerCAD.
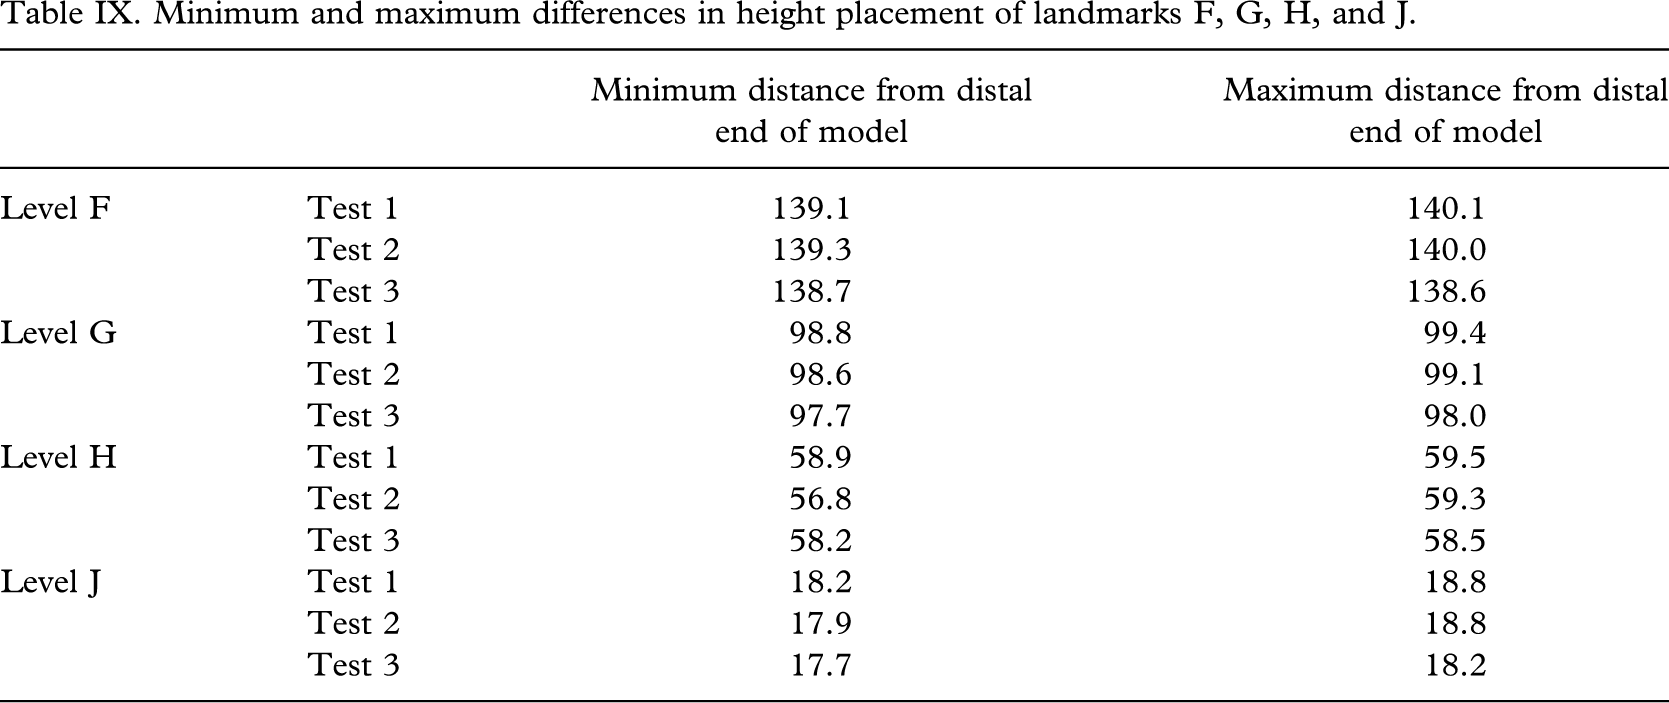
AP and ML discrepancies may be due to the manual positioning of landmarks. By examining their distances from the distal end, it can be seen that the positioning of landmarks is relatively similar (Table IX). Although care was taken to ensure exact positioning of each landmark at the corresponding point on the model, positioning varied (Table IX). This may result in measurements being taken at differing levels and could account for some discrepancy between AP and ML metrology and TracerCAD diameters.
One user provided the data for this test. As each tracing is pressure-dependent, it would be interesting to compare results of different users. A further study could enable experienced users to be compared with those with less or no experience.
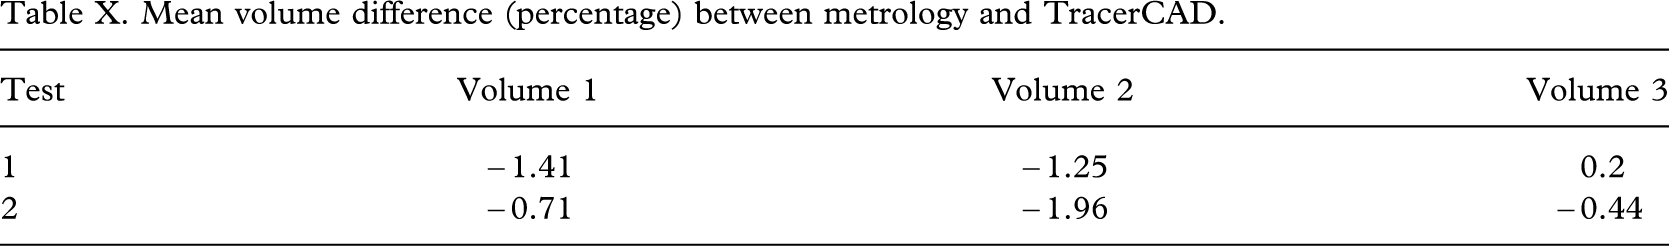
The volume is derived from the diameters and the lengths between known points. It must be therefore that factors affecting the length and diameter of each segment affect the volume calculated (see Table X).
Although the mean volume difference varied by up to − 1.96% in Tests 1 and 2, individual TracerCAD volumes varied by a maximum of − 4.56%. In all volumes measured in Tests 1 and 2, all maximum volume percentage differences were greater than 3% (Table VI).
Most volumes measured by TracerCAD were different from those of the actual model, as measured by metrology. This may be due in part to manual placement of the landmarks. If the distance between landmarks is not absolutely constant, then the volume measured will not be the same. Where landmarks are closer together, smaller volumes will be measured, and vice versa (Table IX).
Minimum and maximum differences in height placement of landmarks F, G, H, and J.
Mean volume difference (percentage) between metrology and TracerCAD.
Manual tracing of the model may result in greater pressure being applied than optimally preferred. This may also result in a smaller volume being recorded, as both ML or/and AP diameters may be affected. This experiment was carried out using a hard model that would be difficult to deflect or change shape by exerting pressure. If this is a cause of a smaller volume being measured, then it would be even more interesting to examine the results on a human stump, which may be more affected by changes in user pressure.
The mean volume percentage difference varied by up to −1.96% when compared with the metrology results. Maximum volume percentage differences in individual tests, however, measured greater than 3%. These individual discrepancies are relevant, since each patient is measured only once. In the clinical situation, measurement of stump volume is important in determining the correct volume of the socket. If incorrect, this could lead to a socket which is either too loose or tight. If volume measurement is inconsistent, determining the optimum volume and therefore ideal fit of the prosthesis when using TracerCAD is made more difficult.
In producing prosthetic sockets which are compatible with liner technology, it may be necessary to reduce a socket by a percentage value. Whilst the TracerCAD may currently be one of the most convenient methods of completing this task, difficulties may be experienced in replication of socket fit should values vary from the initial digital mapping or tracing method.
It is debatable whether the above differences in socket dimensions are significant in the manufacture of prosthetic sockets, as it has yet to be established whether a patient could detect such differences in the fit of the prosthesis.
However, the ideal way in which to capture the shape of the stump is still debatable. One opinion may be that the basis for measuring a patient's stump should be repeatable and accurate, in spite of the prosthetist who takes measures. If variations are introduced in the scanning technique, this leads to a variation in the starting ‘digital' map. This means that if a patient is cast or scanned a number of times, each cast and therefore each digital map will be slightly different (Smith and Burgess 2001).
It is important to investigate all these possibilities to ensure that improvements in future systems are identified and made possible, and to identify potential errors, as these may be more dangerous than known errors (Lilja and Oberg 1995). This study is an initial study as part of a more detailed project to examine the accuracy of a contemporary CAD system. For simplicity, a simple model was chosen and measured by one prosthetist.
It is the authors' intention to conduct further research into the effect of different users tracing a model of determinable volume, and what the effects of the model properties such as shape and model deformability have on the resulting measurements.
Further research is also required to investigate the effect of placement of landmarks, including distal, lateral, medial, anterior, and proximal points when tracing a model.
Conclusion
This experiment attempted to investigate the repeatability and accuracy of the TracerCAD scanning technique on a model of determinable volume. TracerCAD results showed varying results between ML and AP model dimensions which may affect the final shape and volume of the digitized model. Tracer CAD diameters differed, on average, by less than 1 mm when compared with corresponding metrology measurements. Because of the lack of scientific data available, it is uncertain whether such discrepancies would be detected by the patient, as comparisons are difficult when compared with conventional plaster of Paris casting techniques.
However, prosthetists should note that differences may exist in tracing results due to the ‘hands on' nature of the tracer design. This may be due to pressure applied during the trace (not tested in this paper) or individual marking of landmarks. Incorrect positioning of landmarks may affect the position of measurement, or the axis on which the measurement is taken.