
Abstract
The aim of this study was to perform a Rasch analysis on the 5-level ordinal scale version of the Locomotor Capabilities Index (LCI-5), in order to investigate rating scale quality and conduct reliability and validity assessments. A questionnaire was mailed to 144 subjects who had undergone lower limb amputation (LLA) in the previous five years and completed a rehabilitation and prosthetic training programme. A total of 123 persons (85%) responded to the questionnaire, a self-report assessment of prosthetic capability and performance which included the LCI-5, the Mobility Section of the Prosthesis Evaluation Questionnaire (PEQ-MS) and other variables associated to prosthetic wear and use. Following Rasch analysis and expert review, the LCI-5 response categories level 1 (‘yes, if someone helps me’) and 2 (‘yes, if someone is near me’) were combined into a single category and 4 items were deleted (due to misfitting). The remaining 10 items fitted the Rasch model (LCI10-4) and demonstrated good reliability (person separation reliability = 0.94, item separation reliability = 0.98) and internal construct validity. Moreover, the good correlation with the PEQ-MS (rs = 0.77) and with prosthetic wear and use (rs range 0.34 – 0.51) supported the convergent validity of the scale. In conclusion, Rasch analysis provided the rationale for improving the measurement qualities of the LCI-5, refining its rating scale (through category diagnostics), identifying those items most useful for measuring the intended construct (as per the indexes of unidimensionality and internal construct validity) and showing that one can place high confidence in the consistency of both the person-ability and item-difficulty estimates obtained (reliability).
Introduction
The best possible restoration of mobility and locomotor function is a primary goal of rehabilitation programmes following lower limb amputation (LLA) (Geertzen et al. 2001). To accurately examine the impact of therapeutic interventions, in particular of prosthetic treatments, psychometrically sound outcome measures of mobility are needed (Rommers et al. 2001). In LLA patients, self-report measures can be very useful because they allow a mailing-based follow-up (Legro et al. 1998; Miller et al. 2001; Ferriero et al. 2005). Among self-report scales for people with LLA wearing a prosthesis, the Locomotor Capabilities Index (LCI) evaluates ambulatory skills through the assessment of the subject's capability in performing 14 different locomotor activities while wearing a prosthesis, rated with a 4-point ordinal scale ranging from 0 – 3 (Gauthier-Gagnon and Grisé1994; Gauthier-Gagnon et al. 1999). The LCI was tested with subjects in whom peripheral vascular disease was the leading cause of amputation and it showed acceptable levels of reliability and validity according to the classical test theory (Gauthier-Gagnon and Grisé1994; Gauthier-Gagnon et al. 1998) but a high ceiling effect (Miller et al. 2001). Recently, a new LCI version with a 5-point ordinal scale (LCI-5, including a new more demanding category ‘Able to accomplish the activity without aids’) was tested in younger subjects with mainly traumatic LLA undergoing prosthetic training. The LCI-5 presented similar general psychometric properties to the original LCI, a lower ceiling effect and a larger effect size (Franchignoni et al. 2004). However, a more in-depth validation of basic measurement properties of the LCI-5 was recommended, e.g., through investigation of the fit to Rasch model requirements (Wright and Stone 1979; Rasch 1980; Wright and Masters 1982). Some advantages of Rasch models include the ability to analyze (Tesio 2003; Conrad and Smith 2004): (a) how each rating scale is being used; (b) the validity of a measure by evaluating the fit of individual items to the latent trait; (c) if the pattern of item difficulties is consistent with the construct's expectations and hence provides an adequate description of the range and hierarchical relationship of the variable.
To provide the rationale for improving the measurement qualities of LCI-5, the purpose of this study was to perform a Rasch analysis on this outcome measure, in order to: (i) Check the functioning of rating scale categories (through rating scale diagnostics); (ii) distinguish items belonging to the same construct and verify the expected difficulty hierarchy of the items (unidimensionality and internal construct validity); and (iii) analyze the test reliability (Bond and Fox 2001).
Methods
Subjects
A questionnaire was mailed to 144 subjects who had undergone LLA in the previous five years (2001 – 2005) and were consecutively treated at the Hospital and Prosthesis Centre of INAIL (National Institute against Industrial Injuries and Occupational Diseases) in Vigorso di Budrio, Bologna, Italy. As pre-selection criteria, subjects had to: (i) Have completed the rehabilitation period and prosthetic training programme at least six months before the start of the study; (ii) have been using the prosthesis and been without mental or physical conditions that would restrict the use of assistive devices for walking, when discharged from rehabilitation and during follow-up; (iii) be 20 – 80 years old; (iv) be living in the community; and (v) be able to read and write. If subjects did not return the questionnaire within four weeks a second mailing took place, and after a further 20 days a phone call was made to non-respondents as a last reminder.
A total of 123 persons (85%) returned the questionnaire, 111 (77%) at first request. This response rate can be considered excellent (McColl et al. 2001) and in previous research has been demonstrated as sufficient to eliminate significant non-response biases from the research sample (Siemiatycki and Campbell 1984).
Instruments
The LCI is the 11th item of the Prosthetic Profile of the Amputee (PPA, a questionnaire developed and validated for follow-up studies in persons with LLA) (Grisé et al. 1993; Gauthier-Gagnon and Grisé1994), but it can be used separately from the general instrument (Gauthier-Gagnon et al. 1998; Miller et al. 2001; Gauthier-Gagnon and Grisé2006). The LCI is composed of 14 questions (phrased as ‘Would you say that you are able to do the following activities with your prosthesis on?’) evaluating subjects' capability to perform different postural tasks and locomotor activities.
In this study the authors adopted the version with a five-point ordinal scale, the LCI-5 (ranging from ‘0 = not able’ to ‘4 = able to accomplish the activity without aids’, with maximum score of 56) (Franchignoni et al. 2004).
To check the construct validity of the Rasch-refined version of the LCI-5, patients were also asked to complete: (1) The Mobility Section of the PEQ (PEQ-MS); and (2) some other items from the PPA (Gauthier-Gagnon et al. 1999).
The PEQ-MS is section 4 of the Prosthesis Evaluation Questionnaire (PEQ), a self-administered questionnaire designed for a comprehensive evaluation of persons with amputations “with regard to their prostheses and their prosthesis-related quality of life” (Legro et al. 1998; Prosthetics Research Study 1998). The PEQ-MS consists of two scales (ambulation: 8 items; transfer: 5 items) that can be combined into a single mobility measure (Miller et al. 2001). It evaluates the mobility using prosthetic devices over the past four weeks. Each item is rated by an 11 step 0 – 10 numeric rating scale (Miller et al. 2001; Deathe and Miller 2005), with endpoints labeled ‘0 = not able, or almost unable (less than 5% of ability)’ and ‘10 = no problems or almost fully able (more than 95% of ability)’. A summary score is calculated giving the arithmetical mean of all the questions (range 0 – 10) comprising the scale to which the respondent answers. The items selected from PPA were as follows:
#12 – prosthetic wear (defined as the number of hours the prosthesis was worn per week) (Gauthier-Gagnon et al. 1999); #14b and 16b – active use of prosthesis, indoors and outdoors respectively (defined as percentage of ambulatory activities performed with the prosthesis daily: approximately 0%, 25%, 50%, 75% and 100%) (Gauthier-Gagnon et al. 1999); #18 – distance walked non-stop (6-level ordinal scale, from ‘I do not walk’ to ‘not limited’) (Gauthier-Gagnon et al. 1999); Other questions about sociodemographic variables (marital status, education level, employment, income status, etc.), associated medical conditions and amputation-related factors.
Statistical analysis
The median and interquartile range (25th – 75th percentile) were used as a measure of central tendency and variability of the score distribution, respectively. All correlations were computed with Spearman's rho (rs), corrected for ties (Portney and Watkins 2000).
To assess the basic measurement properties of LCI-5, the matrix of single raw scores for each subject underwent a Rasch analysis (rating scale model) through the WINSTEPS software (Linacre 2004).
The Rasch analysis applies probabilistic models based on the item-response theory which postulate that, if the ability in responding to items on a ordered categorical scale is explained by a unidimensional construct underlying the scale, the hierarchy of difficulty of the items should match the hierarchy of ability of the subjects (more able subjects are more likely to pass more difficult items). Thus, Rasch models are mathematical models of how probabilities of response should be, in order to comply with fundamental requirements of measurement. Depending on the string of responses provided by a particular sample of subjects on a particular sample of items, the Rasch model estimates goodness-of-fit (or simply ‘fit’) of the real data to the modelled data. If the differences between observed and expected scores are not too large, it is said that ‘the data fit the model’ (see below), and this is seen as equivalent to a test of the theoretical construct validity and adequacy of the scale (Bond and Fox 2001; Ryall et al. 2003; Tesio 2003).
We investigated the following aspects through Rasch analysis:
(a) Rating scale diagnostics
As a first step, the authors investigated whether the rating scale of the LCI-5 was being used in the expected manner. The a priori hypothesis was that more categories exist in the scale than are needed to describe the construct (Streiner and Norman 1995). In accordance with Linacre (1999), the following criteria were used to judge this parameter: (1) At least 10 cases per category; (2) even distribution of category use; (3) monotonic increase in both average measures across rating scale categories and thresholds (thresholds, also called step calibrations, are ability levels at which the response to either of two adjacent categories is equally likely); (4) category outfit mean square values less than 2 (see the following paragraph); and (5) threshold differences higher than 1.4 logit units and lower than 5. Categories were collapsed following specific guidelines, and several patterns of categorization were compared, looking not only at the above indicators of category diagnostics but also at best reliability indices (see below) (Bond and Fox 2001).
(b) Validity
After revising the rating scale categories, validity was analyzed by evaluating the fit of individual items to the latent trait as per the Rasch model (unidimensionality) and examining if the pattern of item difficulties was consistent with the model expectancies. Information-weighted (infit) and outlier-sensitive (outfit) mean-square statistics (MnSq) for each item were calculated (similar to a Chi-square analysis) to test if there were items which did not fit with the model expectancies. Both of these fit statistics are expected to approach to 1. In accordance with the literature, the authors considered MnSq > 0.6 and <1.4 as an indicator of acceptable fit. Items outside this range were considered underfitting (MnSq ≥ 1.4, suggesting presence of unexpectedly high variability) or overfitting (MnSq ≤ 0.6, indicating a too predictable pattern) (Bond and Fox 2001). For Rasch analysis it is reported that a sample size of about 100 persons will estimate item difficulty with an alpha of 0.05 to within ±0.5 logits (Linacre 1994). The next step in the Rasch analysis was to calculate the level of difficulty achieved by each item (item difficulty) and to determine where each individual subject fitted along the continuum (subject ability). Item difficulty and patient ability are expressed, on a common interval scale, in logit units, a logit being the natural logarithm of the ratio (odds) of mutually exclusive alternatives (e.g., pass vs. fail, or higher response vs. lower response) (Wright and Masters 1982; Bond and Fox 2001).
Finally, to test the construct validity of the Rasch-refined version of the LCI-5, the authors correlated (Spearman's rs, corrected for ties) its score with PEQ-MS and some PPA items (prosthetic wear; active use of prosthesis, indoors and outdoors; distance walked non-stop) (Portney and Watkins 2000), hypothesizing a good to excellent correlation between the LCI-5 and the PEQ-MS (the constructs measured by the two scales are both related to the ability in locomotor activities with the prosthesis) and a fair to moderate degree of relationship with the PPA items measuring factors associated with prosthetic wear and use (Gauthier-Gagnon et al. 1999).
(c) Reliability
Reliability was evaluated in terms of ‘separation’ (G), defined as the ratio of the true spread of the measures with their measurement error (Wright and Masters 1982; Bond and Fox 2001).
The item separation index gives an estimate (in standard error units) of the spread or ‘separation’ of items along the measurement construct; the person separation index gives an estimate of the spread or separation of persons along the measurement construct. This index reflects the number of ‘strata’ of measures which are statistically discernible. A separation of 2.0 is considered good and enables the distinction of three groups or strata, defined as segments whose centres are separated by distances greater than can be accounted for by measurement error alone (number of distinct strata = (4G + 1)/3) (Wright and Masters 1982). A related index is the reliability of these separation indices, providing the degree of confidence that can be placed in the consistency of the estimates. Coefficients range from 0 – 1: Coefficients >0.80 are considered as good, and >0.90 excellent (Bond and Fox 2001).
Results
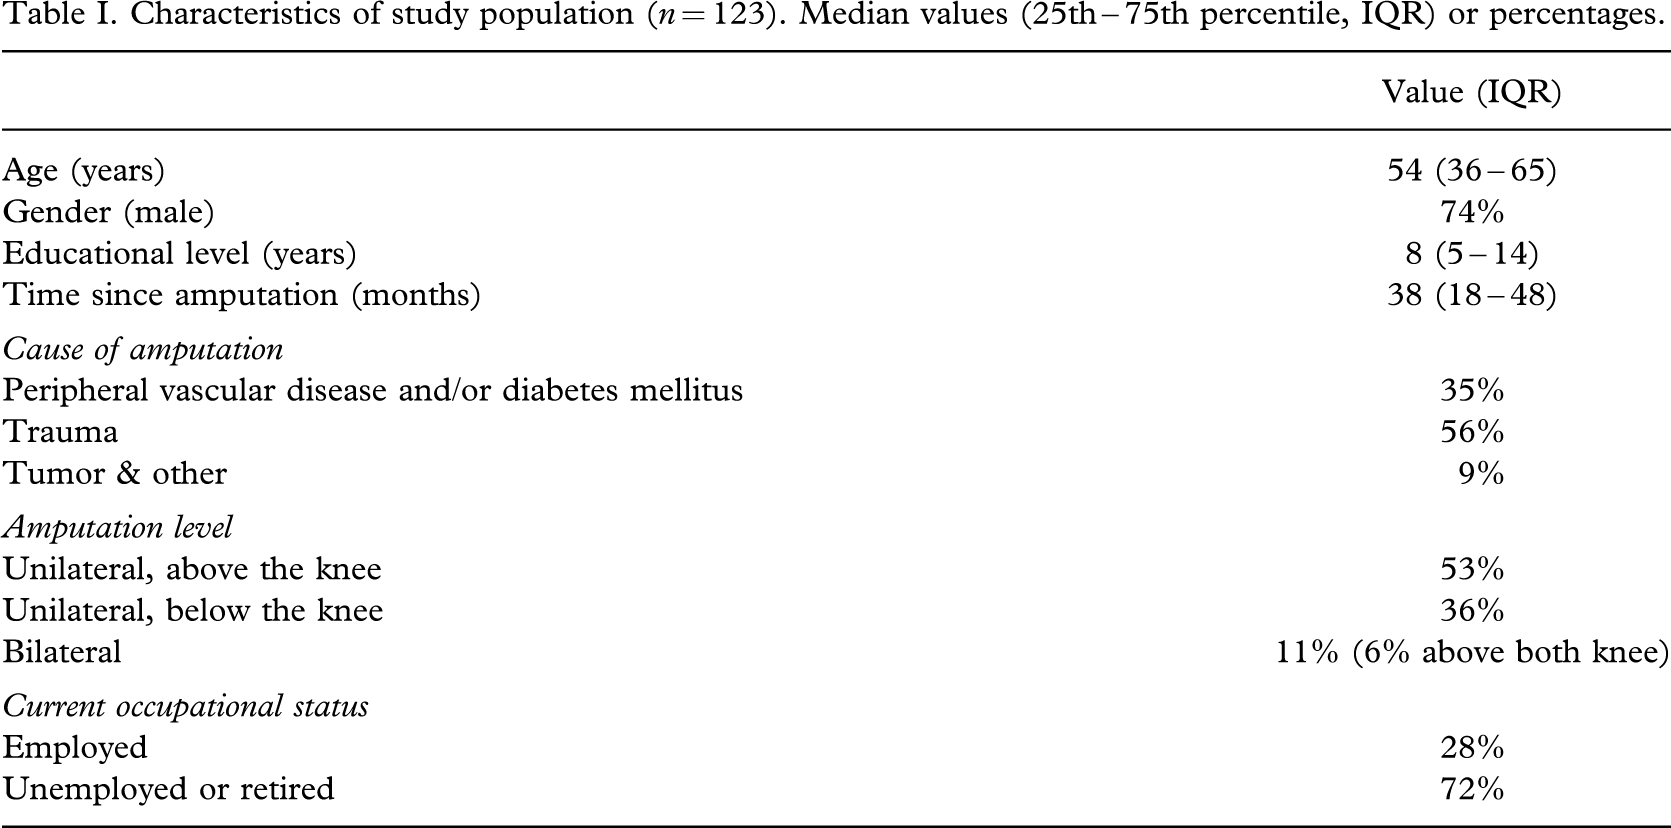
Table I shows the main socio-demographic characteristics of the study population. LCI-5 median (25th – 75th percentile) was 41 (28 – 47). Six out of the 123 subjects (5%) showed the LCI-5 maximum score and nobody the minimum score.
Characteristics of study population (n = 123). Median values (25th – 75th percentile, IQR) or percentages.
(a) Rating scale diagnostics
Level 1 (‘yes, if someone helps me’) and 2 (‘yes, if someone is near me’) of the items' rating categories did not comply with the criteria for category functioning (average measures, thresholds, etc.). The preset criteria were met combining levels 1 and 2 of the LCI-5 into a single category (labeled ‘yes, if someone helps me or is near me’), so obtaining a new 4-level rating scale (0 – 3 points).
(b) Validity
After the phase of rating-scale modification, the Rasch analysis showed that 10 of the 14 LCI items fitted the unidimensional construct that each scale was intended to measure (MnSq between 0.6 and 1.4). The items #3 ‘Get up from the floor’ (MnSq = 1.65) and #7 ‘Walk outside in inclement weather’ (MnSq = 1.45) were underfitting (MnSq > 1.4) and the items #10 ‘Step up a sidewalk curb’ and #11 ‘Step down a sidewalk curb’ were overfitting (MnSq < 0.60) (Table II).
Item calibrations (measure, increasing bottom-up) with standard errors (SE), and infit and outfit mean-square statistics (MnSq) for the 14 items of LCI-5. Misfitting values are in bold. The difficulty estimate for the item as a whole is the mean value of the difficulty measures of the thresholds along that item. The higher the item estimate, the less likely it is, for any subject, to gain a high score in that item.
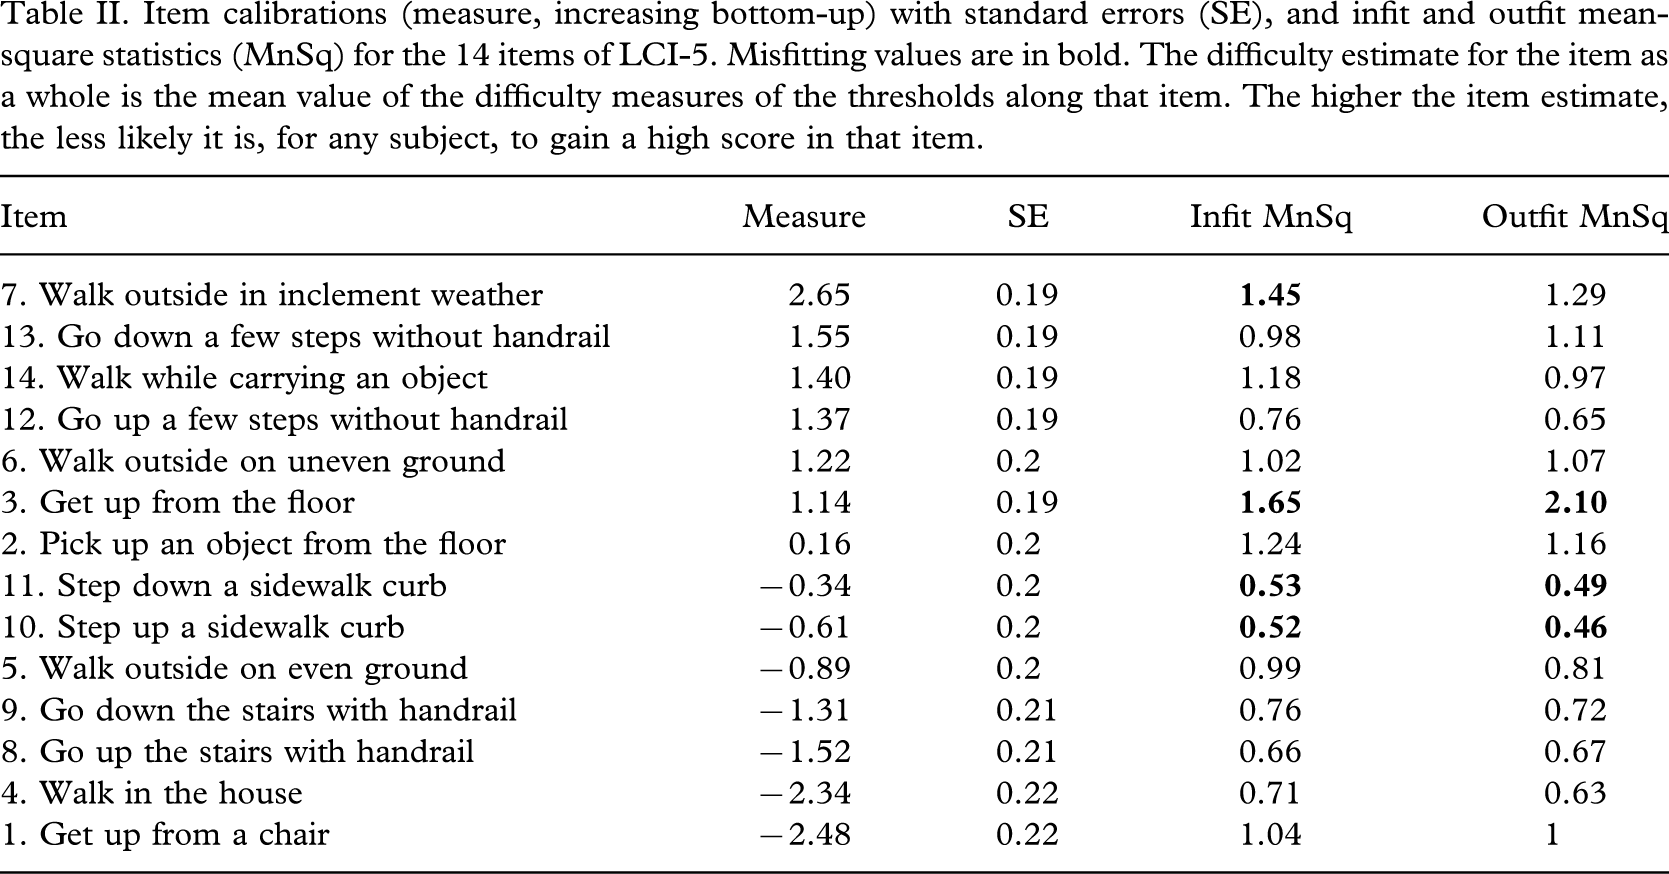
Regarding the hierarchic ordering of items, Figure 1 shows the distribution map of subject ability and item difficulty of LCI-5, according to the Rasch model. Ability levels (average measure = 1.17) spanned about 12 logits and distribution was symmetric around the mean. The mean error estimate for the subject ability levels was 0.59; as expected, in the near-maximum scores (7.3 logits) the standard error (SE) was higher (1.09). Item difficulty estimates spanned more than 5 logits (from −2.48 to +2.65 logits). The lowest difficulty threshold estimate (step from category 0 to 1) of item #1 ‘Get up from a chair’ (the easiest activity) was near −5 logits, whereas the two highest thresholds (step from category 2 to 3) were: For item #7 ‘Walk outside in inclement weather’ (the most difficult activity) about 6 logits; for #13 ‘Go down a few steps without hand rail’ about 5 logits.
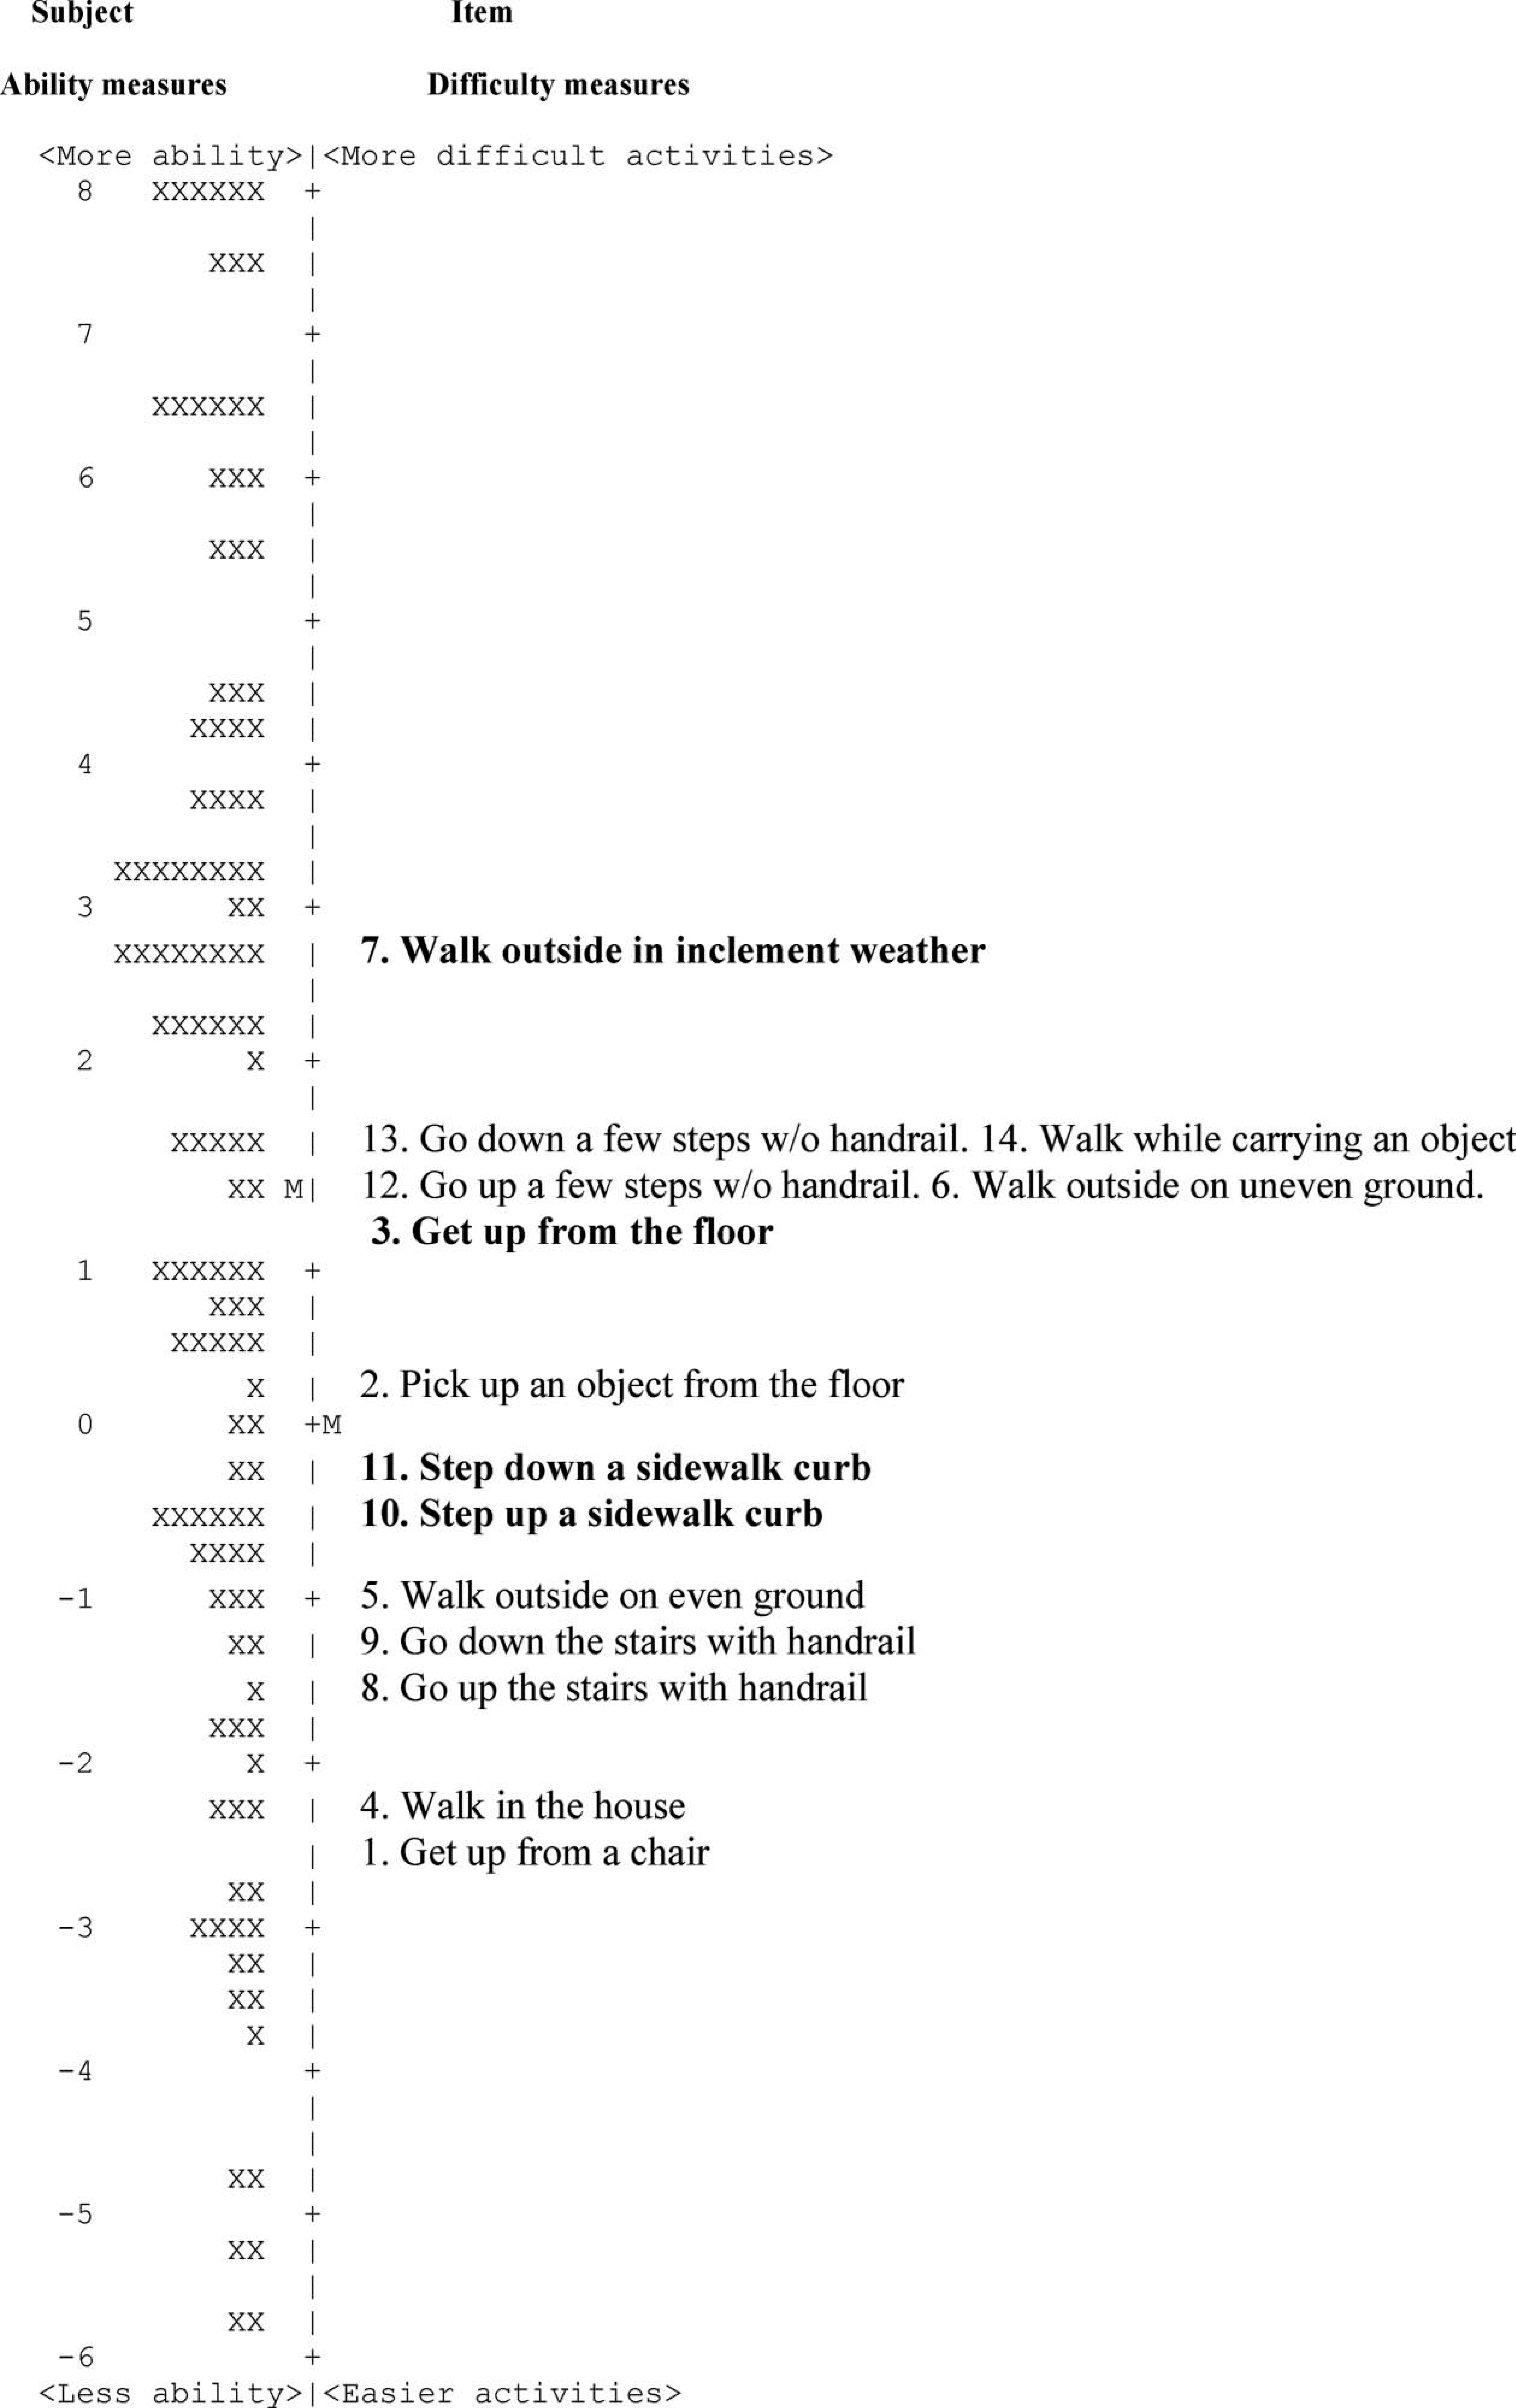
Person-ability and item-difficulty maps (so-called ‘Rasch ruler’) of the LCI-5. The vertical line represents the measure of the variable, in logit units. The left-hand column locates the individual's ability along the variable: Each person is indicated by an ‘X’. The right-hand column locates the 14 item difficulty measures along the variable (for each item, the difficulty estimate represents the mean calibration of the threshold parameters according to the rating scale model). From bottom to top, measures indicate greater mobility (for patients) and greater difficulty (for items), respectively. By convention, the average difficulty of items in the test is set at 0 logits (and indicated with M'). Accordingly, a candidate with average ability is indicated with M. Each item is also indicated by its number in the original questionnaire. Underfitting (#3 and 7) and overfitting (#10 and 11) items are in bold.
Regarding construct validity, the LCI strongly correlated with PEQ-MS (rs = 0.77) and showed a moderate but significant correlation with the other PPA items (#12 – frequency of prosthetic wear: rs = 0.47, #14b – active use of prosthesis indoors: rs = 0.34, #16b – active use of prosthesis outdoors: rs = 0.42, and #18 – distance walked non-stop rs = 0.51; p < 0.001 for all). The LCI version with the 4-level rating scale and without the 4 items not fitting the Rasch model (LCI10-4) presented similar significant correlations (not shown).
(d) Reliability
After the phase of rating-scale modification and 4-item reduction, the reliability indices for the LCI10-4 were as follows: Item separation index = 7.39 and item separation reliability = 0.98; person separation index = 3.90 and the person separation reliability = 0.94. The items were distributed into around 10 difficulty strata, and the scale was able to distinguish more than 5 levels of patient ability in this study sample.
Discussion
An understanding of measurement principles applied to questionnaires is crucial if it is wanted to use scores as a part of the clinical assessment. It must be remembered that raw scores can be misleading and consider the potential for misinference when ordinal scales are used (Wright and Masters 1982, Portney and Watkins 2000). Rasch analysis provides a valuable tool for testing if the properties of a questionnaire comply with a wide spectrum of psychometric requirements for measurement which are not analyzed by traditional techniques (Tesio 2003). The modifications suggested by Rasch analysis allow improving the measurement properties of an instrument (Bond and Fox 2001). In addition, converting raw data to a Rasch scale (Figure 1) provides interval level scaling as opposed to the limitations of ordinal scaling. Interval level scales result in additivity, which is a mathematical property required for inferential statistics. The purpose of this study was to perform a Rasch analysis on LCI-5 in patients with LLA (investigating the quality of the rating categories and the scale's validity and reliability), in order to provide the rationale for improving its measurement qualities.
(a) Rating scale diagnostics
Concerning the rating scale analysis, category diagnostics evidenced respondents' inability to appreciably discern between category 1 (‘yes, if someone helps me’) and 2 (‘yes, if someone is near me’) and later confirmed the appropriateness of collapsing the two categories into a single one related to the need for external help or supervision. This modification eliminated in the study population the redundancy of underutilized rating categories and ensured that each rating category is distinct from the others (Kornetti et al. 2004; Nillson et al. 2005). In addition, the usefulness of the more demanding category of the LCI-5 was fully confirmed in this study by both category diagnostics and the presence of a low percentage (5%) of top scores. Thus, this study suggests – at least for the younger and more traumatic population (see Table I) – the use of the following four revised categories: 0 = not able, 1 = able if someone helps me or is near me; 2 = able to accomplish the activity alone but with aids; 3 = able to accomplish the activity alone and without aids.
A similar investigation of the category functioning would be useful also in the original LCI, when applied in elderly vascular amputees.
(b) Validity
After the rating-scale modification, the data were refitted to the Rasch model to determine validity issues and four items resulted as misfitting. All four are candidates for elimination from the scale, owing to both statistical and content reasons.
Two of the four misfitting items proved to be underfitting (i.e., accumulating unexpected responses among subjects): (a) ‘Get up from the floor’, a task requiring the integrity of complex features (such as lower limb strength, joint range of motion, postural stability, etc.), and influenced by too many external factors (such as body weight, joint pain, etc.). An expert review suggested also that this item does not seem to exactly belong to the construct ‘locomotion’ but to a wider category of mobility/transfer tasks, that not necessarily are unidimensional in these subjects (as Rasch models require); (b) ‘Walk outside in inclement weather’, a task depending on various personal and environmental confounding factors, that could induce some subjects to respond with an idiosyncratic answer (Streiner and Norman 1995). As an alternative, items like ‘Walk on slippery surfaces’ (the hardest item in PEQ-MS), ‘Walk for up to two hours’, ‘Climb a flight of stairs without rail’ (two challenging items from the Orthotics and Prosthetics Users' Survey [Heinemann et al. 2003), or ‘Climb a steep slope’ might be checked. In fact, if subjects with high locomotor ability were the target group for this test, the test would need to have at least one new question representing a high difficulty (3 or more logits), so as to estimate more precisely the abilities of the top subjects and raise the ceiling of the test (Bond and Fox 2001).
On the other hand, two of the four misfitting items (‘Step up a sidewalk curb’ and ‘Step down a sidewalk curb’) were ‘overfitting’: This usually reflects redundancy of the items, i.e., they give little extra information with respect to other items in the scale; thus the pattern of response to these two items is too predictable from the overall pattern of response to other items (Bond and Fox 2001; Ryall et al. 2003). Rasch analysis tells us that deleting for the sake of parsimony these two items (or at least one of them) would not decrease, in this study sample, the precision of estimation of the general locomotor ability. In fact, they do not make an independent contribution to the measurement, and are strongly correlated each other (rs = 0.95) and with performance in walking outside on even ground (rs > 0.85) and climbing up and down stairs (rs = 0.78 – 0.80) (McNamara 1996; Bond and Fox 2001). In our relatively highly functioning population (people that completed the prosthetic training program at least six months before the start of the study) it is not surprising that the ability of managing sidewalk curbs is strongly correlated with the ability to walk outside on even ground and climb stairs. This finding is in line with a previous study (Gauthier-Gagnon et al. 1998) showing that some sets of items in the original LCI are statistically redundant and thereby foreseeable, and pointing to the need for further verifying the pertinence of the item selection. In any case, it is recommended to further check this result in different populations (e.g., in less experienced prosthetic users) because better calibrations could be obtained when the scale is tested against a less capable sample.
As an additional demonstration of the construct validity of both LCI-5 and LCI10-4, the general hierarchic arrangement found by Rasch analysis in the present report is consistent with clinical expectations. For example, ‘Walk outside on uneven ground’ was selected as a more demanding task than ‘Walk outside on even ground’ and the use of a handrail eased stair management. In addition, the strong correlation between LCI-5 and PEQ-MS indicates the close relationship between the constructs measured by the two scales, both related to ability in locomotor activities with a prosthesis. Similarly, as expected, LCI-5 showed a fair to moderate correlation with the other PPA variables associated with prosthetic use, such as frequency of prosthetic wear, active use of prosthesis, and distance walked non-stop.
(c) Reliability
The high item separation reliability indicates that great confidence can be placed in the replicability of item placement across future samples. The targeting and spread of item difficulty (see person-ability and item-difficulty map, Figure 1) and the high person separation reliability show that the scale is appropriate for measuring, with satisfactory precision, persons with a wide variety of functional ability. In highly functioning subjects the precision of their ability estimates (>6 – 7 logits) is lower but still acceptable: The error is about 15% of the corresponding measure.
Unfortunately, the item difficulty span decreases when (as in LCI10-4) the misfitting item ‘Walk outside in inclement weather’ is disregarded (see above).
Conclusion
In summary, Rasch analysis allowed: (a) To improve the rating scale of LCI-5 (through category diagnostics), adopting a new 4-level solution; (b) to identify its 10 items that are most useful to measurement of the intended construct (unidimensionality, internal construct validity), and it showed that one can place high confidence in the consistency of both person-ability and item-difficulty estimates obtained in both LCI-5 and its revised version (reliability).
However, care should be taken in generalizing these results, because the study population represented a sample relatively young (median age 54 years) and with a prevalence of amputations of traumatic origin (56%), and it came from a unique facility. Nevertheless, the results of this study provide the basis for revising and improving the measurement qualities of the LCI-5, and represent a useful starting point for further refinements, including: (i) An analysis of the actual performance of the new response structure with 4 revised categories; (ii) a study of differential item functioning, i.e., the stability of item hierarchy across sub-samples defined according to potentially relevant clinical criteria (e.g., age, type of prosthesis, amputation characteristics, etc.) (Ryall et al. 2003, Lundgren-Nillson et al. 2005); and (iii) the testing of new items with higher difficulty than the present ones (e.g., ‘Walk on slippery surfaces’, ‘Walk for up to two hours’, or ‘Climb a steep slope’).