
Abstract
Background:
New health status instruments can be administered by computerized adaptive test or short forms. The Prosthetic Limb Users Survey of Mobility (PLUS-MTM) is a self-report measure of mobility for prosthesis users with lower limb loss. This study used the PLUS-M to examine advantages and disadvantages of computerized adaptive test and short forms.
Objectives:
To compare scores obtained from computerized adaptive test to scores obtained from fixed-length short forms (7-item and 12-item) in order to provide guidance to researchers and clinicians on how to select the best form of administration for different uses.
Study design:
Cross-sectional, observational study.
Methods:
Individuals with lower limb loss completed the PLUS-M by computerized adaptive test and short forms. Administration time, correlations between the scores, and standard errors were compared.
Results:
Scores and standard errors from the computerized adaptive test, 7-item short form, and 12-item short form were highly correlated and all forms of administration were efficient. Computerized adaptive test required less time to administer than either paper or electronic short forms; however, time savings were minimal compared to the 7-item short form.
Conclusion:
Results indicate that the PLUS-M computerized adaptive test is most efficient, and differences in scores between administration methods are minimal. The main advantage of the computerized adaptive test was more reliable scores at higher levels of mobility compared to short forms.
Clinical relevance
Health-related item banks, like the Prosthetic Limb Users Survey of Mobility (PLUS-MTM), can be administered by computerized adaptive testing (CAT) or as fixed-length short forms (SFs). Results of this study will help clinicians and researchers decide whether they should invest in a CAT administration system or whether SFs are more appropriate.
Keywords
Background
Instruments developed with modern psychometric methods are no longer static instruments that require the same questions to be administered to the same person. New instruments, called item banks, allow for dynamic administration by computerized adaptive testing (CAT) 1 and allow for the items to be tailored to the person. CAT uses an algorithm to choose the next item based on how the respondent answers previous items. Simulation studies found CAT can achieve a reliable score in 4–5 items and provide more precise scores than fixed-length instruments, especially for those very high or very low level of the trait measured (e.g. prosthetic mobility).2–4
A subset of items from item banks are typically called short forms (SFs). SFs are fixed-length instruments developed to measure well across the whole range of the trait, or to target high or low trait levels. 1 Because SFs administer the same items to all respondents, they cannot measure with the same precision as CAT across the whole trait continuum. Advantages of SFs are that they are familiar to respondents and can be administered on paper or by computer. While CATs have several advantages over SFs, they also require a computer and software with a CAT algorithm to administer and score the instrument. Depending on the importance of score precision and efficiency, CAT administration may or may not outweigh the technical and computing requirements needed for its implementation. 5
In this study, we examined the differences between CAT and SF administration of the Prosthetic Limb Users Survey of Mobility (PLUS-M™). PLUS-M is an item response theory (IRT)-based item bank that measures mobility of people with lower limb amputation (LLA). One of the advantages of IRT-based item banks like PLUS-M is that regardless of what items are administered or the method of administration (i.e. CAT or SF) chosen, scores are on the same metric and directly comparable. We compared the performance and efficiency of PLUS-M CAT and two fixed-length SFs. While simulation studies3,4 have found CAT to be efficient, the amount of time saved depends on the item bank administered, and to what instrument (e.g. SF) the CAT performance is compared. The purpose of the study was to quantify the differences between SFs and CAT to provide researchers and clinicians with guidance on selecting the most appropriate PLUS-M instrument for their application. We expected that (1) correlations between PLUS-M CAT and SFs scores from the same individuals would be high, (2) the PLUS-M CAT would require fewer items than the SFs to achieve an accurate score, and (3) PLUS-M CAT would produce more precise scores at the lowest and highest levels of mobility, compared to either of the SFs.
Methods
Different methods for administering PLUS-M instruments were evaluated using data collected from two studies. Data from electronic versions of the PLUS-M CAT and SFs were collected as part of a study designed to examine psychometric properties of the PLUS-M item bank (study 1). Data from paper versions of PLUS-M SFs were collected specifically for this analysis (study 2).
Participants
Study 1
Individuals with LLA were recruited from multiple clinical sites across the United States. Recruitment methods included print media and direct recruitment from clinics or research registries. Study participants were eligible if they (1) were 18 years of age or older; (2) could read, write, and understand spoken English; (3) had a unilateral leg amputation (i.e. at or above the ankle and below the hip) that was the result of trauma, dysvascular complications, tumor, or infection; (4) regularly used a prosthesis for the previous 6 months or more; and (5) were a patient at a participating recruitment site and were scheduled to receive a replacement prosthesis or major prosthetic component likely to affect mobility (i.e. prosthetic socket or microprocessor-controlled prosthetic knee).
Study 2
Individuals with LLA were recruited through a registry of people interested in participating in research. Study participants were eligible to participate in study 2 if they met criteria 1–4 from study 1.
Procedures
Study 1
Participants in study 1 completed an electronic survey on a tablet computer (Apple Ipad 2; Cupertino, CA, USA) during a visit to their prosthetics clinic. The survey included demographic and amputation-related questions, in addition to PLUS-M items. Participants in this study completed both the PLUS-M CAT and SFs using the Assessment Center, an online research management tool that enables researchers to create study-specific websites for securely capturing participant data. 6 Administration time was recorded electronically for all items.
Study 2
Participants in study 2 completed a paper survey that was mailed to their home. Participants were randomly assigned to complete the 7-item SF (SF-7) or the 12-item SF (SF-12). The survey included demographic and amputation-related questions, in addition to the PLUS-M instrument. Participants were mailed a packet containing instructions and a paper survey in a sealed envelope, and instructed not to open the envelope until contacted by study staff. During a scheduled phone call, participants opened and completed the survey while study staff recorded the time. In addition, time required by researchers to score SFs (e.g. reading scoring instructions and calculating T-scores) was measured. All procedures for study 1 and study 2 were approved by a University of Washington institutional review board, and all participants provided informed consent.
Measures
Demographic and amputation-related information
Participants provided information about their amputation including amputation etiology, level, and age at and time since amputation. Participants also responded to questions about their age, gender, education, ethnicity, and employment.
PLUS-M
The PLUS-M is a self-report measure of mobility of adults with LLA who use prosthesis.7,8 The PLUS-M item bank includes 44 items calibrated to an IRT model. The PLUS-M CAT and SFs use items from the item bank, and all scores are on the same T-score metric and directly comparable. SF-7 and SF-12 were developed to measure a broad range of mobility. All items of the SF-7 are included in the SF-12. A PLUS-M score of 50 (standard deviation (SD) = 10) represents the mean of the development sample. 9 All analyses presented were completed using the IRT-based T-scores. CAT and SFs are freely available to all users at www.plus-m.org.
CAT administration
Participants in study 1 completed the PLUS-M CAT. The CAT was set to administer the same first item (i.e. “are you able to keep up with others when walking?”) to every participant with subsequent items selected based on the participant’s previous responses. IRT analyzes rank-order items by difficulty, and the CAT algorithm picks each subsequent item to most closely match the respondent’s reported level of the trait (e.g. mobility in this case). For instance, if a person reports no difficulty keeping up with others, the PLUS-M CAT chooses a more difficult item, like walking up and down steep stairs in a crowded stadium. The algorithm was set to administer a minimum of four items and to stop administration when the standard error (SE) associated with the respondent’s score dropped to 3.0 or below, or a maximum of 12 items had been administered. The SE stopping rule was selected as an SE of 3.0 corresponds to a conventional reliability of 90% for an IRT-based T-score.10,11
SF administration
All participants completed PLUS-M SFs. Study 1 participants completed electronic SF-7 and SF-12, and study 2 participants completed paper SF-7 or SF-12. SFs were scored according to the instructions in the PLUS-M users guide. 9 Study 2 participants were randomly assigned either the SF-7 or SF-12. Time to complete the SF was recorded by study staff during the phone call with the participant. Responses were double-entered and scored by a SAS (SAS Institute Inc.; Cary, NC) algorithm that uses the lookup tables published in the PLUS-M users guide. 9 Table 1 summarizes the measures and mode of administration for each study.
Summary of mode of administration, measures, and overall study objectives.
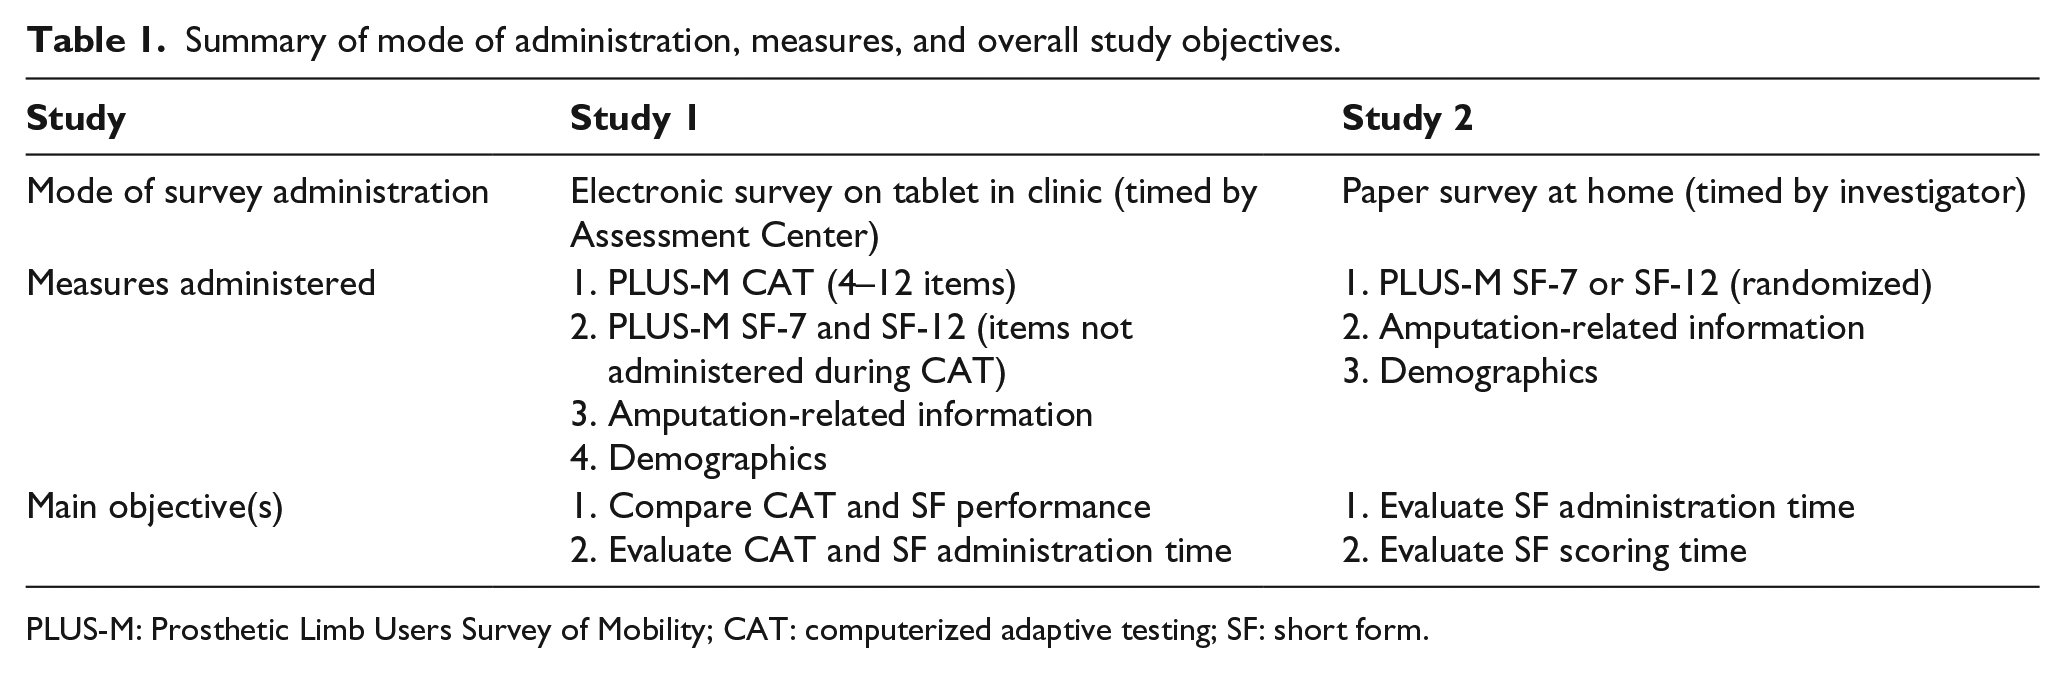
PLUS-M: Prosthetic Limb Users Survey of Mobility; CAT: computerized adaptive testing; SF: short form.
Three research assistants and three clinicians unfamiliar with the SFs were timed while they read the scoring instructions (once each) and calculated scores for ten SFs (i.e. five SF-7 and five SF-12). Manual scoring included summing the individual item scores and converting raw scores to T-scores using the appropriate PLUS-M lookup table.
Analysis
CAT and SF comparisons
Using study 1 data, performance of the CAT was compared to the SFs using a number of metrics. CAT and SF scores, SEs, and effective ranges of measurement were compared. Effective range of measurement was defined as range for which participants’ scores had a reliability of at least 90%. 12 CAT and SF scores from study 1 were correlated using Pearson’s correlation to examine correspondence, and average score differences were calculated. Finally, we examined the average number of items administered by CAT and calculated the range of scores that typically required CAT administer only four items.
Administration time
Relative efficiency of the PLUS-M instruments was evaluated using administration time as a primary metric. Administration time of the CAT (study 1) and SFs (study 1 and 2) were calculated and compared. Data from participants whose response time was less than 1 s per item were excluded from analyses, in accordance with procedures used in prior studies. 13 Administration times for electronically administered SFs and CAT were calculated by summing the response times to each of the individual items. Administration times for the paper SFs were measured directly by study staff during the phone call and were used to calculate average completion times. Administration times that were more than 2.5 SD greater than the average administration time were considered outliers and excluded. 14
Results
Participants
A total of 199 individuals completed the CAT and electronic SFs in study 1 and 60 individuals completed paper SFs (30 each SF) in study 2 (Table 2).
Demographics and amputation-related characteristics of study samples.
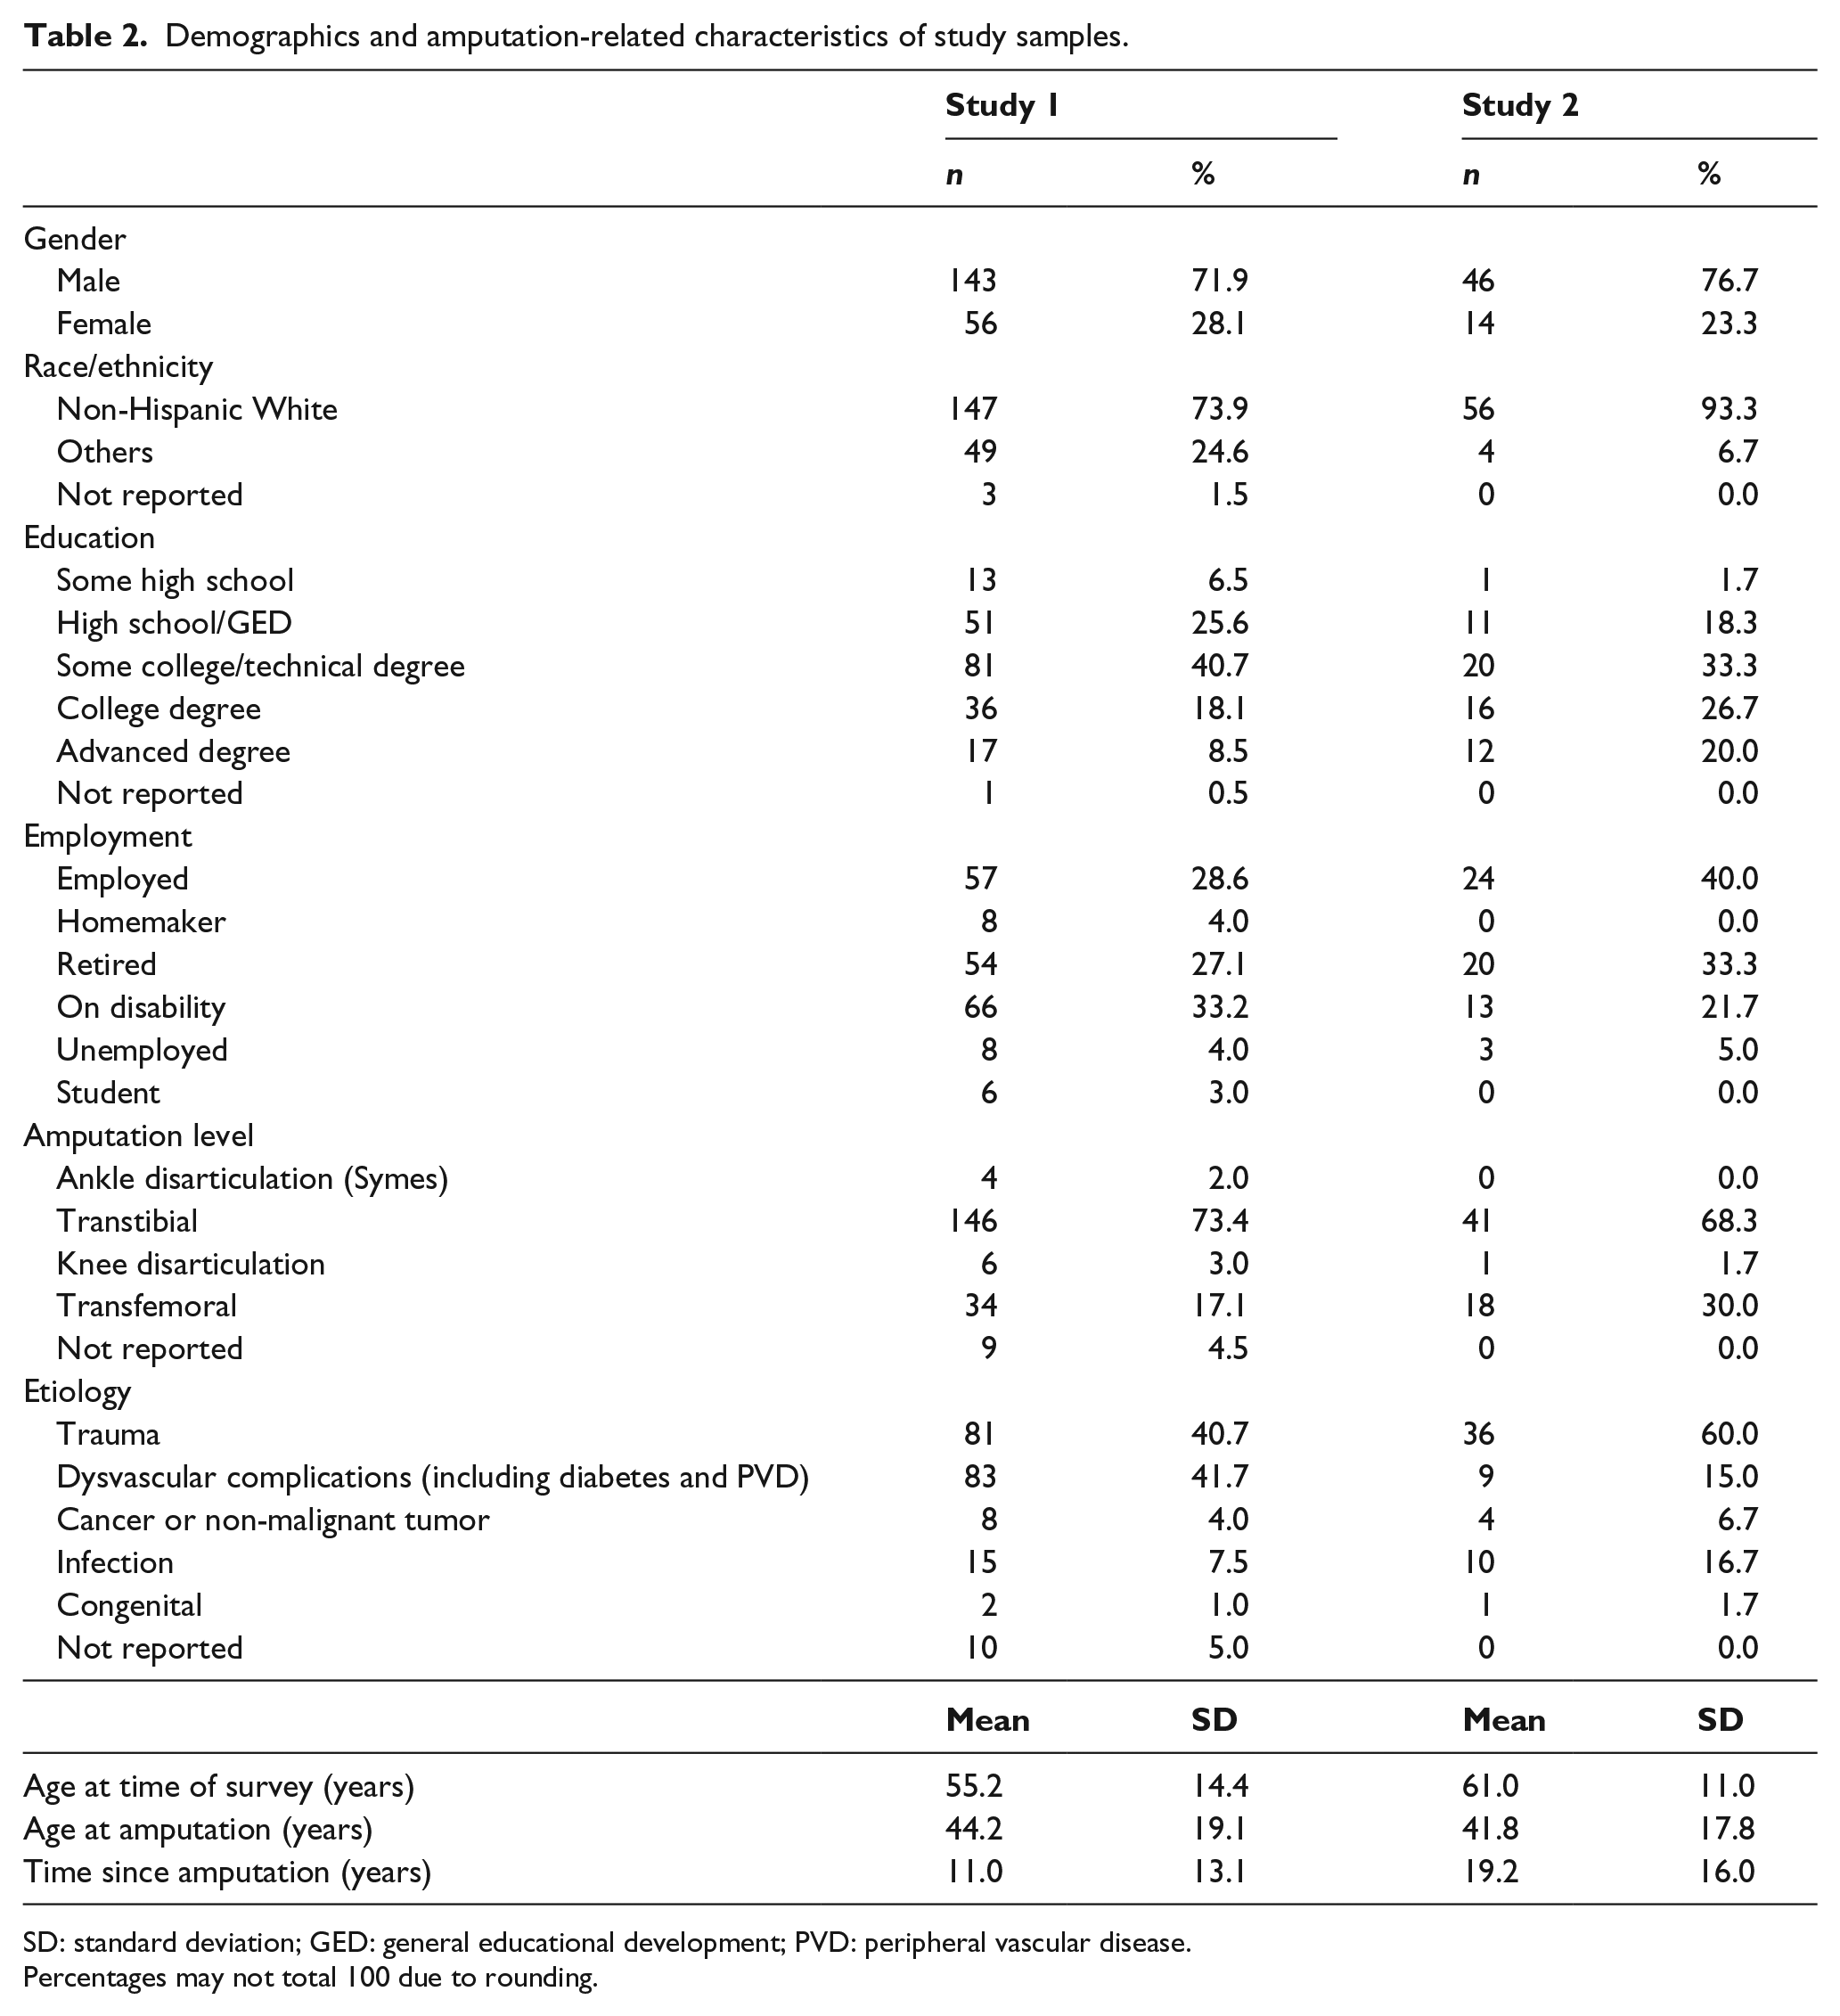
SD: standard deviation; GED: general educational development; PVD: peripheral vascular disease.
Percentages may not total 100 due to rounding.
CAT and SF comparisons (study 1 electronic administration)
Score precision
Average SEs associated with PLUS-M scores from the study 1 sample were 2.7 (SD = 0.3) for the CAT, 2.2 (SD = 0.5) for the SF-12, and 2.9 (SD = 0.5) for the SF-7. Almost all (97%, n = 194) CAT scores, 92% of SF-12 scores (183 out of 199), and 70% (n = 139) of SF-7 scores achieved an SE less than 3.0. The average score for participants with an SE greater than 3.0 was 64.8 for the CAT (n = 5), 62.6 for the SF-12 (n = 16), and 59.0 for the SF-7 (n = 60).
Figure 1 shows the relationship between SE and PLUS-M instrument scores. Scores with reliability greater than 90% ranged from 23.5 to 69.1 (n = 196; 98%) for the CAT, 27.2 to 62.5 (n = 191; 96%) for the SF-12, and 34.4 to 55.3 (n = 153; 77%) for the SF-7. The SF-7 had the narrowest effective range of measurement, relative to the CAT and SF-12. CAT provided scores with reliability greater than 90% for about a half of participants with highest mobility (n = 6 of 13, 46%), while neither SF achieved 90% reliability for scores of 60 or more.
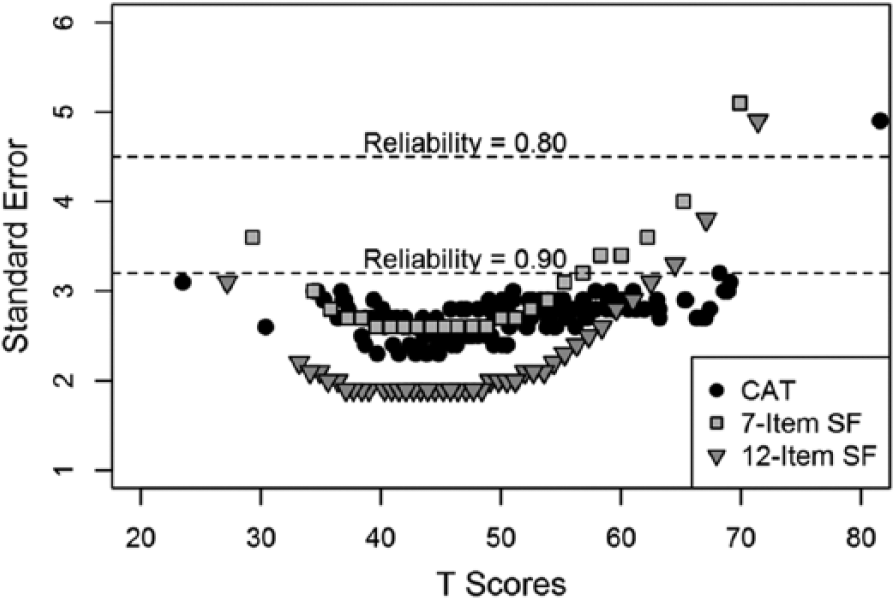
Relationship between standard errors and PLUS-M scores across three administration methods.
Score differences and correlations
Mean scores for the CAT, SF-12, and SF-7 were 50.8 (SD = 8.6), 50.3 (SD = 7.9), and 50.5 (SD = 7.7), respectively. Correlations between the CAT and both SFs were 0.90. Correlation between the two SFs was 0.98. Mean differences in scores across the score continuum never exceeded 0.5, which is negligible considering the SD of 10.
Number of items administered
On average, the CAT administered five items (SD = 1.9; range = 4–12). About 60% of participants (n = 119) responded to the minimum number of items (i.e. 4), 21% (n = 41) answered 5 items, and 9% (n = 17) responded to 6 items before the SE stopping rule was reached. About one-third of the participants (n = 65) would have met the SE cutoff with only three items, but none would have achieved the cutoff with only two items. In total, 7 participants completed 12 items, the maximum number administered by the CAT algorithm. The mobility level of these seven participants was either very low or very high, or their responses varied greatly item-to-item. The CAT was most efficient (i.e. needed only four items to estimate a reliable score) for participants with scores between 35 and 55 (n = 119, average SE = 2.6). On average, the CAT algorithm administered three items from the SF-12 (range = 2–6) and two items from the SF-7 (range = 1–4).
Administration time
Study 1 electronic administration
Data from 182 participants (i.e. 1⩽ item response time ⩽59.8 s) were used to determine the CAT administration time. On average, the CAT took 68.9 s to administer and score. Responding to CAT items required an average of 13.8 s per item. Similarly, data from 143 participants (i.e. 1⩽ item response time ⩽48.8 s) were used to calculate the SF-12 administration times. Mean time to complete the SF-12 was 124.5 s (i.e. 10.4 s per item). Data from 154 participants (i.e. 1⩽ item response time ⩽52.9 s) were used to calculate the administration time for the SF-7. The mean time to completion for the SF-7 was 82.9 s (i.e. 11.9 s per item).
Study 2 paper administration
Data from 60 participants (i.e. n = 30 each for the SF-7 and SF-12) were used to determine paper administration times. On average, participants required 86.2 (SD = 37.6) s to complete the SF-12 and 73.1 (SD = 35.3) s to complete the SF-7 on paper. Research assistants and prosthetists (n = 6) required, on average, 163 (SD = 61.3) s to read the scoring instructions. Manually scoring surveys required, on average, 36.6 (SD = 15.1) s for the SF-7 and 47.5 (SD = 21.1) s for the SF-12.
Discussion
Overall results indicate that any of the three PLUS-M instruments can be used to accurately assess mobility in people with LLA. As expected, only the CAT achieved reliability greater than 90% for people with scores greater than 60. This finding is consistent with published literature.5,15 In contrast to our hypothesis, both CAT and SFs achieved acceptable precision at the lower end of mobility, likely due to inclusion of more items targeted to lower mobility levels on SFs.
CAT obtained adequately precise scores in more than half of the study participants (60%) using only four items and one-third (33%) would have met the SE cutoff with only three items. The CAT was also more time-efficient than either of the SFs. However, administration time saved with the CAT relative to SFs was small because the SFs are also very efficient. It is important to note that CAT times include time for both administration and scoring because scores are automatically generated by the CAT algorithm. Electronically administered SFs in this study required additional scoring time, although it is possible to set up automatic scoring software or algorithms for SFs administered via computer. Scoring paper surveys added an average of 37 and 48 s to the overall administration time for SF-7 and SF-12 respectively, making CAT 37%–49% more efficient than paper SFs. The study results suggest that when practical, the PLUS-M CAT should be considered in place of SFs when minimizing respondent burden and maximizing score precision is a priority.
Results of this study are similar to previously published studies. Choi et al. 5 used computer simulation to compare CAT and eight-item SF for PROMIS depression and found a correlation of 0.96 between the CAT and SF scores. Similar to our study, the CAT was more efficient than the SF and required only five items on average to estimate a reliable score. Fries et al. 16 compared the performance of the 10- and 20-item PROMIS physical function SF with 10-item CAT in 378 people with arthritis. The 10-item CAT outperformed the SFs.
One benefit of CAT that is not directly explored in this study is the flexibility to modify the CAT administration rules to match specific study requirements. 1 Users interested in measuring prosthetic mobility with greater precision could use a PLUS-M CAT stopping rule with a lower SE to achieve a highly reliable score and maximize the likelihood that a smaller treatment effect would be detected. In a clinical setting where efficiency may be more important than score precision, the minimum number of items administered could be set to 2 or 3, or the SE threshold could be relaxed to 3.5 or 4. Such a change would result in fewer items being administered and reduce the overall time of administration.
The need for appropriate computer hardware and software is currently the biggest disadvantage of CAT. At present, CAT administration is not integrated into most electronic survey administration platforms, with notable exceptions like the PROMIS Assessment Center 6 and Research Electronic Data Capture (REDCap), 17 though these platforms only provide preprogrammed PROMIS instruments at this time. Until CAT is more readily available, fixed-length SFs are excellent alternatives for clinicians and researchers who wish to use IRT-based item banks, like PLUS-M. Paper- and pencil- or computer-administered SFs are often convenient and easy to administer and, in the case of PLUS-M, produced scores that are highly correlated with CAT scores. Although SF scores are generally not as precise as CAT scores at the extremes of the instrument range,5,16 the PLUS-M SFs in this study provided reliable scores along most of the mobility continuum and therefore can be used with confidence as alternatives to CAT.
A disadvantage of the CAT administration software used to collect data for this study was that stopping rules could not be adjusted to reduce the number of items for respondents at the extremes of the mobility continuum. As a result, people with very low or very high mobility were asked to respond to the maximum number of items. More sophisticated stopping rules would allow the CAT to terminate when items provide little information toward the assessment, even when the SE threshold has not been achieved. 18
This study has several limitations related to the sample and methodology used. For both study 1 and study 2, a convenience sample was used that may not represent the population of individuals with LLA. Study 2 collected administration times for paper SF by participants’ self-report on the phone. Participants may have read the survey prior to the timed administration, which could have resulted in an underestimation of response time.
Conclusion
Both PLUS-M CAT and SFs provided reliable scores and were efficient to administer. Users can use convenience and feasibility to choose the version of PLUS-M to administer. While PLUS-M CAT is fastest to administer and provides the most precise scores, especially for those at the higher mobility levels, the gains may not be sufficient to justify the expense of programming CAT.
Footnotes
Acknowledgements
The content is solely the responsibility of the authors and does not necessarily represent the official views of the National Institutes of Health. The contents of this publication do not necessarily represent the policy of NIDILRR, ACL, and HHS, and you should not assume endorsement by the Federal Government.
Author contribution
All authors contributed equally in the preparation of this manuscript.
Declaration of conflicting interests
The author(s) declared no potential conflicts of interest with respect to the research, authorship, and/or publication of this article.
Funding
The author(s) disclosed receipt of the following financial support for the research, authorship, and/or publication of this article: This research was supported by the National Center for Medical Rehabilitation Research (NCMRR) and National Institute of Child and Human Development of the National Institutes of Health (NIH grant no. HD-065340). The contents of this publication were also developed in part under a grant from the National Institute on Disability, Independent Living, and Rehabilitation Research (NIDILRR grant no. H133P120002). NIDILRR is a Center within the Administration for Community Living (ACL), Department of Health and Human Services (HHS).