
Abstract
Suicide rates have increased in a number of countries over the past 20–30 years [1, 2], with a higher rate of increase noted among young male [3, 4]. In New Zealand, suicide accounts for approximately one-third of all-cause mortality among men aged between 20 and 35 years [4]. Overall suicide rates in New Zealand rose steadily until the late 1990s, after which there was a small decrease until 2003, the latest year for which figures are available [5]. Between 1978 and 1998 overall suicide rates increased by >40% [6]. However, among men aged 15–24 the age-specific suicide rate more than doubled [6], although more recently this rate has declined [5]. Similarly, for men aged 35–44 there has been a steady increase in suicide rates throughout the past 20 years [5]. In contrast, female suicide rates among all ages have risen only slightly during the same period [6]. Comparable countries such as Australia have shown similar trends [7].
As part of these general trends, there have also been observations of growing social inequalities in suicide rates. For health outcomes, including suicide, such inequalities are commonly investigated using either individual level social class or material wealth measures, or indicators of geographical area deprivation. Inequalities in male suicide rates have been observed using both approaches, between different social groups [8], and areas of differing socioeconomic disadvantage [9, 10]. A recent review of the international literature showed that the relationship between area socioeconomic status and area suicide rates was stronger in more recent time periods, therefore suggesting increased social polarization in suicide rates [11]. For example, in Scotland suicide rates among young adults have become more socially polarized as rates have disproportionately risen in deprived areas of the country [12].
In New Zealand, the social inequalities in suicide rates among men aged 25–44 increased during the 1980s and 1990s, with those in low-income groups experiencing much greater increases in suicide rates than those in higher income groups [13, 14]. This period is of particular interest in relation to the social pattern of suicide because New Zealand society underwent rapid social and economic change during these years, and this has been shown to be associated with widening social and ethnic health disparities [15]. However, trends in geographical inequalities in suicide in New Zealand during this period have not been investigated. This is despite the growing international interest in geographical inequalities in health [16–19] as well as the emerging recognition of the importance of geographical context in explaining health outcomes [20–22] including suicide [23, 24]. In this paper we investigate the association between social inequalities and suicide rates from an area perspective, building on earlier work examining geographical inequalities in all-cause mortality [17, 18]. We examine changes in suicide rates for men aged 15–44 between 1980 and 2001, by District Health Boards (DHBs; New Zealand's administrative health districts) and by small area deprivation.
Method
Data
Individual-level suicide cases were provided by the Ministry of Health for the period 1980–2001 (suicide and self-inflicted injury/poisoning, ICD-9 codes E950-E959) and the data for a subset of men aged 15–44 were extracted. The inclusion of the domicile code allowed each record to be matched with a Census Area Unit (CAU) code and hence for population data from each of the 5 yearly censuses to be linked. CAUs are the second smallest unit of dissemination of census data in New Zealand, with each area representing approximately 2300 people. There were a total of 10 005 suicide cases (male and female, of all ages) during the study period, of which almost half (n = 4994) were men aged 15–44. For a small number of cases (9.5%) the domicile code was not available and these records were excluded from the analysis. Age- and sex-specific population data were also extracted for each census during the study period (1981, 1986, 1991, 1996 and 2001) for all CAUs using consistent (2001) boundaries.
Analysis
Three year averaged age-standardized rates of suicide were calculated for the 21 DHBs across the country for five time periods (1980–1982, 1985–1987, 1990–1992, 1995–1997 and 1999–2001). All rates were standardized to the standard New Zealand population in 1991 (the mid-point of the study period). The DHBs were formed in 2001 and are responsible for the provision of health and disability services in the region. Although DHBs did not exist as administrative units during the period of study, they were formed from longstanding administrative units based around major hospitals that were responsible for the provision of secondary and tertiary health services in their geographical districts. The boards’ catchment areas are aggregations of CAUs. They have an average population size of 194 000 and range in size from 31 000 to 489 000 [25]. To examine regional changes in suicide rates over the study period, the ratio of the age-standardized rates at the start and end of the study period (1999–2001:1980–1982) were calculated for each DHB.
To consider whether inequalities in suicide rates among men aged 15–44 between rich and poor areas of New Zealand have grown during the 1980s and 1990s, suicide rates between areas of differing levels of social deprivation were compared. All CAUs across New Zealand were aggregated into quintiles of deprivation, defined using the 2001 New Zealand Deprivation Index (NZ Dep 2001) [26]. The index is based on nine socioeconomic variables taken from the 2001 New Zealand census [27] that has been widely used in a range of health-related studies [28, 29].
Significant changes in the relative ranking of CAUs during the study period are unlikely, despite some absolute changes in deprivation [30], meaning that using the deprivation score in 2001 for all of the analysis is acceptable. To provide a measure of geographical inequality, the ratio of the age-standardized rate in quintile 5 compared to quintile 1 was calculated for each time period (again all rates were standardized to the standard New Zealand population in 1991).
Results
The 3 year averaged age-standardized rates of suicide increased among men aged 15–44, from 16.6 cases per 100 000 in 1981 to a high of 34.8 in 1997 (Figure 1). Since 1997 the rate has reduced slightly to 31.9 in 2000. Further, the age-specific rates (15–24, 25–34 and 35–44) all increased during the period 1981–2001 (Figure 1). The rates of suicide increased from around 17 cases per 100 000 in 1981 for all three age groups to 37.1 for those aged 15–24, 39.2 for 25–34 and 27.0 for 35–44 in the mid–late 1990s. Towards the end of the study period, there was some reduction in suicide rates in the two younger age groups but rates remained relatively stable among men aged 35–44.
Trend in suicide among men aged 15–44 (overall age-standardized rate and age-specific rates for men aged 15–24, 25–34 and 35–44).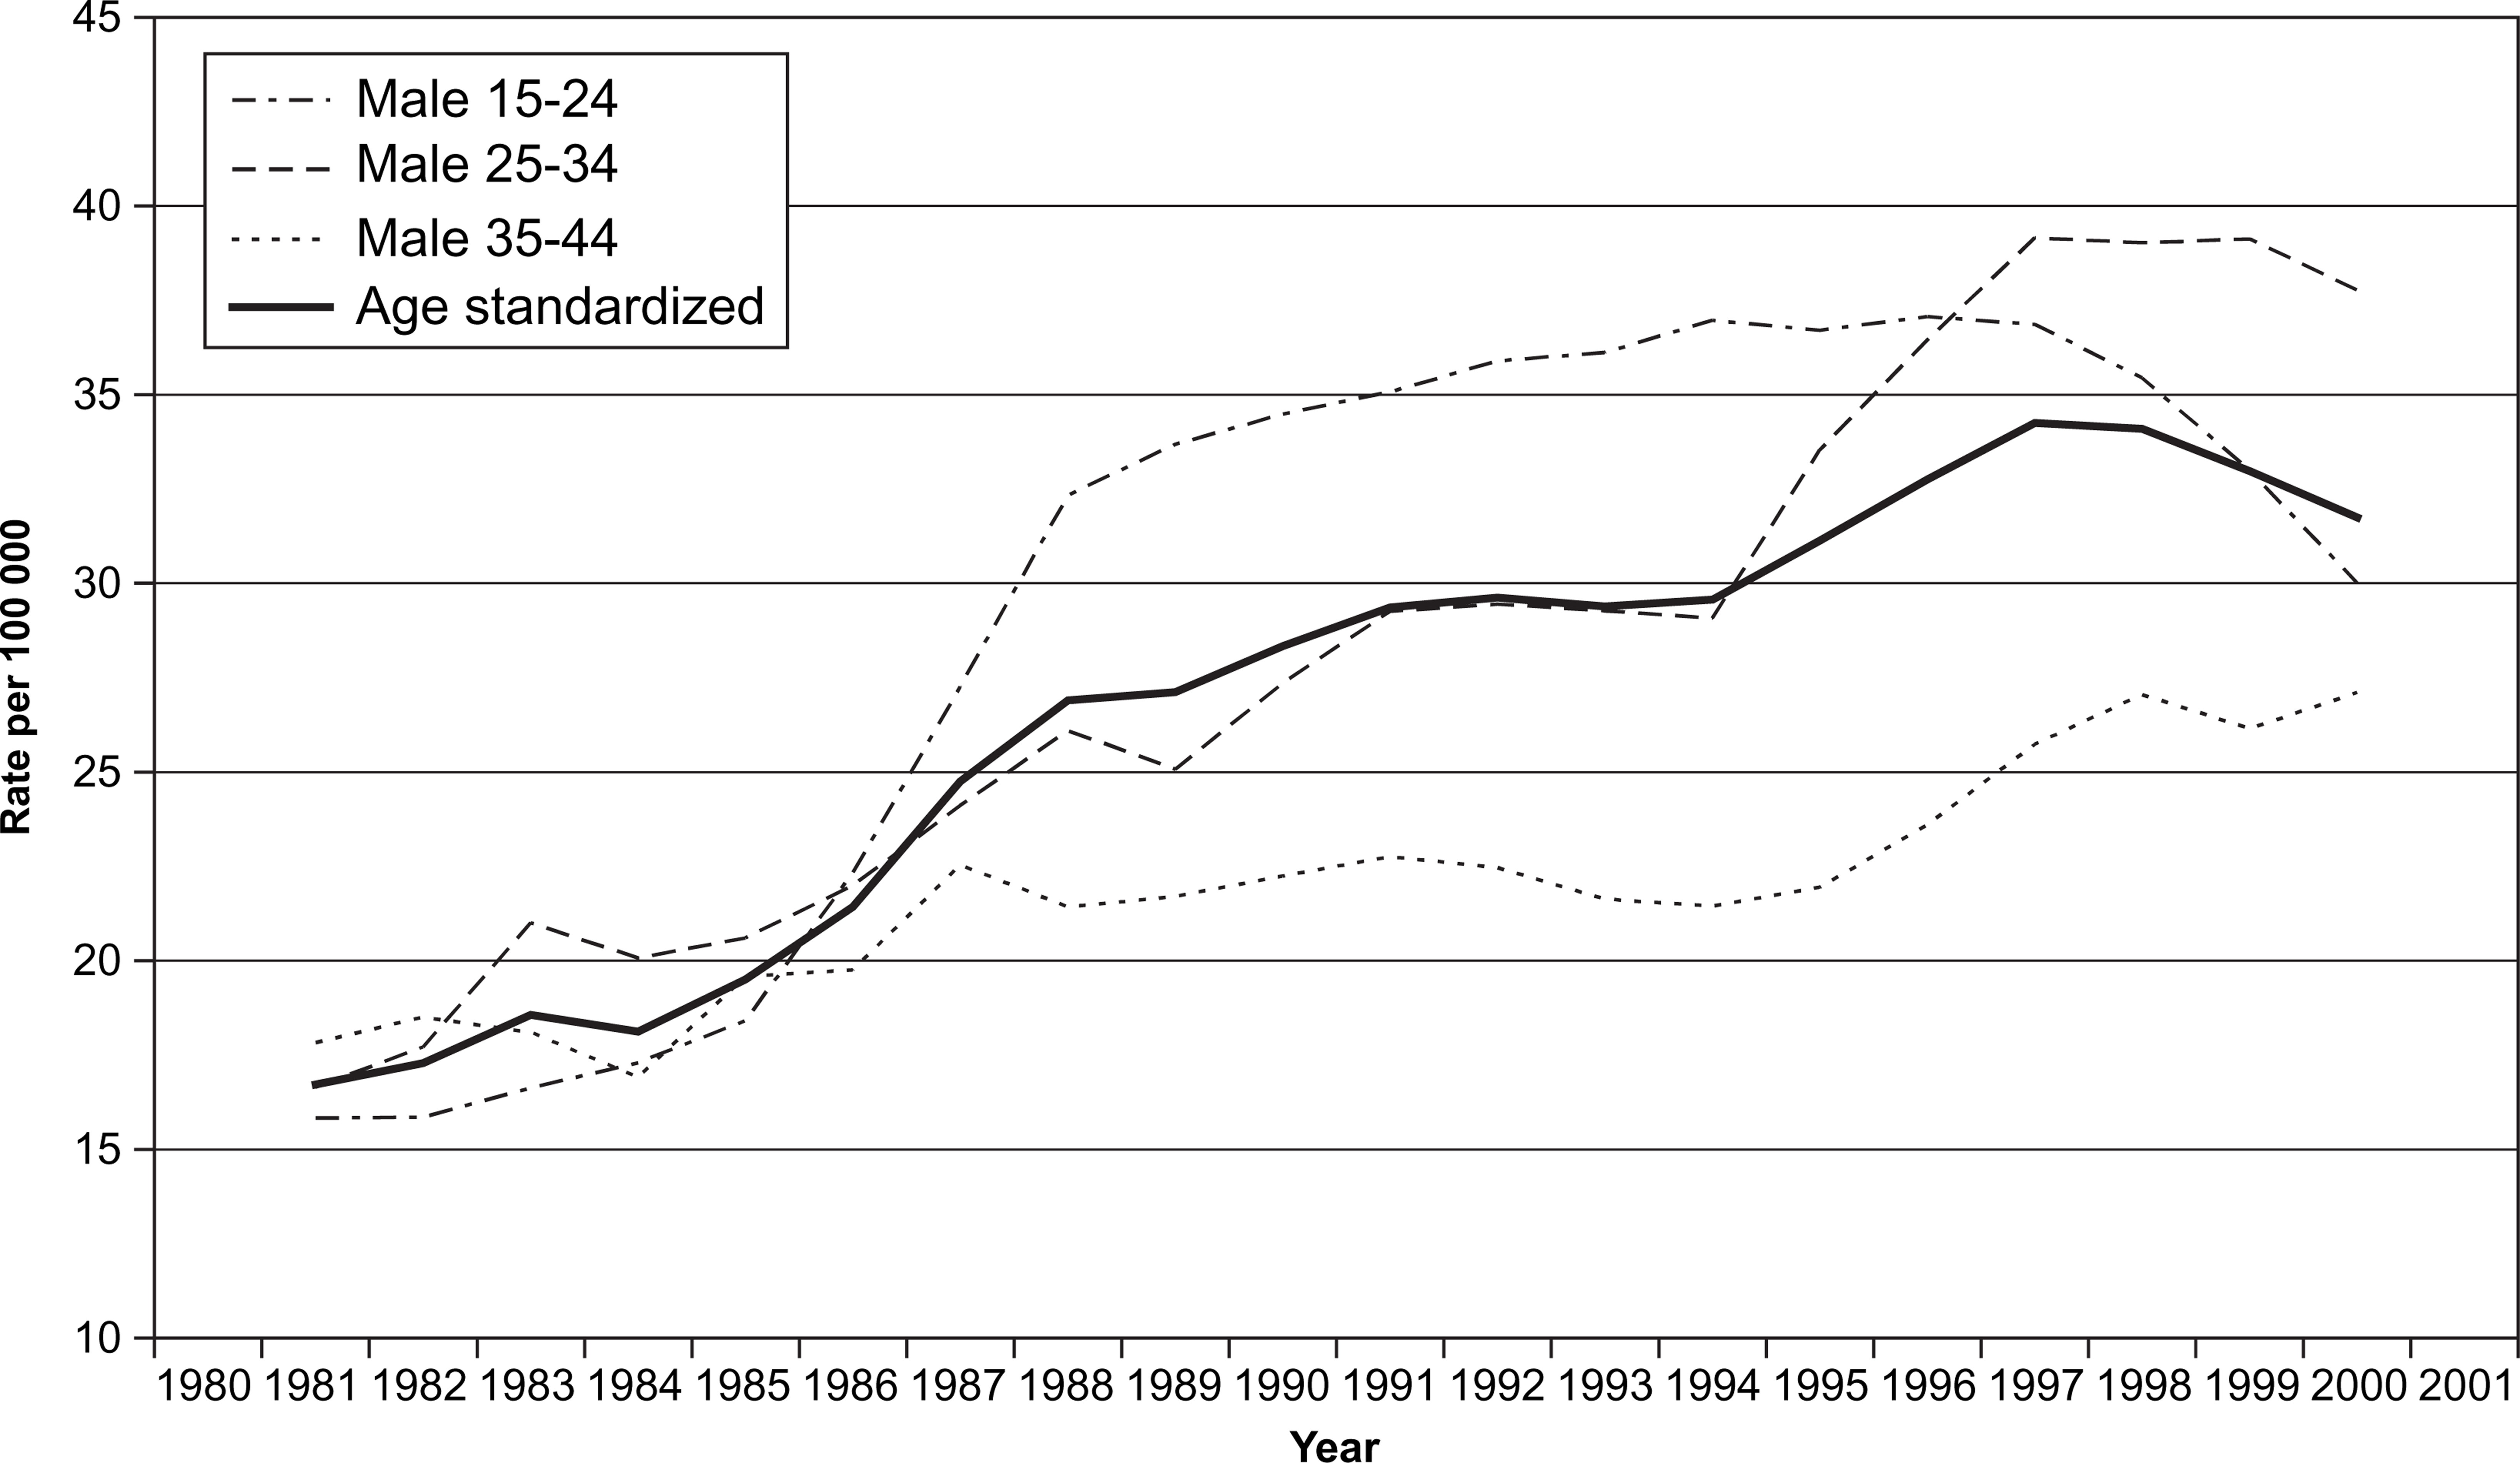
There was background national-level geographical inequality in the change in suicide rates during the study period. Rates of suicide among young male individuals increased in most, but not all, regions of New Zealand between the start and the end of the study period (Table 1). Most regions had rates that at least doubled over the 20 year period. In two regions (Auckland and Wairarapa), rates decreased slightly during the 1980s and 1990s. It should be noted that in some DHBs at particular 3 year periods the rates were based on small numbers of cases (rates in italics) and should be treated with caution.
Geographical inequality in suicide rates (men aged 15–44), 1980–2001
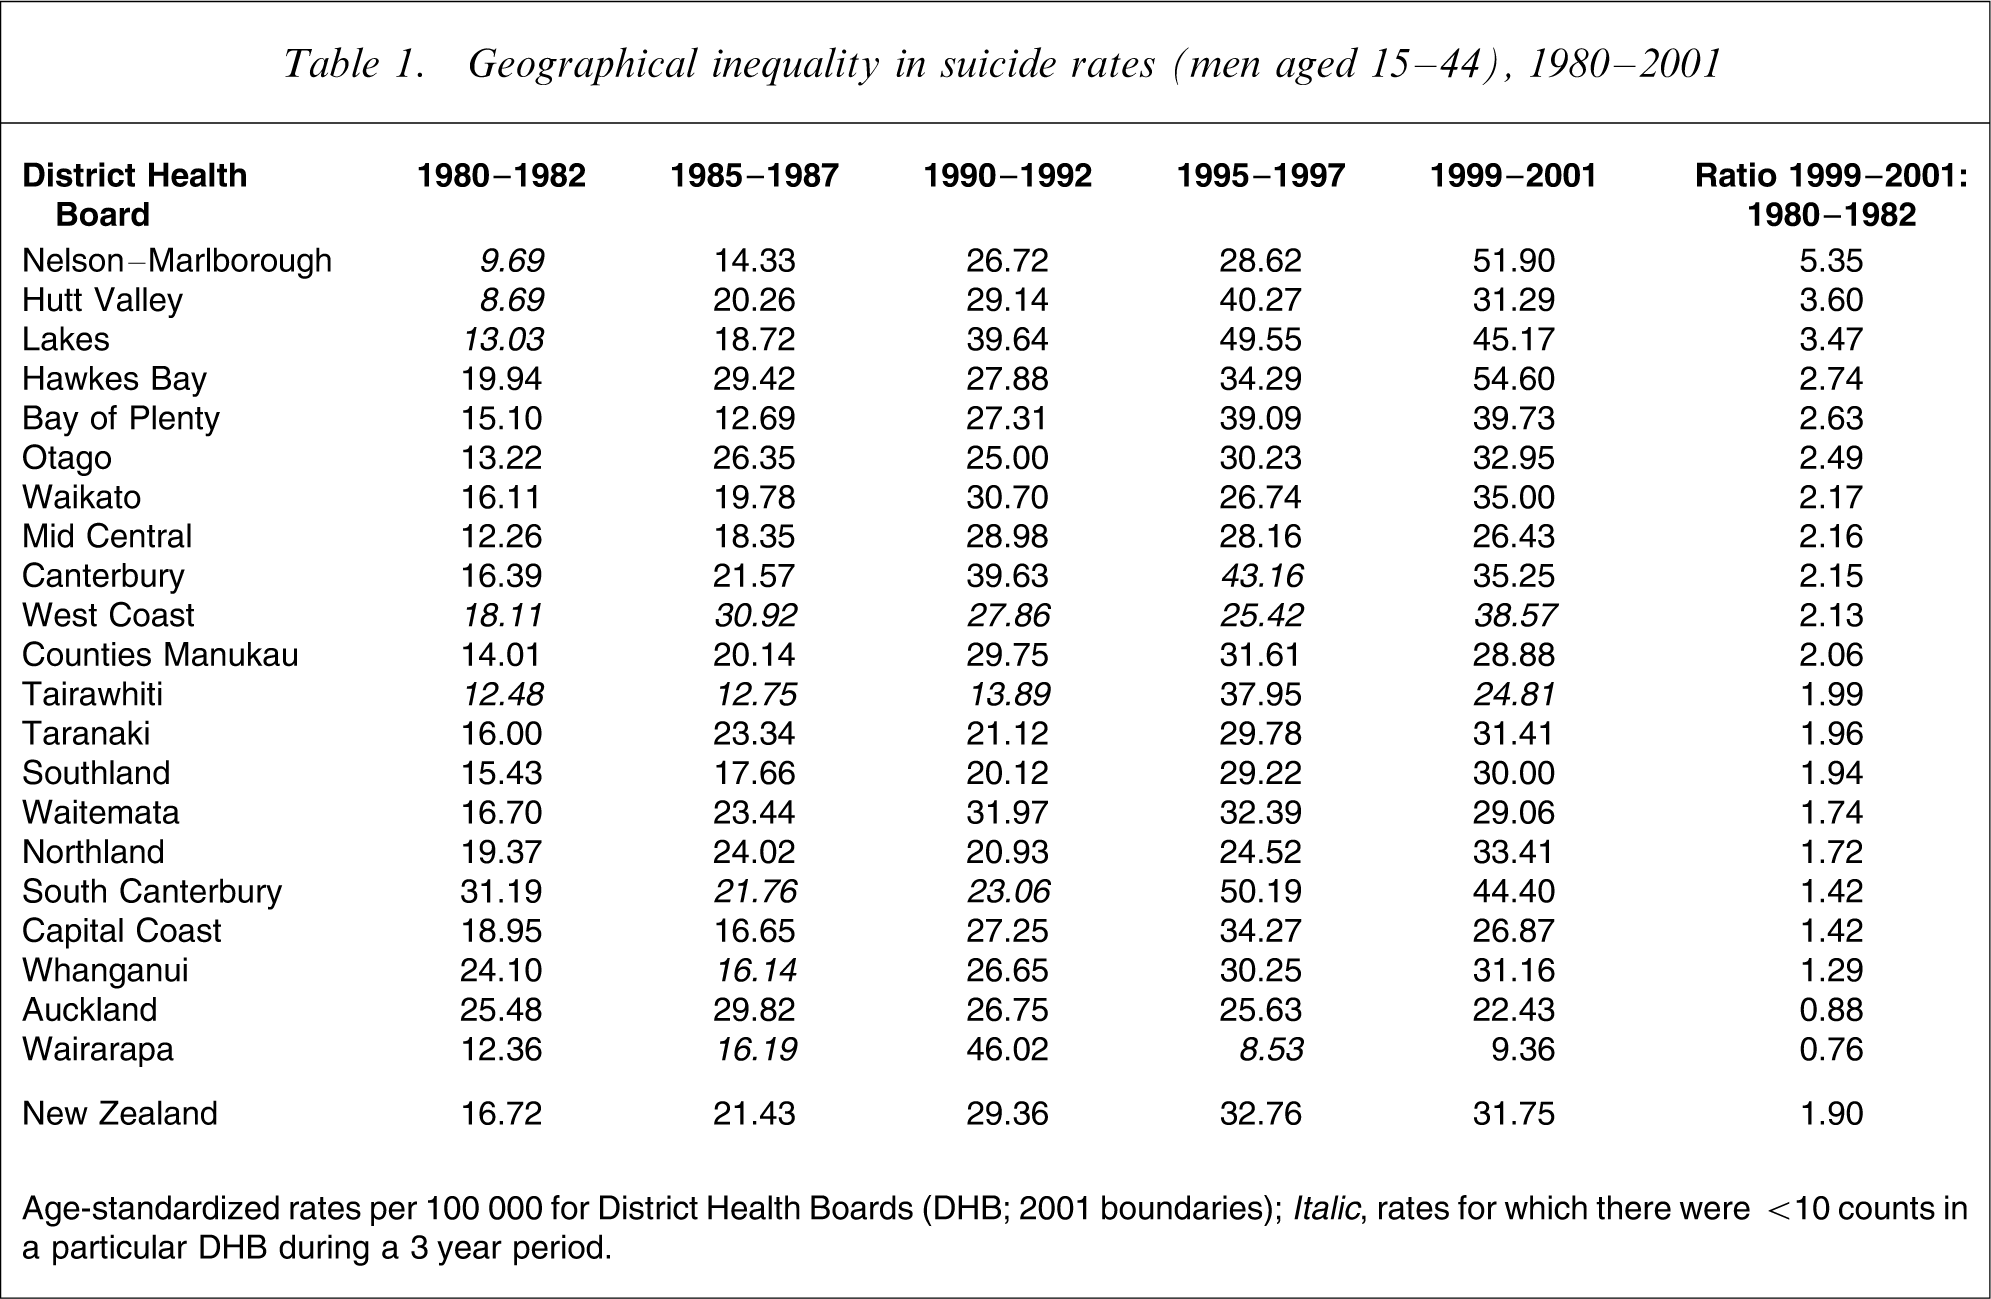
Age-standardized rates per 100 000 for District Health Boards (DHB; 2001 boundaries); Italic, rates for which there were <10 counts in a particular DHB during a 3 year period.
The growth in suicide rates among men aged 15–44 during the 1980s and 1990s was accompanied by increasing levels of geographical inequality in suicide rates. Although the rates of suicide increased in all deprivation quintiles between 1980 and 2001, the increases were greater in the more deprived areas of New Zealand (Figure 2). The age-standardized rate of suicide (cases per 100 000) in deprivation quintile 1 (low deprivation) increased from 13.0 at the start of the study period to a high of 23.7 in 1995–1997 followed by a decrease to 19.8 in 1999–2001. This compared to quintile 5 (high deprivation) where suicide rates increased from 21.9 in 1980–1982 to a high of 40.9 in 1995–1997, which declined to 36.5 in 1999–2001. The ratio of the rate in quintile 5 to quintile 1 increased from 1.68 to 1.86 over the whole study period but reached a peak of 1.94 in 1990–1992 (Table 2). The biggest increase was between 1985–1987 and 1990–1992, when the ratio of inequality increased by almost 20% during that 5 year period. In 1990–1992 when levels of inequality were at their peak, suicide rates in the most deprived fifth of areas in New Zealand were almost twice as high as those in the most prosperous quintile.
Age-standardized rates of suicide among men aged 15–44 in deprivation quintiles, 1980–2001.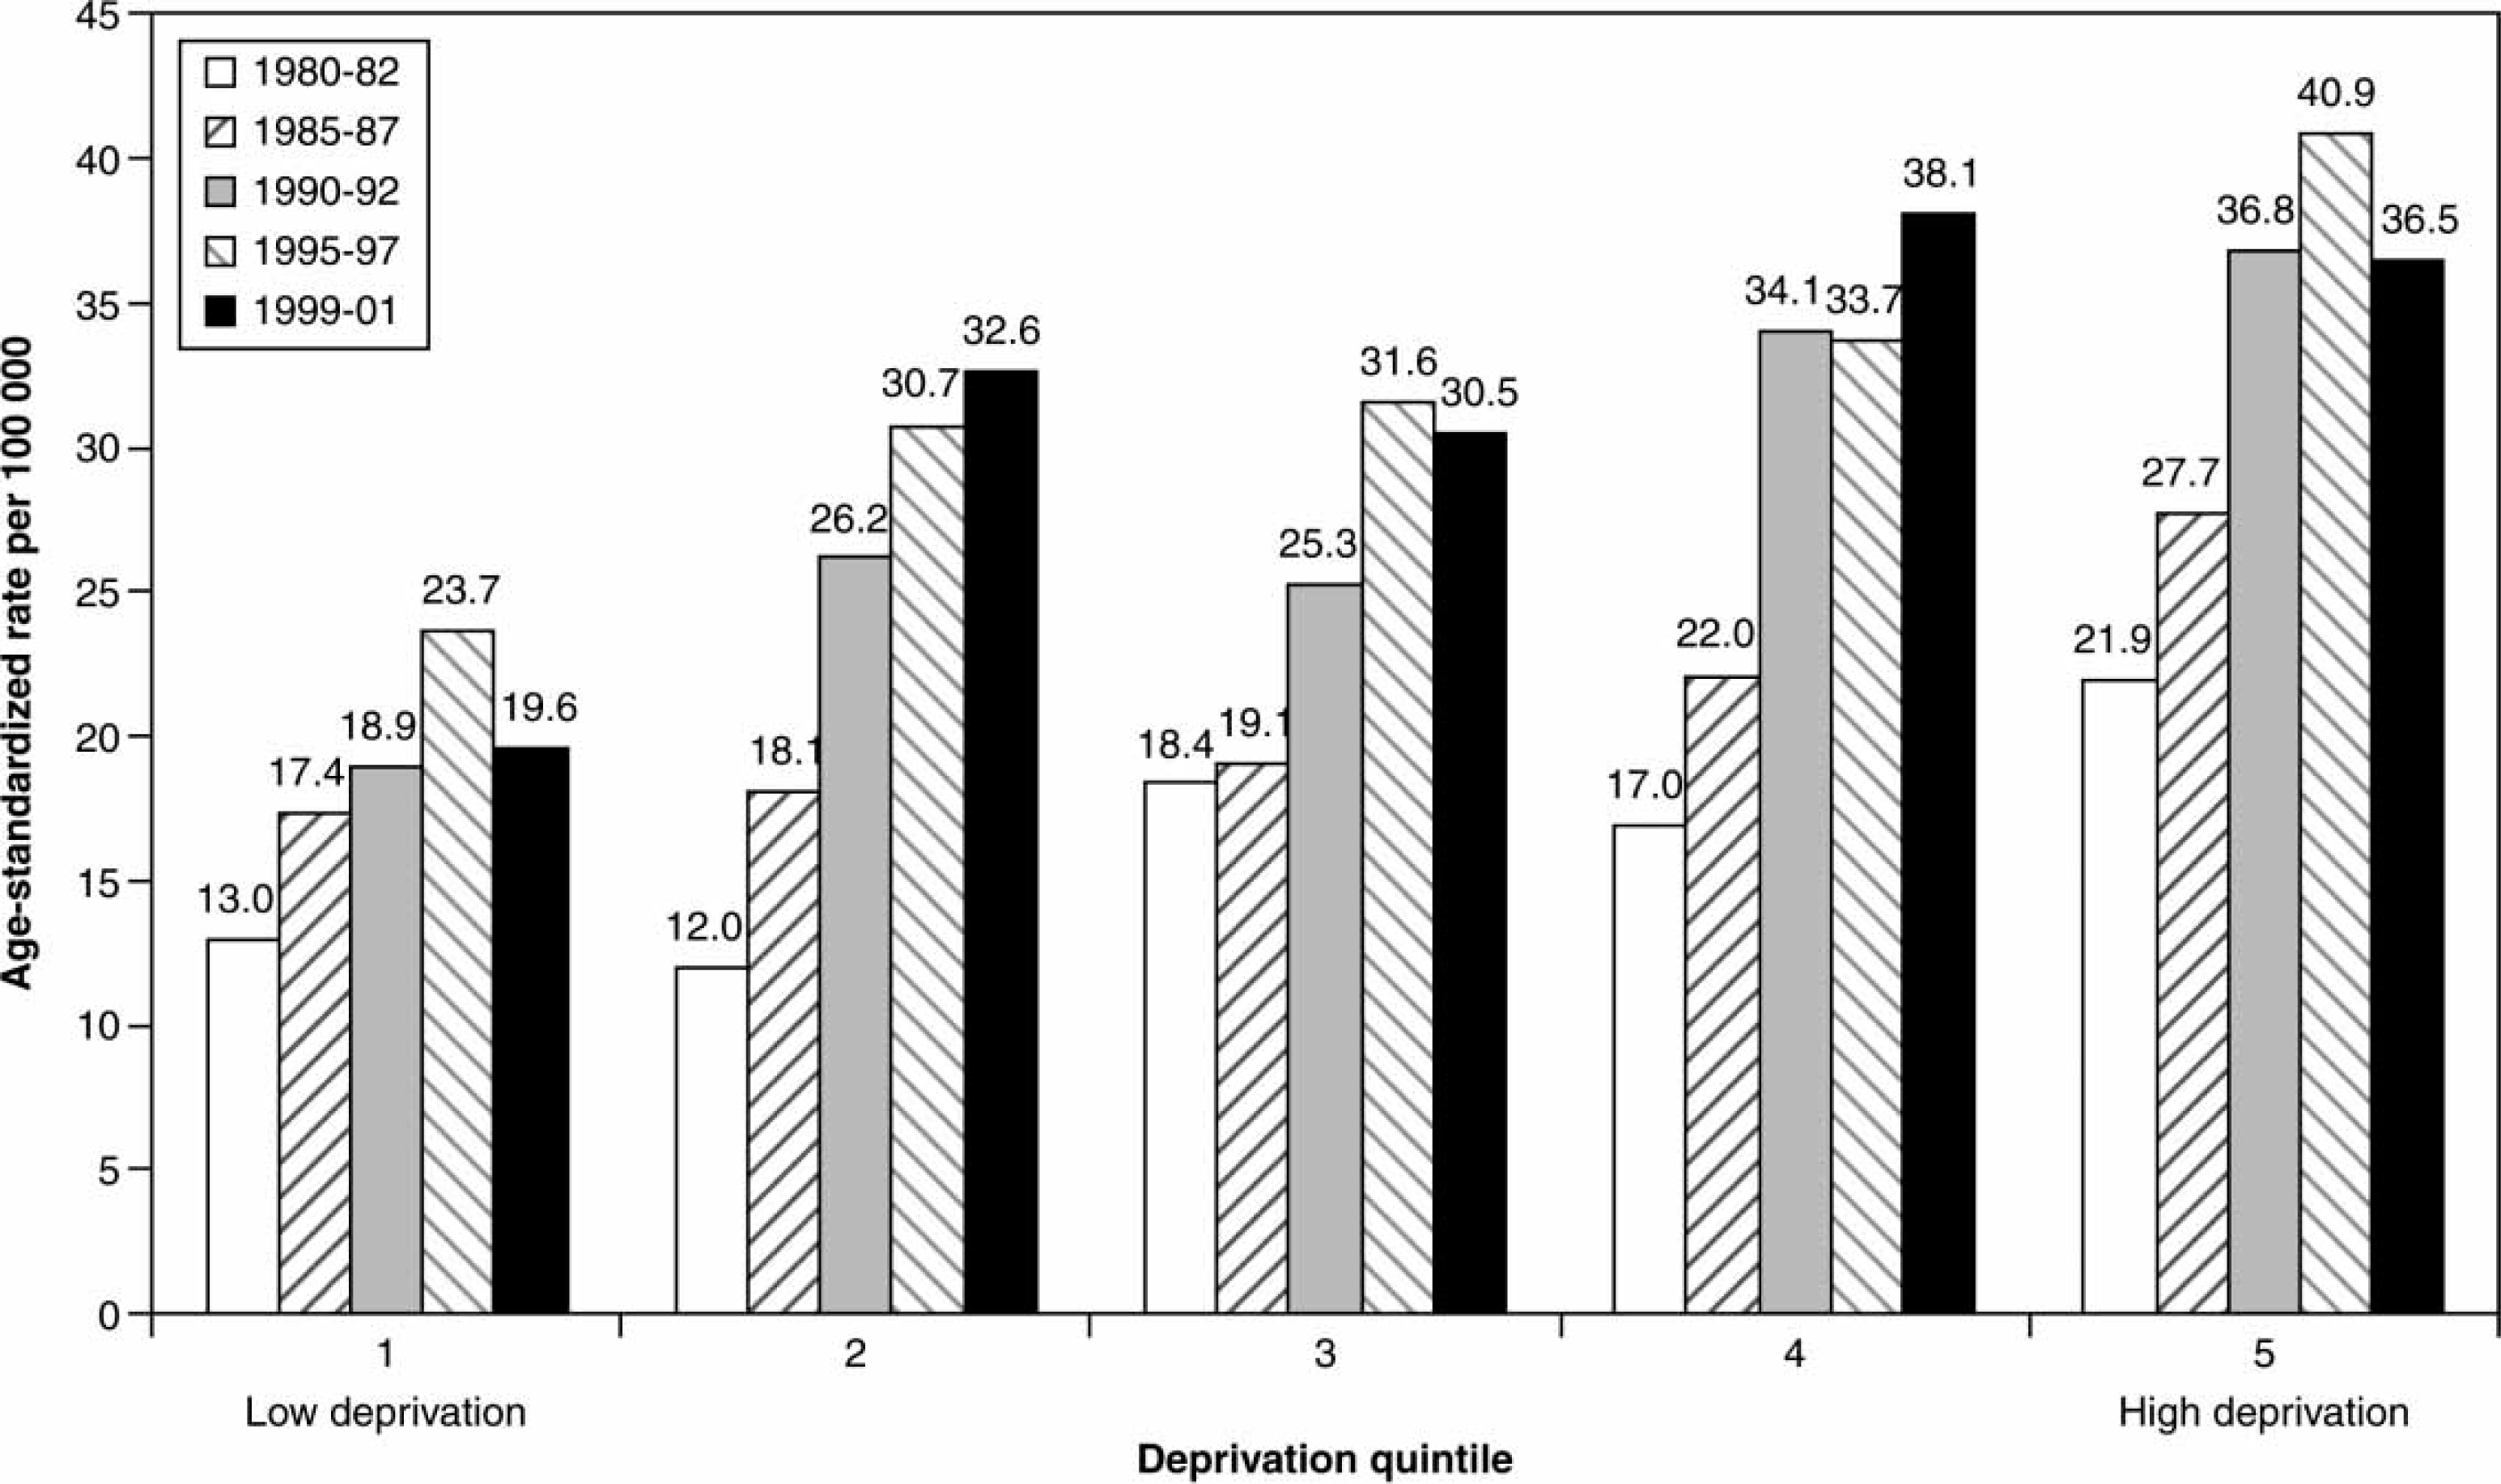
Ratio of male suicide rate in deprivation quintile 5 to deprivation quintile 1
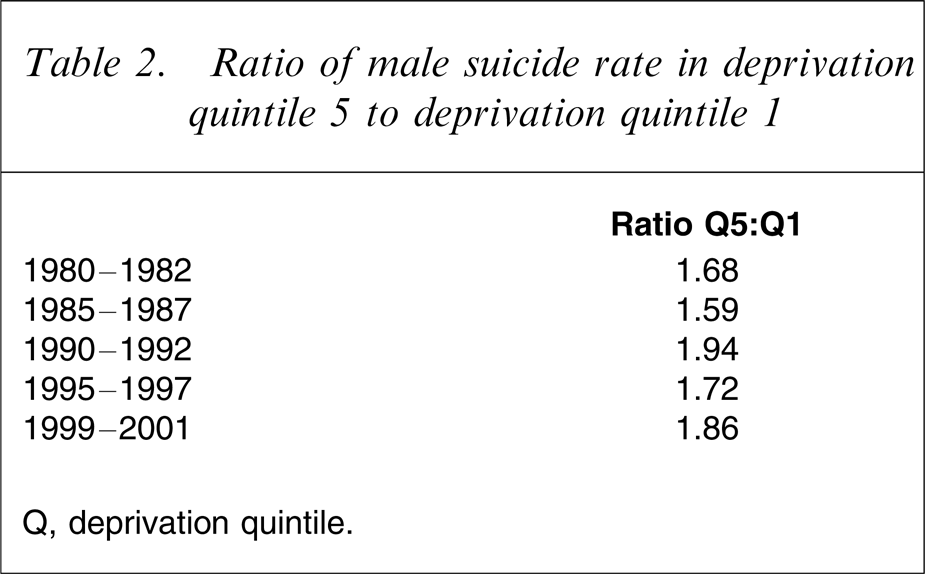
Q, deprivation quintile.
Discussion
Suicide rates among men aged 15–45 years increased in New Zealand during the study period but the rates of increase were not consistent across all regions of the country and in two regions the rates reduced slightly. Simple observations of regional differences are of some interest but it is important not to over-interpret them in the absence of a theoretical framework of enquiry. However, consideration of the regional differences from a social inequalities perspective highlights the fact that inequalities in suicide according to deprivation of area of residence among New Zealand men aged 15–44 rose during the period 1980–2001. The ratio of suicide rates between the most deprived quintile of CAUs and the least deprived quintile increased from 1.68 in 1980–1982 to a high of 1.94 in 1990–1992 and then fell slightly to 1.86 by 2001. This observation is critical to our understanding of regional differences in rates.
These results are consistent with earlier New Zealand work showing that geographical inequality in all-cause mortality grew during the period 1980–2001 but that the most rapid increase was in the late 1980s and early 1990s [17, 18]. Furthermore, our results concur with a New Zealand study of linked census–mortality records that demonstrated increases in both absolute and relative social inequalities in suicide during the 1980s and 1990s [14, 15]. These results in turn are consistent with international findings of a strong and significant ecological relationship between area deprivation and suicide [31, 32]. The results are also consistent with a large body of research that has examined the effects of relative income inequality upon suicide [33–35], especially for male subjects [36]. The fact that levels of inequality increased rapidly in New Zealand over the study period may well have contributed to a rise in mental health problems and suicide rates among more disadvantaged groups, especially those living in areas where social inequalities were greatest. Further analysis of the data using multi-level modelling is necessary to examine the significance of any hypothesized contextual effects.
It should be noted that this study used ecological data and hence we cannot ascertain that it is the most socioeconomically deprived individuals who are dying by suicide. Individuals within areas are not homogenous with respect to socioeconomic status and it cannot be assumed that what is identified at the area level is a reflection of what is occurring at the individual level (the ecological fallacy) [37]. Similarly, the use of an area-based deprivation measure for relatively large population areas is likely to understate the inequalities that exist at an individual level [38]. The loss of 9.5% of suicide cases due to lack of domicile codes is unlikely to have influenced the overall trends reported here because the degree of association between lack of sufficient information about address and suicide is unlikely to have changed over the time period being investigated [14]. Change in the association of the ascertainment of death by suicide and small area deprivation is also likely to be minimal over the study period.
The increase in inequality in New Zealand suicide during the 1980s and 1990s coincided with a period of rapid change in New Zealand social and economic policy. The structural changes witnessed in New Zealand led to a rise in economic and social inequality in the late 1980s and early 1990s. The rising levels of income inequality and social inequality observed during this period were closely mirrored by growing inequalities in health [17] and health-related behaviours [39]. The largest increase in suicide inequality among men aged 15–44 was noted between the periods 1985–1987 and 1990–1992, a key point in New Zealand's economic history. During this period there was a sudden and rapid deregulation of the economy [40, 41], which in turn led to increases in social and economic inequality that were high by international standards [42]. These structural changes were accompanied by a rapid increase in unemployment, which disproportionately affected younger men. An association between unemployment and male suicide has been shown in the New Zealand context [26, 43]. The present result may add to our understanding of this relationship by suggesting that the socioeconomic changes to the labour market may have disproportionately affected the suicide risk of those living in disadvantaged areas of the country. This interpretation would be consistent with previous work that has noted an apparent link between the socio-political climate and suicide rates [44].
Similar to research elsewhere [45], these results demonstrate the importance of the social and physical context in explaining geographical variations and trends in suicide. As Judd et al. argue, an understanding of the compositional, contextual and collective explanations for geographical variations in suicide is important [23]. It is crucial that strategies adopted in New Zealand to reduce suicide rates focus upon factors that are known to have strong independent effects on individual risk, with appropriate targeting of particular high-risk groups [4]. These factors include common mental disorders such as depression and alcohol and substance use, which are known to have high prevalences [46]. However, the present results add to the evidence that consideration of the contextual determinants of risk [11], including macro-level policies aimed at reducing socioeconomic deprivation, is also important. Population-based strategies that reduce social inequality may provide a context within which targeted approaches may have more likelihood of success [4]. Further, the disparity in suicide rates between areas of differing socioeconomic deprivation suggests that policies to reduce suicide rates and reduce inequality may best be targeted at the most deprived areas of the country, but bearing in mind that the effects of deprivation as a contextual factor affecting suicide may vary in importance between different DHBs.
It is incumbent on policy makers across government to consider the downstream effects of policy across a range of domains, including physical and mental health [47, 48]. Suicide prevention is an imperfect science. If there is an opportunity to contribute to reductions in suicide rates by means that accrue other health benefits, and reduction in socioeconomic inequalities is an example [49], we should take them [50]. Finally, it is important that future research monitors the inequalities between key at-risk groups and evaluates the government's strategies to reduce these inequalities.
Footnotes
Acknowledgements
We thank Craig Wright from Public Health Intelligence group for providing the suicide data. Thanks also to June Atkinson for advice on data standardization. The comments of two anonymous referees were most useful in assisting us in developing our manuscript.