
Abstract
The General Health Questionnaire (GHQ) was developed to detect minor psychiatric illness in the community; it is designed to ‘differentiate psychiatric patients as a class from non-cases as a class’ [1], p.5]. Since its introduction in the 1970s, the GHQ has become one of the principle self-report questionnaires used to measure non-psychotic mental illness in the community and in general practice.
Originally a 60-item questionnaire, there are now 30-, 28-, 20- and 12-item versions [1]. The shorter versions are often preferred as they are quicker to administer. Respondents to the GHQ rate themselves according to the degree to which they have experienced each symptom over the past few weeks. Each item has four response categories. The standard method of scoring the GHQ is a binary method; symptomatic responses to each item are scored ‘1’ and summed over the items [1]. This can be characterized as the (0-0-1-1) method, as adjacent response categories are collapsed. For the GHQ-12, this method results in a score ranging from 0 to 12.
In addition to the standard scoring method, the GHQ can also be scored using a four-point Likert scoring method where scores of 0–3 are assigned to each item response and then summed across items, giving a score ranging from 0 to 36 for the GHQ-12 (0-1-2-3 method) [1]. Another scoring method, devised by Goodchild and Duncan-Jones [2], attempts to overcome the assumed low sensitivity to chronic disorders of the standard scoring method. The positive items are scored in the conventional binary method, but the negative items are scored 0-1-1-1, thus assuming that the ‘no more than usual’ answer to negative questions indicates the presence of a chronic problem rather than good health. This is generally referred to as the C-GHQ scoring method. In all three scoring methods, higher scores indicate an increased likelihood of psychological distress.
For each version of the GHQ, an empirically determined threshold score indicates the likelihood of psychiatric illness. There is a trade-off between sensitivity and specificity, with higher thresholds giving higher specificity, but lower sensitivity. The optimal threshold is that which gives the best combination of sensitivity and specificity.
Goldberg et al.'s study of the GHQ-12 in 15 cities around the world found that, for a given threshold value, there were considerable variations in sensitivity and specificity. In some cities, the best GHQ-12 threshold was 1/2, in others it was 2/3, in still others, 3/4, and, in one centre, 6/7 [3]. Previous studies have found similar variation [3]. The reasons for these differences are not clear.
As there is such variation in the optimal threshold, it is important to determine the most appropriate threshold for use in Australia. An Index Medicus/Medline and PsycLIT search revealed only one Australian study which has investigated the threshold value of the GHQ-12 [4]. This was a small study (n = 120) conducted in two general practices in Sydney. There is evidence that the sensitivity (but not the specificity) of the GHQ is on average considerably higher in primary care settings than in community settings [1]. Although several studies have used the GHQ-12 in community settings in Australia [5–11], there appears to be no Australian evidence on the best threshold to use in this situation.
This study uses unpublished confidentialized unit record file (CURF) data from the Australian Bureau of Statistics (ABS) 1997 National Mental Health Survey [12, 13] to investigate the sensitivity and specificity, and hence the optimal threshold values, of the GHQ-12 for the three different scoring methods.
Method
Data source
The 1997 National Mental Health Survey was conducted on a representative sample of residents of private dwellings in all States and Territories. The relevant ABS publications provide a detailed description of the sampling method [12, 13]. The sample excluded special dwellings such as hospitals, institutions, nursing homes and hostels, and dwellings in remote and sparsely settled parts of Australia. The response rate was 78%, yielding a sample size of 10 641 persons (4705 men, 5936 women) aged 18 and over [14]. The survey was conducted using face-to-face interviews.
Instruments
The survey included the GHQ-12 as a standalone questionnaire, and the Composite International Diagnostic Interview (CIDI), a comprehensive interview which can be used to assess current and lifetime prevalence of mental disorders in adults [13]. The CIDI enables the diagnosis of mental disorders based on either the International Classification of Diseases, 10th revision (ICD-10) [15], or the Diagnostic and Statistical Manual of Mental Disorders, 4th revision (DSM-IV) [16]. To facilitate comparison with Goldberg et al. [3], this study presents results using the diagnoses according to ICD-10. The conditions included were affective disorders (mania; hypomania; mild, moderate and severe depression; bipolar affective disorder; dysthymia), anxiety disorders (panic disorder, agoraphobia, social phobia, generalized anxiety disorder, obsessive–compulsive disorders, posttraumatic stress disorder) and neurasthenia, but not alcohol/drug dependence or harmful use. Respondents were classified as having a mental disorder if they were diagnosed as having one or more conditions during the previous 4 weeks.
Analysis
Data were analysed using SPSS (SPSS, Chicago, IL, USA) and Microsoft Excel.
Using the diagnosis from the CIDI as a gold standard, the sensitivity and specificity of a range of thresholds for each of the scoring methods were calculated. Receiver operating characteristic (ROC) curves were derived for each scoring method. Receiver operating characteristic analysis is a technique which enables comparison of the performance of two or more screening tests or scoring methods. A ROC curve is obtained by plotting sensitivity against the false positive rate for all possible cut-off points of the screening instrument. The area under the curve provides a summary measure of the ability of the instrument or scoring method to discriminate between cases and noncases. A ROC area equal to 0.5 is obtained when the discriminatory ability of the screening instrument is no better than chance; a value of 1.0 stands for perfect discriminatory ability [1].
Results were obtained both for the entire sample, and also for a ‘clinical’ subsample consisting of persons who had consulted a doctor or other health practitioner for any reason in the previous 4 weeks.
Using the weighting factors and method described by the ABS [13], results were adjusted to ensure that they represented as far as possible the adult Australian population. Confidence intervals for proportions and percentages were estimated using the relative standard errors provided by ABS [13] pp. 74–77]. Since the ABS does not provide estimates of standard errors for means, confidence intervals for means were estimated using standard formulae [17] with the weighting factors scaled so that they summed to the sample size.
Results
Based on the CIDI, 7.3% (95% CI = 6.9–7.6%) of the population were diagnosed with a mental illness; 8.9% (95% CI = 8.2–9.5%) of women were diagnosed with a mental illness compared with 7.3% (95% CI = 6.9–7.6%) of men. Of those people who had consulted a health practitioner in the previous 4 weeks, 11.0% (95% CI = 10.3–11.7%) were diagnosed with a mental illness. In this ‘clinical’ population, 12.5% (95% CI = 11.4–13.5%) of women and 9.2% (95% CI = 8.1–10.3%) of men were diagnosed with a mental illness.
On average, women had higher GHQ-12 scores than men, and the average scores of those in the ‘clinical’ subsample were higher than the average scores for the total sample (Table 1). Using the standard scoring method, 66.6% of the total population (69.2% of men, 64.0% of women) and 58.7% of the ‘clinical’ population (61.7% of men, 56.3% of women) scored zero.
Mean scores for standard, Likert and C-GHQ methods of scoring the GHQ-12, Australia, 1978 and 1997
The results in Table 2 and Fig. 1 indicate the trade-off between sensitivity and specificity using different threshold values of the GHQ-12. For a given specificity, the C-GHQ scoring method generally produces the highest sensitivity, followed by the Likert and then the standard scoring method.
Receiver operating characteristic (ROC) curves for the three GHQ-12 scoring methods. □, standard GHQ scoring; ▴, Likert GHQ scoring; ○, C-GHQ scoring.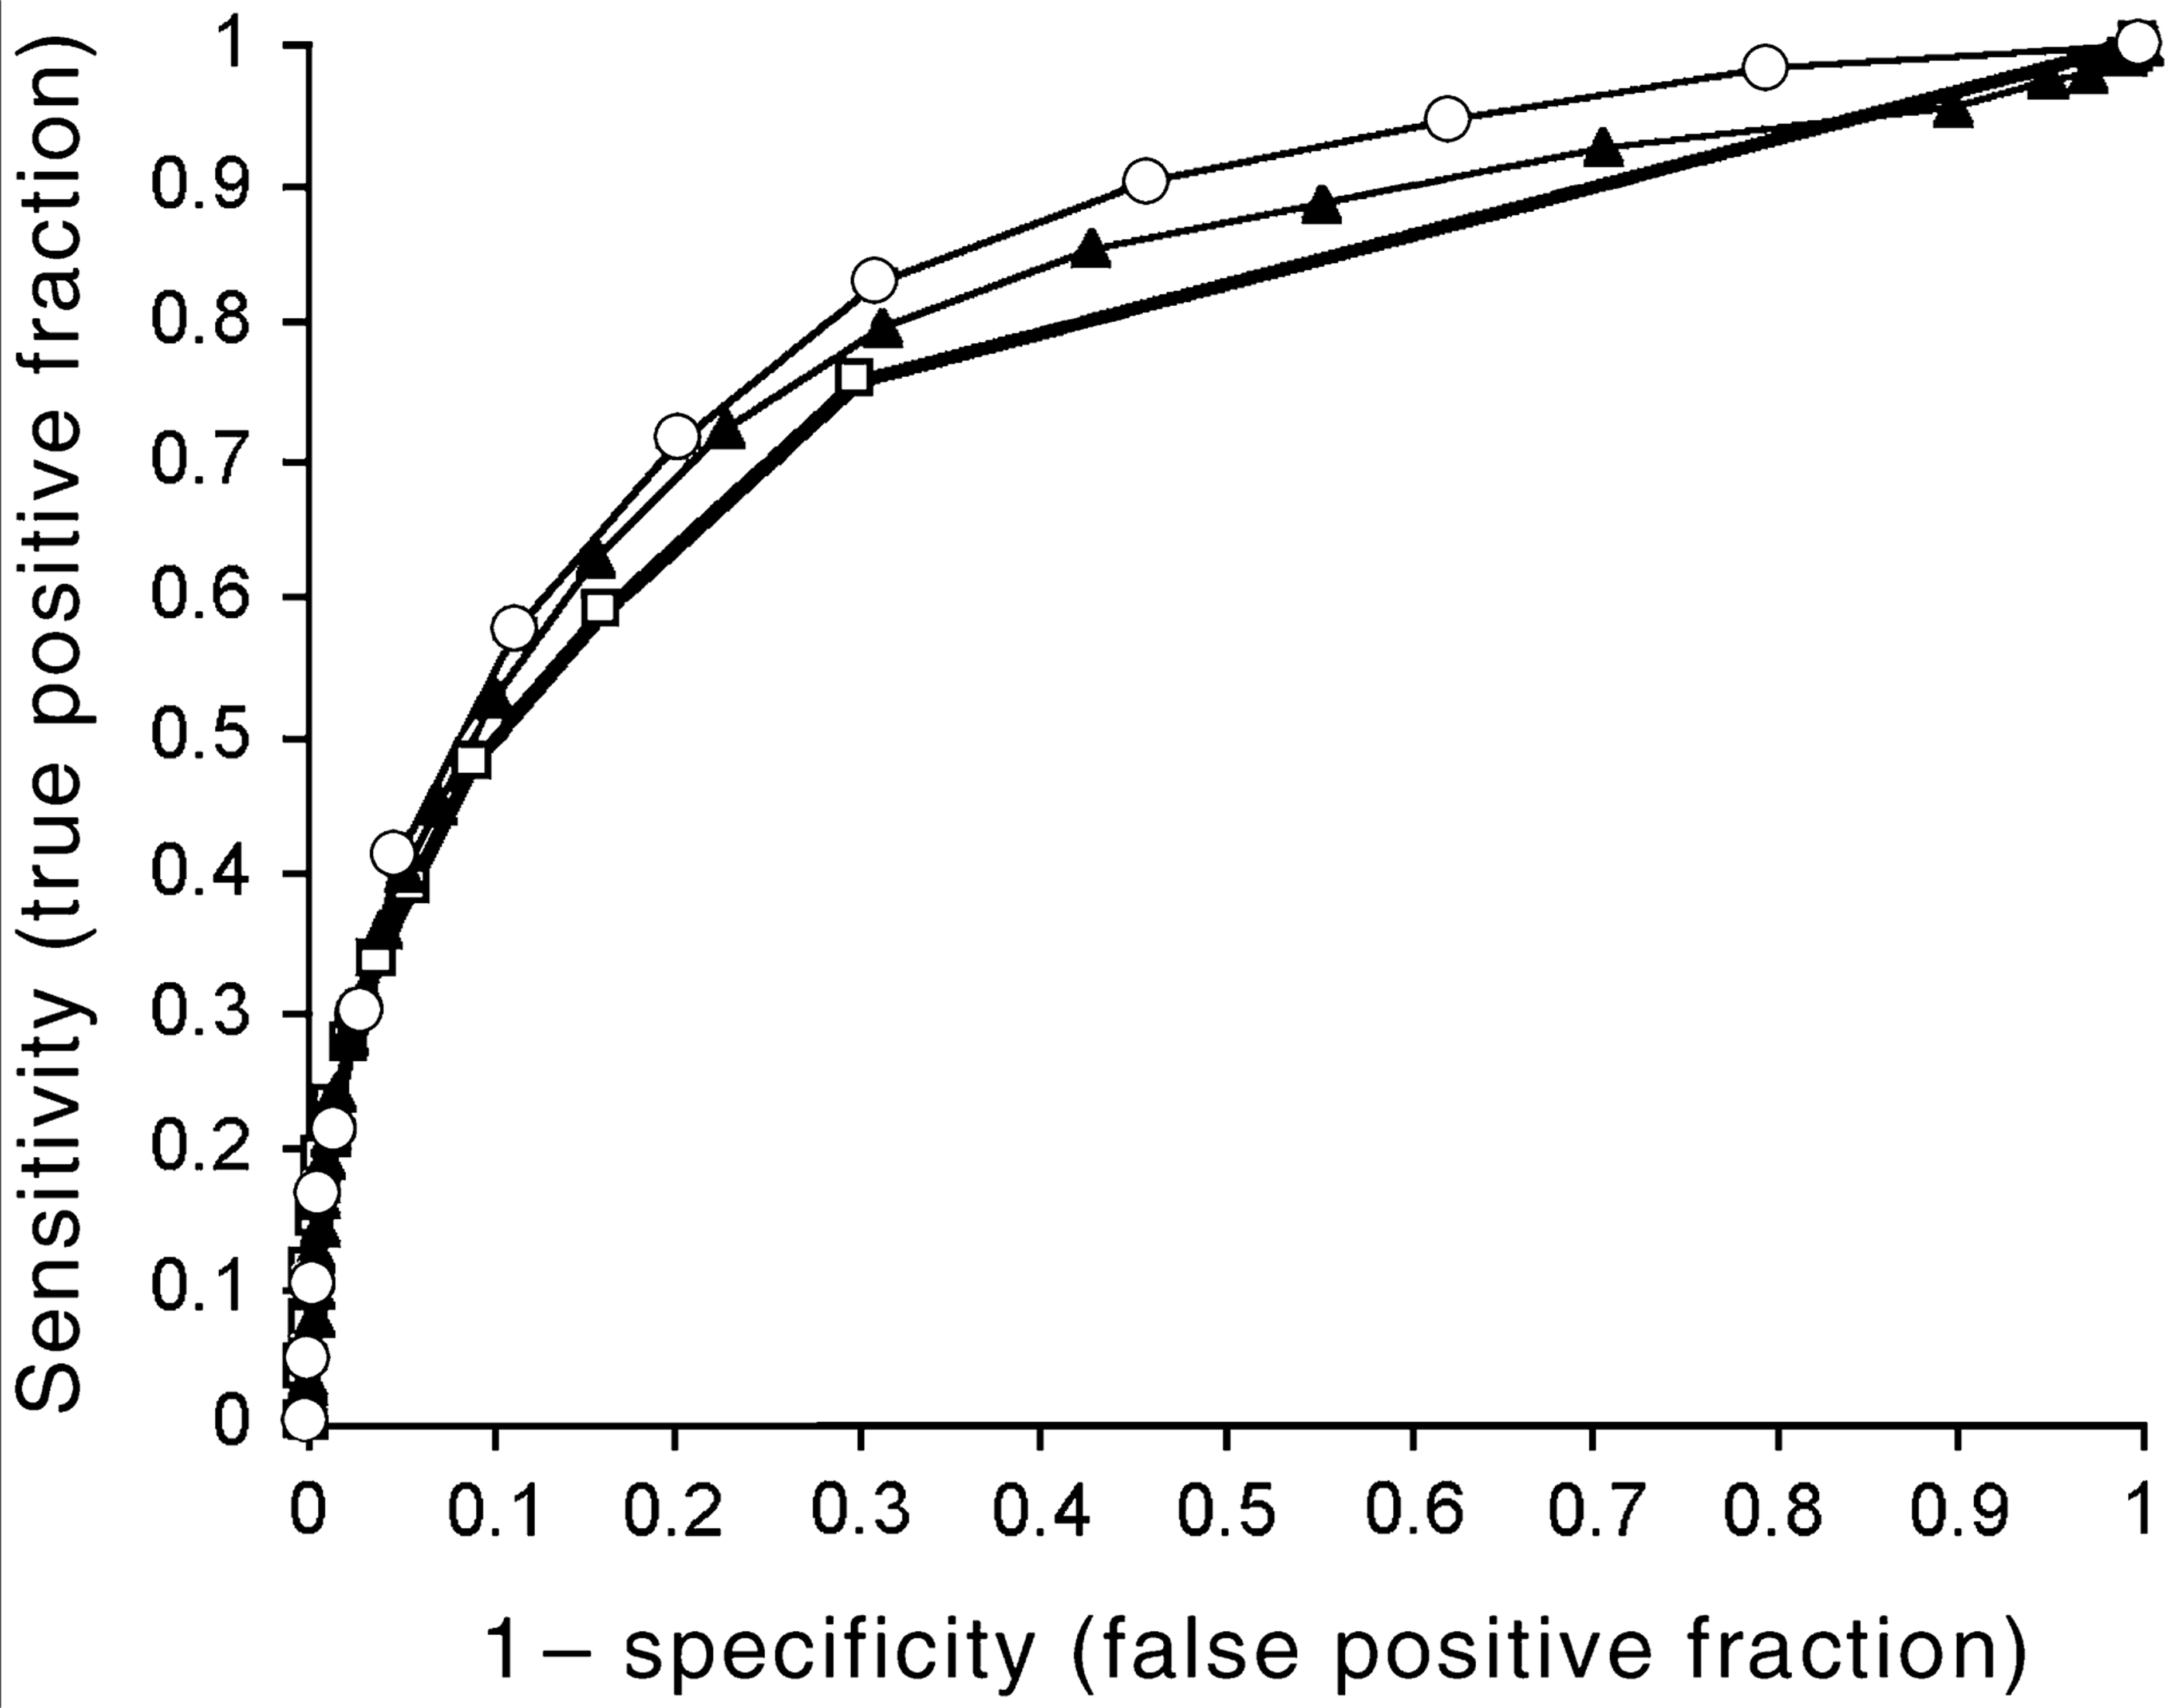
Sensitivity and specificity for selected threshold scores for standard, Likert and C-GHQ scoring methods, Australia, 1997
The analyses were repeated for males and females separately and for the ‘clinical’ subsample. For a given threshold score, sensitivity and specificity were higher for males than for females with all scoring methods, the differences averaging around 4%. In the ‘clinical’ subsample, for a given threshold score, sensitivity was higher and specificity was lower than in the total sample by 3–4%, for all scoring methods. (Details of sensitivity and specificity for selected threshold scores, standard, Likert and C-GHQ scoring methods, Australia 1997, for all populations are available from the corresponding author on request.)
As indicated in Table 3, for both the total sample and the ‘clinical’ subsample, the areas under the ROC curves were slightly higher for males than for females, but the differences were generally not statistically significant. Comparing the total sample and the ‘clinical’ subsample, there was no difference in the areas under the ROC curves. In all groups, the area under the ROC curve was greater for the C-GHQ scoring method than for the standard scoring method.
Areas under ROC curve for different scoring methods
Discussion
Based on the ROC analysis, the C-GHQ scoring method provides better discrimination between those with and without a mental illness than either the Likert or the standard scoring methods. This is in contrast to other studies which have found little or no difference between scoring methods [3, 18]. With this scoring method, the best trade-off between specificity and sensitivity is given by a threshold of 3/4, both in the total sample and in the ‘clinical’ subsample.
Tennant's validity study of the GHQ [4] used a disembedded version of the GHQ-12 (that is, the GHQ-60 was the actual questionnaire used in the study, and the GHQ-12 questions were extracted from the longer questionnaire). There is evidence that disembedded versions of the GHQ give different optimal thresholds from those obtained using the corresponding standalone version of the GHQ [19]. In general practice patients in Sydney, Tennant found sensitivity of 0.87 and specificity of 0.91 for a threshold of 1/2 using the standard scoring method. Confidence intervals were not reported, but based on other reported information these can be estimated as being between 0.75 and 0.99 for sensitivity and 0.85 and 0.97 for specificity.
In the present study, with the standard scoring method, the best trade-off between sensitivity and specificity is given by a threshold of 0/1. Australian studies have used thresholds of 1/2 [5–9,20], 2/3 [21] or 3/4 [10, 11, 22], but the results from this study suggest that the sensitivity of thresholds higher than 0/1 is unacceptably low. Even in the group with the highest sensitivity for a given threshold score (males in the ‘clinical’ subsample) sensitivity using a threshold 1/2 was only 66.4%.
Using the standard scoring method, most studies have found the optimal threshold to be 1/2 or 2/3 [3, 23], although 0/1 has been found in at least one other study [18]. It has been suggested that the mean GHQ score for the whole population of respondents provides a rough guide to the best threshold, so that populations with low average GHQ scores will generally have lower threshold scores [23].
Goldberg et al. found mean scores ranging from 1.09 to 3.66, with a majority of the 15 centres in the study reporting mean scores above 2 [3]. The Australian mean scores of 0.93 for the total sample and 1.28 in the ‘clinical’ subsample therefore appear to be low compared with mean scores found elsewhere. However, these low scores seem to be characteristic of the Australian population, as the mean GHQ-12 scores in the 1978 National Health Survey were very similar (Table 1).
In general, it appears that the higher the best threshold on the GHQ, the greater the area under the ROC curve, and hence, the greater the discriminatory power of the GHQ [23]. In this study, both the areas under the ROC curves and the sensitivity and specificity of the optimal threshold were lower than in most of the 15 centres studied by Goldberg et al. [3]. Thus, the evidence from this study suggests that in Australia the GHQ-12 is a less useful instrument for detecting mental illness than in many other countries.