
Abstract
Publications elsewhere in this issue of the Journal on the Australian 2007 National Survey of Mental Health and Wellbeing (2007 NSMHWB) provide information on diagnostic prevalence as assessed for the last 12 months on the Composite International Diagnostic Interview version 3.0 [1, 2] (CIDI 3.0), examine patterns of service use, and describe associations between service use and diagnostic findings [3, 4]. This paper takes a complementary but different starting point in that the key integrating concept is that of perceived need for care [5]. Questionnaire assessment of perceived need enables people, whether they had CIDI 12 month diagnoses or not and whether they used services or not, to give their views as to whether then needed a specific type of care and, if they received such care, whether it was sufficient.
The CIDI 3.0 [1, 2] is well established instrument for community surveys such as the 2007 NSMHWB, but in general it is neither a gold standard for ascertainment of psychiatric disorder as judged significant by a clinician assessment [6], nor for needs for care [7]. Instruments that directly assess need commonly require clinical judgement [8, 9], but because the 2007 NSMHWB did not include clinician assessments, this approach was not feasible. A practical alternative to enrich the data on needs for care has been to sample a patient perspective. This is not only justifiable as a convenient alternative to clinician needs assessment; the philosophy of mental health-care delivery in Australia, as elsewhere, has moved progressively towards recognition that the consumer of services has a right to be heard in the assessment and design of those services [10, 11]. Evidence from outcome studies also demonstrates that it important to take into account both the professional and the personal–subjective viewpoints of need when planning and providing mental health care. Self-assessed unmet needs, but not staff-rated unmet needs, have been shown to predict lower levels of subjective quality of life (QoL) and reduction in patients’ self-assessed unmet needs to predict improved subjective QoL over time [12–14]. Interventions targeted towards meeting unmet needs as appraised by patients, as well as symptom alleviation, can bring about beneficial patient outcomes, with positive effects in turn for therapeutic alliance, adherence to treatment, and adequacy of care [12].
Objectives
The aims of this study were to (i) describe overall levels of perceived needs for mental health care; (ii) describe levels of met and unmet need of different kinds; (iii) describe the nature and degree of overlap between the three sets of people having perceived need for mental health care, 12 month service use for a mental health problem, and a 12 month diagnosis as identified by the CIDI 3.0; (iv) describe levels of perceived need within broad diagnostic classes of symptomatic disorder in the last year; and (v) describe perceived needs and the relative meeting of needs within different broad patterns of service use.
Methods
The 2007 NSMHWB was conducted by the Australian Bureau of Statistics (ABS) on a stratified multistage probability sample of the Australian population including participants from all States and Territories. The sample size was 8841 and the response rate was 60%. Details of survey conduct, administration, quality control, issues of response rates and waiting have been described elsewhere [3, 15, 16]. This paper reports initial analyses based on extract tables provided by the ABS.
The Perceived Need for Care Questionnaire (PNCQ) [5, 17] was designed and psychometrically validated for the 1997 NSMHWB [18, 19]. In the Computer-Assisted Personal Interview (CAPI) for the 2007 NSMHWB the PNCQ follows the CIDI and assessment of service use in the last 12 months. PNCQ questions also cover the last 12 months. Figure 1 presents the flow of the instrument in assessing perceived need. The PNCQ examines five types of perceived need (Table 1.).
structure for the Perceived Need for Care Questionnaire (PNCQ). CAPI, Computer-Assisted Personal Interview; CIDI, Composite International Diagnostic Interview; MH, mental health.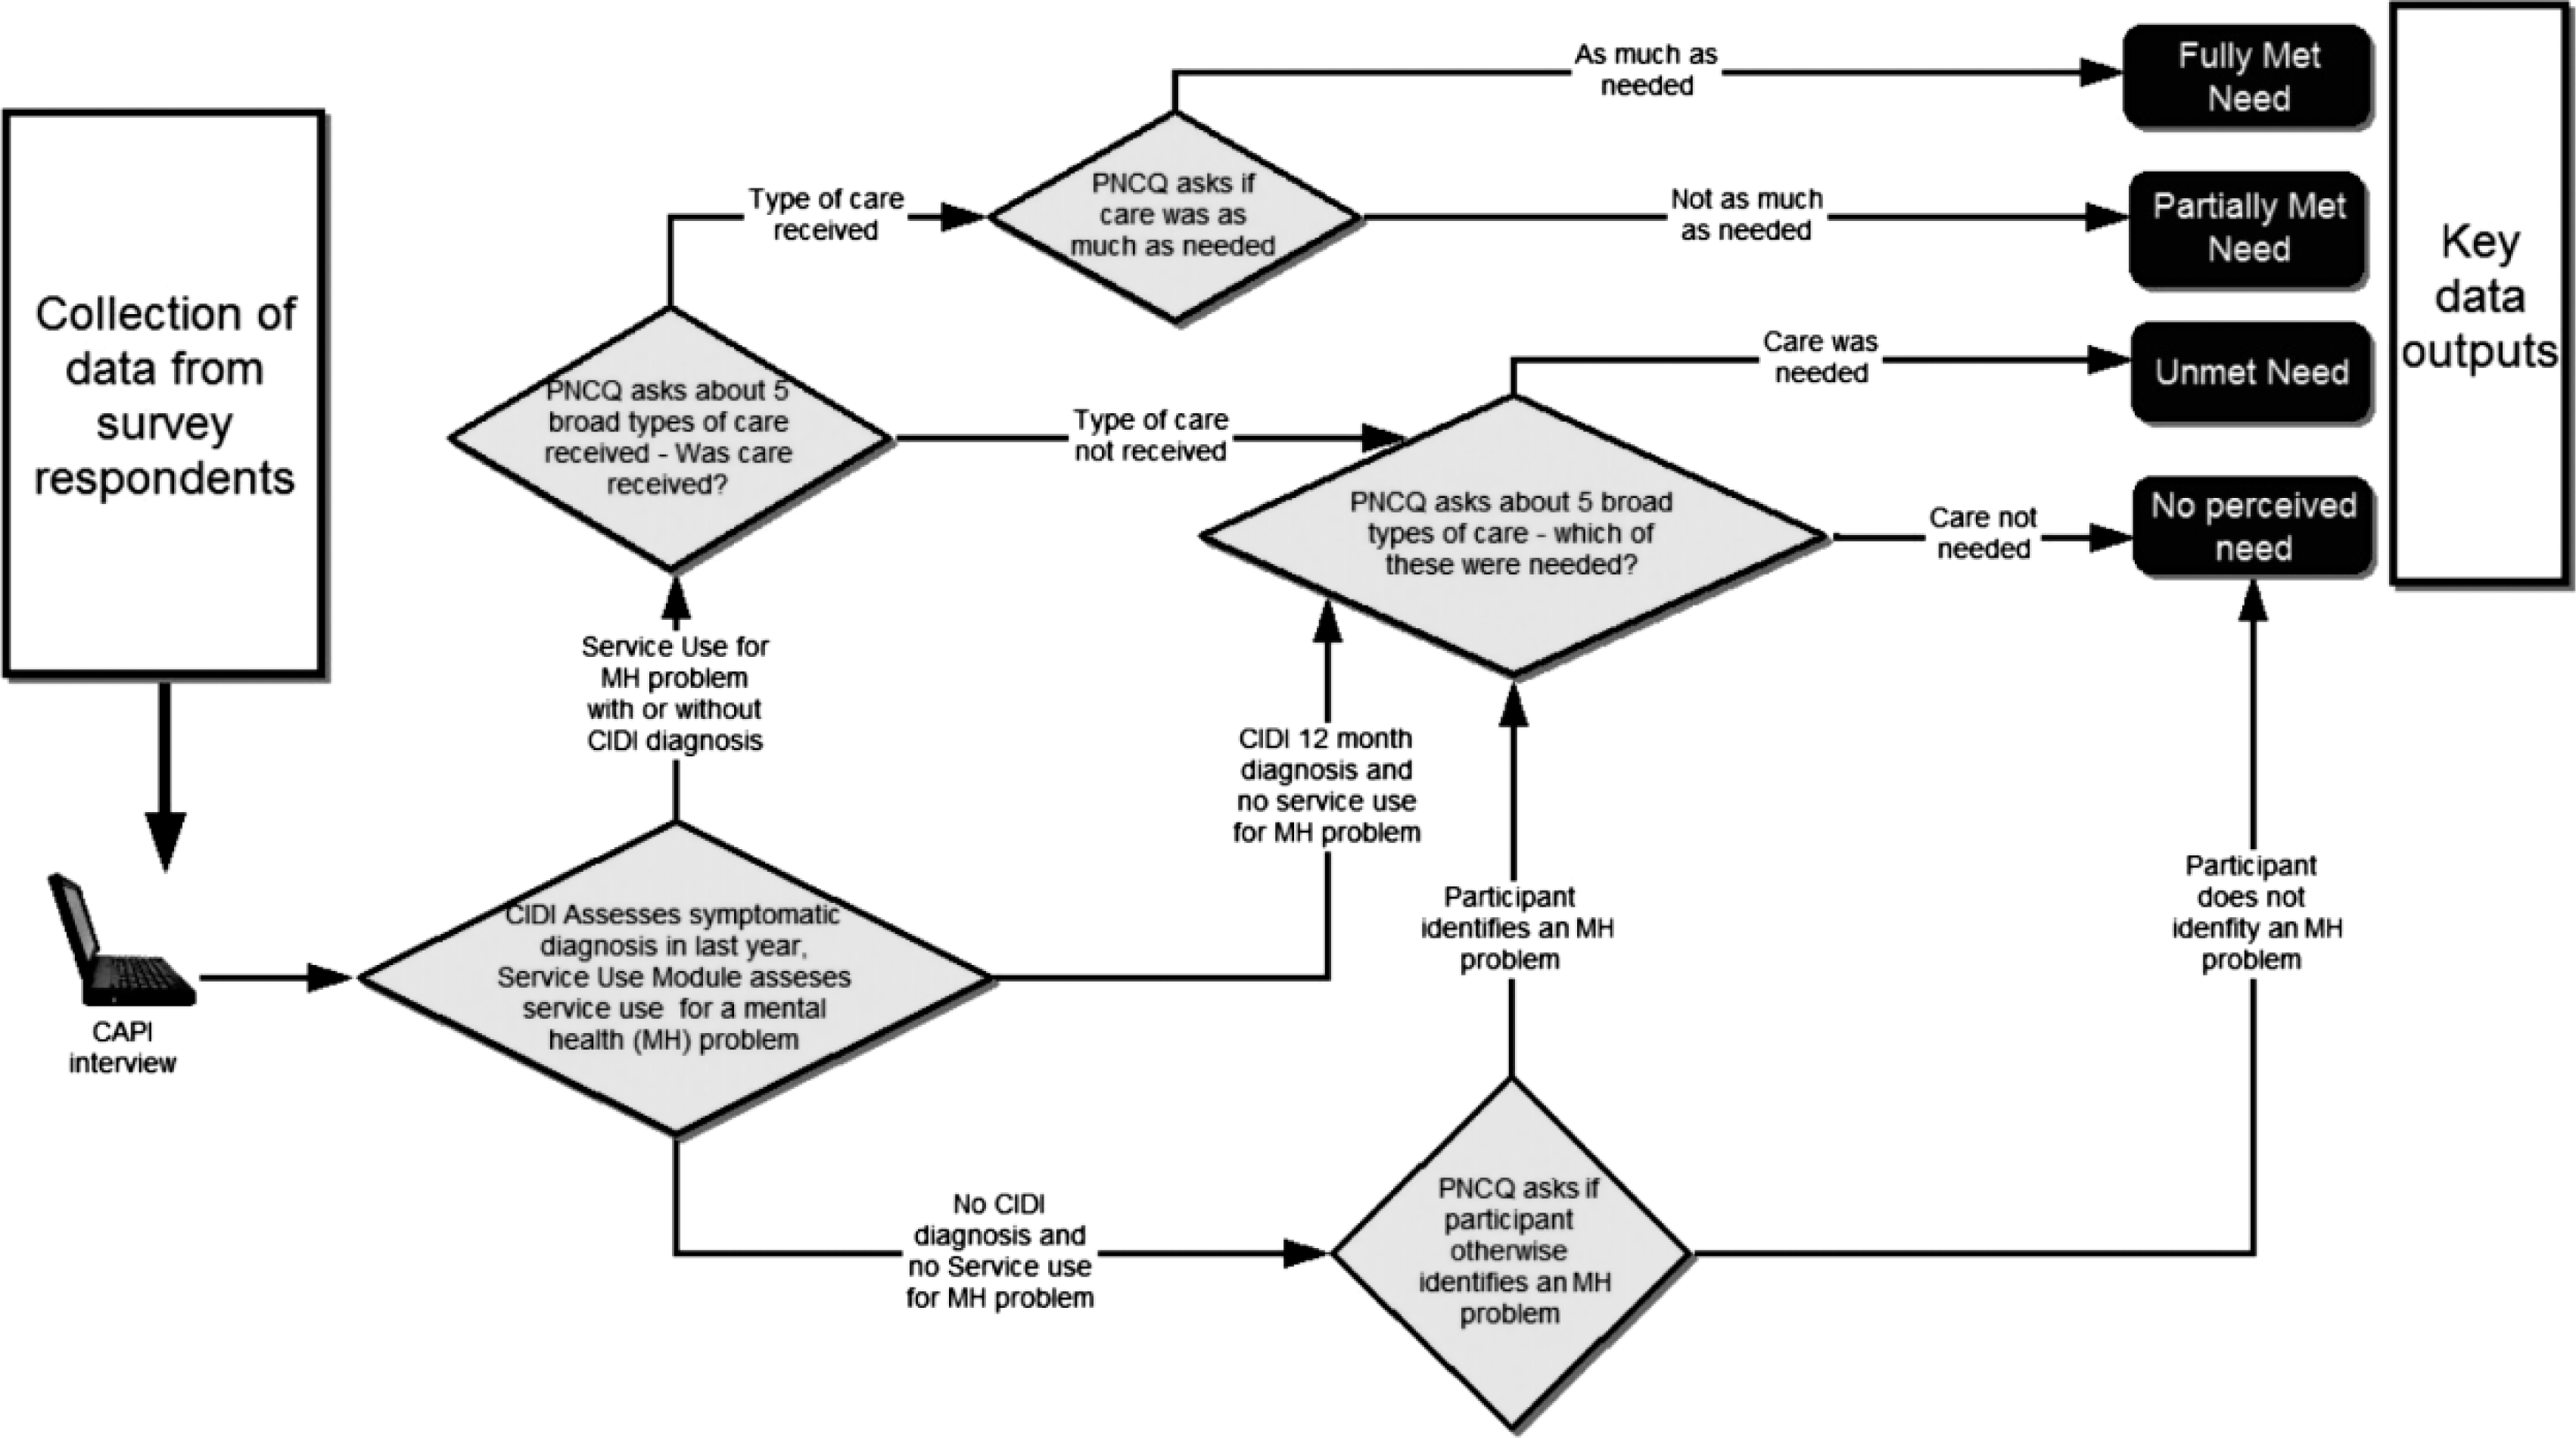
Five types of perceived need examined on the PNCQ
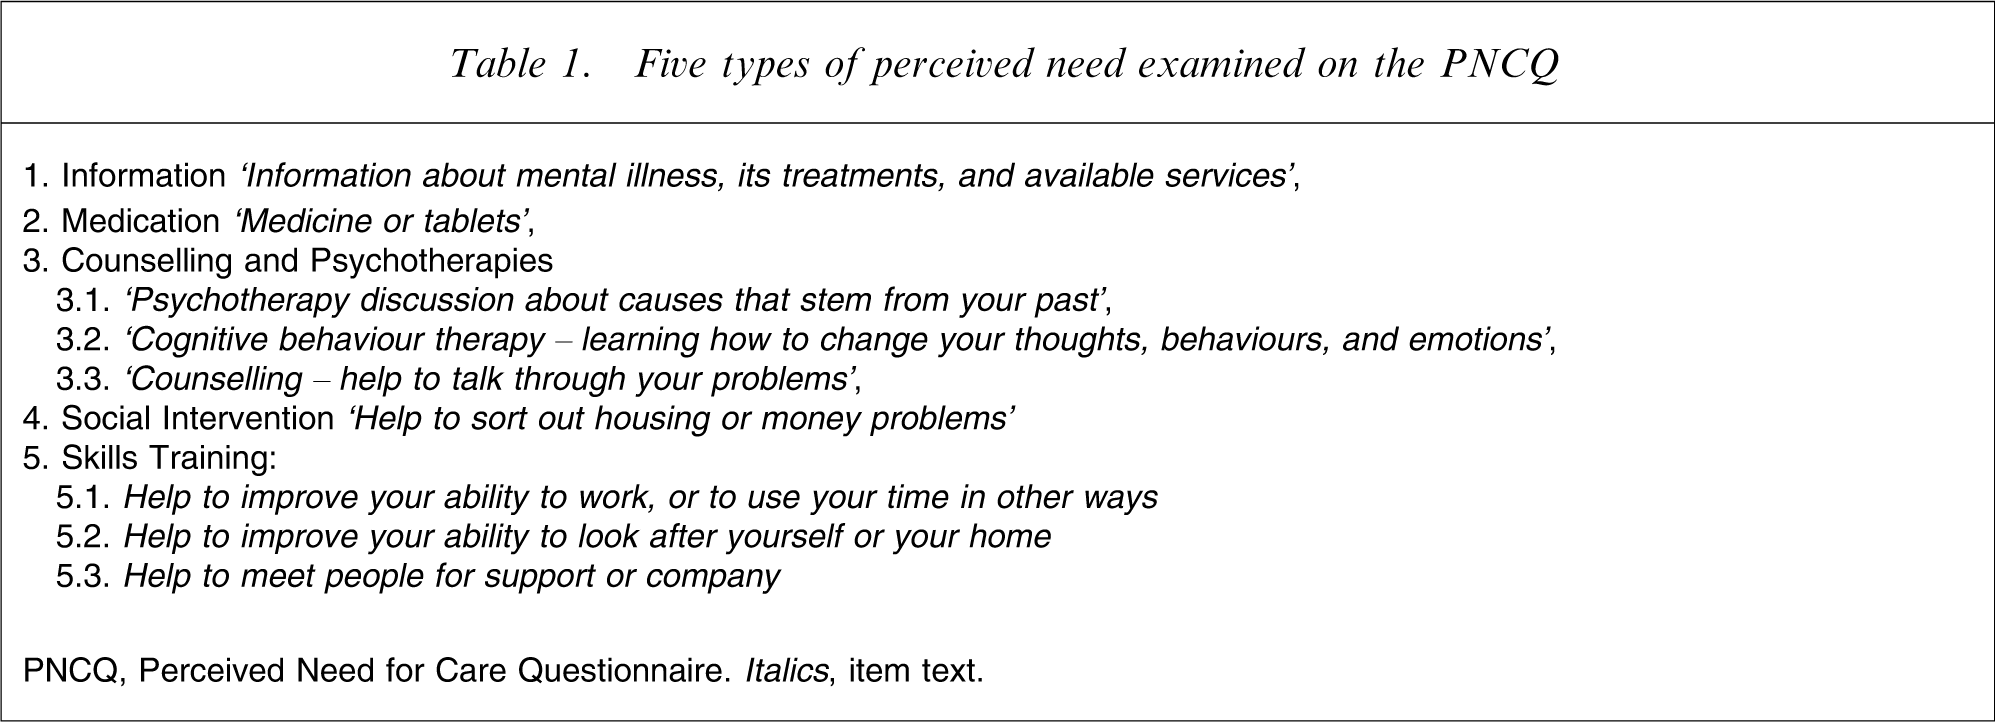
PNCQ, Perceived Need for Care Questionnaire. Italics, item text.
Beyond the 1997 NSMHWB, the PNCQ [5, 17] has been adopted in other major survey programmes internationally [20, 21] with translations into Dutch, French, and Spanish. It has been adapted into a short form for use in primary care [22].
Results
12 month estimates of perceived needs for major categories of mental health care in the Australian adult population
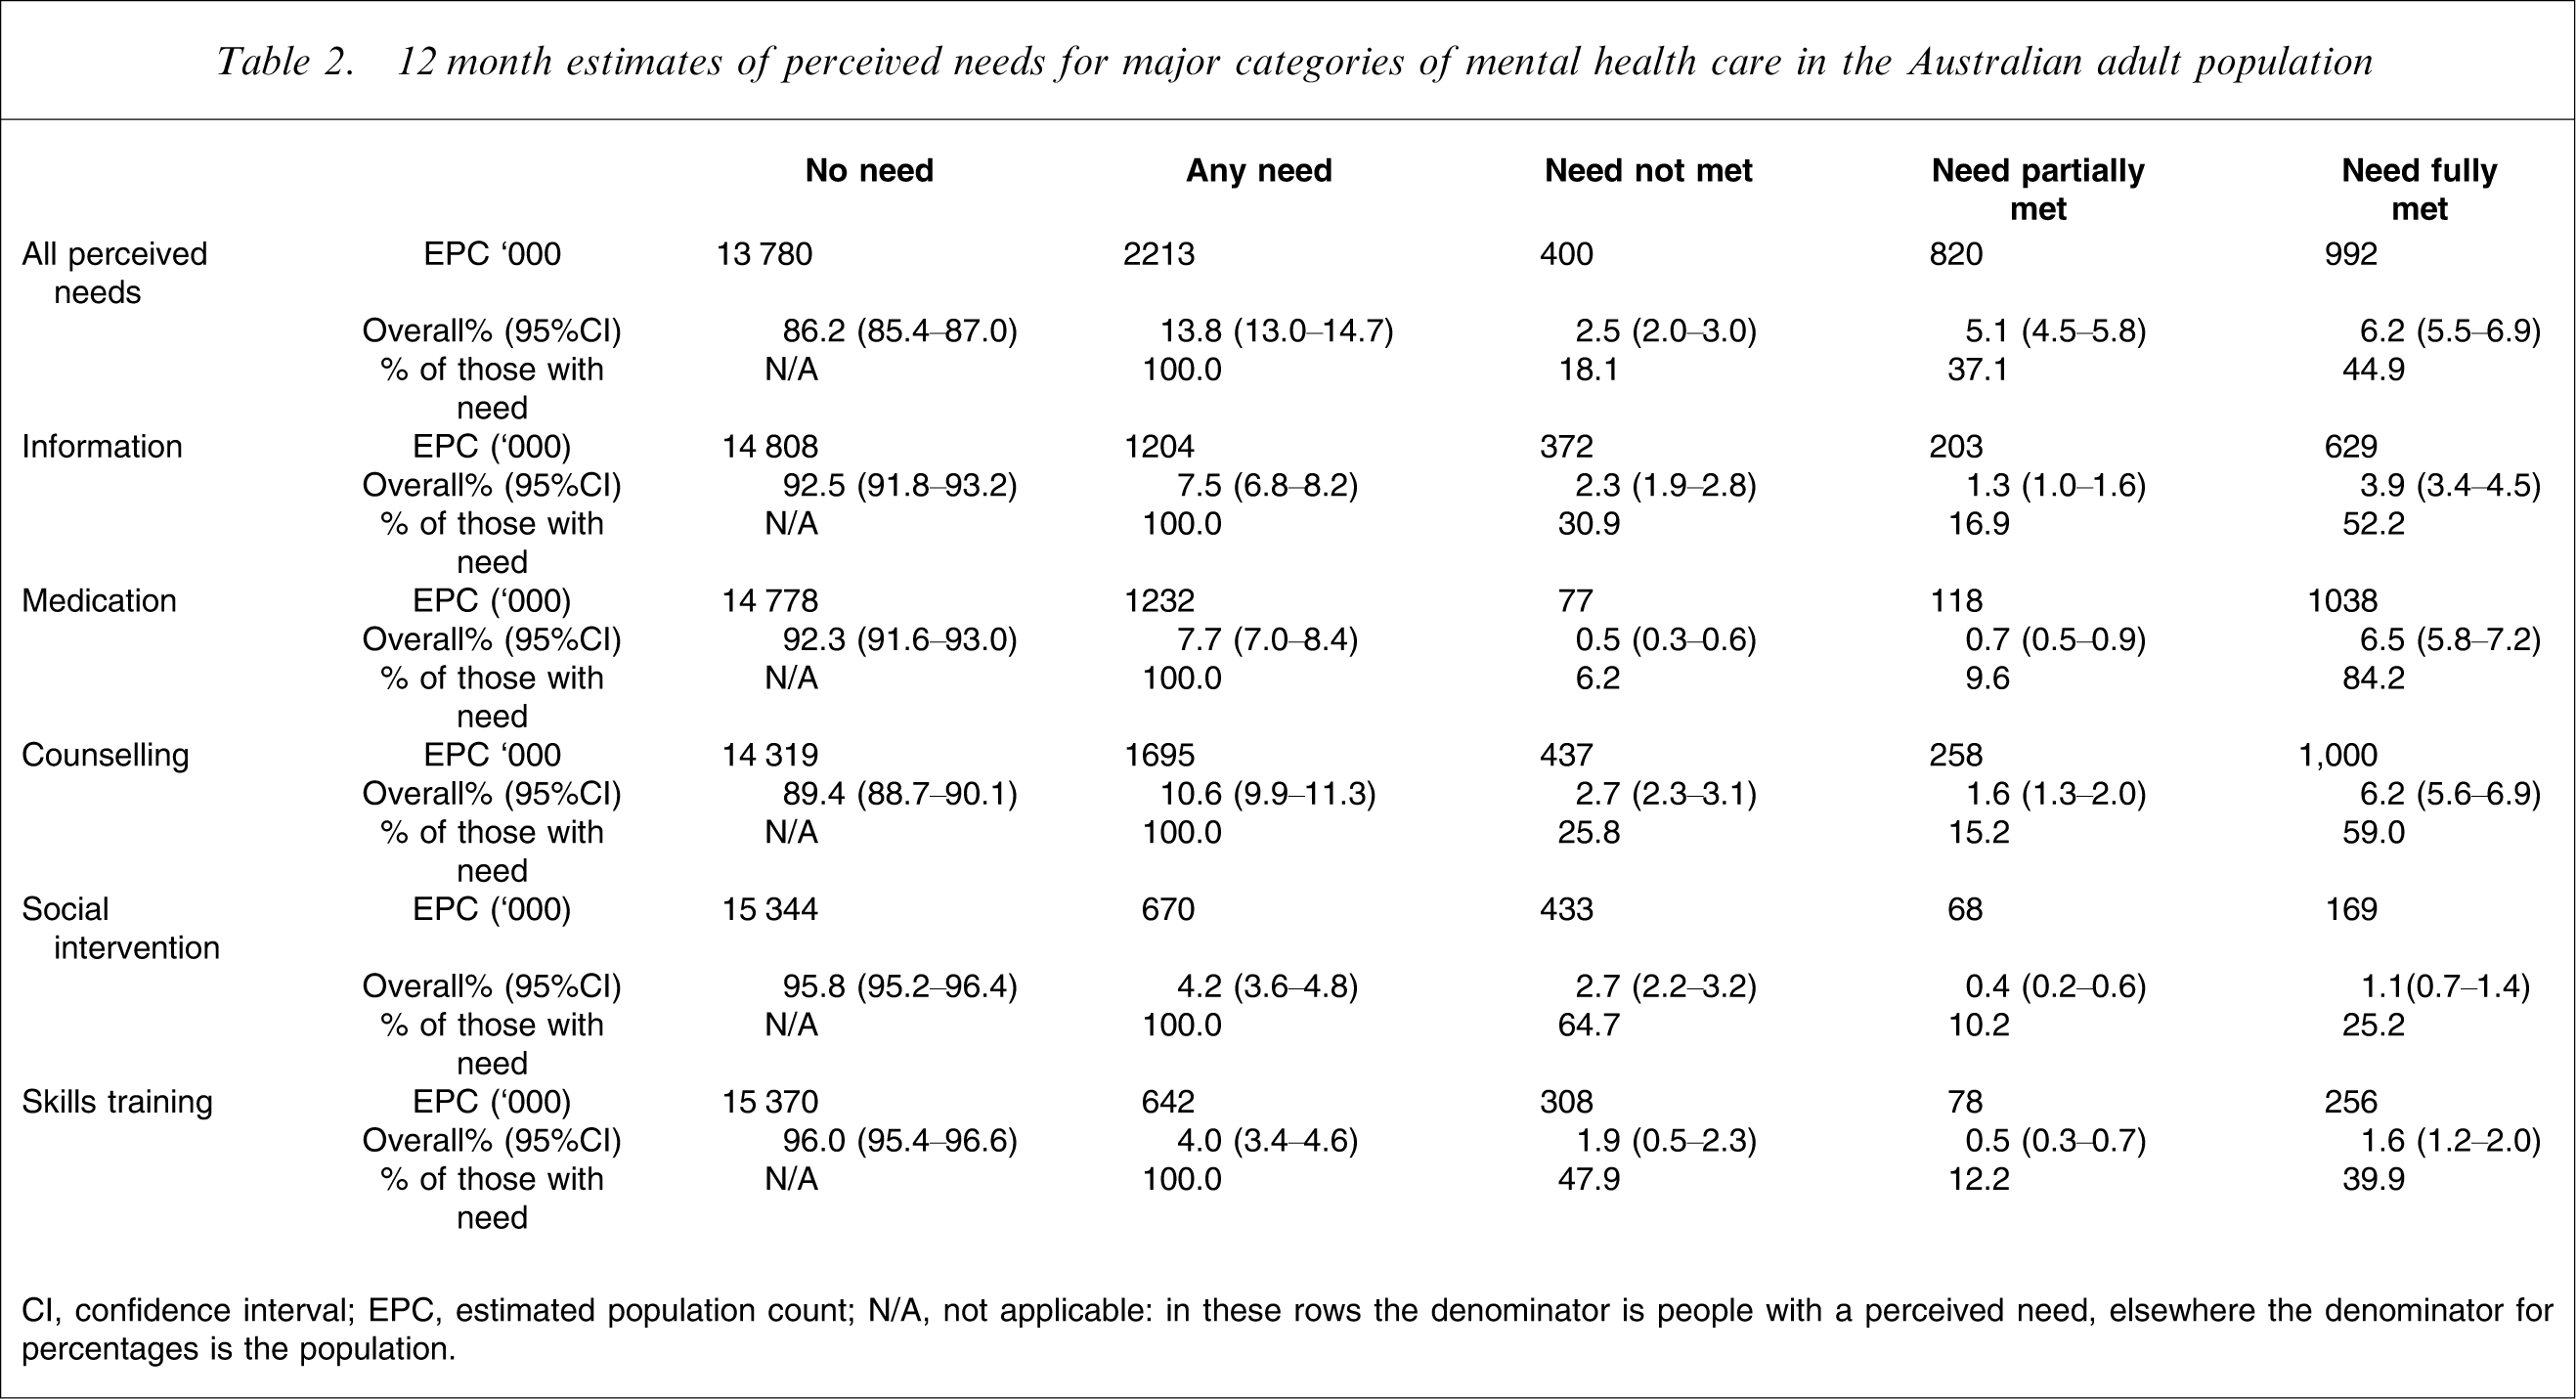
CI, confidence interval; EPC, estimated population count; N/A, not applicable: in these rows the denominator is people with a perceived need, elsewhere the denominator for percentages is the population.
Figure 2 presents a Venn diagram of the three sets comprising: those with any ICD-10 [23] diagnoses (20%); any perceived needs (14%); and any service use for a mental health problem (12%). Within this diagram 7% of the population have a 12 month mental disorder, a perceived need for care and also service use for mental health problems. A further 2% of the population have a 12 month disorder, a perceived need for care but did not use services for mental health problems. A further 11% of the population with a 12 month mental disorder neither used any services for mental health problems nor expressed a perceived need for those services. An appreciable proportion of the population (5%) making use of services, described a perceived need in the last year and had no 12 month mental disorder as assessed on the CIDI 3.0.
prevalence of all disorders, as related to perceived need and service use, also related to12 months.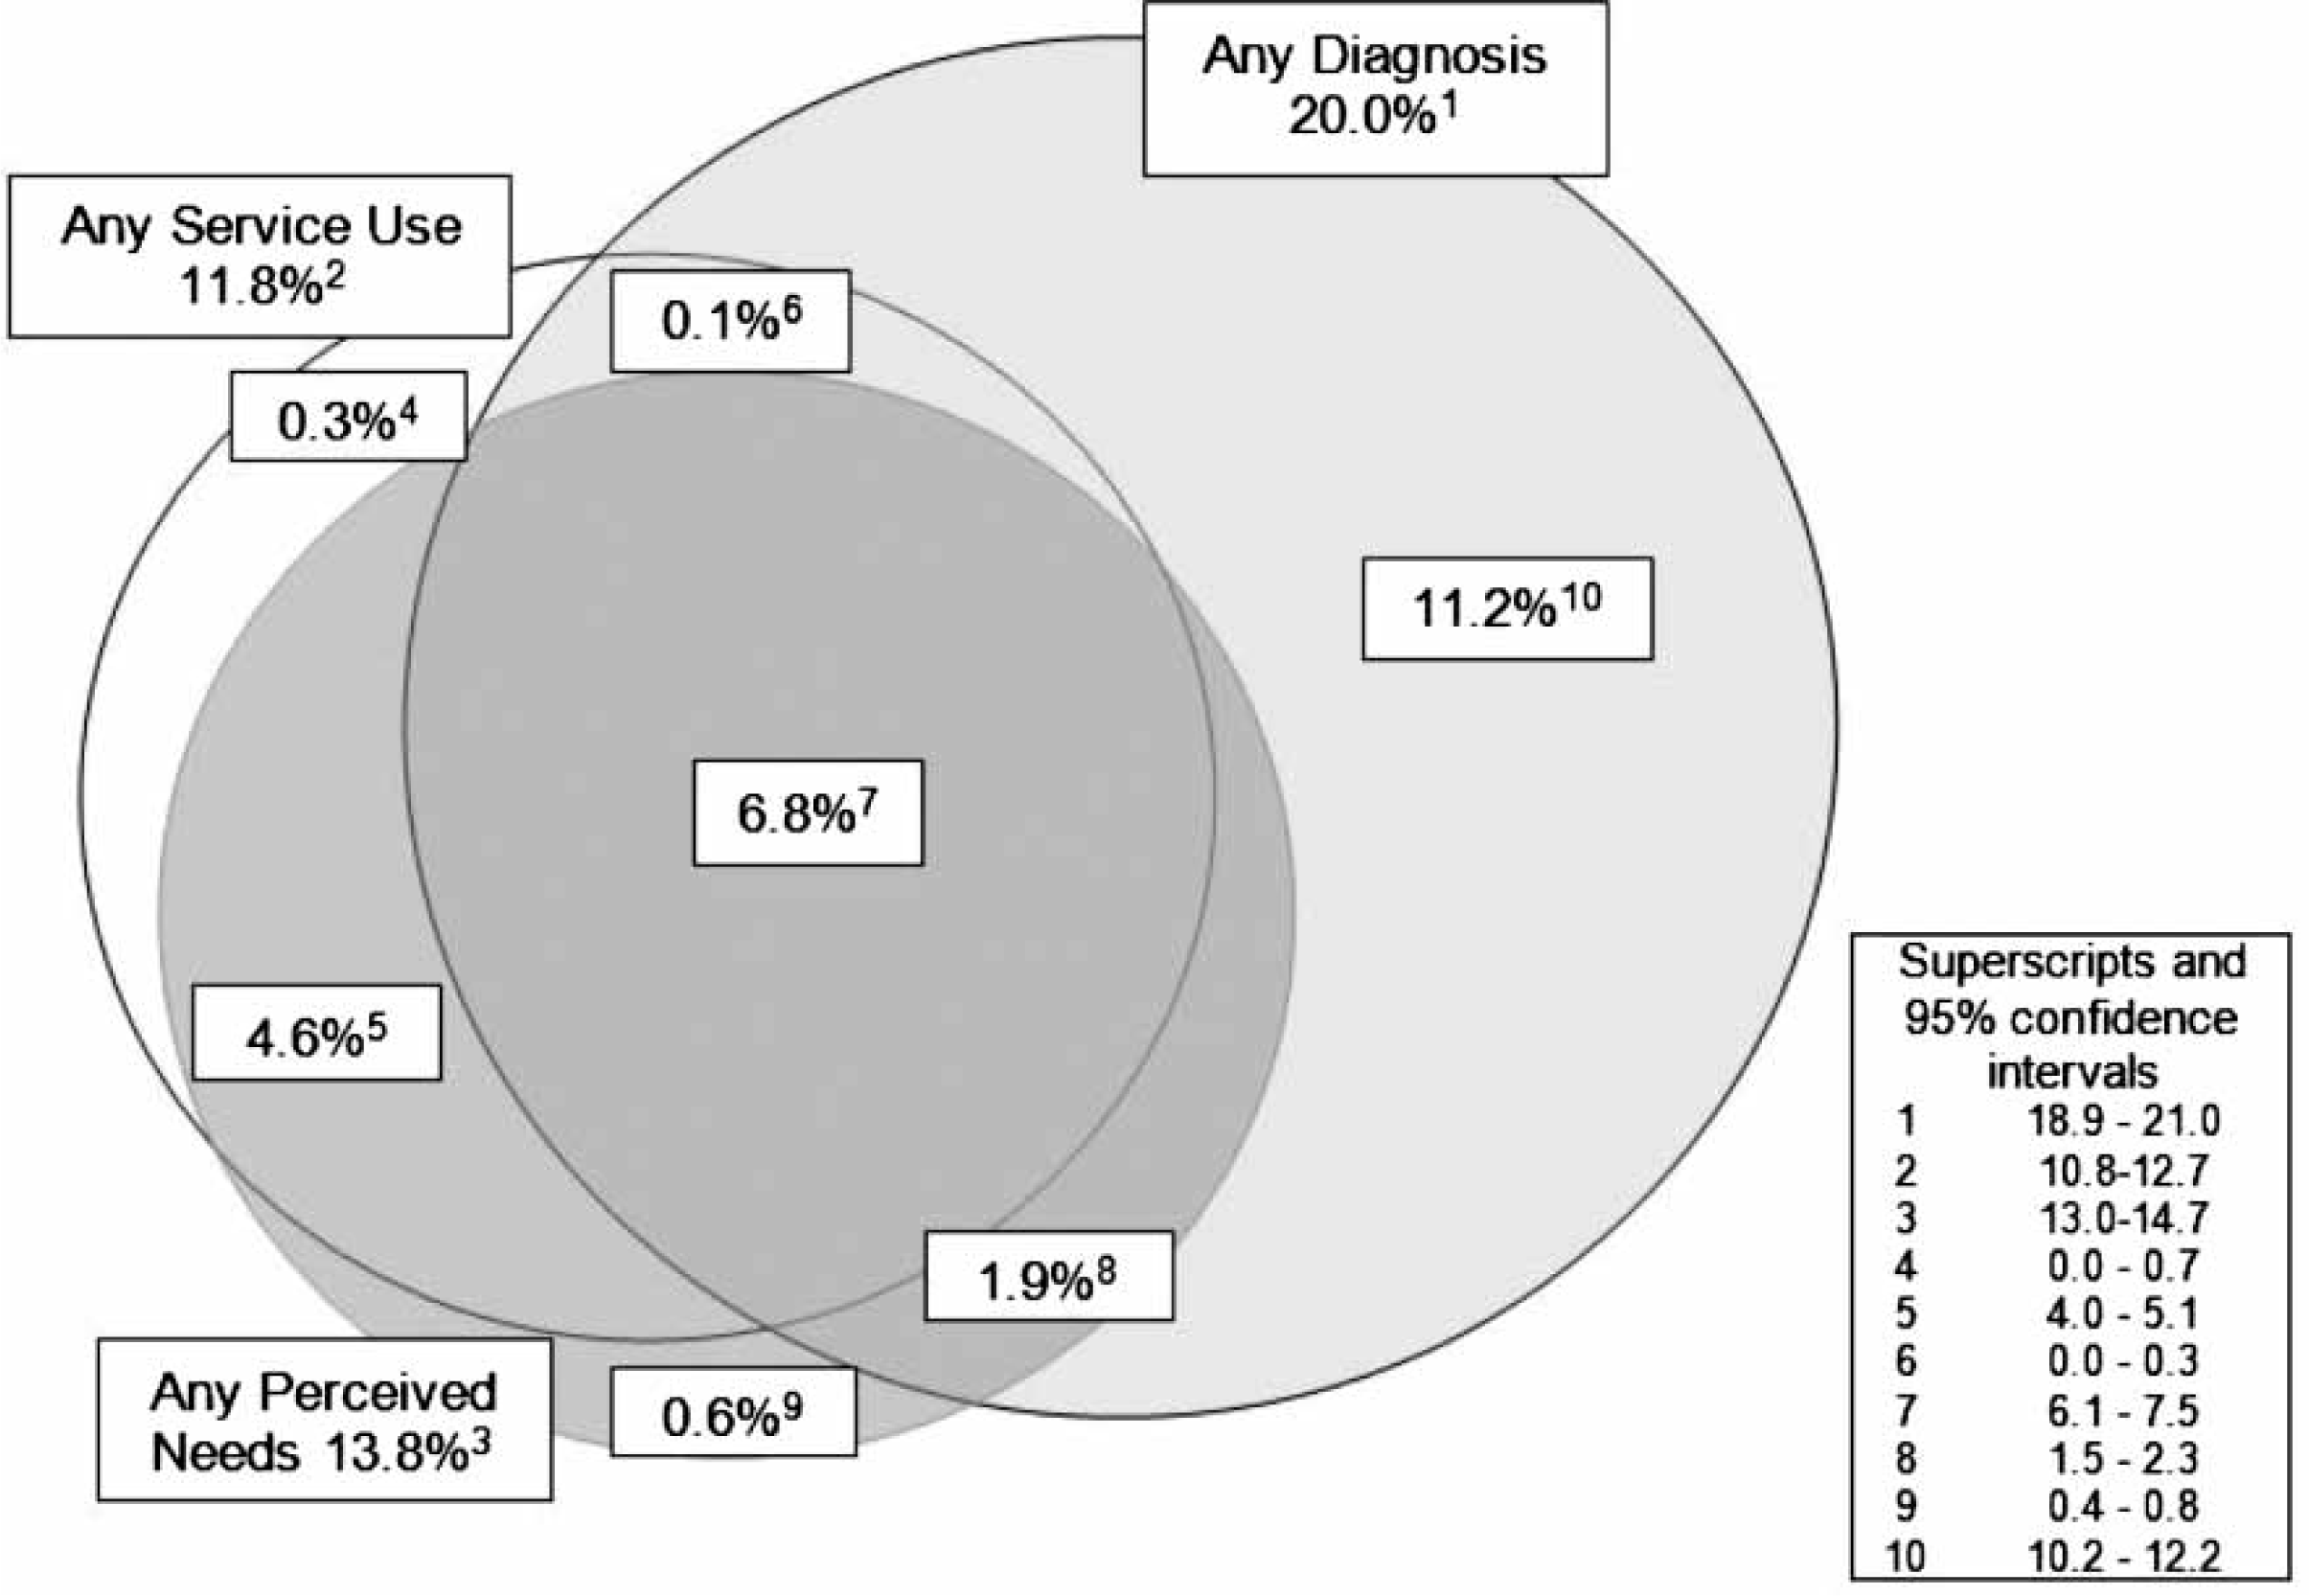
12 month prevalence estimates for disorder and overall perceived needs: presence of disorder and broad diagnostic classes
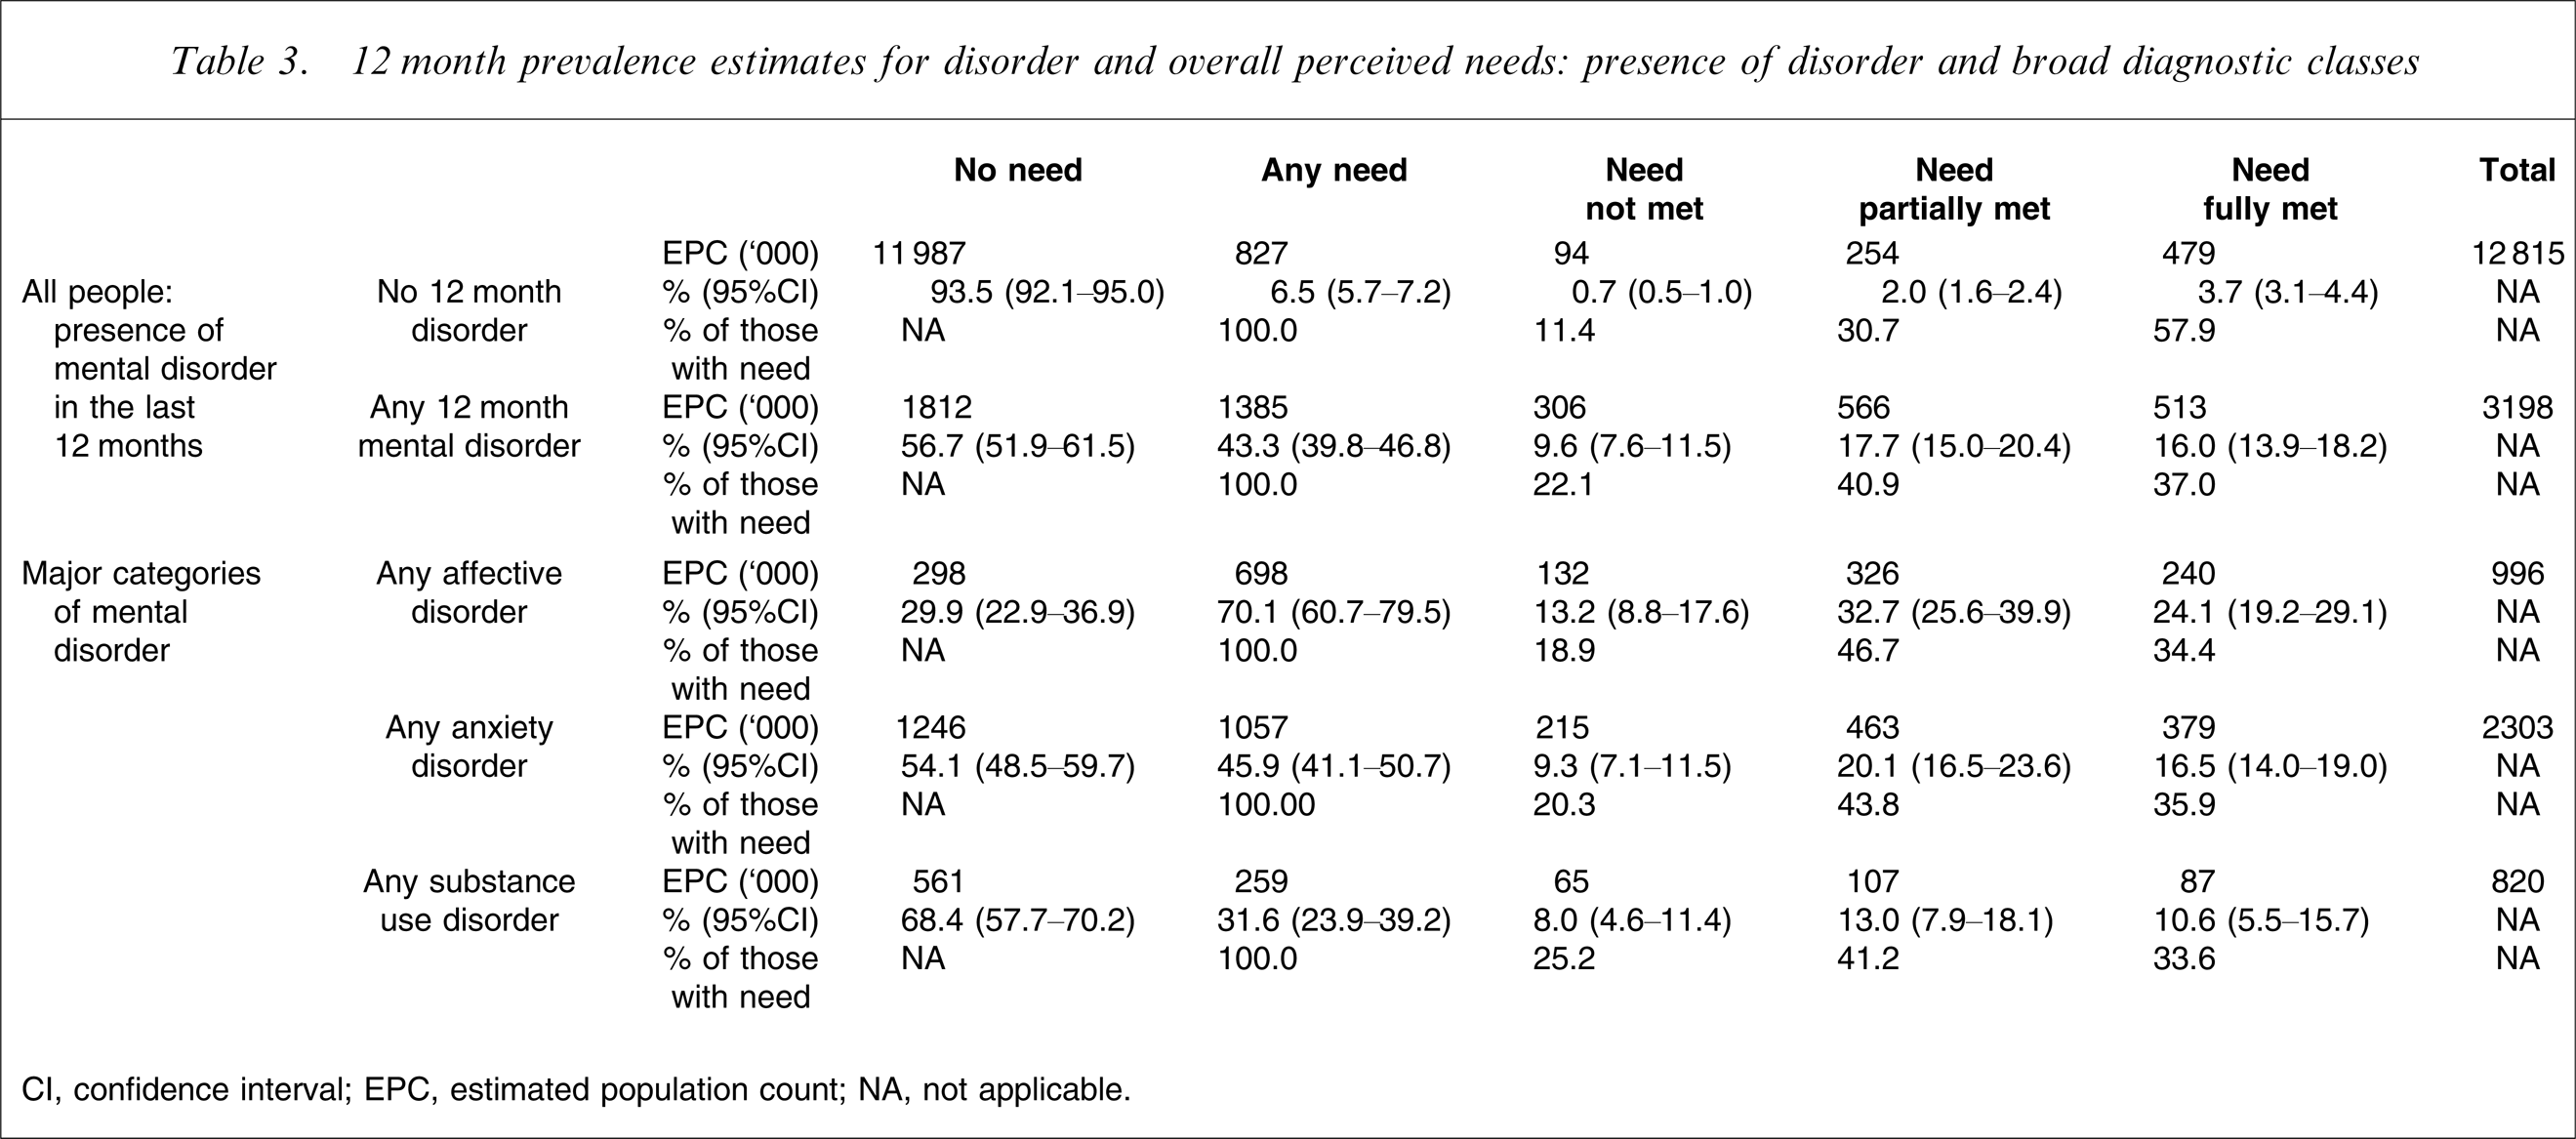
CI, confidence interval; EPC, estimated population count; NA, not applicable.
There is more service activity meeting perceived need in relation to anxiety disorders than affective disorders. Indeed nearly 400 000 people with anxiety disorders described themselves as receiving mental health care that met their needs. Among people with anxiety disorders we also find the largest number in Table 3 of people with unmet need, with a little over 200 000 people with anxiety disorders having unmet needs for mental health care.
12 month prevalence estimates for broad categories of service use and overall perceived needs
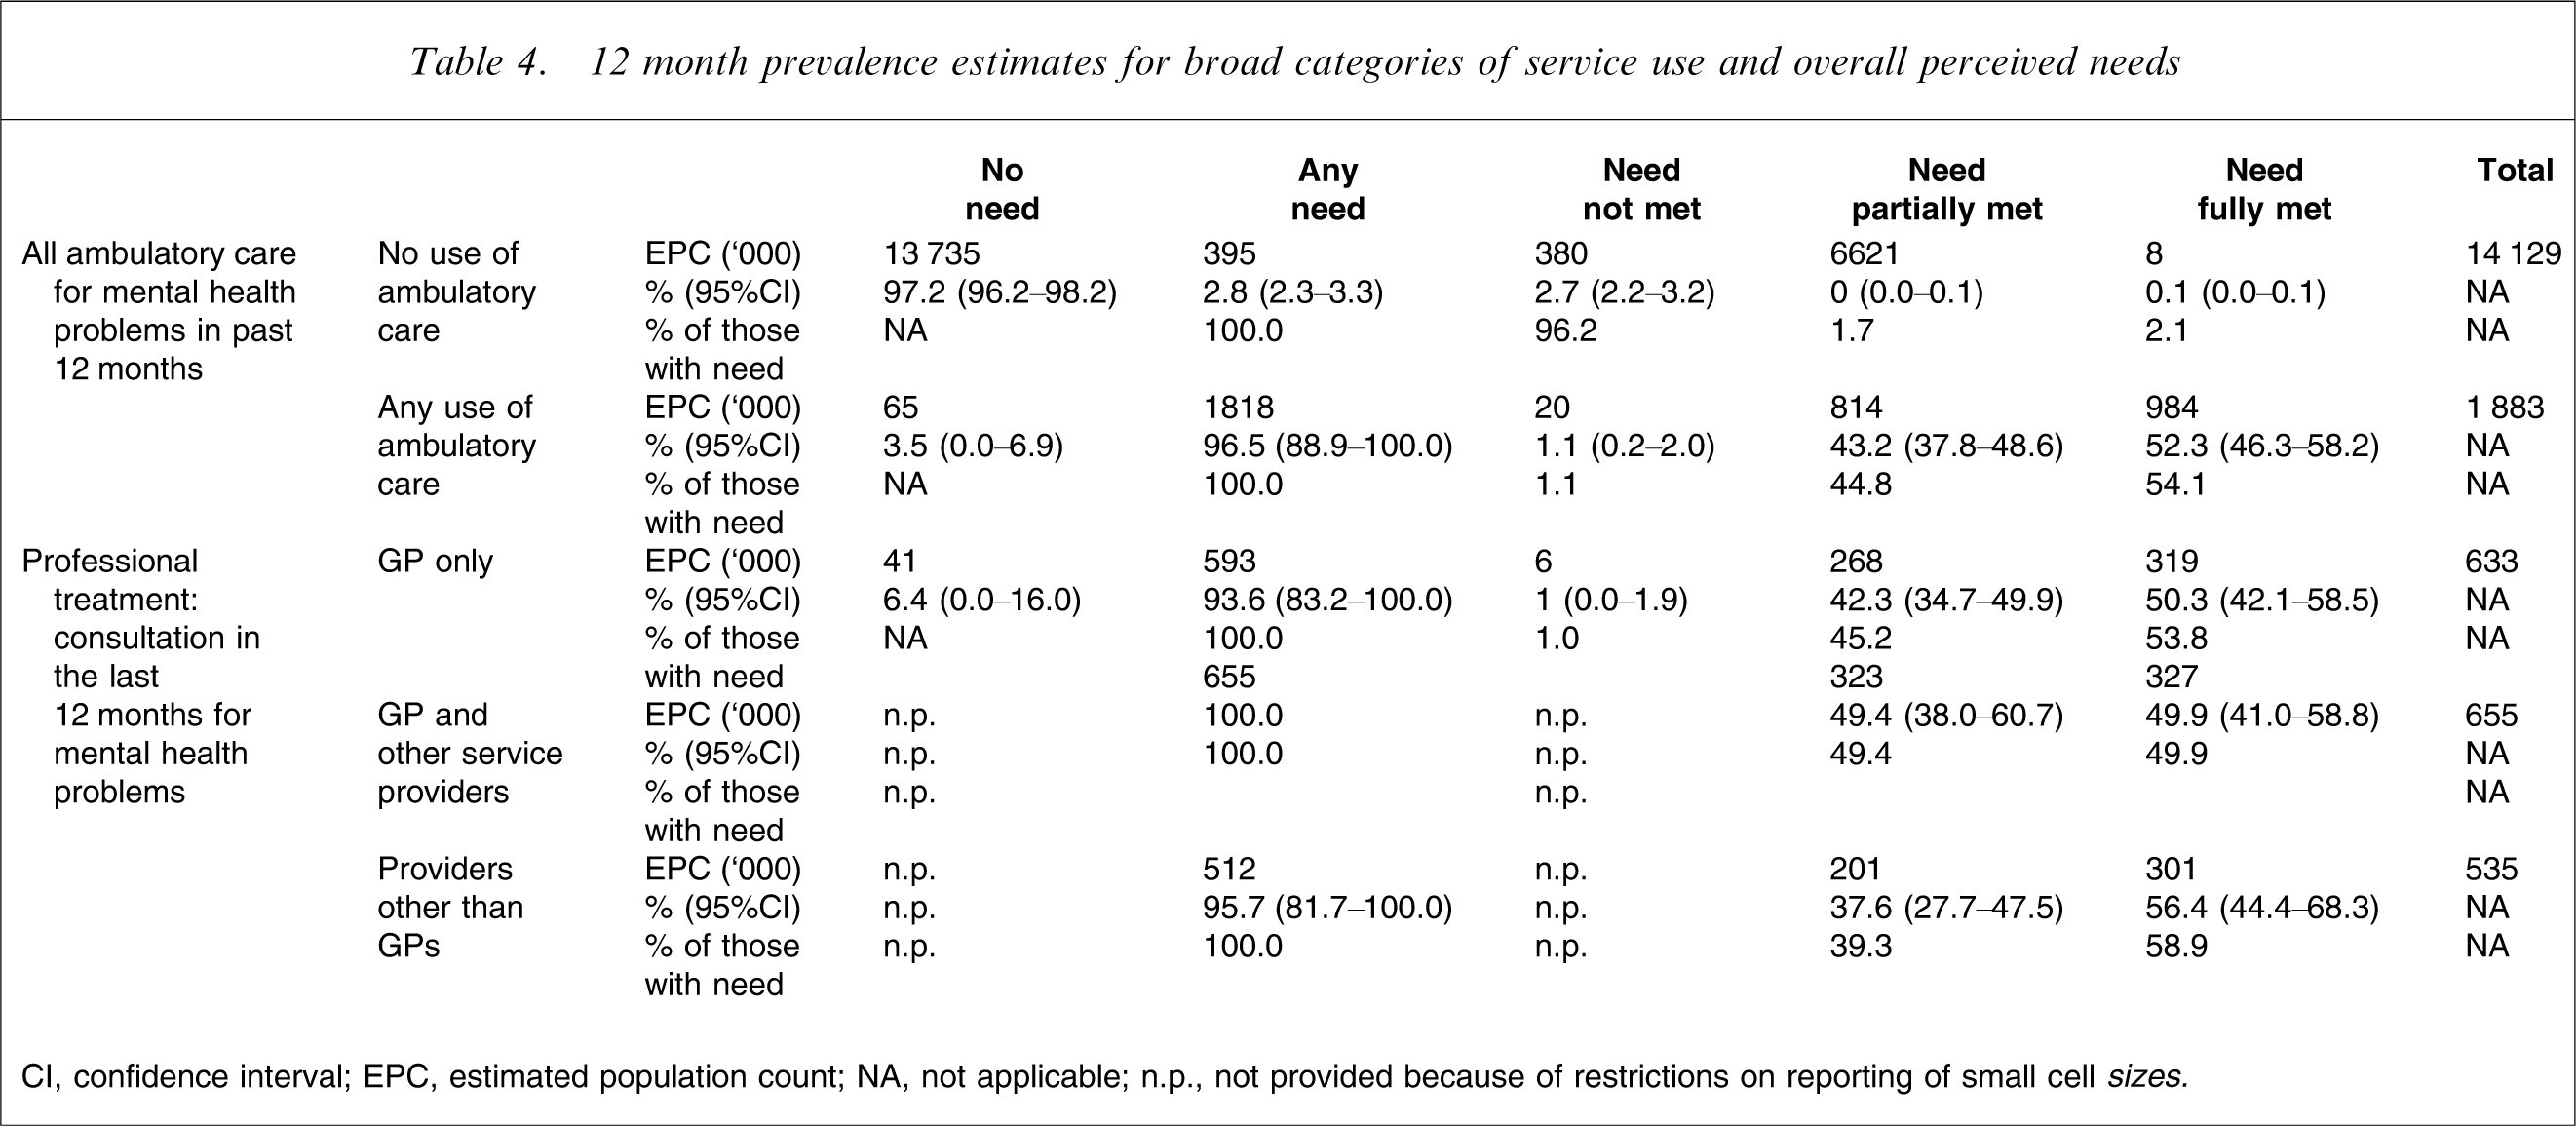
CI, confidence interval; EPC, estimated population count; NA, not applicable; n.p., not provided because of restrictions on reporting of small cell sizes
Among those who made some use of ambulatory care, nearly all people perceived some need for mental health care, and approximately half of this need, where present, was perceived as met. Among those who make use of professional treatment, considering the three broad patterns of care as described in Table 4, approximately similar numbers (between 630 000 and 660 000) consulted a general practitioner (GP) only or consulted a GP with other service providers. Fewer people overall saw service providers other than GPs alone for their mental health problems in the past 12 months (535 000). The rate with which perceived needs were met did not vary greatly between those using different services, falling broadly within the 50–60% range across all these three provider combinations. Each of these three patterns of care was responsible for meeting perceived needs for around the same number of people, in each case between 300 000 and 330 000 of the population.
Discussion
Key findings
One in seven Australians in the year of the survey perceived a need for mental health care. The majority of this need is expressed in the context of some service use. Two per cent of the population have no service use, a 12 month mental health disorder as assessed on the CIDI and a perceived need for care. Eleven per cent of the population had no service use for a mental health problem, and had a 12 month mental health disorder but did not endorse any need for mental health care. Perceived need for care was less common among people with substance use disorders than among those with anxiety or affective disorders. It was met differently across different classes of mental disorder and different perceived needs were met to differing degrees.
General limitations
Limitations of the 2007 NSMHWB generally including response rate factors have been discussed elsewhere [3], as have issues regarding comparison with the 1997 NSMHWB [17]. The diagnostic groups used in these analyses do not address comorbidity issues. This is one of the issues that will need to be explored in subsequent papers based on analyses from the data file [15]. But this is not available to researchers at the time of preparation of this initial set of publications. Some specific issues regarding comparison of PNCQ findings between the NSMHWBs in 1997 and 2007 will be addressed here.
Comparisons with 1997
Policy changes and rates found from the two surveys
needs for mental health care for the last 12 months: 1997 vs 2007 NSMHWB
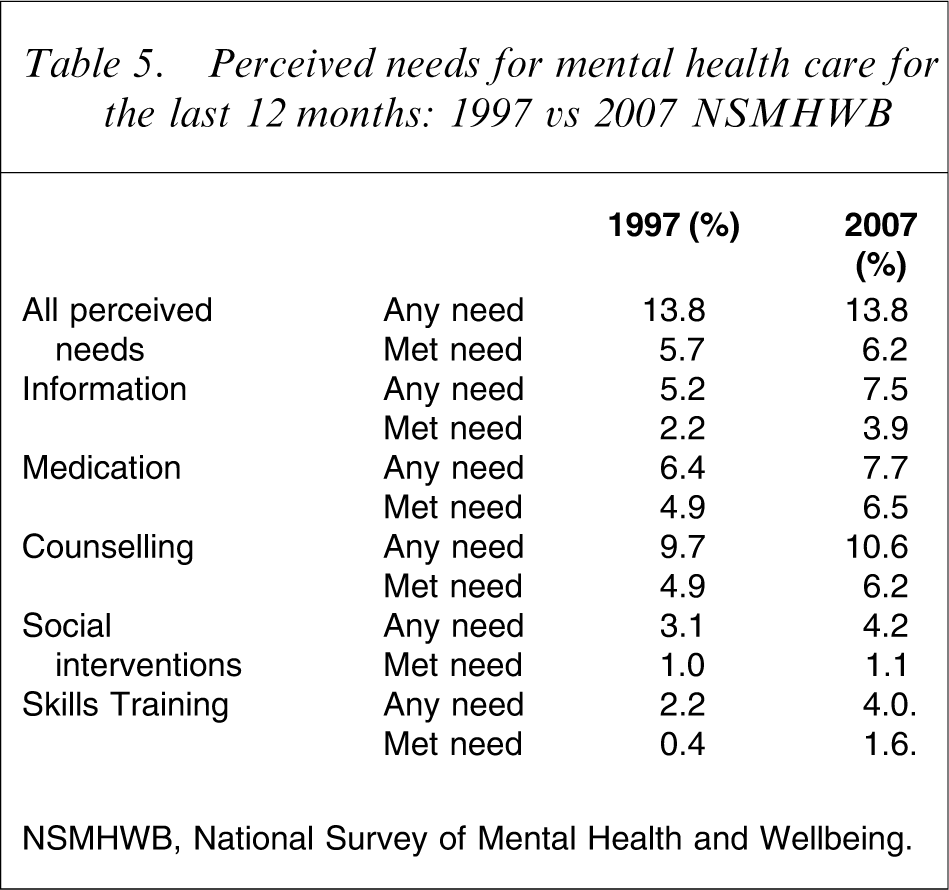
NSMHWB, National Survey of Mental Health and Wellbeing.
From Table 5 it would appear that although overall perceived need is stable, the rates of perceived need for all of the individual types of care have increased. Met need seems also to have increased. This would be substantially in line with many of the aspirations for the programmes introduced in the previous section. These comparisons, however, must be regarded as tentative; several issues regarding instrumentation at least may represent sources of systematic bias in such comparisons.
Sources of bias
Diagnosis
Comparisons need to be qualified due to use of two versions of the CIDI to assess 12 month disorder [18]. Further analyses will enable some greater convergence of the diagnostic classes in the two surveys to be achieved based on alternative coding of the data. When comparisons may be considered between rates of perceived need among people with disorders, then CIDI-related biases would affect the denominator to these rates.
Service use
This instrumentation for the NSMHWB 2007 was developed with close attention to the possibility of comparability to the NSMHWB 1997 but there were changes to enable more refined health economic analyses based on issues identified with the 1997 instrument [30]. If the definition of service in 2007 was more inclusive than the 1997 questions then this might have led to more people with service use being asked the need questions. This could represent a bias towards more meeting of perceived need, and secondary work on the two surveys will need to examine this possibility.
PNCQ
Textually the PNCQ 1997 and 2007 were very similar but there were some changes in how the PNCQ was administered between the NSMHWBs in 1997 and 2007. Two changes of importance here were (i) inclusion of harmful alcohol use into PNCQ entry criteria, which was not the case in 1997; and (ii) fuller inclusion of people with untreated mental disorders into the PNCQ respondent group, including the addition of a question that provided an opportunity for people without service use or 12 month disorder to otherwise indicate that they had a mental health problem and then possibly endorse a perceived need. These changes apply to people who did not use services, and serve to be more inclusive in the definition of perceived need by increasing the opportunity they have to assign themselves as having a perceived need. By definition if these people endorse a perceived need, this perceived need must be unmet (Figure 1). Hence the direction of any bias from these changes in the PNCQ would be towards an apparent increase in unmet perceived need.
Fully comparable PNCQ analyses will involve some recoding of derived items from the two survey data sets, including paying careful attention to bringing consistency to the effective inclusion rules for the PNCQ definitions of perceived need. Other sources of biases and confounding will need to be excluded as far as possible based on work to follow with the released data set.
Possible significance of changes between 1997 and 2007
Increased perceived need might be generated by more severe patterns of disorder if such a trend was present, but alternatively could reflect increased community awareness and willingness to seek help for mental health problems. We would consider this a more likely explanation. Increased meeting of perceived need in population terms could be taken to indicate a service system with increased capacity and improved responsiveness. Increased numbers of people seeing psychologists as noted in the accompanying paper describing service use [4] may be part of the reason for this. Needs for forms of care, however, other than psychological treatments, seem also to be more frequently met so there may be effects appearing here from other work to improve the mental health-care system. With due qualification, the findings offer some encouragement that the efforts of State and Commonwealth governments in improving mental health care may be bearing some fruit. If, as further analyses are conducted, these changes are confirmed, then internationally they represent a significant wide-scale confirmation through a population health survey of improved mental health care in response to coordinated national initiatives.
Assessing and responding to treatment gaps
The overall treatment gap based on untreated prevalence would appear to be 13% of the population. If we accepted this estimate, then the task of extending a service response to all these people, something that could involve up to doubling the total current service volume, would appear Herculean. If, alternatively, the perceived need estimates are used to describe the treatment gap, approximately 2.5% of the population with needs for mental health care are not responded to at all, and there is a further 5% for whom, although there is some contact with services, the needs are rated as not fully met. Six per cent of the population have their perceived needs rated as met. Two per cent of the population are in the situation of having a 12 month mental disorder, a perceived need for mental health care but receive no care.
The 1997 survey found that perceived need was associated with disability and some specific diagnostic groups [31]. Typically, people in 1997 who despite having 12 month mental disorder did not identify perceived need, were less disabled, and specifically they less commonly reported days out of role. In further analyses it will be important to explore the characteristics of these survey respondents in 2007, including confirming if the patterns of apparent severity are similar to those found in 1997 and to consider the nature of best response that might be made to their problems. The CIDI is not a perfect identifier of needs for mental health care. Further information on these people in the 2007 NSMHW will enable consideration of where efforts should be targeted to promotion of mental health literacy in encouraging service consultation, and where issues arise for other forms of social support, or provision of services by the broader primary care sector as well as specialist services.
Practically, extending care towards those in the community currently not receiving it is likely to be most fruitful if it prioritizes those who are already receptive to the idea of care. In this context we can consider an immediate target group for assertive efforts at service provision as perhaps not of the scale of 13%, but rather around the 2% in the population who are identified as having 12 month disorders and also have a perceived need.
Further work will need to examine the 5% of the population who received services but had no 12 month disorder. Work in North America has found that the comparable group found in a major survey there typically had definite indicators of need for care [32]. Among these people will be a proportion who, if seen by a clinician, would be assigned valid ICD codes representing disorders currently in remission (e.g. F33.4 ‘recurrent depressive disorder, currently in remission’) [23], and many such people will not be identified by the CIDI as having a 12 month disorder. Further analyses from the NSMHWB will be able to estimate the prevalence of disorders presently in remission from combinations of lifetime prevalence, service use and perceived need data and to describe other indices of need including perceived needs in this group.
Disorder groups and kinds of interventions
It seems that in the adult Australian community at least, affective disorders are more likely to be recognized by the general population as being associated with perceived needs for care than other disorder types.
Proportionally, meeting of perceived need is greater for medications and counselling than for other categories, and particularly it is poorer for social interventions and skills training. In the case of medication the patient is typically especially less well equipped than the medical practitioner to assess the adequacy or otherwise of this type of treatment, which is particularly a matter of expert judgement. It may be noted that the interventions characterized under the headings of skills training and social interventions may typically be more appropriately and effectively provided by occupational therapists and social workers. Subsequent analyses from the NSMHW 2007 should explore if those with these needs are getting services from these practitioners or not and this relatively large proportional gap appears to merit more attention.
Conclusions
More than 2.2 million people in Australia have perceived needs for mental health care, and more than a million Australians regard themselves as having that need met by services. In response to a decade of mental health-care reforms, we can tentatively say that progress appears to have been made. Undoubtedly, there are major gaps that still remain, and of note approximately 400 000 Australians have unmet needs for mental health care. It appears that the relative disparity between need for care and actual care may be larger in areas outside of the conventional mental health service domains of medication and psychotherapy or counselling, where perhaps greater progress may have been made in enhancing service provision.
Footnotes
Acknowledgements
We thank all the participants in the reported survey. We acknowledge the Australian Government Department of Health and Aging and the ABS for their essential roles in support and conduct of both the NSMHW 2007 and 1997. Amy Johnston and Mark Deady at University of New South Wales and Bernadette O'Grady with Southern Synergy at Monash University provided valued support to preparation of output tables and figures. Amy Johnston, Ellie Fossey from Latrobe University and Scott Patten from the University of Calgary provided helpful comments on earlier drafts.