
Abstract
Patients with acute liver failure (ALF) display impairment of cerebral blood flow (CBF) autoregulation, which may contribute to the development of fatal intracranial hypertension, but the pathophysiological mechanism remains unclear. In this study, we examined whether loss of liver mass causes impairment of CBF autoregulation. Four rat models were chosen, each representing different aspects of ALF: galactosamine (GIN) intoxication represented liver necrosis, 90% hepatectomy (PH×90) represented reduction in liver mass, portacaval anastomosis (PCA) represented shunting of blood/toxins into the systemic circulation thus mimicking intrahepatic shunting in ALF, PCA + NH3 provided information about the additional effects of hyperammonemia Rats were intubated and sedated with pentobarbital. We measured CBF with laser Doppler, intracranial pressure (ICP) was measured in the fossa posterior and registered with a pressure transducer, brain water was measured using the wet-to-dry method, and cerebral glutamine/glutamate was measured enzymatically. The CBF autoregulatory index in both the GIN and PH×90 groups differed significantly from the control group. Conversely, CBF autoregulation was intact in the PCA and PCA + NH3 groups despite high arterial ammonia, high cerebral glutamine concentration, and increased CBF and ICP. Increased water content of the brainstem or cerebellum was not associated with defective CBF autoregulation. In conclusion, impairment of CBF autoregulation is not caused by brain edema/high ICP. Nor does portacaval shunting or hyperammonemia impair autoregulation. Rather, massive liver necrosis and reduced liver mass are associated with loss of CBF autoregulation.
Keywords
Introduction
Despite continuous advances in the treatment of patients with acute liver failure (ALF), the prognosis remains unfavorable, in particular for patients who do not fulfill the criteria for liver transplantation. Next to multiorgan failure, with cardiovascular collapse being the main cause of death, is intracranial hypertension that is preceded by changes in the cerebral blood flow (CBF) (Larsen et al, 1995; Blei, 2001). The reason for such alterations in CBF is not fully understood but may rely on failure of the normal autoregulatory mechanisms of CBF.
Cerebral blood flow normally remains constant despite wide variations in cardiac output, arterial pressure, and heart rate. This intrinsic mechanism is defined as CBF autoregulation, which maintains a constant CBF over a wide range of mean arterial blood pressures (MAPs) by means of vasodilatation and vasoconstriction (Lassen, 1959). If MAP is severely compromised, a precipitous decrease in CBF occurs when the lower limit (LL) of the autoregulatory plateau is reached. The upper limit of the autoregulatory plateau is reached at MAP values where the vessels start to dilate passively, which in turn results in an abrupt increase in CBF. In conditions where CBF is linearly related to MAP, autoregulation is considered lost. This means that any CBF autoregulation curve is characterized by two elements: the slope of the plateau phase and the lower and upper limit of autoregulation.
Autoregulation of CBF is absent in ALF (Larsen et al, 1994, 1995, 1999) and seems to precede development of high intracranial pressure (ICP) (Larsen, 1996; Strauss et al, 1997). Theoretically, impairment of CBF autoregulation during ALF may be caused by factors released by the necrotic liver per se, lack of vital factors missing because of loss of functional liver tissue, or accumulation of toxic substances in the blood, for example, ammonia and glutamine.
Former studies have indicated that CBF autoregulation may be intact in naäve rats after a 6-h ammonia infusion (Hirata et al, 1995). This leads to the hypothesis that loss of CBF autoregulation is caused by factors other than ammonia although ammonia demonstrably plays a significant role in the development of brain edema (Tofteng et al, 2006). Autoregulation of CBF can be reestablished within a remarkably short period of time both after liver transplantation (24 to 48 h) and spontaneous liver regeneration (72 to 96 h) (Strauss et al, 1997). If factors released by the inflamed and necrotic liver lead to loss of CBF autoregulation, then it can be assumed that surgical removal of the necrotic liver in ALF will perhaps decrease CBF and reestablish autoregulation. Interestingly, CBF decreases after total hepatectomy, which, at least to some extent, may support the hypothesis (Ejlersen et al, 1994; Jalan et al, 2002).
We decided to examine CBF autoregulation in four different animal models of ALF with the aim to characterize the factors associated with an impairment of CBF autoregulation. Each rat model represented important characteristics of liver failure.
The galactosamine (GlN) model represented toxic liver failure. Galactosamine at toxic doses results in hepatocellular necrosis and ultimately liver failure, a picture similar to ALF patients regarding histologic, paraclinical, and clinical aspects (Gove et al, 1997; Javle et al, 1998).
The 90% surgical hepatectomy (PH × 90) model provided an opportunity to examine the effects of reduced liver mass without hepatic necrosis. Histologic examinations have confirmed that the remnant 10% hepatic tissue is histologically intact and virtually no hepatic necrosis is detectable (Gaub and Iversen, 1984). Comparing PH × 90 with the toxic GlN model allowed a differentiation of the changes in CBF autoregulation caused by reduced liver mass as opposed to toxic liver failure with massive hepatocellular necrosis and the accompanying load of cytokines and other vasoactive compounds.
The portacaval anastomosis (PCA) model is well-validated in rats (Cordoba et al, 1999; Larsen et al, 2001), and intrahepatic shunting of portacaval blood, with its high ammonia concentration, is an important characteristic of a failing liver in ALF (Javle et al, 1998). The PCA model allowed us to isolate the effects of shunting of portal blood, and hence toxins from the gut, into the systemic circulation. To determine if high cerebral ammonia and glutamine affect the CBF autoregulation, we also combined the PCA model with NH3 infusion.
The hypothesis in this study was that impairment of cerebral autoregulation in ALF is caused by decreased functional liver mass and necrosis. High cerebral levels of ammonia and glutamine as well as portacaval shunting are hypothesized to play a minor role in the impairment of cerebral autoregulation.
Materials and methods
A total of 72 Wistar rats were divided into five different groups:
control group, untreated rats (n = 8, autoregulation; n = 8, brain water measurements), galactosamine, 1.4 g/kg intraperitoneally (n = 8, autoregulation; n = 8, brain water measurements), ninety percent surgical hepatectomy (n = 8, autoregulation; n = 8, brain water measurements), portacaval anastomosis (n = 6, autoregulation; n = 6, brain water measurements), portacaval anastomosis + ammonia infusion (55 μmol per kg per min) (n = 6, autoregulation; n = 6, brain water measurements).
All animal experiments were performed in accordance with the European Communities Council Resolves of 24 November 1986 (86/609/EEC) and approved by the Danish State Research Inspectorate (J. No. 2006/561–1244).
Animals
The study was performed using 3-month-old male Wistar rats (Charles River, Sulzfeld, Germany) weighing 250 to 350 g. The animals were housed in cages with free access to food (Altromin 1314; Chr. Petersen, Ringsted, Denmark) and water available ad libitum. They were kept at 12:12-h light/dark cycle with constant temperature and humidity.
Experimental Preparation
Groups 2 to 5 were anesthetized with Isoflurane (Abbott, Scandinavia, Solna, Sweden) 2% in oxygenated air (40%) during preparation. Group 1 served as healthy controls for all the groups and thus received no experimental preparation. Group 2: GlN (99% pure, Sigma-Aldrich, Brøndby, Denmark) was diluted in phosphate-buffered saline buffer, pH 7.4. The rats received an intraperitoneal injection of GlN, 1.4g/kg. The average injection volume was 4 mL. The mortality over the next 24 h was under 10%. After 24h, the animals were anesthetized and the experiment was performed. Group 3: under Isoflurane anesthesia, a 90% partial liver resection (Ph × 90) was performed as described by Gaub and Iversen (1984). Vitality of the remaining 10% liver tissue was ensured. The abdomen was sutured in two layers and the rats were returned to their cages. After 48 h, the animals were reanesthetized and the experiment was performed. Groups 4 and 5: under Isoflurane anesthesia, an end-to-side PCA was conducted and completed within 15 mins. The abdomen was sutured in two layers. Buprenorfine 0.03 mg was administered intramuscularly as analgesic. After 24 h, rats were reanesthetized and the experiment was performed.
Experimental Procedure
For the actual experiment, the animals were reanesthetized with 2% Isoflurane in oxygenated air (40%). Pentobarbital (Mebumal 50mg/mL) 0.3 mL was administered intravenously and Isoflurane was shut off. Reaction to pain stimuli (pinching of the tail) was checked every 10 mins during the experiment and supplemental doses of 0.1 mL pentobarbital were administered intravenously when needed. Group 4 had a 3-h infusion of 0.9% saline at a rate of 2 mL/h. Group 5 received 3 h of intravenous ammonia infusion, 55 μmol per kg per min at a rate of 2 mL/h. After 180 mins, cerebral autoregulation was tested in both groups.
Temperature was monitored with an intraabdominal thermistor and was maintained constant at 37°C with a heating blanket. Blood pressure was monitored by a femoral artery catheter (PE-50) connected to a pressure transducer. Hemodynamic data were recorded and displayed on a computer. To prevent clotting, we installed 500 IU of heparin in the arterial catheter. The rats were tracheotomized and mechanically ventilated (Hallowel EMC, E-vet, Haderslev, Denmark) with a frequency of 45 min−1 and a volume between 5 and 10 mL to maintain expiratory CO2 levels between 2.99% and 3.92%. For ICP measurements, the animals were placed in a stereotactic micromanipulator and the scull was fixed. A scalp incision was made, and a small hole was drilled through the scull. A catheter (PE10) connected to a pressure transducer was placed in the cisterna magna and fixed with bone cement. A hole (1.5 mm diameter) was drilled 3½mm anterior and 3½mm lateral of lambda over the right brain hemisphere. A laser Doppler probe (Probe 407; Perimed, Stockholm, Sweden) was inserted 1/2 mm into the brain cortex using stereotactic micromanipulation and was fixed with bone cement. This allowed continuous measurement of blood velocity using a Periflux laser Doppler System 5000 monitor (Perimed, Stockholm, Sweden).
Arterial blood samples were taken every 30 to 45 mins to determine the levels of oxygen, CO2, pH, and
Cerebral autoregulation was challenged by controlled systemic arterial hemorrhage over 45 mins, decreasing MAP until cardiac arrest. Periods with steady MAP and laser Doppler flow (LDF) values were obtained through stepwise hemorrhage, decreasing MAP in approximately 10 mmHg intervals. Data for MAP and LDF were collected with a sampling rate of 32 Hz. For each animal, a cerebral perfusion pressure (CPP)/CBF curve was computed.
The LL of CBF autoregulation was calculated as follows: flow curves from each animal were evaluated and accepted for further analysis only if the range of CPP values exceeded 40 mmHg. Cerebral perfusion pressure values and laser Doppler blood flow values for each flow curve were normalized to baseline levels, equaling 100%; then, CBF was plotted against the corresponding CPP and LL was determined. Calculation of LL was made by the least-squares method computed in each rat by repeatedly fitting data to two linear regression lines in a specially designed computer program: a horizontal and an oblique line, where the cross-over point defines the LL (10). The following criteria defined autoregulation as intact for an individual flow curve: firstly, the sum of squares from the two computed regression lines was smaller than the value from a single linear regression line; secondly, the computed LL had to be physiologically meaningful and the SEM could not exceed 25% of the value.
In animals where computer regression could not detect an LL, the slope of the autoregulatory curve was determined on the basis of the entire LDF data. Conversely, in rats with a detectable LL, only data with MAP values above the LL were included (Figure 1). We pooled LDF data from the animals in each group to compare changes in the autoregulatory pattern as a result of the different treatments. Finally, CBF and CPP were recalculated as percentage changes of the baseline flow to present the flow curves according to the definition of the autoregulatory index (AT):
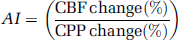
Intact and impaired CBF autoregulation: CPP/CBF curves obtained from two individual animals showing typical flow patterns: intact and impaired autoregulation.
Brain Water Measurements
All experiments were performed in duplicate: one animal was subjected to controlled hemorrhage for the autoregulation studies and one animal was used for brain water measurements. This was done to avoid any bias or erroneous brain water measurements in hemorrhaged animals. At the end of the experiment, the animals were decapitated, the brain was removed and dissected into three parts: forebrain, cerebellum, and brainstem. The parts were transferred into preweighed glass scales. The wet weights of the brain parts were measured and the specimens were then dried in an oven for 48 h at 120°C (until stable weight). The dried brains were then allowed to acclimatize in an exicator and subsequently weighed. The percentage water content of the brain parts was calculated according to the following formula: ((wet weight-dry weight)/wet weight) × 100 (Elliott, 1949).
Cortical Glutamine/Glutamate Concentration Measurements
The dissected cerebral cortex was weighed and homogenized in a sixfold amount of ice-cold 1 mol/L HClO4. The homogenate was centrifuged and the supernatant neutralized by ice-cold 1.6 mol/L KOH containing 0.4 mol/L K2CO3. Glutamine and glutamate in the cortex were analyzed in the supernatant by an enzymatic method using a YSI 2300 device (YSI, OH, USA).
Statistical Analysis
Comparison of the autoregulatory plateaus, which encompassed pooled data from each group, was achieved by means of random regression analysis (SAS statistical software). Differences in baseline paraclinical data between the five groups were examined using one-way analysis of variance (ANOVA). When the equal variance test or the normality test failed, the Kruskal-Wallis test for nonparametric analysis was applied. Differences between Groups 4 and 5 were assessed with a t-test. Values were reported as mean ± s.e.m. The relation between MAP and CBF was examined by statistical regression analysis (see experimental procedure). A P-value ≤0.05 was considered significant.
Results
Baseline Data
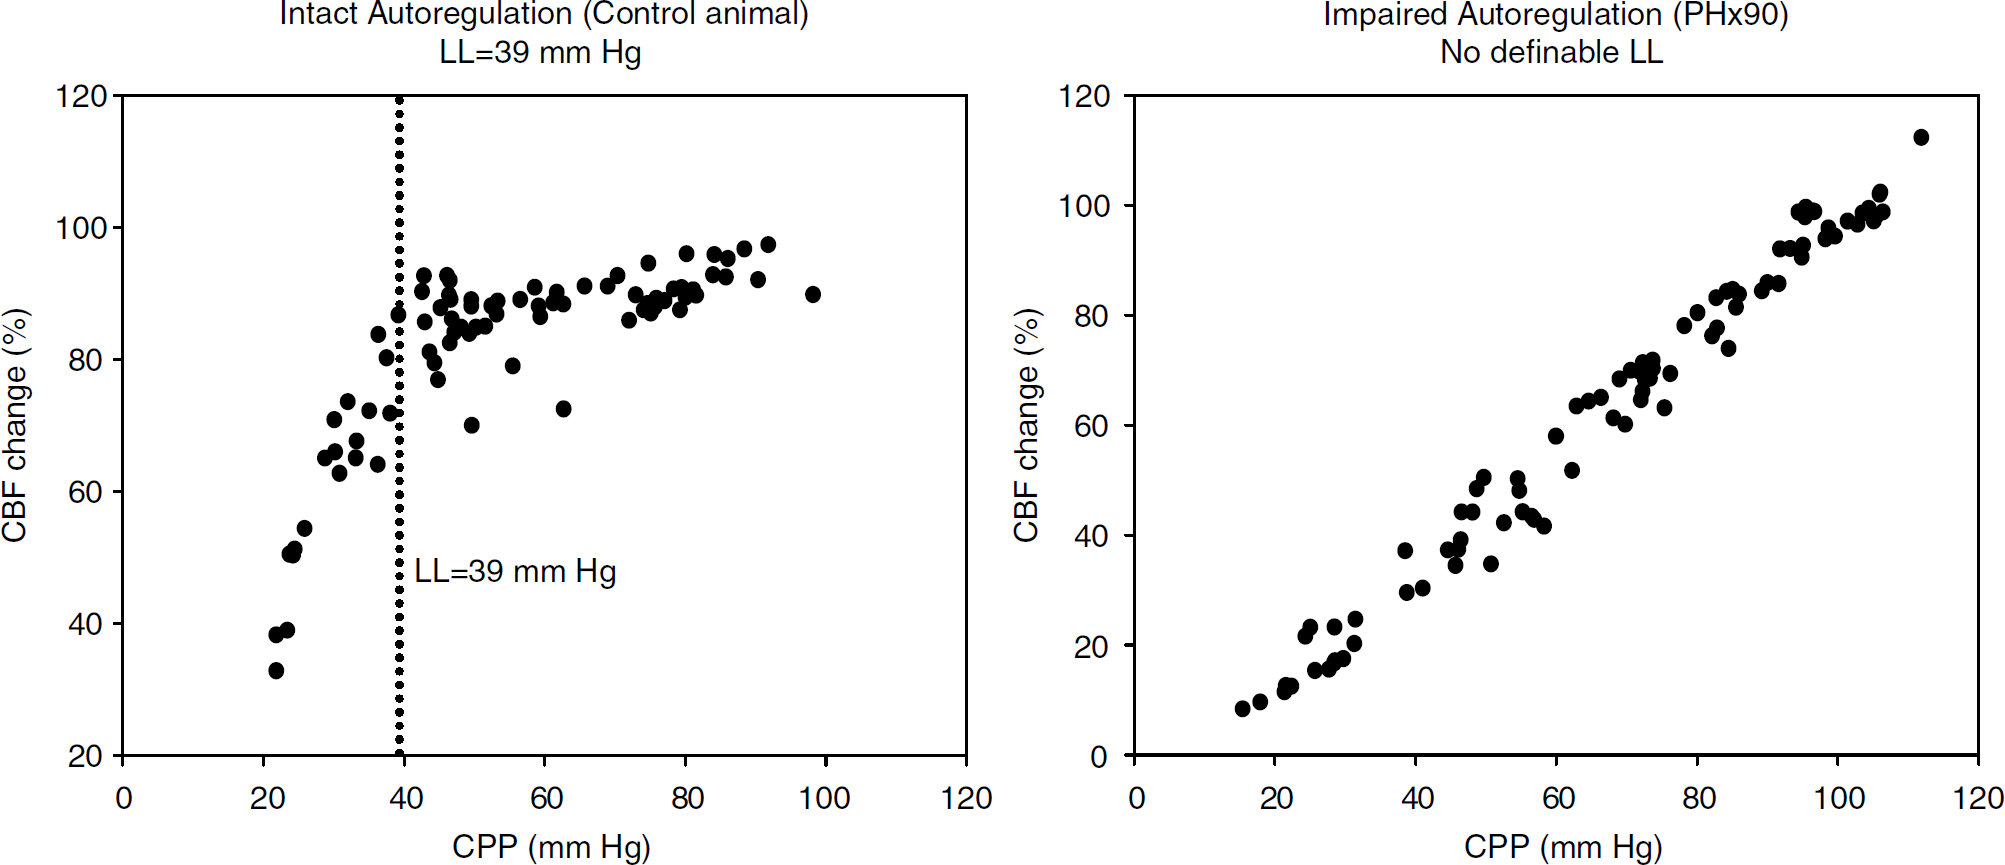
The control group did not differ significantly from all other groups regarding pH, pCO2, pO2,
Baseline data (groups versus control)
Abbreviations: ALT, alanine aminotransferase; GLN, galactosamine; INR, international normalized ratio; NH3, ammonia; PCA, portacaval anastomosis; PH×90, 90% hepatectomy.
Data presented as mean ± e.m.
Baseline data for all groups. Significant differences were only found regarding plasma potassium (GIN versus control), INR (GIN and PH×90 versus control), ALT (GIN and PCA+NH3 versus control), bilirubin (PH×90 versus control), and ammonia (PH×90, PCA, and PCA+NH3 versus control).
Group versus control, ANOVA P < 0.05.
Autoregulatory Studies and Lower Limit
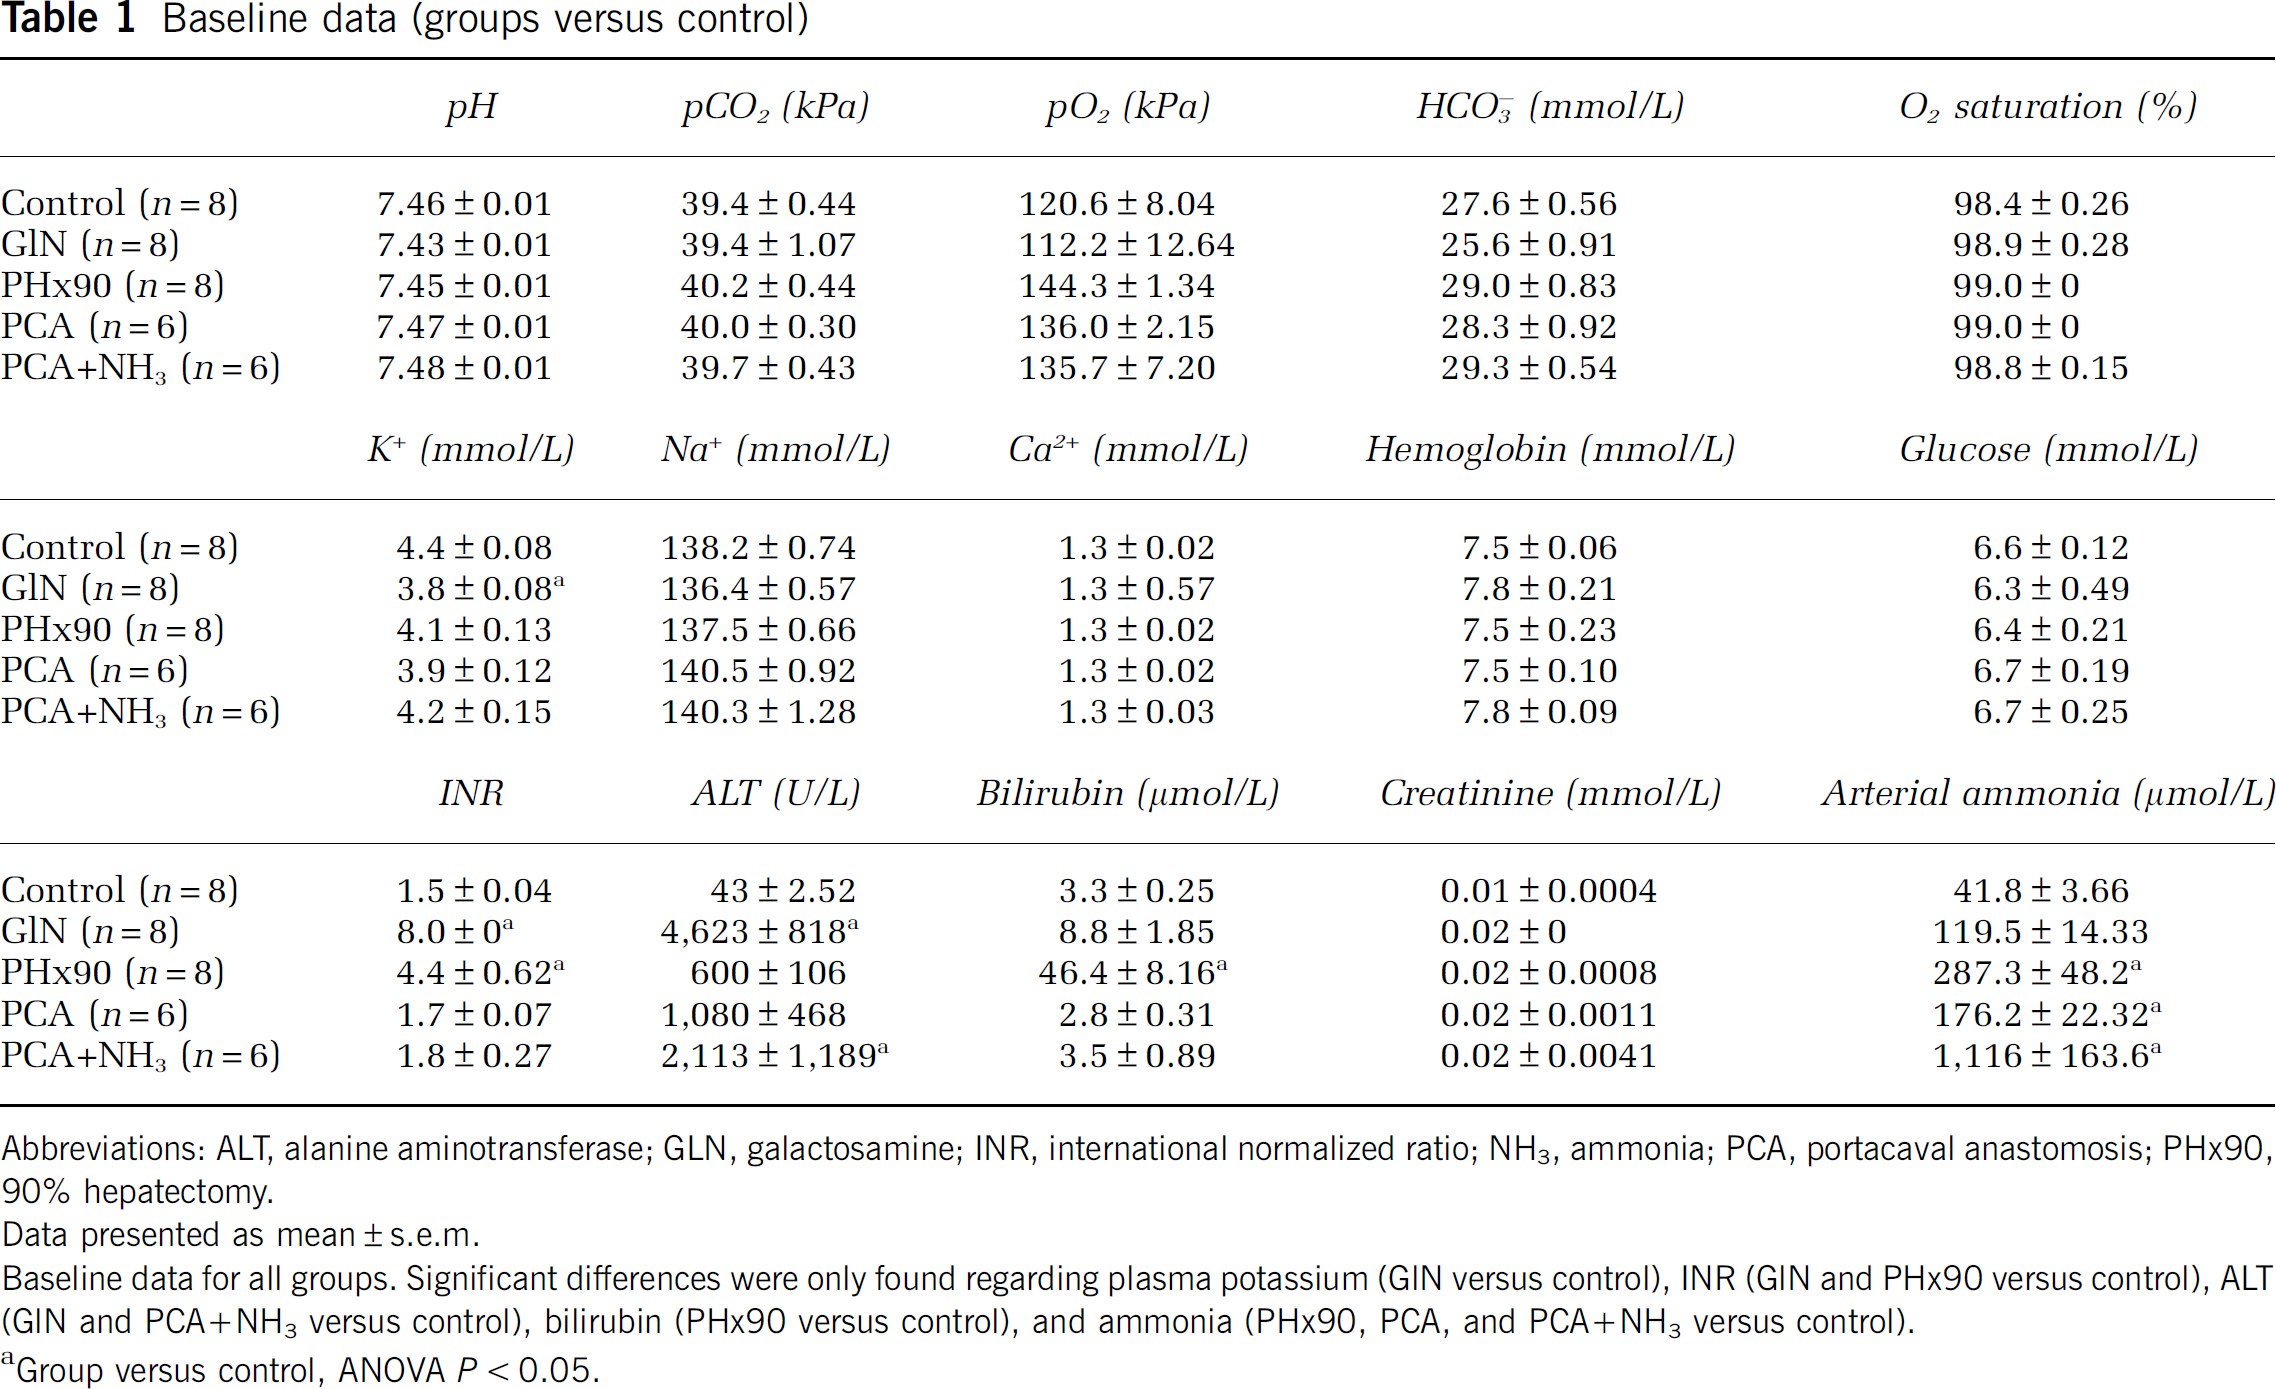
All rats in the control group showed a classical autoregulatory pattern with a slight slope or a horizontal plateau phase. Since the AI of the individual animals in each group was similar, we chose to pool data from the plateau phases (Figures 2 and 3).
Autoregulatory plateaus: control group versus acute liver failure models; X-axis: CPP (mm Hg); Y-axis: CBF (relative change); CBF measured by laser Doppler. Each of the flow curves contains data from eight animals. Individual dots in the curves represent CPP/CBF values from a single animal. The regression lines were calculated by means of random regression as a pooled value for all animals in a group. The slope of the line equals the autoregulatory index (AI). In healthy animals, CBF is independent of CPP (= horizontal plateau phase) whereas a sloped curve reveals an impaired autoregulation. Comparing the AI of the autoregulation curves (ANOVA: mixed models, random regression) shows that the control group differs from the ALF models (the galactosamine group and the PH×90% group; P < 0.0001).
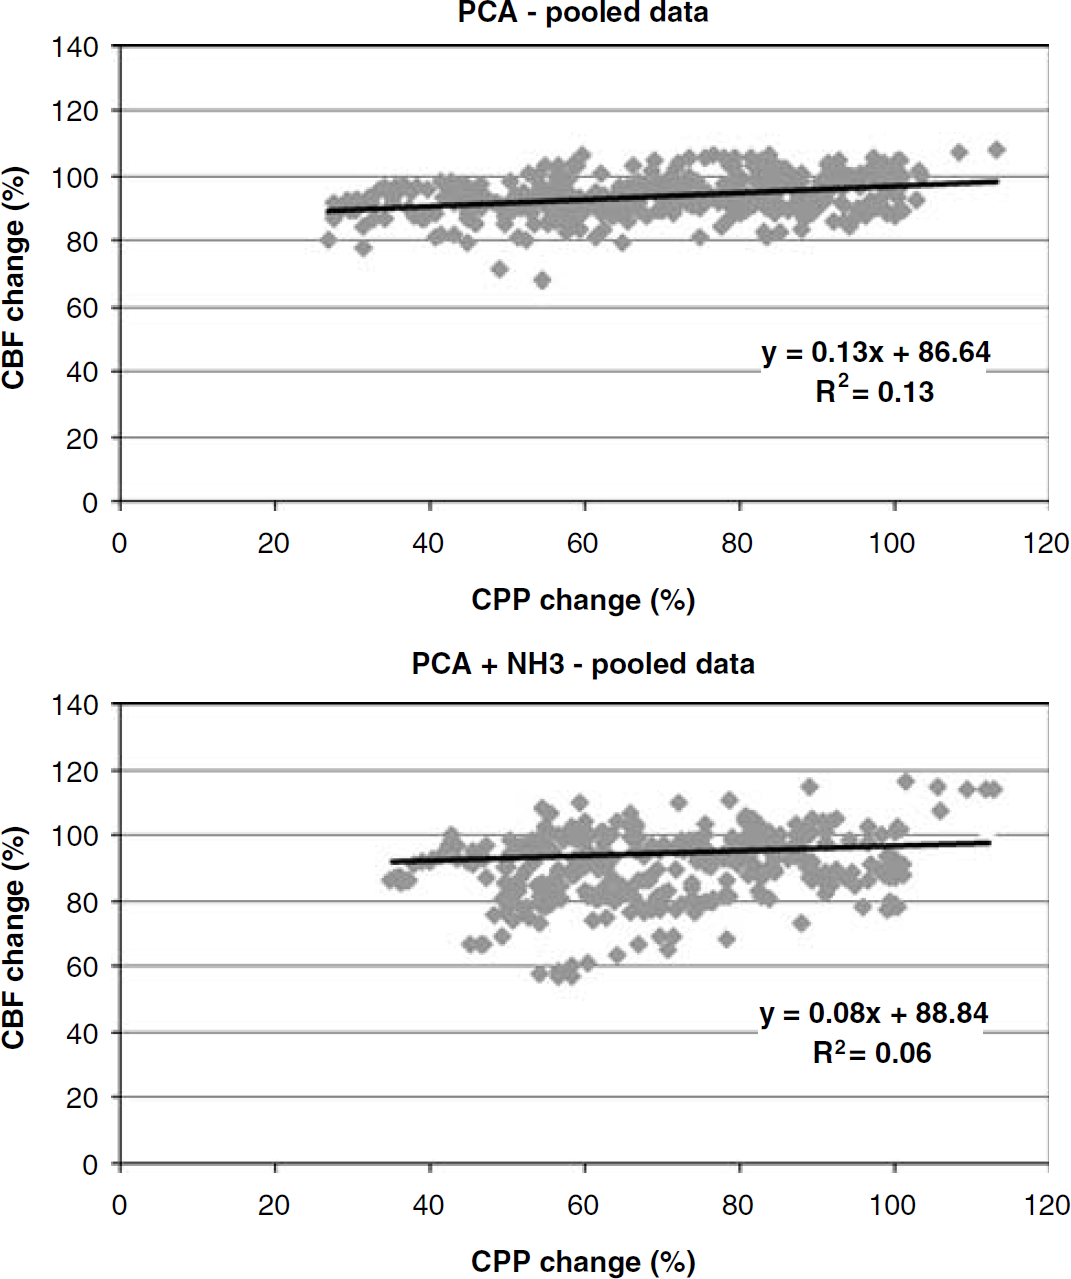
Autoregulatory plateaus: PCA and PCA + NH3; X-axis: CPP (mm Hg); Y-axis: CBF (relative change); CBF measured by laser Doppler. Each of the flow curves contains data from all the animals in the group; PCA and PCA + NH3 groups (n = 6, each). Individual dots in the curves represent CPP/CBF values from a single animal (for calculations see Figure 2). Comparing the AI of the curves (ANOVA: mixed models, random regression) shows that the PCA and the PCA + NH3 groups do not differ (P = 0.16), and comparing the control group with the PCA group and the PCA + NH3 group shows no significant differences either (P = 0.09 and P = 0.82, respectively).
Pooled plateau phase data for the control group showed the following: AI (slope of the autoregulatory curve) = 0.10, R2 = 0.09, and the pooled LL = 33.0 ± 1.70. Compared with the control animals, the GlN group had a significantly steeper slope (AI = 0.68, R2 = 0.59), P<0.0001. Computer regression detected LL in three GlN animals (pooled LL = 37 ± 2 mmHg), whereas five animals had no defined LL. Similarly, the PH×90 group had a significantly steeper slope than the controls (AI = 0.77, R2 = 0.62), P<0.0001. The LL defined from the pooled data in the PH×90 group was 33 ± 2 mmHg; on a single animal level, LL was detectable in four out of eight PH×90 animals.
In all animals with PCA (with either NaCl or NH3 infusion), a classical horizontal or slightly sloped autoregulatory pattern was found. Comparing the AI of the control animals to that of the PCA group (AI = 0.13, R2 = 0.13) showed no significant differences, P = 0.16. Pooled LL for the PCA group was 36 ± 1 mmHg. Similarly, the PCA + NH3 animals uniformly displayed classical autoregulation with a horizontal or slightly sloped plateau (AI = 0.08, R2 = 0.06), which did not differ significantly from the control group, P = 0.91. The pooled LL of the PCA + NH3 group was 43 ± 3, which was significantly right-shifted compared with the control group, P = 0.006.
Glutamine/glutamate concentration in the central nervous system cortex
The glutamine content (mmol/100 g) in a homogenate of the central nervous system cortex was the following: control = 0.77 ± 0.02, GlN = 0.68 ± 0.04, PH×90 =1.67 + 0.10, PCA = 1.67 × 0.09, PCA + NH3 = 2.47 ± 0.06. The PH×90 and the PCA + NH3 groups differed significantly from the control group (P<0.05). Comparison of the PCA group with the control group also showed significant differences, P < 0.001 (t-test). The glutamate content (mmol/100g) was similar in all the groups: control = 0.96 ± 0.06, GlN = 1.21 ± 0.02, PH×90 = 0.96 ± 0.05, PCA = 0.89 ± 0.02, PCA + NH3 = 0.79 ± 0.04 (Figure 4).
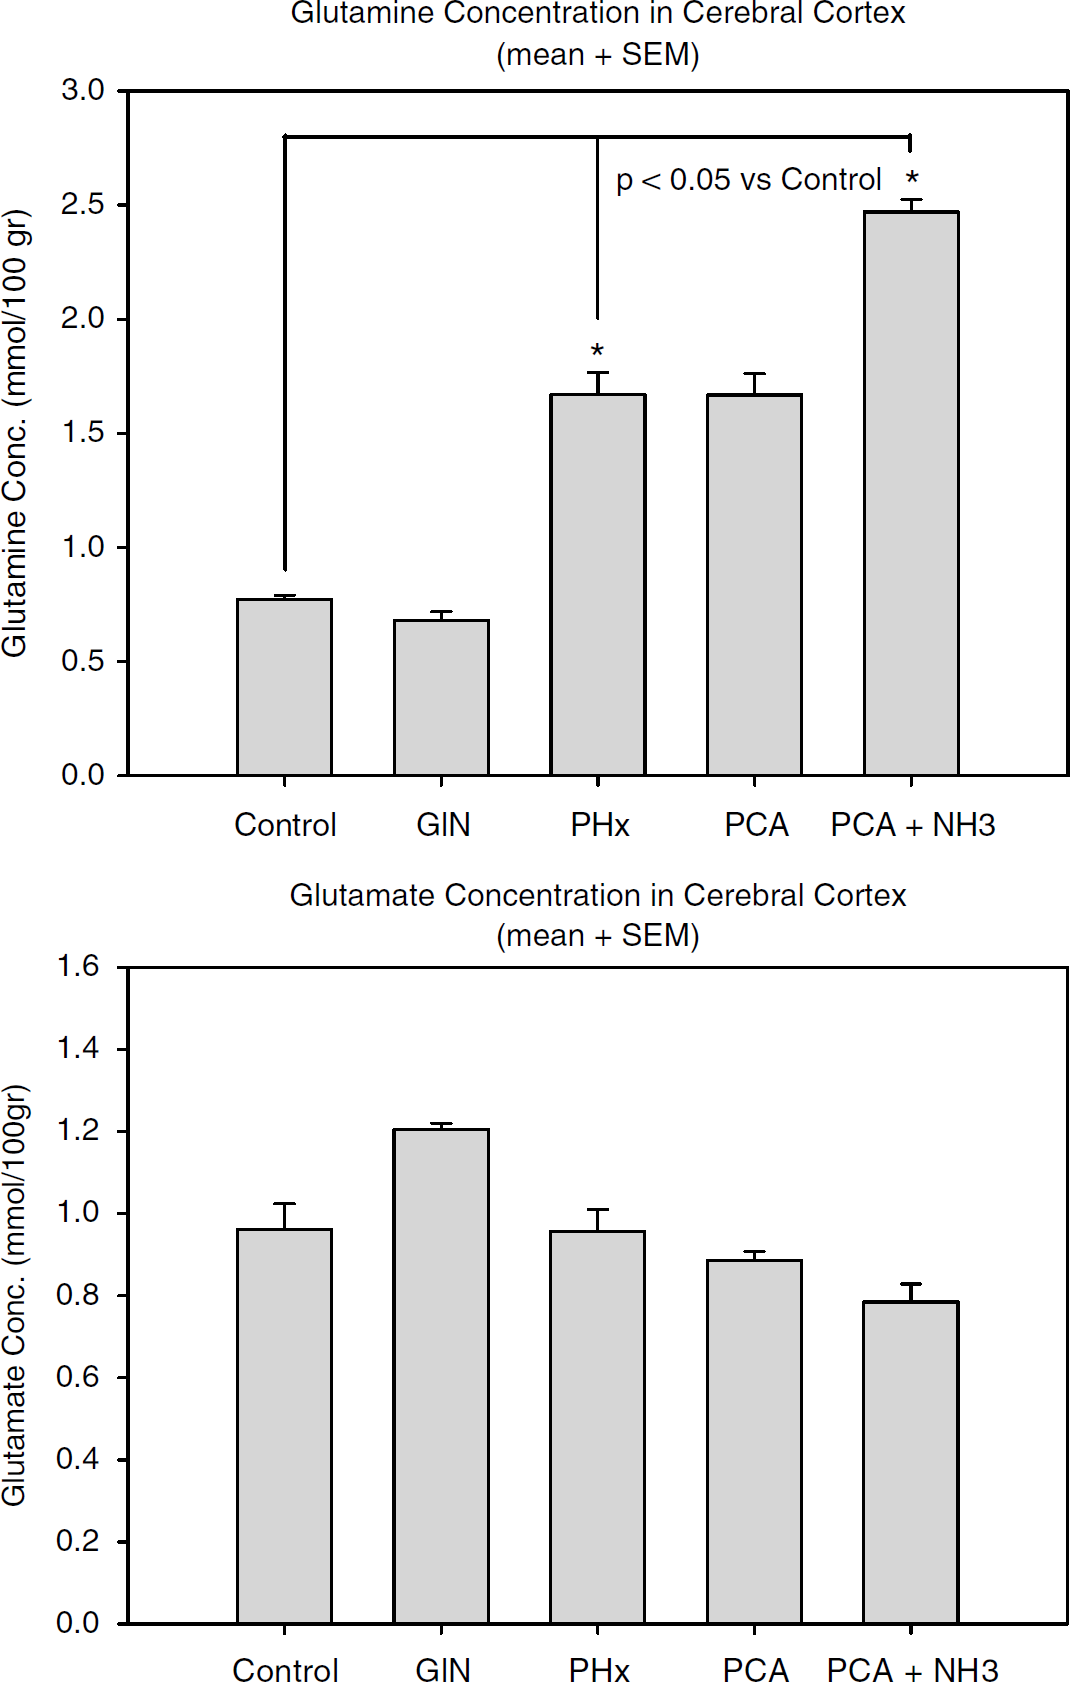
Graph showing glutamine and glutamate content (mmol/100 g) measured in cerebral cortex homogenate, presented as mean ± s.e.m. The glutamine content differed significantly between the following groups (ANOVA): control versus PCA + NH3 and control versus PH×90 (P<0.05). Comparison of PCA with PCA + NH3 and PCA with control also showed significant differences (t-test, P < 0.001).
MAP, CBF, ICP, and Water Content in the Brain
During the 60-min experimental period until the start of the autoregulation challenge, neither the GlN nor the PH×90 group differed from the control group in terms of CBF (= change in baseline LDF), ICP, or MAP (Figures 5 and 6). The PCA group showed no changes in CBF, ICP, or MAP during a 180-min 0.9% saline infusion (2mL/h). In the PCA + NH3 group, during the 180 mins of ammonia infusion, CBF values increased by almost 40% (P<0.05), ICP increased from 1.6 to 2.8 mmHg (P<0.05), and MAP decreased from 119 to 103 mmHg (P<0.05) (Figure 6). Analysis (ANOVA) showed that forebrain water content was similar in all groups, whereas water content in the cerebellum in the PCA + NH3 group was significantly increased in comparison to all other groups (P<0.001). Water content in the brainstem differed significantly between the control group and the following groups: control versus PH×90, P = 0.026; control versus PCA, P = 0.041; control versus PCA + NH3, P = 0.002.
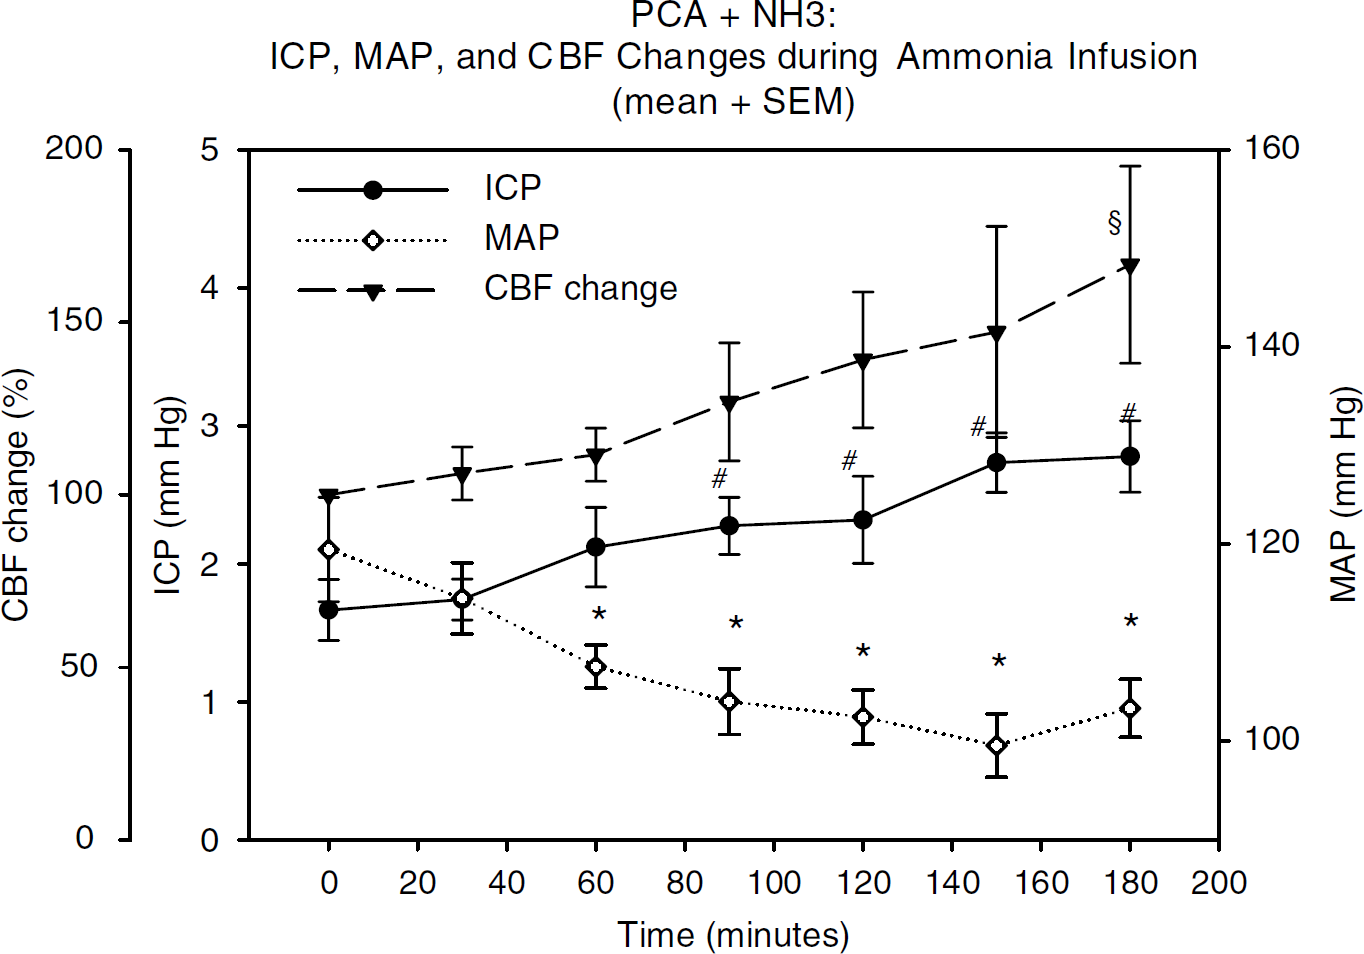
CBF, ICR and MAP in the PCA + NH3 group: time course showing the relative percentage changes in CBF as well as changes in ICP and MAP during 180 mins of ammonia infusion (until autoregulation challenge); data are presented as group mean ± s.e.m. (repeated measurements (RM) one-way ANOVA). CBF: § = 180 mins versus 0 min (P<0.05); ICP: # = 180, 150, 120, and 90 mins versus 0 mins (P< 0.05); MAP: * = 180, 150, 120, 90, and 60 mins versus 0 min (P<0.05).
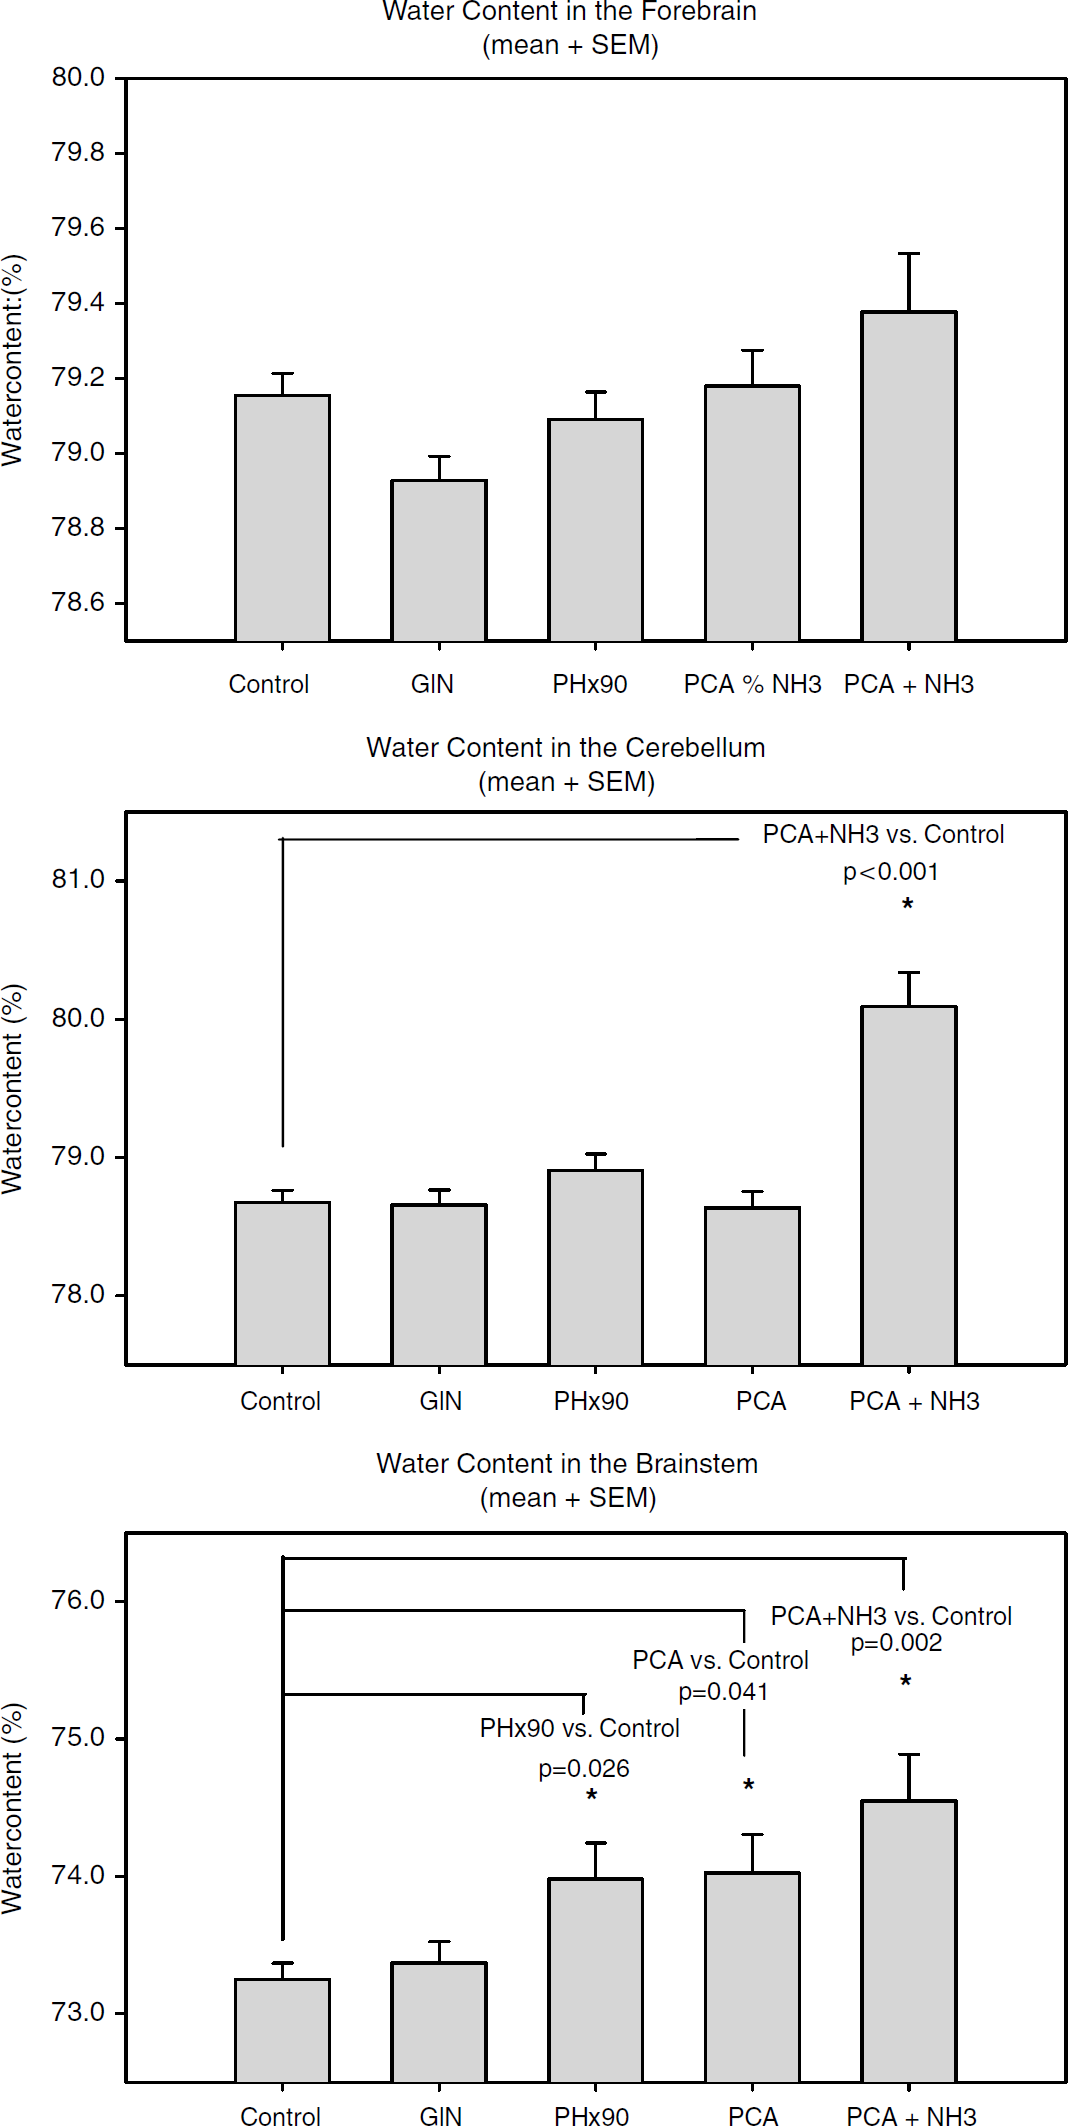
Graphical presentation of water content (%) in different brain areas measured by the wet-to-dry method; data are presented as mean ± s.e.m. Water content in the forebrain did not differ significantly between the groups: control versus PCA + NH3 (P = 0.140 (NS)). Cerebellar water content differed significantly (ANOVA): PCA + NH3 versus all other groups (P < 0.001). Brainstem water content showed several differences between groups (ANOVA): control versus PH×90 (P = 0.026), control versus PCA (P = 0.041), control versus PCA + NH3(P = 0.002).
Discussion
In this study, we found that the AI was significantly increased in rats with GlN-induced ALF and in rats with a 90% hepatectomy, which suggests that impairment of CBF autoregulation relies on loss of functional liver mass. Conversely, shunting of blood from the portal vein to the systemic circulation did not alter CBF autoregulation. Moreover, hyperammonemia and a high cerebral glutamine level had no effect on the AI. Nor did brain edema or high CBF and ICP impair CBF autoregulation. Another interesting finding was that hyperammonemia in combination with PCA was associated with a right-shifted LL of CBF autoregulation, whereas the LL was normal in rats exposed to PCA only. This suggests that hyperammonemia is associated with a right-shift of the LL in PCA rats. The present data indicate that this may be because of vasodilatation.
Our findings illustrate that an autoregulatory curve consists of two elements: the AI and the lower and upper limits of the curve. In clinical terms, ‘intact autoregulation’ is synonymous with an autoregulation curve with a horizontal plateau phase. ‘Absent autoregulation’ in the traditional sense thus means that the autoregulation curve has turned into a straight, sloped line. This all-or-nothing phenomenon definition has largely remained undisputed, although Paulson et al (1989) did suggest that the autoregulatory plateau may be slightly sloped under normal conditions also. More recently, Jones et al (2002), (2003) have, on the basis of rodent experiments, proposed the existence of three forms of cerebral autoregulatory curve: the classic form with a (sloped) plateau and upper/lower limit, a bell-shaped form, and a sloped line without a defined upper or lower limit.
Theoretically, impairment of CBF autoregulation may reflect either a state of vasoparalysis or maximal arteriolar vasodilatation (Larsen et al, 1996). Interestingly, findings by Durham et al (1995) point in the direction of a vasodilatation, as their experiments showed impaired vasoreactivity to hypercapnia whereas vasoconstriction to hypocapnia was intact. Animal experiments could reproduce these findings through the induction of hyperammonemia and thus increased intracerebral glutamine (Hirata et al, 1996; Okada et al, 2000). Hirata et al (1995) concluded that ammonia exerts selective actions on CO2 reactivity, whereas CBF autoregulation and hypoxic vasodilatation remains intact. The findings of abolished hypotensive vasodilatation and abolished hypercapnic vasodilatation but intact hypocapnic vasoconstriction were found in both ALF patients and thioacetamide-poisoned rats and was termed ‘dissociated vasoparalysis'. This was interpreted as being caused by gradual vasodilatation (Larsen et al, 1996).
In our measurements, we used laser Doppler, which is a validated and reliable method of measuring CBF changes continuously for up to several hours (Tonnesen et al, 2005). However, laser Doppler cannot provide absolute CBF measurements. This renders a distinction between vasoparalysis and vasodilatation impossible. The GlN and PH×90 models exhibited varying degrees of impaired vascular reactivity, reflected by the steeply sloped autoregulatory plateaus. The differences in AI thus show a gradual impairment of autoregulation.
The PCA + NH3 group showed a significant increase in CBF despite a simultaneous decrease in MAP (Figure 5), which proves that the increase in CBF was because of vasodilatation. In theory, vasodilatation may ultimately abolish autoregulation; consequently, one might expect impaired autoregulation in the PCA + NH3 group but, in fact, CBF autoregulation was intact in this group. Thus, the interesting theoretical question whether autoregulation impairment is because of vasoparalysis or vasodilatation remains, essentially, unanswered.
In our study, we chose to determine the LL because of its clinical relevance in ALF: low systemic vascular resistance and a compensatory high cardiac output are typically found in ALF. Hypovolemia combined with an inadequate cardiac output renders ALF patients vulnerable to arterial hypotension, which, in the case of impaired cerebral autoregulation, leads to a substantial reduction in CBF. Indeed, hypovolemia and hypotension commonly occur during the clinical course of ALF and during liver transplantation (Reich et al, 2003).
The autoregulation curves of the GlN and PH×90 models display a steep slope with an AI of 0.68 and 0.77, respectively. In this situation, the LL loses its physiologic significance because CBF is dependent on CPP, even at values above the LL. Hence, it becomes less important that LL was in fact still detectable in three out of eight animals in the PH×90 group and four out of eight animals in the GlN group, as the high AI in both groups shows a significant impairment of autoregulation over the entire physiologic blood pressure range. In conclusion, the traditional attempt to group CBF curves into either ‘intact’ or ‘lost’ autoregulation often oversimplifies matters: horizontal plateau phases have often been presupposed and LL calculations were based on this assumption. However, a sloped perfusion curve will influence LL calculations. In addition, many clinical autoregulation studies, where repeated CBF measurements can be difficult to obtain, have to rely on two measuring points. Interpreting such curves as either ‘intact’ or ‘lost’ autoregulation seems problematic, as an LL may well be detectable, even in a sloped perfusion curve. Hence, it may be more appropriate to use the term ‘impairment of autoregulation’ and state the AI value as well as the values for LL and upper limit (if obtainable), which would provide more accurate information.
Autoregulation studies were performed by hemorrhagic challenge, a well-validated method for the study of autoregulation in animals (Jones et al, 2002, 2003; Domoki et al, 2005; Tonnesen et al, 2005; Pedersen et al, 2007). A reduction in hemoglobin and thus in hematocrit will influence CBF (Paulson et al, 1973; Henriksen et al, 1981) and cause an increase, but hemorrhagic hypotension was performed through the withdrawal of whole blood. Significant alterations of hematocrit are unlikely, given the short time span of bleeding. If fluid substitution were to take place to a significant extent, fluid would be recruited from the extra-and intravascular compartments, but this would not per se affect CBF autoregulation. Conversely, CBF would increase, causing a reduction in AI, thereby counteracting a possible impairment of CBF autoregulation.
Another issue concerning hemorrhagic hypotension is the sympathetic nervous tone; during hemorrhagic hypotension, the sympathetic tone increases, causing a constriction of the larger cerebral arteries (Edvinsson et al, 1985) and a simultaneous vasodilatation of the arterioles. This would either counteract findings of impaired autoregulation or just cause a right-shift of the LL, which would be expected to affect all the groups equally.
Coagulopathy is a key indicator of hepatocellular failure and, consequently, INR and plasma bilirubin are widely used biochemical markers of the degree of liver failure (Blei, 2005). The INR and bilirubin in the GlN and the PH×90 groups differed significantly from the other groups (Table 1), indicating a decrease in the amount of functional liver tissue. Studies examining liver function and CBF autoregulation in ALF patients showed an association between loss of cerebral autoregulation and loss of liver mass, and, conversely, the reestablishment of autoregulation when INR values return to near-normal values (Strauss et al, 1997). Elevated plasma concentration of alanine aminotransferase without accompanying alterations in INR or bilirubin, as seen in the PCA and the PCA + NH3 groups (Table 1), seems unrelated to loss of autoregulation, in accordance with the literature (Strauss et al, 2000).
The elevated cortical glutamine levels found in the PCA + NH3 group (Table 1) are most likely because of a significant ammonia uptake and detoxification in the brain, although high ammonia may also be attributable to proteolysis (Strauss et al, 2001). Plasma ammonia concentration in the PCA + NH3 group was 42-fold higher than in the control group, and plasma ammonia levels were also significantly higher in the PCA group and the PH×90 group compared with the control group, whereas plasma ammonia in the GlN group did not differ from the control group. Because the PCA + NH3 group had an intact autoregulation slope but an elevated LL despite considerably elevated ammonia concentration, it appears high ammonia per se does not contribute significantly to the loss of CBF autoregulation, a finding that supports a previous study (Dethloff et al, 2005).
Both in vivo and in vitro models show increased brain concentrations of glutamine during exposure to high ammonia concentrations (Zwingmann and Butterworth, 2005). In fact, increased glutamine concentration seems necessary for the development of brain edema and has also been speculated to contribute to CBF changes in ALF (Master et al, 1999; Blei, 2001). The PCA + NH3 group exhibits high cortical glutamine concentration and has a horizontal CBF autoregulation slope. This finding is in accordance with a previous study where an intact reactive dilatation in response to arterial hypotension, despite high cortical glutamine levels, was reported (Takahashi et al, 1992).
The link between brain edema and disturbed autoregulation in ALF is unclear. In our ALF models, the GlN and PH×90 groups, both ICP and CBF remained stable until the controlled hemorrhage was initiated. Forebrain water content was similar in all groups whereas cerebellar water content was higher in the PCA + NH3 group compared with the control group. Brainstem water content was also higher in the PH×90, PCA, and PCA + NH3 groups compared with the control group (Figure 5), in agreement with previous reports on ALF (Ede et al, 1987; Gove et al, 1997). In the PCA + NH3 group, CBF and TCP increased in accordance with the observations made by others (Master et al, 1999; Larsen et al, 2001) but we failed to show cortical edema in the PCA + NH3 group after 180 mins of ammonia infusion, although plasma ammonia concentrations were similar to those reported by other groups (Cordoba et al, 1999). This difference may be caused by strain differences, and continuation of the ammonia infusion for up to 6 h showed a threefold increase in ICP in most animals but also autoregulation remained intact here (data not shown).
We cannot, based on our different experiments, determine the exact pathophysiological mechanism responsible for the loss of CBF autoregulation in ALF Experiments using cranial windows with cytokine superfusion (Farkas et al, 2006), as well as experiments with lipopolysaccharide stimulation (Brian et al, 1995), showed arteriolar vasodilatation. The failing liver in ALF exhibits hepatocellular necrosis and often also a degree of regeneration; both processes involve the cytokine system (Simpson, 1999). In fact, plasma cytokine levels are increased in ALF patients (Jalan et al, 2002, 2004). It is therefore tempting to speculate that cytokines might, at least in part, be responsible for impairment of CBF autoregulation. None of our findings conflict with this cytokine hypothesis; however, further studies should clarify this promising connection and should concentrate on cytokines as potentially important regulators of CBF autoregulation.
In conclusion, on the basis of four different animal models, we wanted to clarify the key aspects responsible for the impairment of cerebral autoregulation in ALF We found that loss of autoregulation in ALF is not related to the presence of brain edema, nor is it caused by high ICP. Elevated arterial and cerebral concentrations of both ammonia and glutamine are also not associated with impaired CBF autoregulation. Rather, loss of liver mass, as induced by GlN poisoning as well as 90% hepatectomy, is associated with a loss of CBF autoregulation and results in a steeply sloped autoregulation curve, impairing control of CBF.
Footnotes
Acknowledgements
We thank Bjørg Krogh and Mie Poulsen for their excellent technical assistance.