
Abstract
In the awake brain, the global metabolic rate of oxygen consumption is largely constant, while variations exist between regions dependent on the ongoing activity. This suggests that control mechanisms related to activity, that is, neuronal signaling, may redistribute metabolism in favor of active networks. This study examined the influence of γ-aminobutyric acid (GABA) tone on local increases in cerebellar metabolic rate of oxygen (CeMRO2) evoked by stimulation of the excitatory, glutamatergic climbing fiber-Purkinje cell synapse in rat cerebellum. In this network, the postsynaptic depolarization produced by synaptic excitation is preserved despite variations in GABAergic tone. Climbing fiber stimulation induced frequency-dependent increases in synaptic activity and CeMRO2 under control conditions. Topical application of the GABAA receptor agonist muscimol blocked the increase in CeMRO2 evoked by synaptic excitation concomitant with attenuation of cerebellar blood flow (CeBF) responses. The effect was reversed by the GABAA receptor antagonist bicuculline, which also reversed the effect of muscimol on synaptic activity and CeBF. Climbing fiber stimulation during bicuculline application alone produced a delayed undershoot in CeBF concomitant with a prolonged rise in CeMRO2. The findings are consistent with the hypothesis that activity-dependent rises in CeBF and CeMRO2 are controlled by a common feed-forward pathway and provide evidence for modification of cerebral blood flow and CMRO2 by GABA.
Introduction
In the normal brain, neuronal activity, energy metabolism, and blood flow are closely coupled. The cerebral gray matter is among the highest oxygen consuming tissues in the body, and oxidation of glucose provides almost all the energy needed by neurons to support brain activity (Clarke and Sokoloff, 1994). The supply of glucose and oxygen during activation is ensured by the neurovascular coupling, which is supported by mechanisms triggered by synaptic excitation (Lauritzen, 2005). These local changes in vascular and metabolic function are the basis for the signals used in functional neuroimaging to map brain function noninvasively (Raichle and Mintun, 2006).
During normal operation, global cerebral blood flow (CBF) and oxygen consumption (CMRO2) remain largely constant in awake humans (Sokoloff et al, 1955), while there are widespread local variations in blood flow and oxygen consumption that relate to fluctuations in nerve cell activity (Lassen et al, 1978; Raichle and Mintun, 2006). The magnitude of these changes in oxygen consumption depend on stimulation duration, frequency, paradigm, and brain region (Vafaee et al, 1999; Vafaee and Gjedde, 2004), which suggests that nerve cell activity can be accompanied by a variable degree of increased oxidative metabolism. Our understanding of the mechanisms that control and modulate the degree of oxidative metabolism in functional nerve circuits is limited as is our knowledge on how such changes relate to concomitant CBF changes.
Recent calculations suggest that signaling among neurons accounts for about 95% of brain ATP consumption with most of the energy being used to fuel the ATP-requiring ion pumps (Erecinska and Silver, 1989; Attwell and Laughlin, 2001). Hence, handling of glutamate and its effects on postsynaptic cells are key factors in the control of the brain's energy consumption and supply. Excitatory postsynaptic activation is thought to be a main determinant of activity-related CBF changes and of increases in glucose and oxygen consumption (Schwartz et al, 1979; Offenhauser et al, 2005). However, the mechanisms that mediate the coupling between neuronal activity and CBF on the one hand and neuronal activity and metabolism on the other and their possible interdependency are incompletely understood. The prevailing view is that glutamatergic neurotransmission is a common trigger for neurovascular and neurometabolic coupling, and modification of glutamatergic transmission at postsynaptic cellular elements influences both hemodynamic and metabolic responses to brain activation (Erecinska and Silver, 1989; Attwell and Laughlin, 2001; Lauritzen, 2005). Synaptic inhibition in terms of γ-aminobutyric acid (GABA)ergic neurotransmission, that is, release and reuptake, accounts for approximately 15% of brain energy consumption (Patel et al, 2005; Hyder et al, 2006), but it is unknown to what extent changes in GABAergic tone influence oxygen consumption evoked by excitation. This study explored the effect of variations of GABAergic tone on local oxygen consumption evoked by synaptic excitation, testing the hypothesis that variations in GABAergic tone modulate activity-dependent rises in oxygen consumption triggered by excitation. We reasoned that if the rises of oxygen consumption evoked by synaptic excitation were independent of the ongoing GABAergic tone, then it would be possible to interpret rises in oxygen consumption as the response to a summation of neuronal activities. Conversely, if the evoked rises in oxygen consumption do depend on GABAergic tone, then it suggests that the oxidative metabolic response is sensitive to the context in which excitation takes place, implying a complex relationship between activity and metabolic response.
Materials and methods
This study was performed in full compliance with the guidelines set forth in the European Council's Convention for the Protection of Vertebrate Animals Used for Experimental and other Scientific Purposes and was approved by the Danish National Ethics Committee.
Animal Preparation
Experiments were performed in 15 male Wistar rats (250 to 350g). The animals were anesthetized with isoflurane (5.0% during induction, 2% during surgery, and 1.8% during the experiment). The trachea was cannulated for mechanical ventilation (30% O2/70% N2O during surgery; oxygen-enriched air thereafter). Catheters were placed into the left femoral artery and vein and perfused with physiological saline. Continuous monitoring of arterial blood pressure and hourly blood samples of arterial pH, pO2, and pCO2 assured maintenance of basic physiological parameters. The head was fixed in a stereotaxic frame, and an open cranial window preparation over the vermis region was made as described previously (Caesar et al, 2003). At the end of the experiment, rats were killed by intravenous injection of air. The experimental setup is shown in Figure 1.
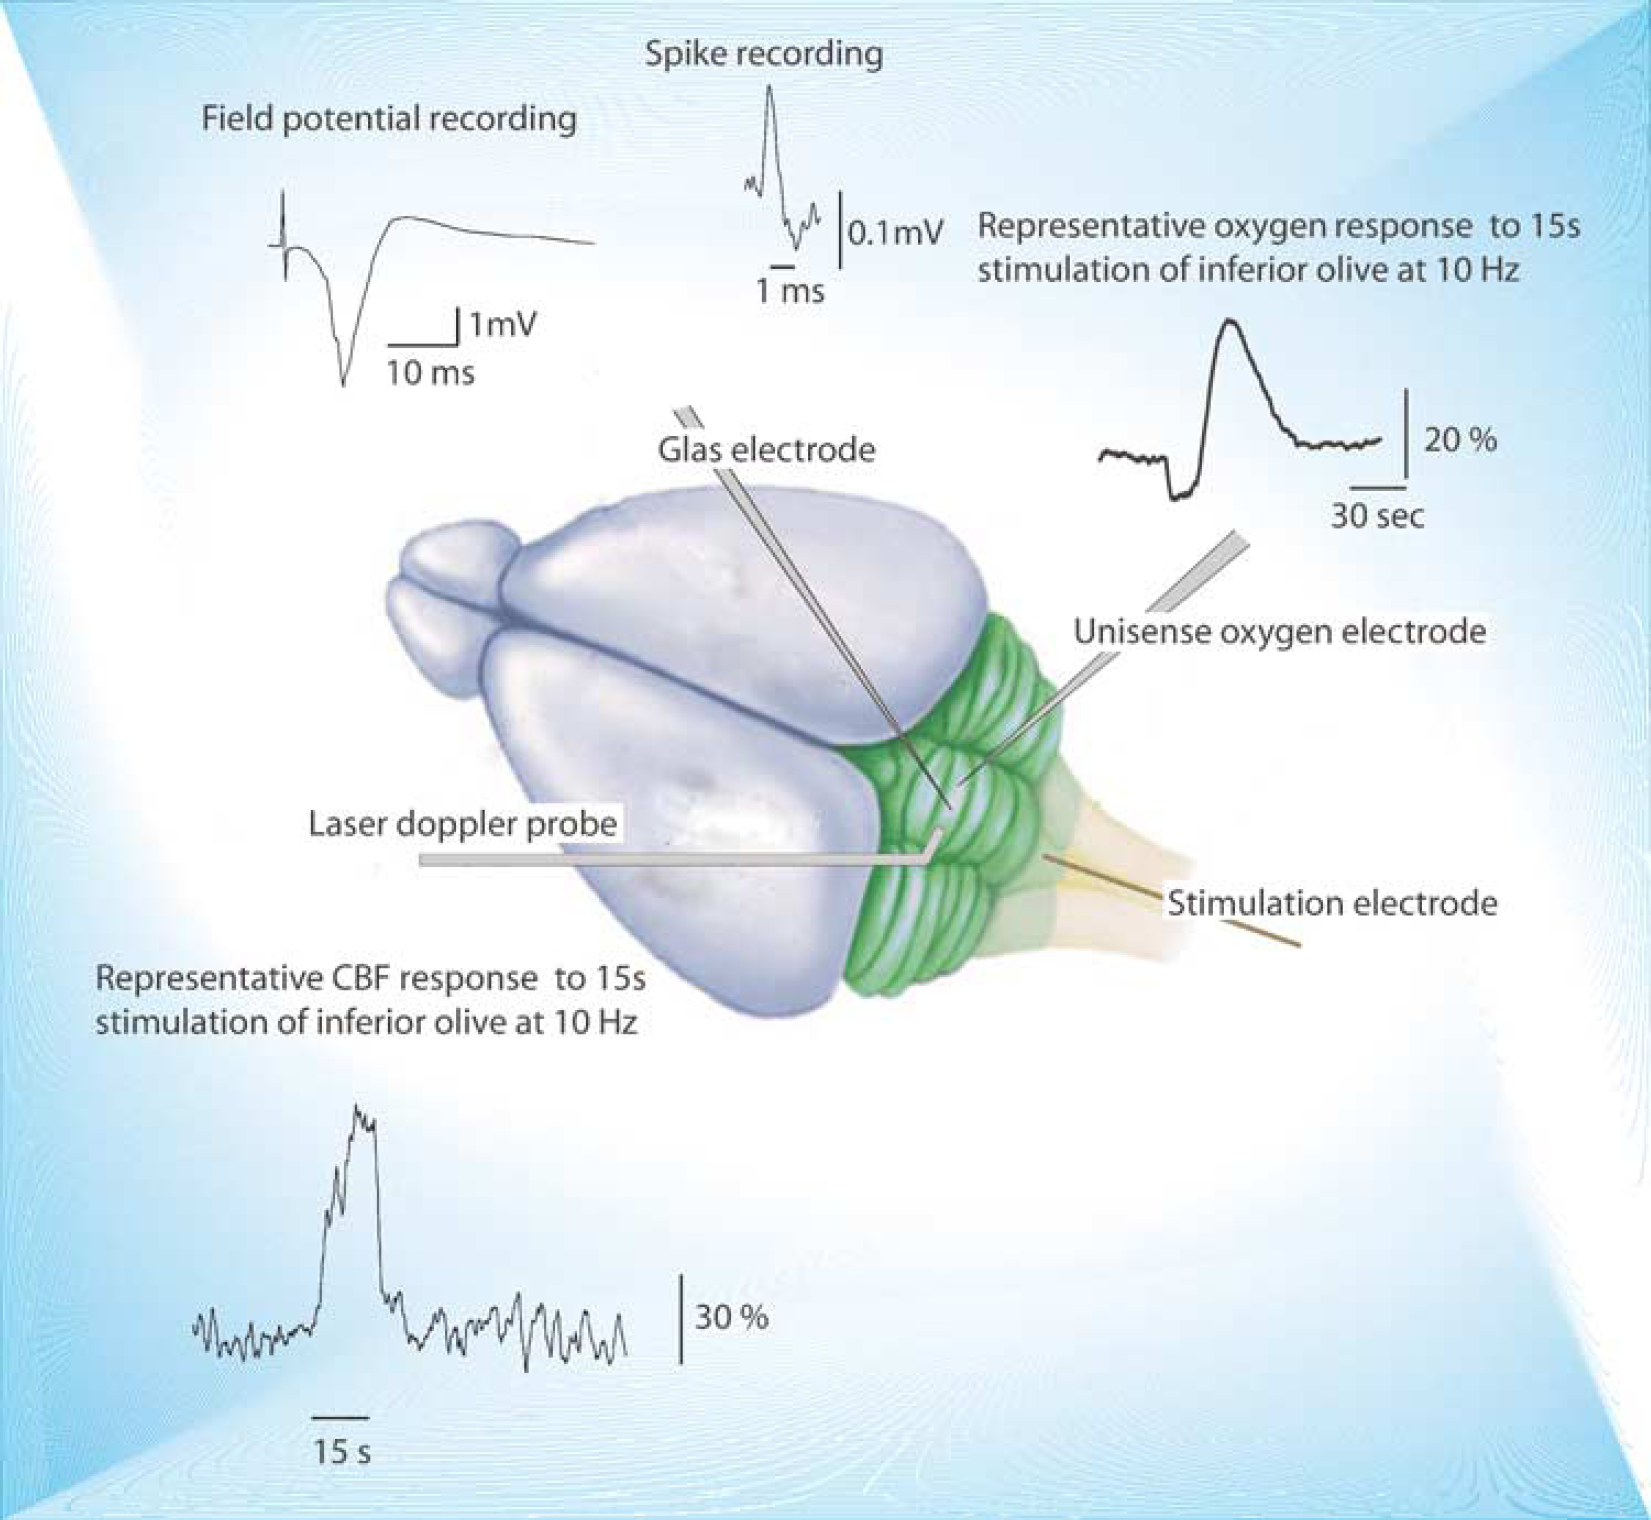
Recording of spikes, local field potentials (LFP), tpO2, and CBF in the cerebellar cortex. Schematic drawing of experimental setup showing placement of laser-Doppler flowmetry (LDF) probe, and stimulating and recording electrodes. A monopolar electrode placed stereotaxically in the caudal part of the inferior olive stimulated climbing fibers that give a monosynaptic excitatory input to Purkinje cells. Positioning was optimized by means of the LFP response amplitude in the cerebellar hemisphere to continuous low-frequency stimulation (0.25 Hz). LFP and single unit spike activity were recorded by a glass microelectrode, whereas tpO2 was recorded by another microelectrode at the level of the proximal dendrites/Purkinje cell bodies. Purkinje cells were located at a depth of 200 to 500 μm and identified by their ability to fire both simple and complex spikes spontaneously or by the production of a complex spike at 5 to 8 ms after electrical stimulation of the inferior olive. CBF was recorded by LDF using a probe that was located 0.3 to 0.5 mm above the pial surface with a separation of 250 μm between the transmitting and receiving fibers, allowing recording of CBF changes down to a depth of 1.0 mm (Fabricius et al, 1997).
Electrophysiological Recordings
We used single-barreled glass microelectrodes filled with 2 mol/L saline (impedance, 2 to 3 MΩ; tip, 2 μm) (Caesar et al, 2003). Single unit activity (spikes) and extracellular local field potentials (LFP) of Purkinje cells were recorded with a single glass microelectrode at a depth of 300 to 600 μm in the cerebellar cortex of vermis segment 5 or 6. An Ag/AgCl ground electrode was placed in the neck muscle. The preamplified (× 10) signal was A/D converted, amplified and filtered (spikes: 300 to 2,400 Hz bandwidth; LFP: 1 to 1,000 Hz bandwidth), and digitally sampled using the 1401 plus interface (Cambridge Electronic Design, Cambridge, UK) connected to a PC running the Spike 2.5 software (Cambridge Electronic Design). Digital sampling rates were at 20 kHz for spikes and 5 kHz for LFP.
Climbing Fiber Stimulation
A coated, bipolar stainless-steel electrode (SNEX 200, RMI, Woodland Hills, CA, USA, 0.25-mm contact separation) was stereotaxically lowered into the caudal part of the inferior olive as described previously (Caesar et al, 2003). This secured an exclusive stimulation of climbing fibers (CFs), which was evident from the change of simple to complex spikes as opposed to an increase in the rate of simple spikes generated if mossy fibers were innervated along with CFs (data not shown). Stimulation of CFs resulted in a local field potential with a classical laminar profile and potential reversal (Mathiesen et al, 1998). Positioning was optimized by means of the maximal response of LFP in the cerebellar vermis region to continuous low-frequency stimulation (0.5 Hz). Pulses of 200 μs constant current with an intensity of 0.15 mA (ISO-flex, AMPI, Israel) were used at 10Hz for 15 sees.
Drug Application
Drugs were applied to the vermis by topical superfusion. We used muscimol to activate GABAA receptors and bicuculline to block GABAA receptors. Each drug was dissolved in artificial CSF at a concentration of 0.2 mmol/L (Caesar et al, 2003).
Cerebellar Cortical Blood Flow Measurement
Cerebellar cortical blood flow was recorded continuously using an LDF probe at a fixed position ˜0.3 mm above the pial surface in a region devoid of large vessels (780 nm wavelength, 250 μm fiber separation; PeriMed, Järfälla, Sweden). The probe, measuring CeBF changes down to a depth of 1,000 μm, was placed as close as possible to the micro- and oxygen electrode. The LDF signal was smoothed with a time constant of 0.2 sees (PeriFlux 4001 Master, PeriMed), sampled at 10 Hz, A/D converted and digitally recorded using Spike 2.5 software (Cambridge Electronic Design).
Tissue pO2 Measurements
The oxygen electrode was placed in the same lobe as the electrode for electrophysiological recordings and the laser-Doppler probe. Local tissue oxygen partial pressure (tpO2) was recorded with a modified Clark-type Polarographie oxygen microelectrode (OX-10, Unisense A/S, Aarhus, Denmark). The small tip size (3 to 5 μm in this study) assured reliable tpO2 measurements and its built-in guard cathode removed all oxygen from the electrolyte reservoir. Calibration of each electrode was performed in air-saturated and oxygen-free saline (0.9% at 37°C) before and after each experiment with reproducible oxygen measurements. The oxygen electrodes were connected to a high-impedance pico-ampermeter (PA 2000, Unisense A/S) sensing the currents of the oxygen electrodes. Signals were A/D converted and recorded at 100 Hz (power 1401 and spike 2.5 (Cambridge Electronic Design)). Offline filtering using a low-pass filter of 0.3 Hz was used to remove noise induced by heartbeat and mechanical ventilation.
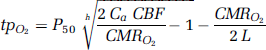
Calculation of CMRO2
To evaluate the effect of stimulation on spontaneous tpO2 and CBF, the traces were divided into 1 sec time periods, starting from 15 sees preceding stimulation and lasting for 60 sees after the end of stimulation. For each rat, the time CBF and tpO2 for each interval were averaged across rats (Figures 2C and 3C) and normalized to their respective baselines. Oxygen consumption (CMRO2) was calculated from CBF and tpO2 measurements as described by Gjedde (2005). The relationship between the three variables is
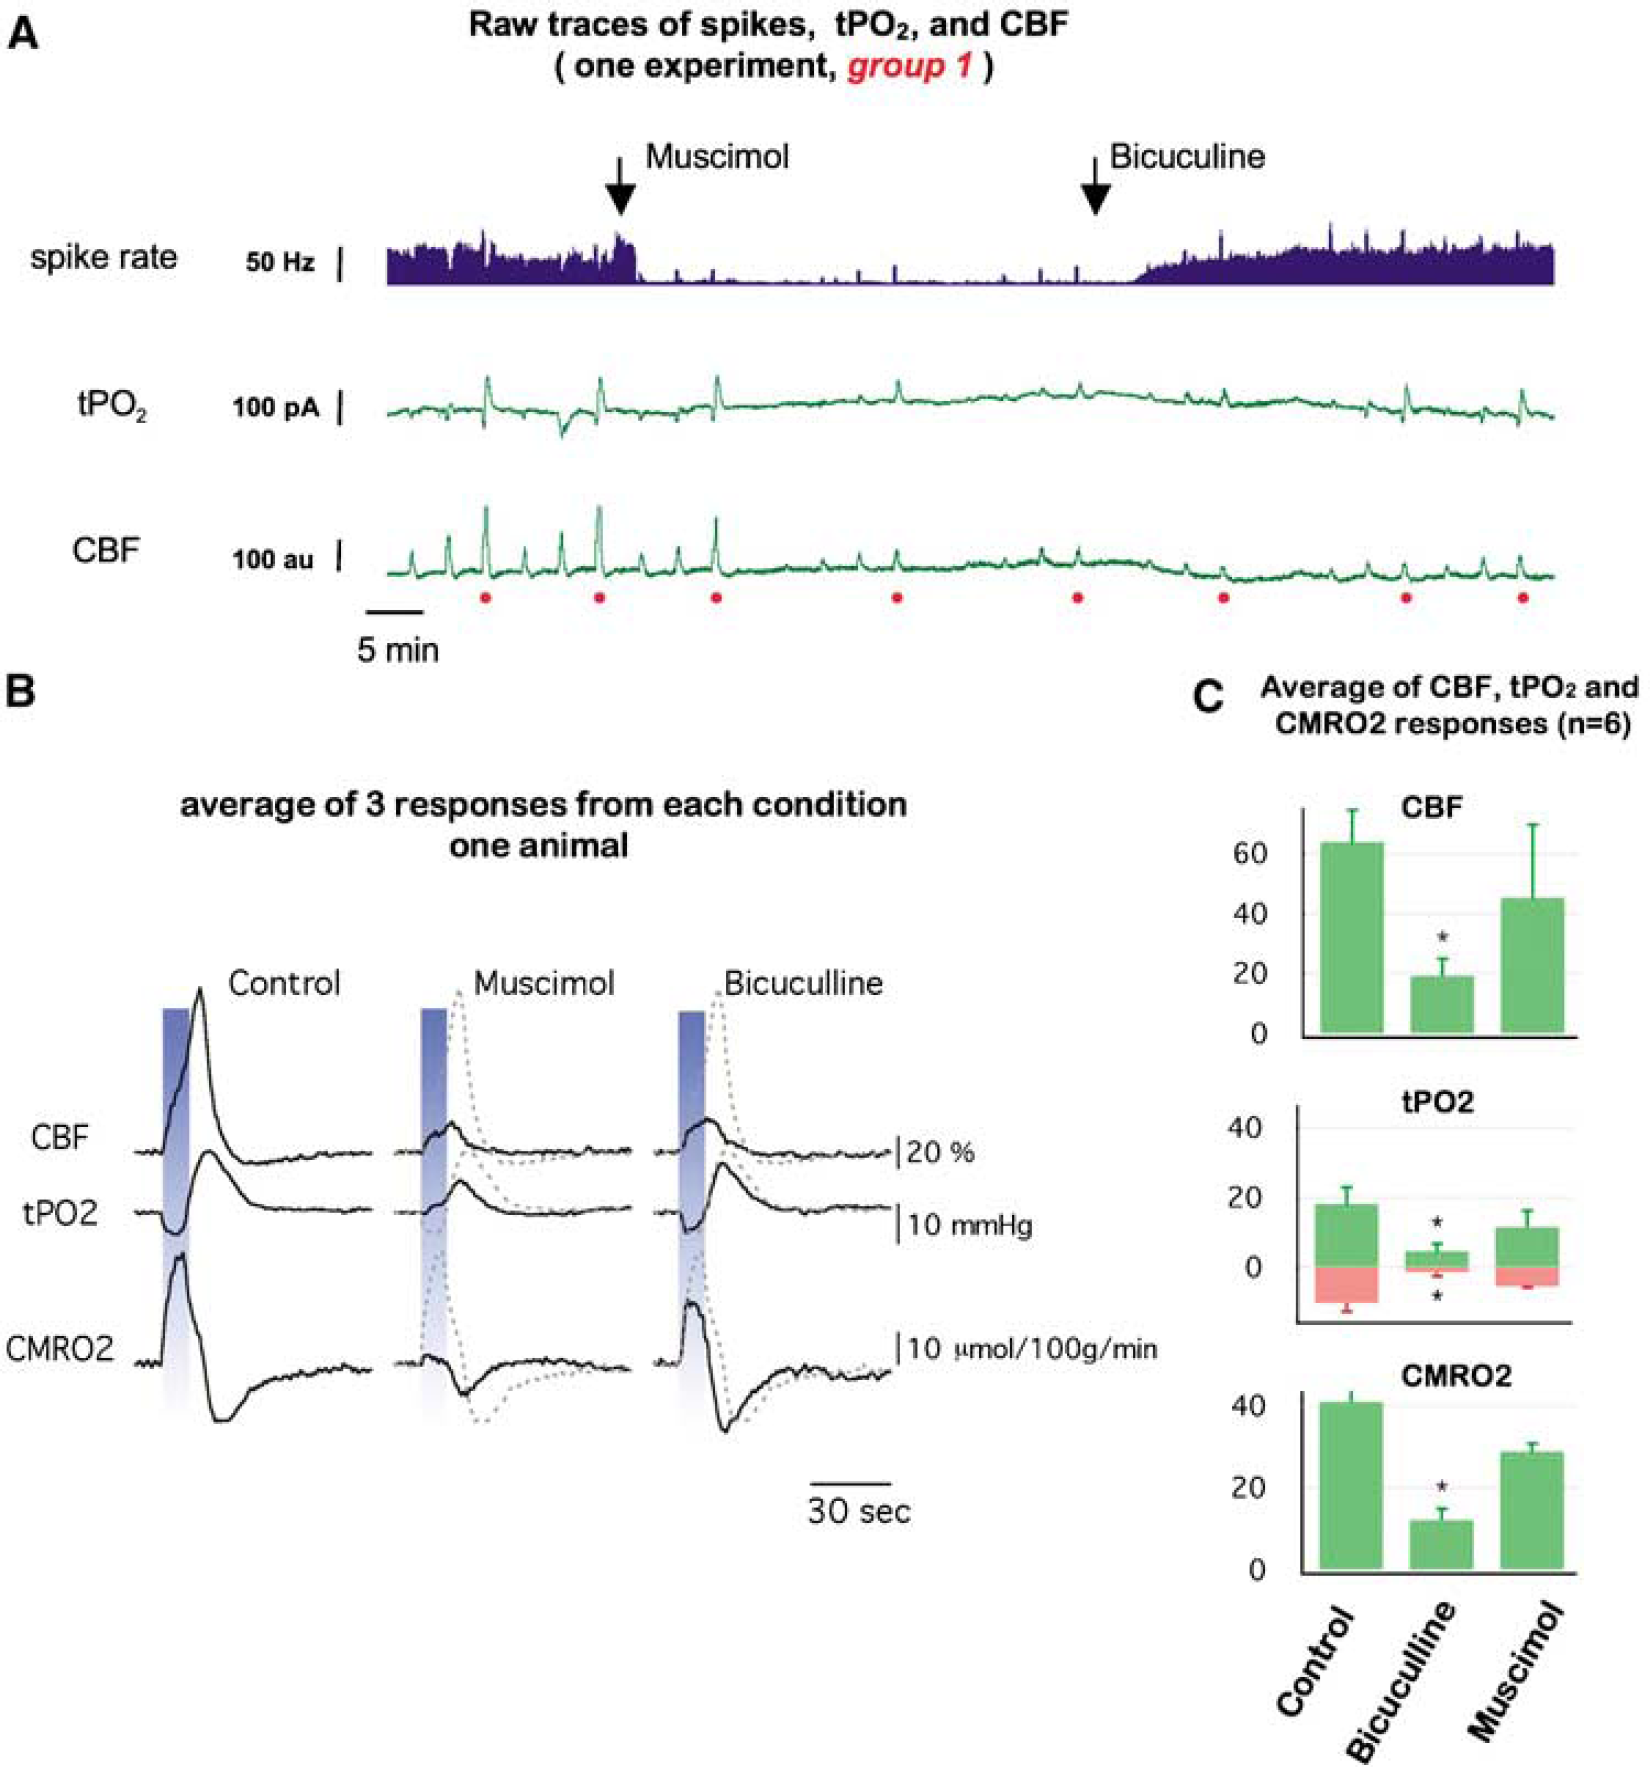
Evoked rises in oxygen consumption in the cerebellar cortex are reduced by increased GABAergic tone. (
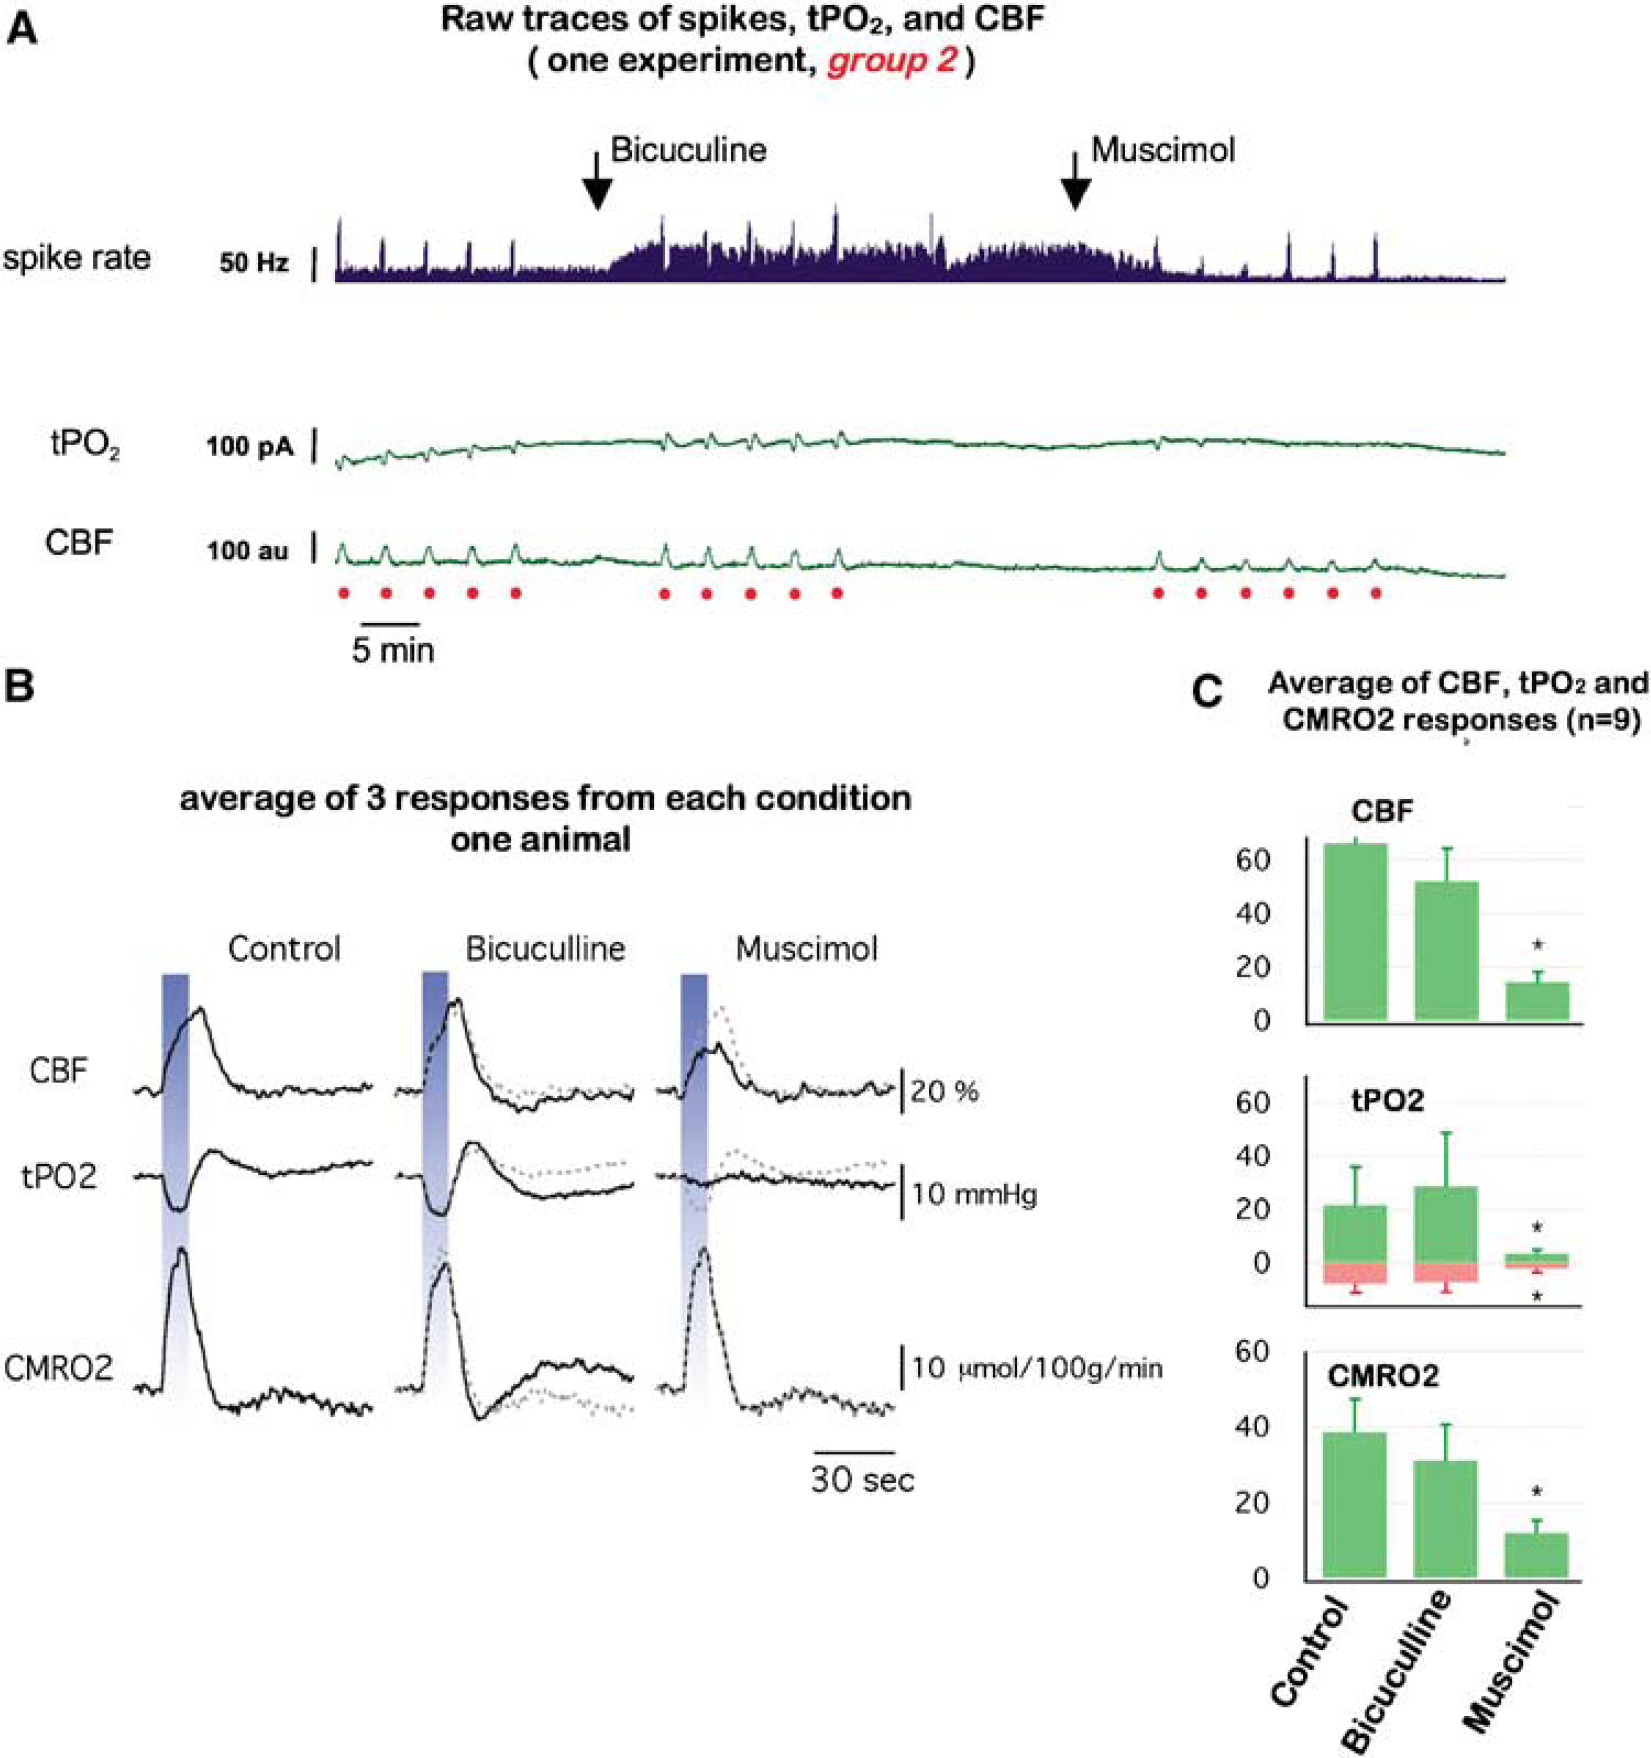
Evoked rises in oxygen consumption in the cerebellar cortex are unchanged by decreased GABAergic tone. (
Data Analysis and Statistics
Simultaneously recorded LFP, CeBF, and tpO2 signals were used for analysis. The magnitude of tpO2 response was estimated as the area under the curve above or below two standard deviations of baseline (calculated in mmHg) and the CeBF responses as percentage increase of baseline. Response magnitudes of the oxygen and CeBF signals were calculated for each animal from averaged responses of three stimulations per treatment condition. Calculations were performed by a custom-made analysis program based on Matlab 6.5 (MathWorks Inc., Natick, MA, USA). CeMRO2 was assessed as described above. Values are expressed as means ± s.e.m., with levels of significance determined by paired t-test (analysis of variance). Changes were considered statistically significant at P < 0.05.
Results
We induced changes in the level of synaptic inhibition by topical application of muscimol, a specific GABAA agonist (n = 6). The drug effect was validated by extracellular recordings of the spike rate of individual Purkinje cells. Muscimol reduced the spontaneous spike rate by 93.1% ± 2.7% of control levels within 30 sees of application (Figure 2A). The specificity of the drug was tested by coapplication of bicuculline, a GABAA receptor antagonist, which fully reversed the effect of muscimol on Purkinje cell spike activity. In all rats, the basal CeBF and tpO2 level remained constant during the entire period of muscimol application, which suggests that basal CeBF and tpO2 may be independent of Purkinje cell spiking.
Figure 2 A presents original data of Purkinje cell spike rate, tpO2, and CeBF in an experiment in which first muscimol and then bicuculline were applied. An average of the three oxygen and CeBF responses for each condition, together with the calculated CeMRO2 responses, is presented in Figure 2B. Figure 2C summarizes the statistics for the three conditions based on six rats. Evoked CeBF responses under control conditions amounted to 63.7% ± 9.5% of baseline (n = 6) (Figure 2C). In the presence of muscimol, the magnitude of evoked CeBF responses diminished over time to 19.2% ± 5.6% (P = 0.002, n = 6) as also described previously (Caesar et al, 2003). After application of bicuculline, CeBF responses gradually returned to control levels (Figure 2C). The evoked oxygen responses during control conditions were biphasic, consisting of an initial negative phase and a late positive phase (Figure 2B). During muscimol application, the activity-induced changes in the negative and positive phases of the tpO2 response declined by 72.4% ± 0.2% and 69.1% ± 0.1%, respectively (Figure 2C, P = 0.037, n = 6). The decrease in tpO2 suggested that oxygen was being consumed as CeBF remained constant at the same time, and with it, the delivery of oxygen to the cortex. This was confirmed by calculations of CeMRO2 showing that oxygen consumption increased from 137.4 ± 18.4 μmol per 100 g per min during baseline conditions to 192.3 ± 25.7 μmol per 100 g per min during CF stimulation (Figure 2B). During muscimol application, CeMRO2 increased to 154.7 ± 19.6 μmol per 100 g per min, representing a decline from control conditions by 68.4% ± 0.1% (P = 0.018, n = 6). This suggests that GABA reduces both evoked CeBF and CeMRO2 responses. Bicuculline reversed this effect increasing CeMRO2 to 178.2 ± 28.6 μmol per 100g per min. Superfusion with 0.2mmol/L bicuculline alone (n = 9) caused PC firing to increase to 147% ± 15% of control levels, while the change in tpO2 in response to stimulation became triphasic, exhibiting a late undershoot followed by a positive phase (Figure 3B, P = < 0.001, n = 9). This was partly explained by a corresponding undershoot in the CeBF response (Figure 3B) and partly by a delayed increase in CeMRO2 (Figure 3B).
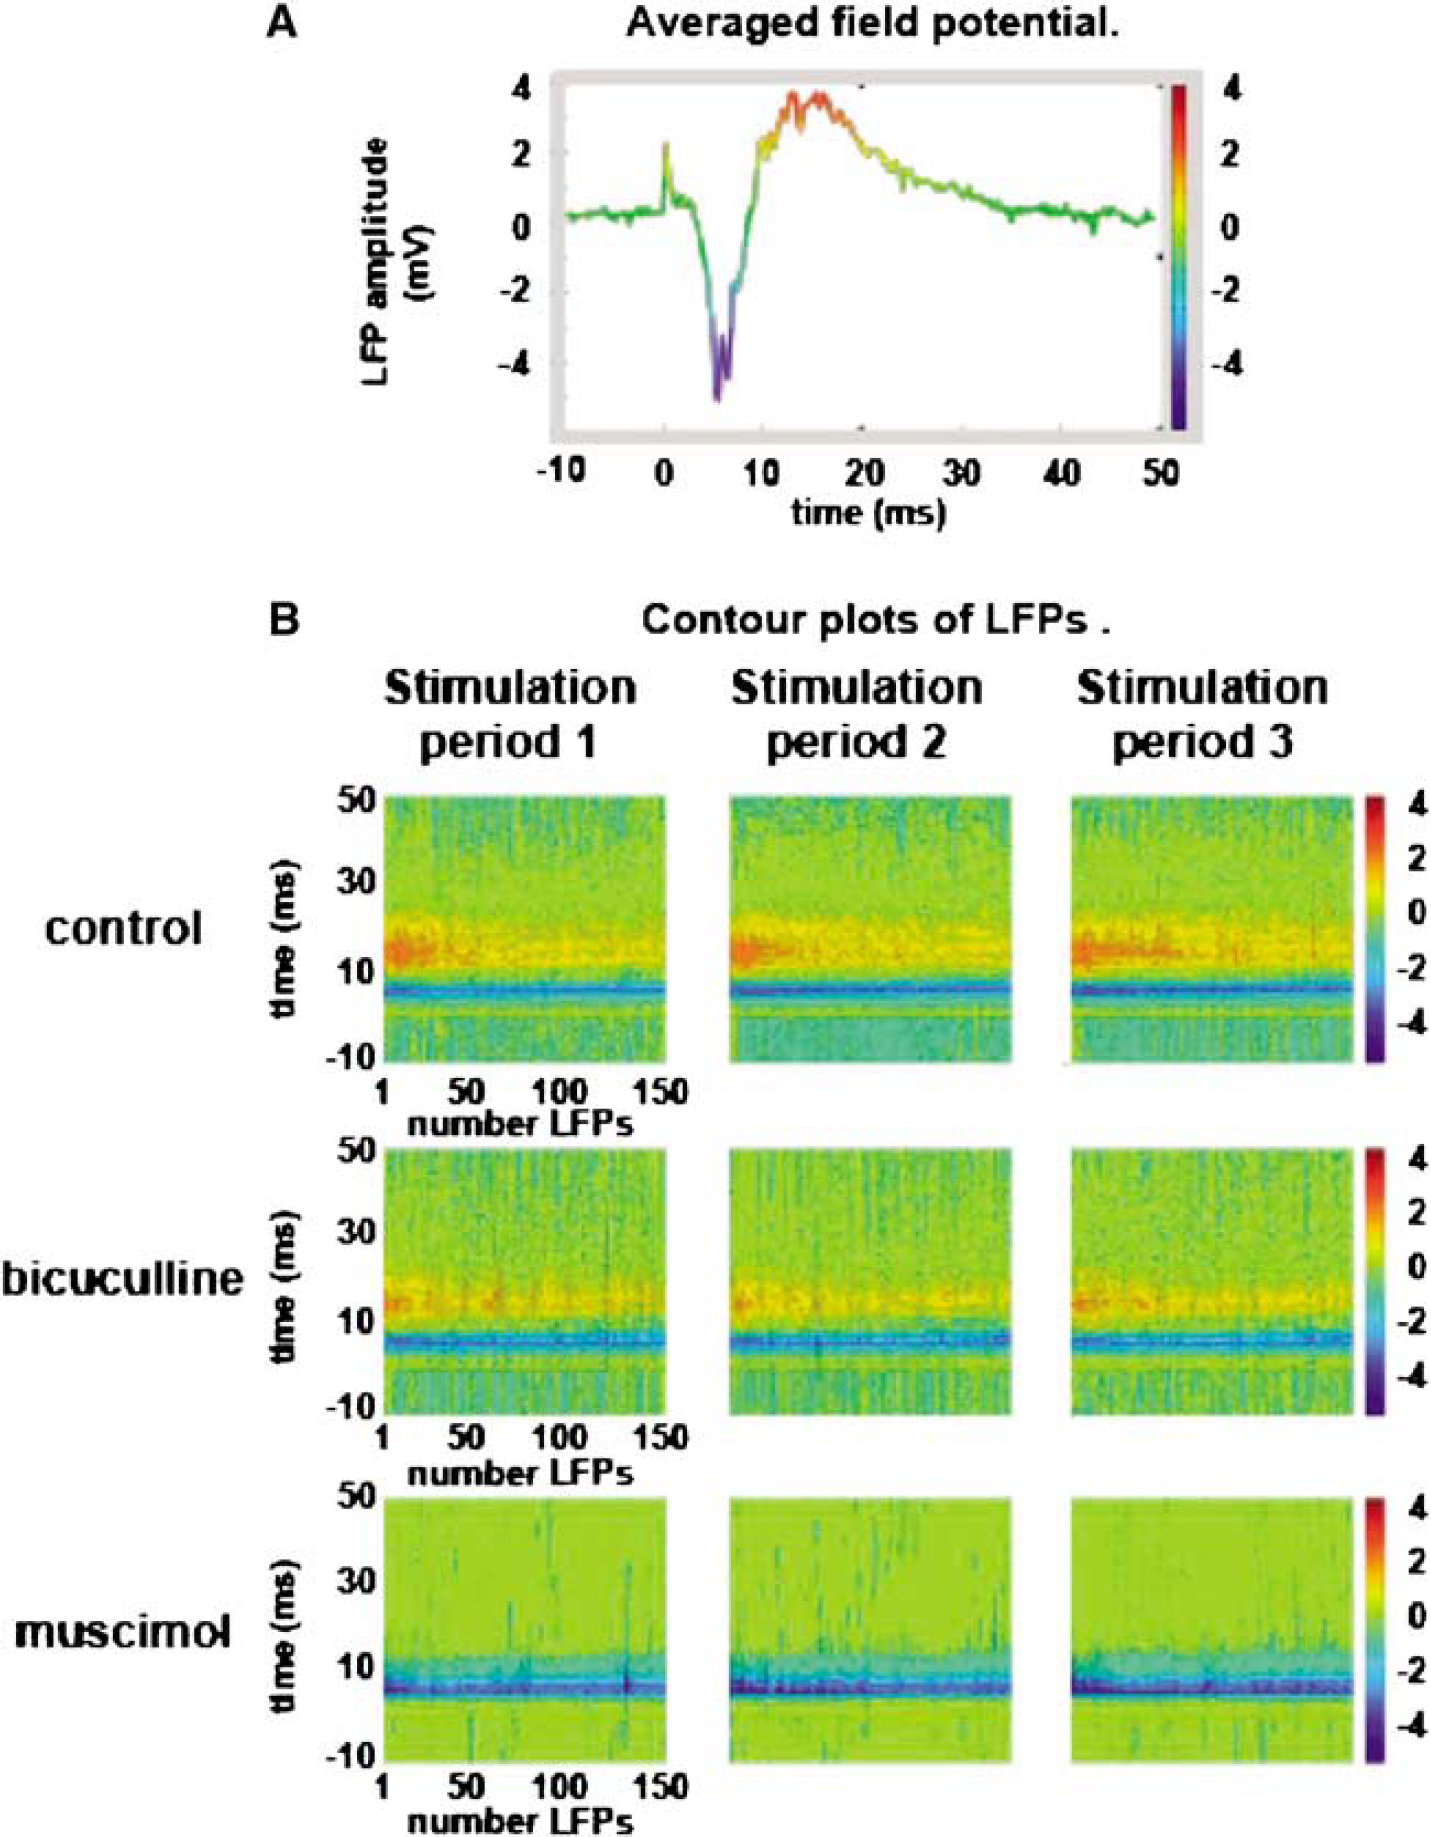
Climbing fibers (CFs) project to the proximal dendrites of Purkinje cells and elicit a large, all-or-none excitatory postsynaptic potential that is recorded as the LFP (Figure 4A). The presynaptic action potentials in the CFs do not contribute significantly to the amplitude of the LFP because of the slenderness and low density of these presynaptic structures. Hence, the LFP responses evoked by CF stimulation represent transmembrane ion fluxes in postsynaptic cellular elements and consist of a large negative potential because of the inward Na+ current through postsynaptic AMPA receptors, and a smaller hyperpolarization representing the positive outward current via Ca2+-gated K+ channels (Figure 4A) (Midtgaard, 1995). The level of synaptic excitation was preserved independent of the GABAergic tone, a unique property of the climbing fiber-Purkinje cell (CF-PC) network (Caesar et al, 2003). The ongoing synaptic activity, as indicated by the LFP responses, was recorded simultaneously with tpO2 and CeBF. Figure 4B displays a contour plot of 150 LFP responses in 60 ms bins along the y-axis stacked together along the x-axis. In the z-plane, the power of the LFPs is color coded with respect to the x-y plane, depicting baseline in green, depolarization in blue, and the late hyperpolarization in yellow/red. During muscimol application, the amplitude of the depolarization phase of the LFP response increased slightly suggesting preserved excitation of postsynaptic dendritic membranes in the face of increased GABAergic tone (Figure 4B, P = 0.012, n = 6). The overall increase in LFP response amplitude is explained by an increased driving force for the transmembrane synaptic currents because of the hyperpolarization that is produced when GABAA receptors are activated (Midtgaard, 1995). In contrast, the late positive wave disappeared (Figure 4B, P ≤ 0.001, n = 6) as described previously (Caesar et al, 2003). Importantly, the abolition of the delayed positive potential suggests that the positive outward current triggered by the rise in intracellular Ca2+ in Purkinje cells, which normally accompanies activity at the CF-PC synapse (Midtgaard, 1995), was blocked by synaptic inhibition. Figure 4B illustrates that synaptic excitation (blue color) of Purkinje cells via dendritic AMPA receptors was increased during muscimol application. The profile and power of the LFP responses remained constant during control stimulations and during application of bicuculline (Thomsen et al, 2004). The lack of a change in the profile or magnitude of the LFP for bicuculline suggests that the contribution of the GABAA current under control conditions is too small to be recorded by our extracellular microelectrodes.
Influence of GABAergic tone on profile and magnitude of local field potentials (LFP) (
Discussion
The main result of the present study is that GABA blocks oxygen consumption evoked by stimulation of the excitatory CF-PC synapse. Transmembrane ion fluxes evoked by synaptic excitation, as indicated by LFP response amplitudes, are preserved at this synapse despite variations in synaptic inhibition and hence GABA effects. It is therefore possible to study the effects of GABA on oxygen use evoked by activity at this glutamatergic synapse disregarding a concomitant decline in postsynaptic currents, which occur at other synapses when exposed to increased levels of GABA (Semyanov et al, 2004). Cerebellar oxygen use evoked by stimulation of cerebellar climbing fibers increases linearly with postsynaptic activity (Offenhauser et al, 2005). The rises in oxygen use were present even if the concomitant CeBF response was blocked, and both the negative tpO2 and CeBF responses were blocked by antagonists of postsynaptic AMPA receptors. This suggests that oxygen consumption depends strongly on postsynaptic currents in this network (Offenhauser et al, 2005). The results from the cerebellum are consistent with data obtained in the cerebral cortex with the 2-deoxy glucose method, which indicate that glucose consumption is used for synaptic integration and spiking, and recovery processes after activation (Clarke and Sokoloff, 1994). Our results are also consistent with two recently published studies in the cerebral cortex, which described the effect of variations of baseline activity on stimulus-induced CBF or BOLD signals. In one study of the primary somatosensory cortex, lamotrigine treatment, which blocks activation of voltage-dependent Na+ channels, reduced the fractional increase in CBF during forepaw stimulation by an order of magnitude compared with control conditions without having any effects on baseline CBF (Kida et al, 2001). In a second study, vigabatrin and gabaculine, both highly specific inhibitors of GABA transaminase, caused significant elevation of endogenous GABA levels in the brain. Correlated with the rise in endogenous GABA level after vigabatrin or gabaculine treatment, the intensity of BOLD-weighted fMRI signals in rat somatosensory cortex during forepaw stimulation was found to be reduced significantly (Chen et al, 2005). These findings suggest that stimulus-induced rises in CBF and BOLD signals are strongly affected by attenuation of glutamate release (lamotrigine) and increased GABAergic tone. It has however been problematic to document the effects of GABA on CMRO2 as described below.
Increased GABAergic Tone Blocks Oxygen Consumption
Tonic inhibition was induced by topical application of muscimol, a specific agonist of GABAA receptors, and the effect was reversed by bicuculline, a specific antagonist of GABAA receptors (McCormick, 1989). Whereas GABA has a potential biochemical effect on brain tissue by entering the Krebs cycle via the glutamic acid shunt and thereby imposes a greater CMRO2, the effect of muscimol on metabolism can be ascribed solely to stimulation of GABA receptors, as muscimol cannot enter the Krebs cycle. Previous studies on the effects of muscimol on metabolism reported discrepant results (Palacios et al, 1982; Kelly and McCulloch, 1983). The effect may depend very much on the route of administration—systemic versus topical. Systemic administration of a GABA agonist will affect cells with a GABA receptor as well as projection systems that are modulated by inhibitory interneurons. As the brain is highly interconnected, it is difficult to interpret the results for small brain regions on the basis of a global effect of muscimol obtained with systemic administration. Reduced activity may be because of decreased input (deactivation) or effective synaptic inhibition due to interaction of GABA with its receptors. GABA release, in turn, is the result of excitation of interneurons under physiological conditions. This is supposed to increase CMRO2 and CBF at the same site at which inhibition takes place. In contrast, topical application induces only local changes of the GABAergic tone.
Muscimol did not affect baseline CeBF or baseline tissue oxygen. Thus, the findings reported here of reduced evoked responses in CeBF and CeMRO2, in the presence of muscimol, reflected a local drug effect and not a baseline effect. The spiking output from cells other cells than Purkinje cells must be assumed to be affected by muscimol, that is granular cells and inhibitory interneurons. As for granular cells, muscimol may decrease their spiking output and thereby decrease the excitatory input to PC via parallel fibers. If so, muscimol application should change the baseline values for oxygen or CeBF because of increases in synaptic excitation, which it did not. This indicates that the change in input to Purkinje cells from cerebellar granule cells under control conditions is minimal in the anesthetized animal.
Our findings are of interest in relation to previous studies of glucose consumption evoked by several categories of inhibition of cortical activity. Recurrent or lateral inhibition of the principal target cell of the hippocampus, the pyramidal cell, was accompanied by an increase in glucose consumption in the face of decreased activity of the pyramidal cell (Ackermann et al, 1984). The increased glucose consumption was interpreted in terms of activation of inhibitory neurons. Along this line of thinking, hypermetabolic regions were defined as regions in which both excitatory and inhibitory interneurons were active. Conversely, hypometabolism was defined as a region in which both excitatory and inhibitory neurons were reduced. In this view, reduced CMRO2 was an unlikely outcome of active inhibition, that is excitation of interneurons (Ackermann et al, 1984). Similar findings were reported for the central auditory pathways in which both excitatory and inhibitory synaptic activity increased glucose consumption (Nudo and Masterton, 1986). These findings are consistent with reduced glucose consumption following epileptic seizures, which is associated with a generalized decrease of neuronal activity (Ackermann et al, 1986) and may be a result of deactivation as well as active synaptic inhibition, but not with a recent study that showed that synaptic inhibition was metabolically much less energy demanding than excitation (Waldvogel et al, 2000). In the present study, we bypassed excitation of inhibitory interneurons by local superfusion of muscimol and observed no baseline effects but a strong effect on the evoked CMRO2 and CBF responses. In summary, we suggest that the direct effect of GABA on evoked CMRO2 and CBF responses is reduced amplitude, and we hypothesize that synaptic inhibition may reduce baseline CBF and CMRO2 in networks with a higher ongoing activity in awake animals, but this will need to be examined in further studies.
Reduced GABAergic Tone may Enhance Oxygen Consumption
To examine oxygen consumption under conditions of a reduced GABAergic tone, we also applied the GABA antagonist bicuculline to the brain. Bicuculline causes deactivation of GABAA receptors on Purkinje cells, as evident from the increase in PC spiking (Figure 3A). However, the increase in PC spiking could also be an effect of increased excitatory input to PCs, as granular cells, which receive input from mossy fibers and excite Purkinje cells via their axons (parallel fibers), also get disinhibited by bicuculline. This increase in excitatory input is presumably counteracted by an equally increased input from parallel fibers to stellate cells (inhibitory interneurons), which provide increased inhibitory input to PCs via GABAB receptors, which are not affected by bicuculline. Climbing fibers activate PCs directly without excitation of granule cells. Glutamate spillover from the CF-PC synapse suppresses GABA release from inhibitory interneurons converging onto the same PC via interaction with AMPA-type glutamate receptors on the interneurons (Satake et al, 2006). Thus, any change in energy expenditure of evoked responses, produced by CF stimulation, was interpreted as the outcome of a fixed excitatory input to a principal cell with a reduced GABAergic tone. The evoked CeBF and LFP response amplitudes were not affected by bicuculline as described previously (Thomsen et al, 2004). However, the oxygen signal was changed in that a delayed negative tpO2 component became apparent after bicuculline application due in part to a CeBF undershoot, which underlines the importance of recording CBF and tpO2 at the same time when neurometabolic coupling is examined. A similar triphasic oxygen response was reported by Thompson et al (2003) in a study in which they measured tpO2 in the lateral geniculate nucleus of the cat. As they did not have simultaneous measurements of CBF, they concluded that the late negative component originated from either vascular or metabolic mechanisms. In comparison, our data showed that the triphasic tpO2 response in the cerebellum was related to both a CBF reduction and a delayed increase in oxygen consumption.
The GABA Effect on CMRO2 may be Explained by Changes in Ca2+ Signaling
Modifying the impact of glutamatergic transmission by increasing and decreasing the GABAergic tone changed both the hemodynamic and metabolic responses to brain activation. The activity-related increases in CeMRO2 and CeBF decreased in parallel after increasing the level of inhibition at the CF-PC synapse. Interestingly, this reduction occurred despite preserved energetic needs through excitation of postsynaptic AMPA receptors, as indicated by the intact LFP response amplitudes. This shows a preserved coupling between CBF and oxygen metabolism and a united uncoupling from the LFP, which under control conditions is closely coupled to CBF. A point for brief consideration is the notion of oxygen diffusion limitation in the tissue and the need for a luxury perfusion to maintain oxygen consumption (Gjedde et al, 2005). This suggestion implies that a reduction in CBF inevitably leads to a reduction in oxygen consumption, simply because of failure of oxygen delivery to the tissue. However, the observation that oxygen consumption increases (the initial dip) before the CBF rises suggests that a reserve of oxygen is present in the tissue. In addition, we recently showed that abolition of the CBF response by the nitric oxide synthase inhibitor 7-nitroindazole (7-NI) enhanced the negative tpO2 response in the face of uncoupling of synaptic activity and CBF, implying that CBF and oxidative metabolism may vary independently (Offenhauser et al, 2005). We propose that the decrease in oxygen consumption during excitation under conditions of a high GABAergic tone can be explained by the electroresponsive properties of the Purkinje cell. Activation of the postsynaptic GABAA receptor opens Cl− channels, which leads to hyperpolarization of Purkinje cells. Several in vitro studies have shown that excitation of prior hyperpolarized Purkinje cells is accompanied by a lack in calcium rise in the dendrites (Midtgaard, 1995). Rises in the intracellular calcium concentration evoked by synaptic excitation are strong stimuli for oxygen consumption in mitochondria (Hayakawa et al, 2005), and mitochondria accumulate calcium rapidly during cell stimulation (Shibuki et al, 2003). A lack of calcium rise would therefore disrupt the chain of events leading from synaptic excitation to increased CBF and energy metabolism (Kann and Kovacs, 2007).
Conclusion
The present findings indicate that the ability of synaptic excitation to stimulate oxygen consumption in postsynaptic cellular elements may depend on the level of synaptic inhibition in the cerebellar cortex. We show that the rises in oxygen consumption evoked by a fixed excitatory input is reduced by synaptic inhibition using the unique properties of the CF-PC circuit. Our findings in the cerebellum may not be directly applicable to the cerebral cortex, but similar experiments in the cerebral cortex would have either extinguished synaptic activity (muscimol) or triggered epilepsy (bicuculline). We suggest that synaptic inhibition may be one of the mechanisms by which energy metabolism is redistributed spatially, for example, to activated centers of networks with a center-surround organization, as known from observations of cortical vascular responses (Devor et al, 2007). The mechanism may also be active in the temporal limitation of rises in oxygen consumption in networks in which initial synaptic excitation is followed by a protracted phase of synaptic inhibition, for example, the somatosensory or transcallosal fiber systems (Creutzfeldt, 1995). We hypothesize that signaling in neuronal networks controls energy metabolism in cerebral gray matter (Attwell and Laughlin, 2001) via a feed-forward mechanism coupled to Ca2+ signaling in neurons.
Footnotes
Acknowledgements
The authors thank Professor Albert Gjedde and Professor David Atwell for helpful comments on the manuscript.