
Abstract
The concentration of glycogen, the major brain energy reserve localized mainly in astrocytes, is generally reported as about 2 or 3 μmol/g, but sometimes as high as 3.9 to 8 μmol/g, in normal rat brain. The authors found high but very different glycogen levels in two recent studies in which glycogen was determined by the routine amyloglucosidase procedure in 0.03N HCl digests either of frozen powders (4.8 to 6 μmol/g) or of ethanol-insoluble fractions (8 to 12 μmol/g). To evaluate the basis for these discrepant results, glycogen was assayed in parallel extracts of the same samples. Glycogen levels in ethanol extracts were twice those in 0.03N HCl digests, suggesting incomplete enzyme inactivation even with very careful thawing. The very high glycogen levels were biologically active and responsive to physiologic and pharmacological challenge. Glycogen levels fell after brief sensory stimulation, and metabolic labeling indicated its turnover under resting conditions. About 95% of the glycogen was degraded under in vitro ischemic conditions, and its “carbon equivalents” recovered mainly as glc, glc-P, and lactate. Resting glycogen stores were reduced by about 50% by chronic inhibition of nitric oxide synthase. Because neurotransmitters are known to stimulate glycogenolysis, stress or sensory activation due to animal handling and tissue-sampling procedures may stimulate glycogenolysis during an experiment, and glycogen lability during tissue sampling and extraction can further reduce glycogen levels. The very high glycogen levels in normal rat brain suggest an unrecognized role for astrocytic energy metabolism during brain activation.
In our recent studies of metabolic changes in rat brain that underlie the phenomenon “aerobic glycolysis” (i.e., disproportionate utilization of glucose compared with oxygen in normoxic rats) during generalized sensory stimulation, the glycogen levels in cerebral cortex of normal, very carefully handled rats were higher than the usually reported values, and ranged from a mean “resting” level of 6.1 μmol/g to 4.8 μmol/g at 15 minutes after brain activation (Madsen et al., 1995; 1999). More striking, however, were the glycogen levels obtained in our follow-up investigation of activity-dependent changes in metabolite labeling by [6-14C]glucose (Dienel et al., 2002). The mean glycogen concentrations were twice as high as in our initial study (i.e., 12 μmol/g in unstimulated animals and 8 μmol/g at 15 minutes recovery from activation). This finding was quite unexpected because the animals were similarly treated in the two studies and glycogen was determined by the same routinely used analytical procedure. The only difference between the two studies was the tissue-extraction procedure. In the first study unlabeled glycogen was determined after careful thawing, then boiling, of the frozen brain powder in 0.03N HCl (Madsen et al., 1999), whereas in the metabolic labeling study an ethanol extraction procedure was used to eliminate possible interference of perchlorate in the analysis of 14C-labeled glucose, lactate, and glycogen levels by anion exchange high-performance liquid chromatography (HPLC). The similarity of the brain glucose and lactate levels in the two studies during rest, sensory stimulation, and recovery suggested that the extraction procedure, not differences between groups of rats, might have had a significant impact on measured glycogen level in frozen brain powders.
There were three major objectives of the present study: (1) to identify the source(s) of the apparently discrepant brain glycogen levels obtained by various extraction procedures; (2) to assess the “bioavailability” of higher-than-normal glycogen levels; and (3) to examine the “responsiveness” of very high levels of glycogen to physiologic and pharmacological challenge. The influence of processing of frozen tissue samples on measured glycogen concentration was assessed by parallel extraction of frozen brain powders by three different methods (ethanol, perchloric acid, and dilute HCl) followed by assay of glycogen content by the same analytical procedure. A substantial portion of the glycogen in brain is, under some conditions, not readily accessible to degradation by phosphorylase (Folbergrová et al., 1996; Watanabe and Passonneau, 1973), and may, therefore, not contribute to the rapidly degradable energy reserves. To determine whether all of the glycogen assayed in the brain powders from resting rats is bioavailable, loss of glycogen during ischemic conditions was tested by in vitro incubation of brain powders before analysis of glycogen. The magnitude of glycogenolysis shortly after onset of generalized sensory stimulation was examined by (1) determining the concentrations of glycogen before and after brief stimulation and (2) loss of 14C from glycogen prelabeled with [6-14C]glucose before acute brain activation. Nitric oxide (NO) can reversibly inhibit astrocytic oxidative metabolism and stimulate lactate production in vitro (Bolanos et al., 1994; Brown et al., 1995), suggesting that NO produced during brain activation may influence glial energy metabolism and glycogenolysis. Therefore, the effect of prolonged inhibition of nitric oxide synthase (NOS) on brain glycogen level in vivo was examined. The results of the present study demonstrate that (1) cerebral cortical glycogen levels in unstimulated, carefully handled rats are in the range of 11 to 12 μmol/g (i.e., fourfold to sixfold higher than usually reported values); (2) glycogen levels fall after sensory stimulation; (3) the extraction procedure has a profound effect on the measured glycogen level; (4) nearly all of the glycogen in “resting” rats is bioavailable; and (5) glycogen levels are reduced by chronic inhibition of NOS.
MATERIALS AND METHODS
Materials
Amylo-α−1,4-α−1,6-glucosidase (Aspergillus niger), hexokinase and glucose-6-phosphate dehydrogenase (yeast), and pepsin (porcine stomach) were obtained from Roche Molecular Biochemicals (Indianapolis, IN, U.S.A.). ATP, NADP, D-glucose, glycogen, and acid phosphatase (potato) were purchased from Sigma Chemical Co. (St. Louis, MO, U.S.A.). D-[6-14C]-glucose (specific activity, 52 mCi/mmol) was purchased from DuPont NEN (Boston, MA, U.S.A.).
Sources of tissue samples, animal procedures, and in vitro studies
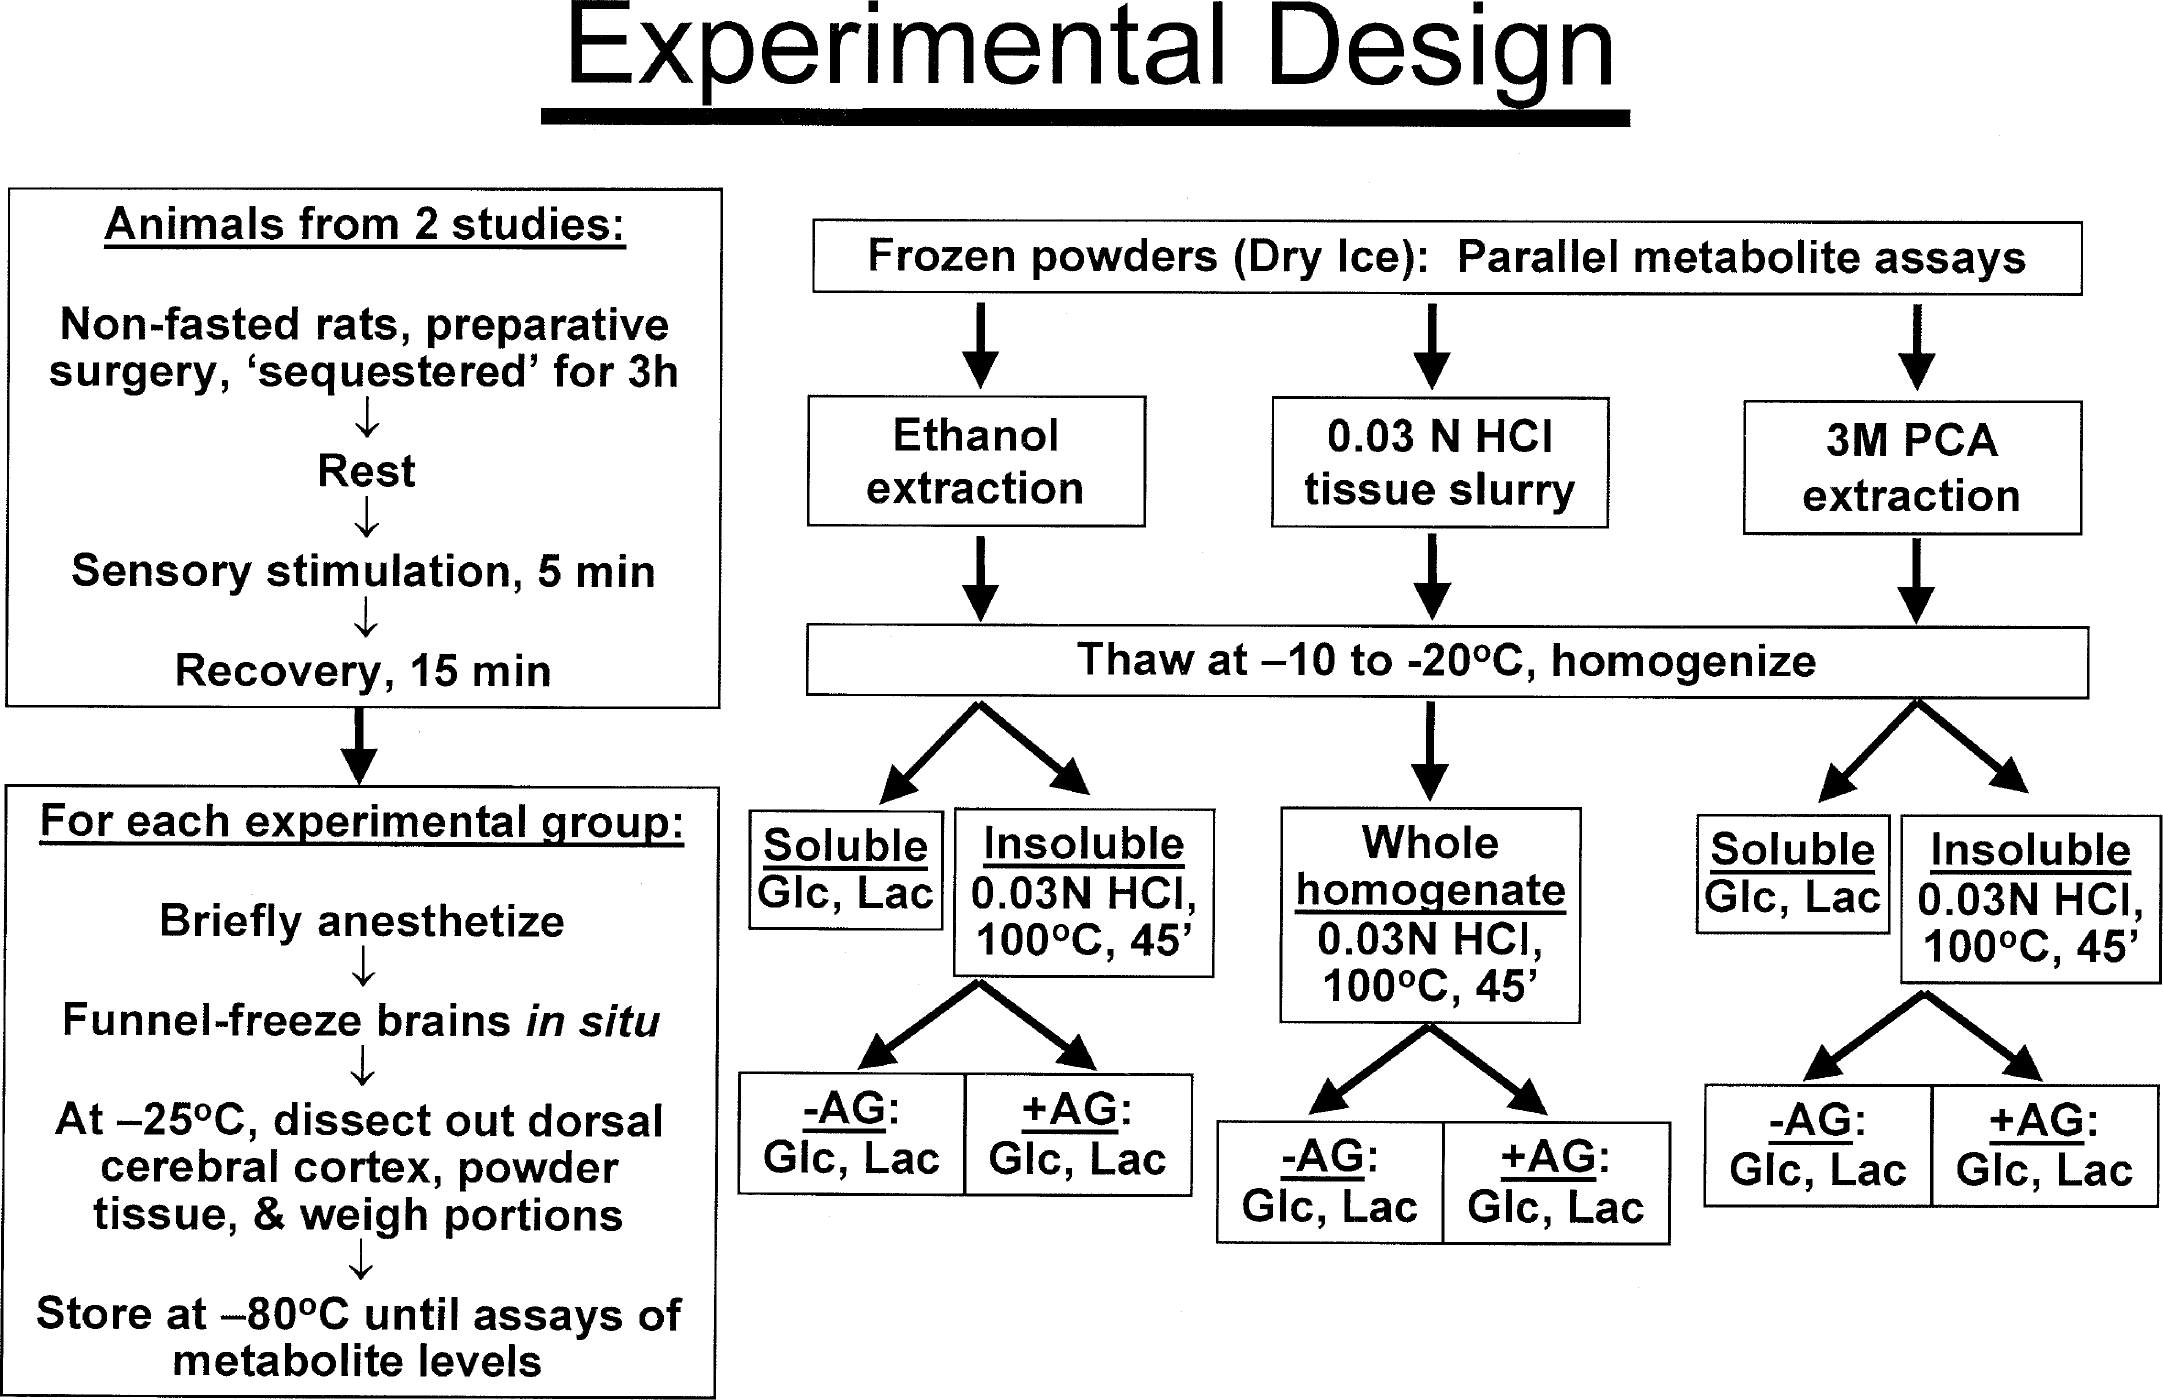
Summary of animal handling, tissue preparation, and analytical procedures. The rats were sequestered after preparative surgical procedures and handled very carefully to minimize brain activation of the resting rats. The animals were then given brief generalized sensory stimulation followed by a 15-minute recovery interval. At end of each stage of activity, the rats were anesthetized, their brains were funnel frozen, and metabolites were assayed in parallel in samples of frozen brain powders from each brain. For experimental details, see Materials and Methods. PCA indicates perchloric acid; Glc, glucose; Lac, lactate; AG, amyloglucosidase.
To evaluate whether interactions of glycogen with tissue components (Mrsulja et al., 1968) might render amyloglucosidase unable to completely hydrolyze glycogen, brain powders were first carefully thawed and boiled in 0.03N HCl as described later. The acid digests were incubated at 37°C overnight with or without 100 U pepsin; the reaction was stopped by raising the pH to >8 with NaOH for 30 minutes at 37°C to irreversibly inactivate the pepsin (Herriott, 1955; Rick and Fritsch, 1974). The samples were acidified with HCl, brought to pH 4.9 with acetate buffer, and assayed for glucose release by incubation with and without amyloglucosidase.
Tissue extraction and metabolite assays
The skin, muscle, skull, and superficial membranes were carefully removed from the brain in a cryobox at about −25°C, and the entire frozen dorsal cerebral cortex of each rat was dissected out and powdered under liquid N2 in a mortar kept on dry ice using a pestle precooled in liquid N2. Replicate portions of each well-mixed powdered sample were weighed in the cryobox at about −25°C on a Model C-34 microbalance (ATI Cahn Instruments, Boston, MA, U.S.A.), transferred to tubes in storage jars containing dry ice, and stored at −80°C. Analysis of well-mixed powders averages any regional variations in metabolite concentrations and local responses to the sensory stimulation procedure, and provides replicate brain samples with the same levels of all metabolites (for further discussion of tissue and blood sampling issues, see Madsen et al., 1999).
Frozen powders of the same brains were treated in parallel according to one or more of the following extraction procedures: (1) serial extraction with aqueous 65% ethanol containing phosphate-buffered saline (8 g NaCl, 0.2 g KCl, 1.15 g Na2HPO4,0.2 g KH2PO4 dissolved in 800 mL H2O)/water (65:10:25; v/v/v): (2) extraction with 3-mol/L HClO4;or(3) careful thawing in 0.03N HCl to form a whole homogenate slurry; these procedures are described in detail later. The variously processed samples were assayed to determine glycogen, glucose, and lactate levels by one or more analytical procedures (Fig. 1). The ethanol- and perchloric acid-insoluble pellet fractions were suspended in 0.03 mol/L HCl, and the resultant slurries derived from all three procedures were boiled for 45 minutes and incubated in parallel with or without amyloglucosidase to convert glycogen to glucose; the only difference in the glycogen determination was the preparative method to obtain an insoluble fraction or a dispersed HCl-treated sample (Fig. 1). All sample dilutions and transfers from preparative to assay tubes and all acid, reagent, and enzyme additions were carried out with calibrated glass constriction pipettes (Lowry and Passonneau, 1972) or calibrated Rainin Instrument (Emeryville, CA, U.S.A.) pipettes.
The 14C-labeled glucose in the ethanol-soluble fraction in brain was purified with a BioLC HPLC system (Dionex, Sunnyvale, CA, U.S.A.), the amount of unlabeled glucose recovered in the glucose peak was quantified by pulsed amperometry and comparison to standard curves, and the 14C content of the glucose peak was assayed by liquid scintillation counting with external standardization; these quantitative methods are described in detail in our previous (Adachi et al., 1995; Dienel and Cruz, 1993; Dienel et al., 1993) and in the accompanying (Dienel et al., 2002) articles. In preliminary experiments, the 14C released by incubation of the 14C-labeled glycogen in the ethanol-insoluble fractions by amyloglucosidase was purified by HPLC and glucose was found to be the only labeled compound recovered (data not shown). Therefore, subsequent assays of the 14C-labeled glucose released from glycogen were determined by counting the 14C recovered in the supernatant after glycogenolysis and centrifugation to remove insoluble material.
Method 1. For the ethanol-soluble fractions that were lyophilized, the dilution factor was volume of deionized water added to the dried material/weight of frozen powder (e.g., 0.350 mL/0.035 g = 10 mL/g wet wt.). For the HCl digests, perchloric acid-soluble and -insoluble fractions, and ethanol-insoluble fractions, the calculation factor was (volume of liquid added + weight of frozen powder)/weight of frozen powder; this assumes that the tissue powder or tissue fraction adds a volume equivalent to its wet weight. For example, the factor for a 35-mg frozen sample digested in 0.350 mL HCl would be ([0.035 g wet wt. + 0.350 mL]/0.035 g) = 11 mL/g. The factor for perchloric acid soluble fraction would be (0.035 g wet wt. + 0.450 mL]/0.035 g) = 13.9 mL/g, with an additional correction for the subsequent dilution at the K2CO3 neutralization step. When the ethanol- and perchloric acid-insoluble fractions were resuspended in 0.03N HCl for the glycogen assay, the same dilution factor calculation was used: (tissue sample wet weight plus volume of HCl)/tissue weight.
Method 2. An alternative approach for calculation of the initial dilution for HCl digests and perchloric acid soluble fractions estimates the volume contribution of the tissue water as approximately 80%. For example, for the HCl digest this approach yields a factor of [(0.8 mL/g)(0.035 g) + 0.350 mL]/0.035 g wet wt. = 10.8 mL/g wet wt., a value for the factor that is within 2% of that obtained by Method 1. If the perchloric acid- or ethanol-insoluble particulate material were assumed to contribute a volume equal to 0.2 of the original wet weight when suspended in HCl for the glycogen assay, the factor is [(0.2ml/g)(0.035g) + 0.350 mL HCl]/0.035 g wet wt. = 10.2 mL/g wet wt., which differs by about 6% to 8% from the respective factors calculated by Method 1 or for the HCl digest factor calculated by Method 2; the difference in calculation factors is minimized by the large volume-to-tissue ratio (i.e., at least 10:1). When glycogen levels were calculated for the ethanol-insoluble extracts with factors derived from both methods (data not shown), the values obtained by Method 1 were about 8% higher than those by Method 2; this systematic difference did not alter the observed trends or outcome of statistical analysis, and the tabulated data are those calculated by Method 1. Systematic differences in glycogen level arising from dilutions of whole-tissue powders (HCl digests) compared with the insoluble fractions (ethanol or perchloric acid pellets) do not explain the much larger variations in glycogen levels obtained in the various extraction procedures (see Results). Protein levels in whole-tissue digests and in particulate fractions recovered by the acid- or ethanol-insoluble procedures were not measured, but even if glycogen levels were expressed per mg protein, there might still be small systematic differences among whole-tissue and particulate fractions owing to the possibility of some differential losses of glycogen and/or protein during the serial precipitation and wash steps.
RESULTS
Glycogen, glucose, and lactate levels in brain samples prepared by different procedures
Initial determinations of glycogen levels in ethanol-insoluble fractions of dorsal cerebral cortex of resting, nonfasted, conscious rats that were sequestered with minimal sensory and motor activity for 3 hours preceding brain sampling yielded values that were extremely high—about twice those that we previously obtained in HCl digests in similarly treated rats (Madsen et al., 1999). To identify the origin of these apparently contradictory results, samples that remained from our previous study in frozen storage at −80°C were extracted with ethanol and reanalyzed for their glycogen, glucose, and lactate contents. Glycogen levels in these ethanol extracts were also found to be twice those previously found in HCl digests of the same samples. A systematic comparison of the different extraction procedures (Fig. 1) was, therefore, carried out in replicates the same samples that were obtained under different physiologic states (rest, activation, recovery). The mean values for glucose, lactate, and glycogen in samples derived from the two independent groups of rats (i.e., our previous or present studies) were not statistically significantly different if they were extracted by the same procedure (data not shown). Thus, other experimental differences between our two studies (i.e., size of the rats and sampling of cerebral venous blood from the torcular) did not alter the mean cerebral cortical glycogen, glucose, or lactate level at any stage of activity. All values for each metabolite for each extraction procedure were, therefore, pooled and compiled in Table 1.
Influence of extraction procedure on cerebral cortical glucose, lactate, and glycogen levels
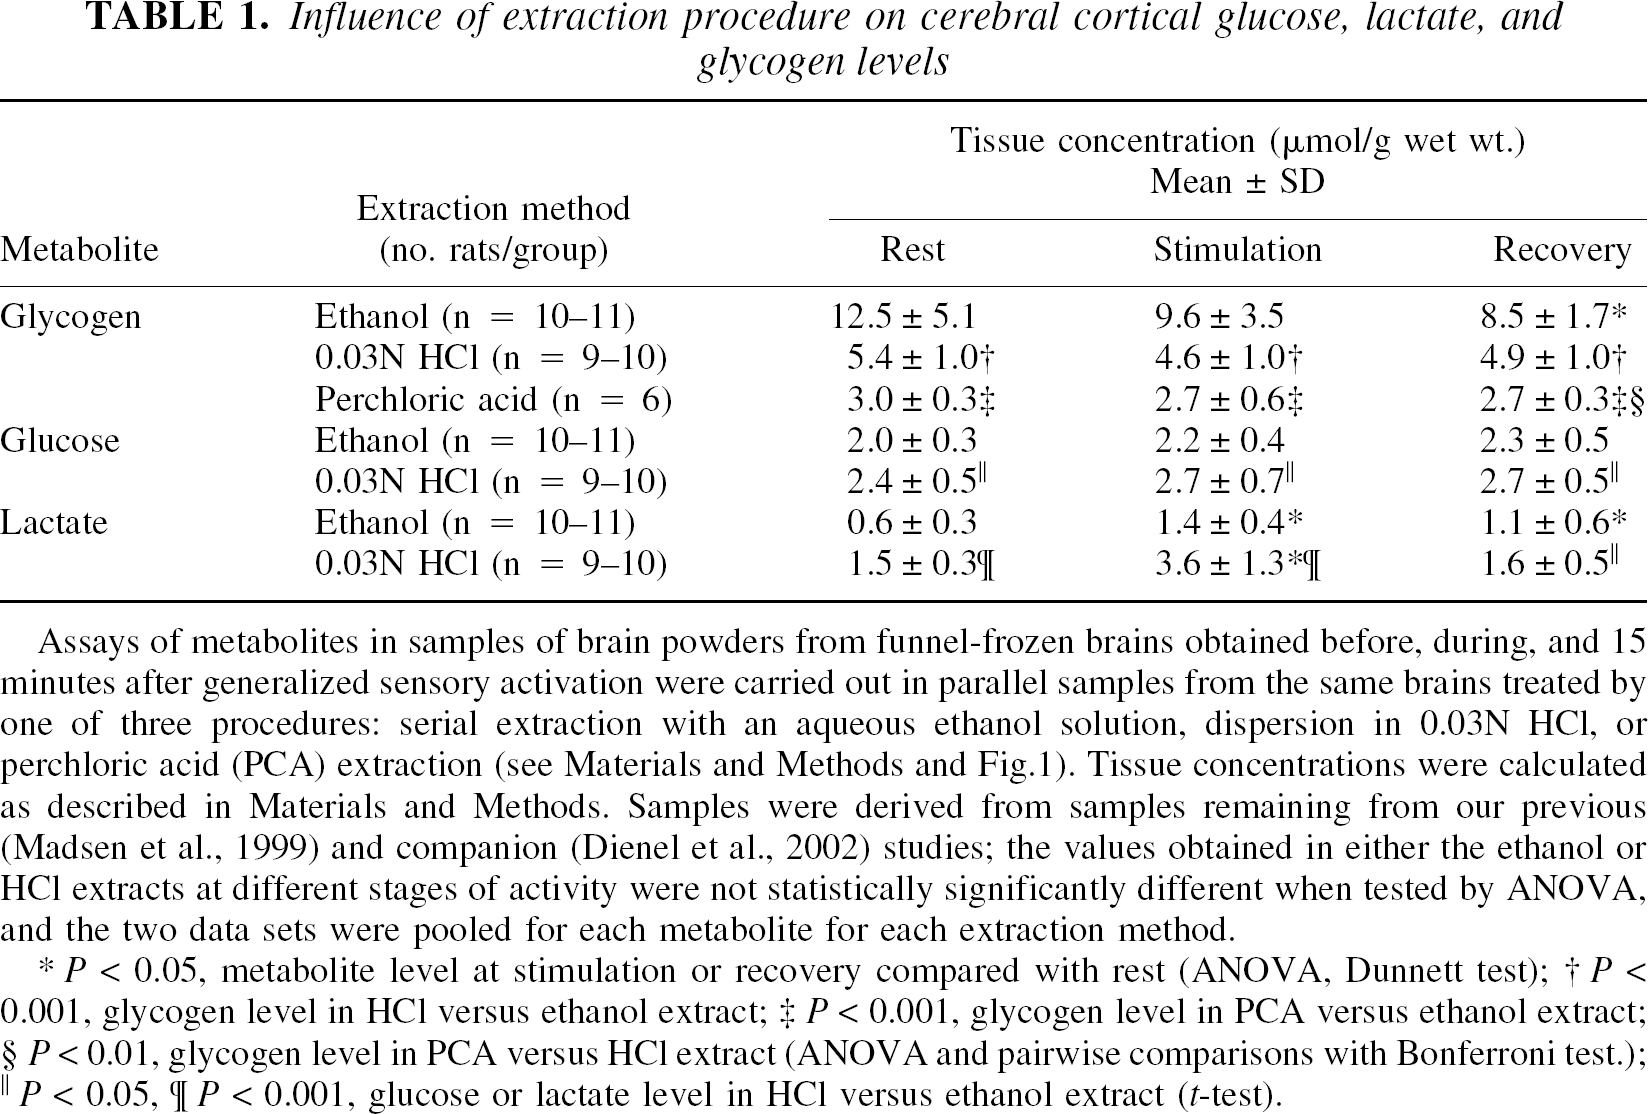
Assays of metabolites in samples of brain powders from funnel-frozen brains obtained before, during, and 15 minutes after generalized sensory activation were carried out in parallel samples from the same brains treated by one of three procedures: serial extraction with an aqueous ethanol solution, dispersion in 0.03N HCl, or perchloric acid (PCA) extraction (see Materials and Methods and Fig. 1). Tissue concentrations were calculated as described in Materials and Methods. Samples were derived from samples remaining from our previous (Madsen et al., 1999) and companion (Dienel et al., 2002) studies; the values obtained in either the ethanol or HCl extracts at different stages of activity were not statistically significantly different when tested by ANOVA, and the two data sets were pooled for each metabolite for each extraction method.
P < 0.05, metabolite level at stimulation or recovery compared with rest (ANOVA, Dunnett test)
P < 0.001, glycogen level in HCl versus ethanol extract
P < 0.001, glycogen level in PCA versus ethanol extract
P < 0.01, glycogen level in PCA versus HCl extract (ANOVA and pairwise comparisons with Bonferroni test.)
P < 0.05
P < 0.001, glucose or lactate level in HCl versus ethanol extract (t-test).
Metabolism due to incomplete enzyme inactivation during the HCl thawing and extraction procedure would be expected to reduce glycogen and perhaps glucose levels and raise the lactate content (Passonneau et al., 1980; Siesjö, 1978). The magnitude of shifts in glucose and lactate level, however, do not account for the much larger differences in glycogen level obtained by these procedures. For example, at rest the glycogen level was about 7 μmol/g higher in the ethanol compared with HCl extracts (Table 1). This difference is equivalent to 14 μmol lactate/g, yet the difference in the mean lactate levels obtained with these two extraction procedures was only about 0.9 μmol/g; the difference in glucose levels was also small (ã0.4 μmol/g; Table 1). These data suggest that if the inactivation of enzymes during thawing in 0.03N HCl was incomplete, glycogen is being converted to metabolites other than glucose and lactate during the thawing procedure. In rat liver slices, only about half of the glycogen lost under anaerobic conditions is accounted for by proportionate increases in glucose plus lactate, with the remainder recovered as oligosaccharides derived from glycogen (Olavarria, 1960; Sukowski and Alpert, 1965). In the present study, any oligosaccharides that might have been formed by cleavage of glycogen during thawing in 0.03N HCl would have been properly assayed because amyloglucosidase cleaves α-linked disaccharides and oligosaccharides (Pazur and Ando, 1960; Pazur and Kleppe, 1962), and particulate matter in the boiled HCl digests was not separated until after the amyloglucosidase incubation. Association of glycogen with protein and lipid (Mrsulja et al., 1968) may influence the completeness of hydrolysis by amyloglucosidase in the acid digests or precipitates compared with ethanol-insoluble fractions, but pretreatment of three samples of 0.03N HCl-boiled slurries with pepsin did not alter the amount of glucose released by amyloglucosidase compared with samples incubated in parallel without pepsin (data not shown).
Glycogen levels in the ethanol-insoluble fractions were three or four times higher than those in perchloric acid-insoluble fractions obtained from the same brains (Table 1). Partial hydrolysis of glycogen by ice-cold 5% trichloroacetic acid reduces the molecular weight of glycogen (Stetten and Stetten, 1958; Stetten et al., 1956, 1958), and in the present study loss of oligosaccharides to the perchloric acid-soluble fraction did contribute to the low glycogen values obtained in the perchloric acid-insoluble pellets. When three perchloric acid supernatants were assayed for glucose released by amyloglucosidase, 4.2, 4.6, and 3.4 μmol/g were recovered in this fraction compared with 3.5, 2.8, and 2.5 μmol/g in the respective perchloric acid-insoluble fractions; the total amounts recovered in the perchloric acid-soluble plus -insoluble fractions were, however, still less than the corresponding levels in ethanol-insoluble fractions from the same brains (8.5, 14, and 9.6 μmol/g, respectively). A similar unexplained anomaly has been previously observed; Passonneau et al. (1967) observed that when frozen brain samples were first treated with 0.1N HCl in methanol and brain glycogen was precipitated (nearly completely) with perchloric acid, subsequent heating of these precipitates in 0.03N HCl gave erroneously low values. Thus, the glycogen levels reported for the perchloric acid pellets in Table 1 would be more than twice as high if the oligosaccharides released to the supernatant fractions were taken into account.
The animal-to-animal variability of glycogen levels in the ethanol-insoluble fractions was quite high, and the coefficients of variation (%CV = 100 SD/mean) averaged 41%, 36%, and 20% during rest, stimulation, and recovery, respectively, contrasting those of the HCl-treated (range of CVs = 19–22%) or perchloric acid-treated (CV = 10–22%) samples from the same brains (Table 1). The origin of the variability is not established, but lower variability in the samples obtained during recovery from stimulation suggests that metabolism in vivo not only reduces the glycogen content, but also decreases the heterogeneity among animals. The loss of oligosaccharides during tissue processing of the perchloric acid-insoluble fractions was associated with lower coefficients of variation, suggesting that chemical cleavage and perhaps metabolism of the glycogen in vitro is another factor that can diminish both the quantity and variability of glycogen content.
Influence of postmortem metabolism on measured glycogen level in samples from “resting” rats
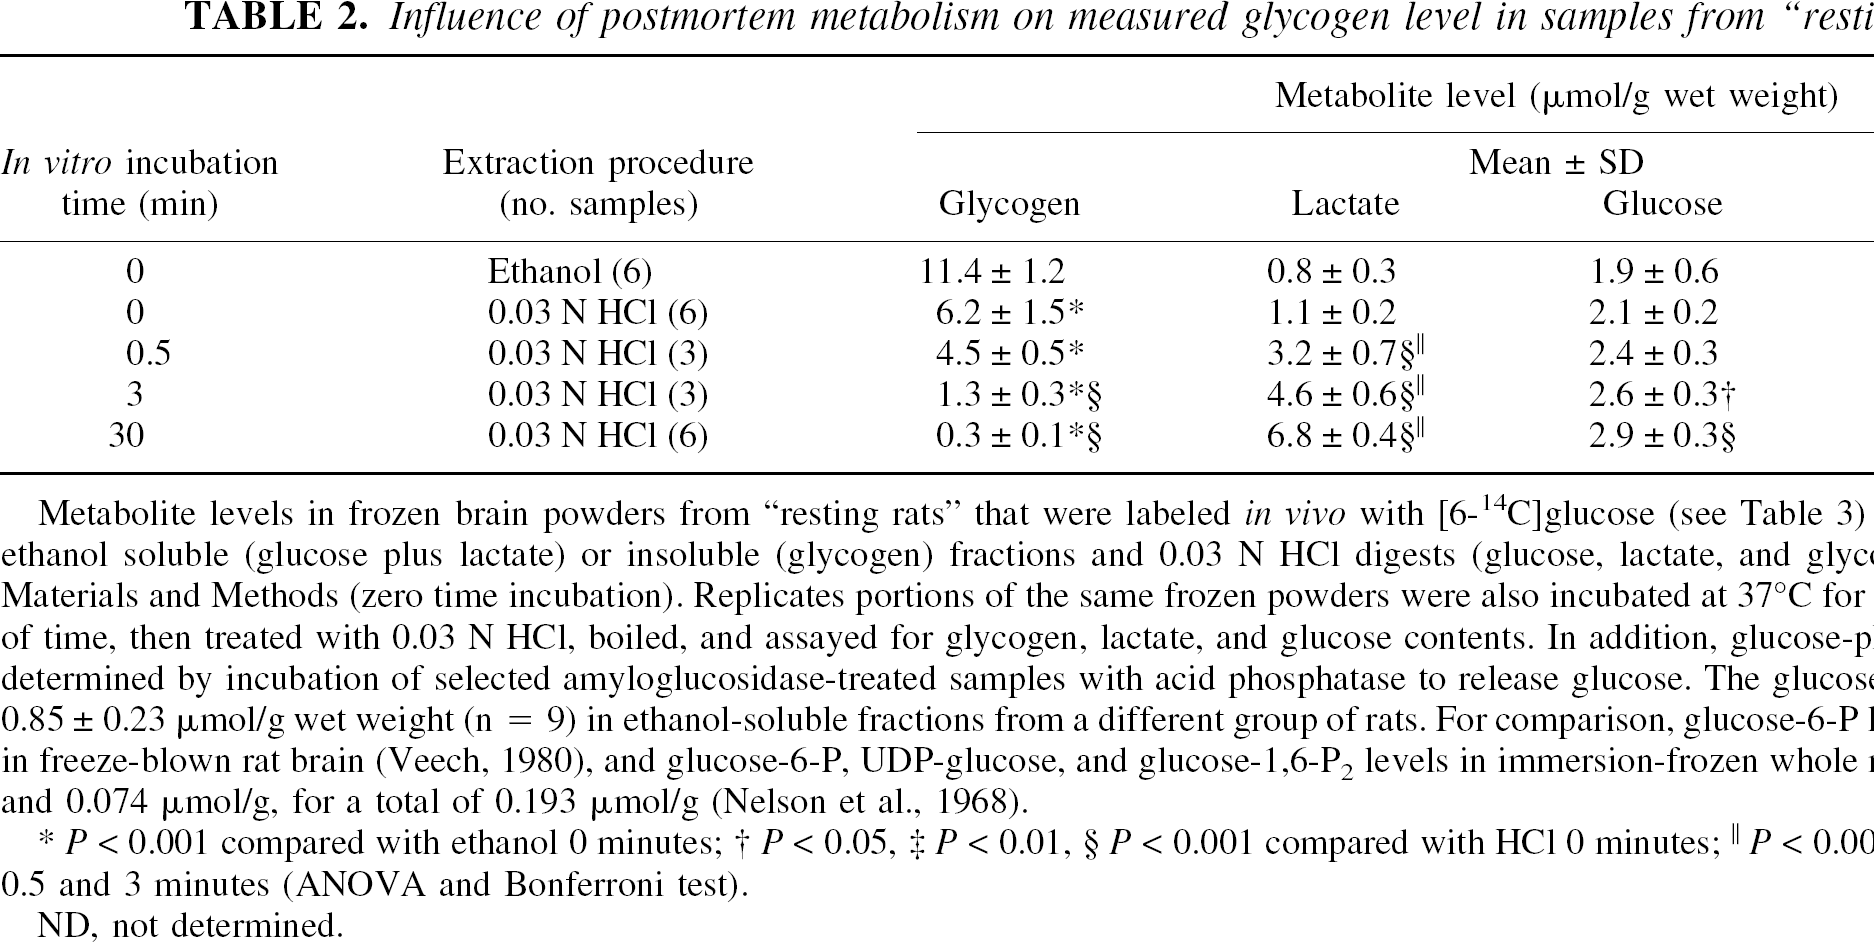
Metabolite levels in frozen brain powders from “resting rats” that were labeled in vivo with [6-14C]glucose (see Table 3) were assayed in both ethanol soluble (glucose plus lactate) or insoluble (glycogen) fractions and 0.03 N HCl digests (glucose, lactate, and glycogen) as described in Materials and Methods (zero time incubation). Replicates portions of the same frozen powders were also incubated at 37°C for the indicated amounts of time, then treated with 0.03 N HCl, boiled, and assayed for glycogen, lactate, and glucose contents. In addition, glucose-phosphates levels were determined by incubation of selected amyloglucosidase-treated samples with acid phosphatase to release glucose. The glucose-phosphate level was 0.85 ± 0.23 μmol/g wet weight (n = 9) in ethanol-soluble fractions from a different group of rats. For comparison, glucose-6-P levels are 0.19 μmol/g in freeze-blown rat brain (Veech, 1980), and glucose-6-P, UDP-glucose, and glucose-1,6-P2 levels in immersion-frozen whole mice are 0.036, 0.083, and 0.074 μmol/g, for a total of 0.193 μmol/g (Nelson et al., 1968).
P < 0.001 compared with ethanol 0 minutes
P < 0.05
P < 0.01
P < 0.001 compared with HCl 0 minutes
P < 0.001 compared with HCl 0.5 and 3 minutes (ANOVA and Bonferroni test).
ND, not determined.
The specificity for the determination of glucose and lactate when using the YSI 2700 Select Analyzer is derived from the respective substrate-selective oxidase enzymes, but it is possible that substances contained in the variously prepared samples may interfere with assay of the H2O2 produced by these enzymes. In preliminary studies (data not shown), quantities of ethanol and phosphate relevant to those in the tissue extracts did not interfere with the assay, and known quantities of standards added to tissue samples in the amyloglucosidase assay mixture were properly quantified. Compounds in the extracts, or perhaps very low levels of contaminating enzymes in the amyloglucosidase that may cause analytical problems or give rise to spuriously high values by causing a response similar to that of H2O2, would be expected to alter both the glucose and lactate values or affect all assays. In the glycogen assays, such interference would be evident in the parallel portions of each sample that were incubated without amyloglucosidase, and inflation of glucose and lactate levels was not observed. In the samples incubated with amyloglucosidase, only the glucose levels rose dramatically after glycogen hydrolysis; in the ethanol-soluble fractions, the lactate levels were very low due to its prior removal into the ethanol-soluble fraction. Finally, preliminary studies showed that glycogen-derived glucose levels were the same when measured by different methods (i.e., glucose oxidase using the YSI Analyzer or by pulsed amperometry after purification by HPLC).
Postmortem disappearance of glycogen in brain powders
To determine whether all of the glycogen assayed in the brain powders from resting rats is accessible to endogenous phosphorylase and debrancher enzymes (i.e., all glycogen is biologically active), loss of glycogen during ischemic conditions was tested by in vitro incubation of brain powders before analysis of glycogen. At “zero” time, the glycogen content of ethanol-insoluble fractions was twice that obtained in 0.03N HCl digests, whereas the tissue glucose and lactate levels were similar in both the ethanol and acid extracts (Table 2); these data, obtained in samples from a separate group of rats, replicate the results in Table 1. Within 0.5 minutes, in vitro incubation lactate levels began to rise, and by 3 minutes both lactate and glucose levels were elevated and only about 10% of the glycogen remained. These data are in good agreement with results obtained after decapitation by Lowry et al. (1964) and in a crude A1-glycogen fraction (i.e., soluble in 100°C water/insoluble in ethanol) by Strang and Bachelard (1971). Virtually all glycogen was eliminated between 3 and 30 minutes (Table 2).
Because the carbon equivalents of glycogen (sum of the glucose plus half of the lactate; 2 lactate/glucose) formed after the 30-minute postmortem incubation (i.e., about 6.5 μmol/g) did not fully account for the 11 μmol/g glucose carbon in glycogen (Table 2), glycogen must have been converted to other intermediary metabolites. Treatment of the samples with acid phosphatase to hydrolyze any phosphorylated derivatives of glucose caused a further rise in glucose level at 30 minutes that accounted for an additional 3 μmol/g (i.e., a total of about 85% recovery) of carbon equivalents that might be ascribed to glycogen (Table 2). No attempt was made to identify other postmortem products of glycogen owing to the complexity of the possible reactions, but alanine level may also rise, since its level increases after severe hypoxia, presumably due to pyruvate accumulation and channeling of carbon to alanine by transamination reactions (Ben-Yoseph et al., 1993; Garofalo et al., 1988). These results suggest that glucose phosphates and probably other intermediary metabolites were formed from glycogen when the frozen powders were thawed in 0.03N HCl, and retention of carbon derived from glycogen in many metabolic pools may explain, in part, the failure of lactate to account for the discrepant levels of glycogen in the ethanol-insoluble pellets and HCl digests (Tables 1 and 2). The stability and an increase of glucose level during these postmortem incubations (Table 2) were unexpected results because energy metabolites are rapidly consumed in the intact brain after decapitation (Lowry et al., 1964). However, the catabolic processes may differ in the two experimental conditions, that is, glucose liberated from glycogen branch points (Cori and Larner, 1951) may not be further metabolized owing to ATP depletion in vitro, and powdering plus freeze thawing may damage tissue compartments and release hydrolytic enzymes that produce glucose.
Metabolic labeling of glycogen in vivo
Bioavailability of the very high levels of glycogen in vivo was also assessed by examining its metabolic labeling and clearance after brief physiologic stimulus. Because the outer tiers of glycogen turn over at twice the rate of the limit dextrin (Watanabe and Passonneau, 1973), glycogen turnover can be detected by labeling with [14C]glucose, and rapid in vivo degradation of glycogen may be most readily detected by assays of loss of [14C]glucose from prelabeled glycogen. The levels of unlabeled brain glycogen recovered at 30 seconds after onset of generalized sensory stimulation were the same as at rest, whether assayed in ethanol extracts or HCl digests (Table 3). The high glycogen levels in the ethanol-insoluble pellets confirm the results in Table 1, and demonstrate that careful animal handling in independent groups of rats yields consistently high brain glycogen levels that are twice those obtained in the HCl digests. The concentrations of brain glucose were similar in all groups, indicating that increased precursor availability was unlikely to be a cause for high glycogen levels in some groups. Lactate levels were also stable after the brief stimulus, suggesting no net change in glycolytic production of lactate just after the onset of sensory stimulus. Glycogen turnover in the resting brain is reflected by its labeling with [14C]glucose (Table 3). The total amount of 14C recovered in prelabeled glycogen fell 16% shortly after activation compared with rest; this loss did not quite reach statistical significance (P = 0.059, t-test) but suggests that glycogen turnover increases shortly after stimulus onset and label clearance would be readily detectable at 1 or 2 minutes.
Levels of unlabeled and 14C-labeled glycogen after 30 seconds of generalized sensory stimulation
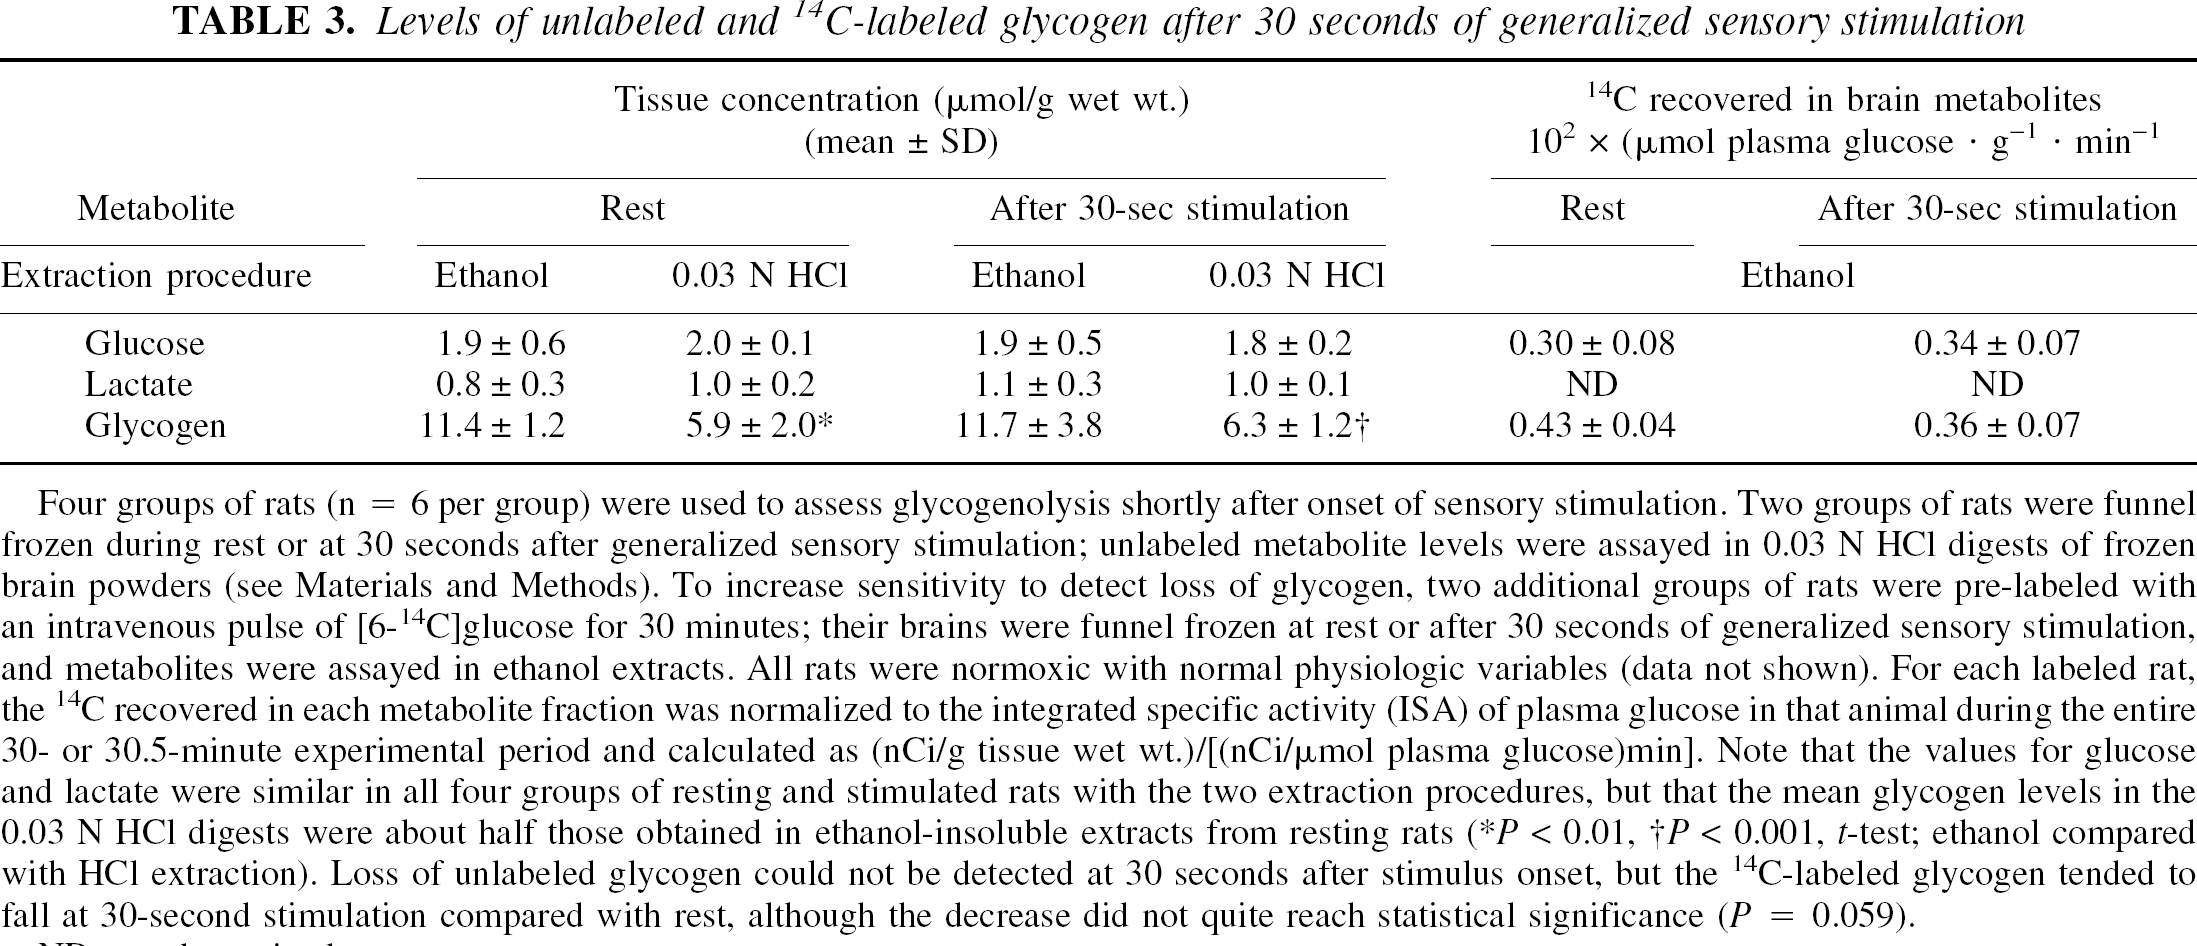
Four groups of rats (n = 6 per group) were used to assess glycogenolysis shortly after onset of sensory stimulation. Two groups of rats were funnel frozen during rest or at 30 seconds after generalized sensory stimulation; unlabeled metabolite levels were assayed in 0.03 N HCl digests of frozen brain powders (see Materials and Methods). To increase sensitivity to detect loss of glycogen, two additional groups of rats were prelabeled with an intravenous pulse of [6-14C]glucose for 30 minutes; their brains were funnel frozen at rest or after 30 seconds of generalized sensory stimulation, and metabolites were assayed in ethanol extracts. All rats were normoxic with normal physiologic variables (data not shown). For each labeled rat, the 14C recovered in each metabolite fraction was normalized to the integrated specific activity (ISA) of plasma glucose in that animal during the entire 30- or 30.5-minute experimental period and calculated as (nCi/g tissue wet wt.)/[(nCi/μmol plasma glucose)min]. Note that the values for glucose and lactate were similar in all four groups of resting and stimulated rats with the two extraction procedures, but that the mean glycogen levels in the 0.03 N HCl digests were about half those obtained in ethanol-insoluble extracts from resting rats
P < 0.01
P < 0.001, t-test; ethanol compared with HCl extraction). Loss of unlabeled glycogen could not be detected at 30 seconds after stimulus onset, but the 14C-labeled glycogen tended to fall at 30-second stimulation compared with rest, although the decrease did not quite reach statistical significance (P = 0.059).
ND, not determined.
Glycogen level after nitric oxide synthase inhibition in vivo
Brain glycogen levels measured in ethanol-insoluble fractions from resting rats after 4 days of pharmacological challenge by inhibition of NOS with L-NAME (Table 4) were about half those of untreated resting rats during both rest and activation (Fig. 2), and there was no change after 5 minutes of sensory stimulation (Table 4). The resting brain glucose and lactate levels in the L-NAME–treated rats were not different from those in untreated animals, but during activation the mean glucose level in L-NAME–treated rats was lower (P < 0.001, t-test) compared with untreated rats (Tables 1 and 4). Lactate content was not affected by L-NAME, and rose during stimulation to the same extent as in untreated rats (Tables 1 and 4).
Prolonged inhibition of nitric oxide synthase influences glycogen level
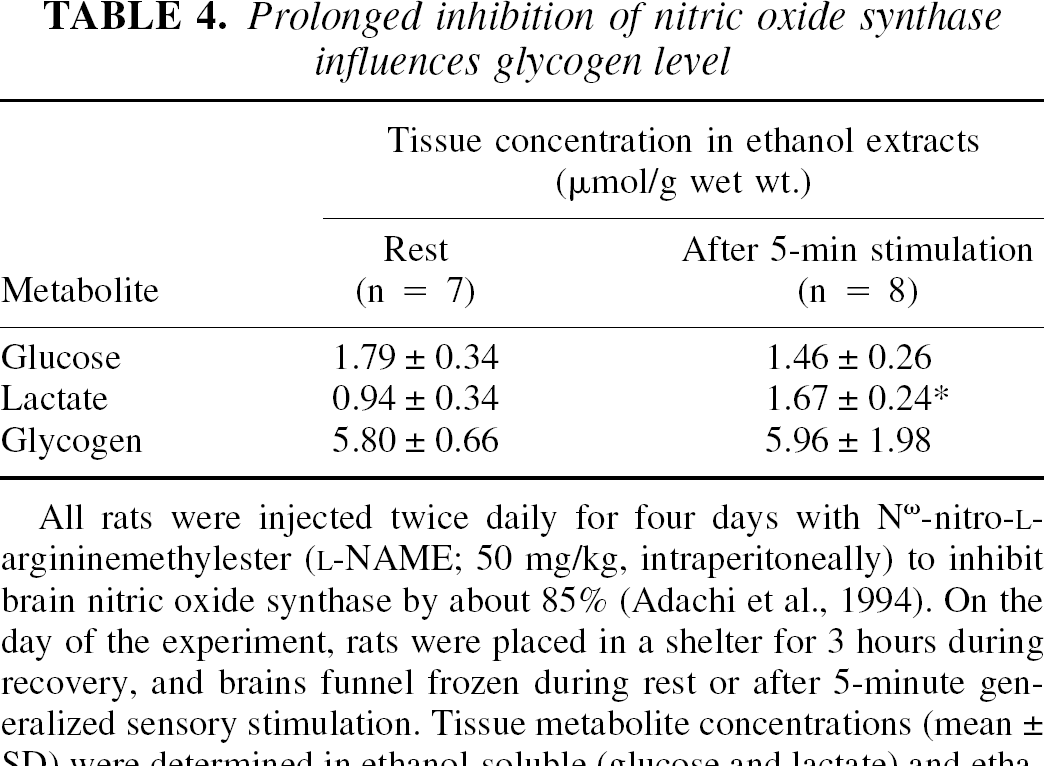
All rats were injected twice daily for four days with Nω-nitro-L-argininemethylester (L-NAME; 50 mg/kg, intraperitoneally) to inhibit brain nitric oxide synthase by about 85% (Adachi et al., 1994). On the day of the experiment, rats were placed in a shelter for 3 hours during recovery, and brains funnel frozen during rest or after 5-minute generalized sensory stimulation. Tissue metabolite concentrations (mean ± SD) were determined in ethanol-soluble (glucose and lactate) and ethanol-insoluble (glycogen) extracts of dorsal cerebral cortex (see Materials and Methods and Fig. 2).
P < 0.05 compared with L-NAME–treated rats at rest (t-test).
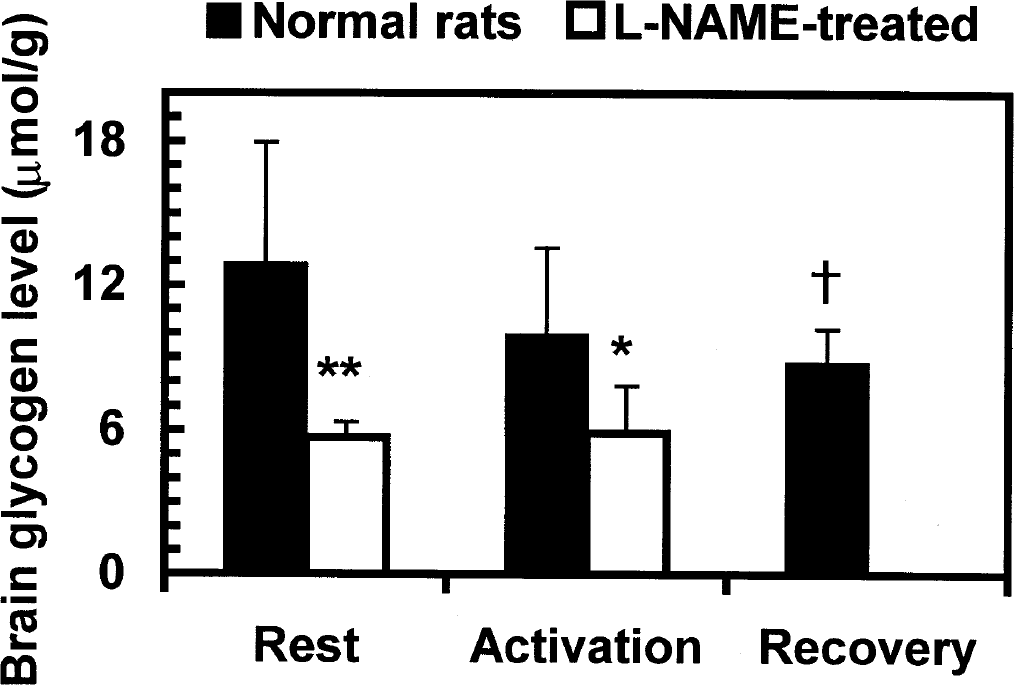
Brief functional activation of metabolism and chronic nitric oxide synthase (NOS) inhibition alter brain glycogen level in vivo. The filled bars (pooled data from the two sets of ethanolextracted samples in Table 1) illustrate the progressive 33% decrease in the glycogen level in dorsal cerebral cortex during the 20-minute activation-recovery interval (5 minutes of generalized sensory stimulation followed by 15-minute recovery; see Materials and Methods); at recovery, the mean glycogen level was 4 μmol/g lower than at rest (†P < 0.05, ANOVA and Dunnett test). The open bars represent rats that were treated for 4 days with Nω-nitro-L-argininemethylester (L-NAME) to inhibit NOS (see Materials and Methods and Table 4). *P < 0.05, **P < 0.01 compared with the respective glycogen levels at the same stage of activity in untreated rats (t-test).
DISCUSSION
Glycogen is the brain's major carbohydrate reserve, and many studies over several decades have reported (1) glycogen concentrations of about 2 or 3 μmol/g when assayed in samples obtained from immersion-frozen, funnel-frozen, or freeze-blown rodent brain; (2) rapid metabolism of glycogen during physiologic stimulation or in abnormal conditions when energy supply cannot meet demand (e.g., hypoglycemia, seizures, or ischemia) (Ghajar et al., 1982; Lowry et al., 1964; Nelson et al., 1984; Passonneau and Lauderdale, 1974; Siesjö, 1978; Swanson, 1992; Veech, 1980); and (3) the brain has the capacity to increase considerably its glycogen content in vivo, and it can rise above 4 μmol/g—even reaching 12 μmol/g—under various experimental conditions, including prolonged anesthesia, abnormal and pathophysiologic states, or pharmacological treatments (Choi et al., 1999; Folbergrová et al., 1969; Nelson et al., 1968; Passonneau et al., 1971; Swanson, 1992; Watanabe and Passonneau, 1973). In early studies, regional variations in brain glycogen levels were relatively small (Gatfield et al., 1966) but evident within the layers of cerebral cortex and subcortical white matter (Folbergrová et al., 1969; 1970). Sagar et al. (1987) and Choi et al. (1999) have noted that brain glycogen levels are much higher and regional heterogeneity is greater in microwave-fixed brain tissue, with values ranging from 3.9 to 8 μmol/g, as recalculated from the reported values of 24 (Swanson et al., 1989, 1990) and 50 (Garriga and Cussó, 1992) nmol/mg protein, using a representative value of 160 mg protein/g wet wt. cerebral cortex in the dehydrated, microwave-fixed tissue from data of Swanson et al. (1989). Brain glycogen levels (e.g., about 8.6 and 22 μmol/g in cerebral cortex and corpus callosum, respectively) are greatest when obtained via high-power (10-kW) microwave fixation, and glycogen levels fall in sleep-deprived rats (Kong et al., 2002). To summarize, higher glycogen levels in normal rat brain were obtained with a fixation procedure that inactivates enzymes rapidly but may be less stressful than other tissue-sampling procedures, and changes in the balance between glucose availability and energy demand can alter the level of brain glycogen to an extent determined by severity and duration of the stimulus, condition, drug dose, and treatment schedule.
Glycogen represents a “hidden metabolic reservoir” because its utilization as a brain energy source is not detectable by determination of arteriovenous differences across the brain or tracer labeling to measure metabolism of blood-borne glucose or its labeled analogs. The major finding of the present study is that the brains of nonfasted, conscious, carefully handled rats have very large stores, in the range of 11 or 12 μmol/g, of biologically active glycogen. The glycogen levels in dorsal cerebral cortex before, during, and after brief, gentle sensory stimulation are as much as four to six times greater than the range of concentrations generally reported by many laboratories over several decades. Gentle tactile stimulation for 5 minutes followed by a 15-minute recovery period caused the mean glycogen level to fall by 4 μmol/g, indicating that even a short period of animal handling can significantly alter the glycogen content of brain. Glycogen turnover in resting brain is detected by metabolic labeling, clearance of prelabeled glycogen may be a sensitive assay for glycogenolysis, and glycogen is nearly completely consumed during in vitro ischemic conditions. An unanticipated finding was that prolonged inhibition of NOS lowered brain glycogen levels in resting rats. Nitric oxide reversibly inhibits astrocytic oxidative metabolism and stimulates lactate production in vitro (Bolanos et al., 1994; Brown et al., 1995); NO also inhibits insulin-induced glycogen synthesis in muscle and glycogen synthase in hepatocytes (Sprangers et al., 1998; Young et al., 1997). Chronic treatment with L-NAME reduces NOS activity by 85% (Adachi et al., 1994) without altering CMRglc (Takahashi et al., 1995), and was, therefore, expected to minimize or block these inhibitory effects of NO and lead to higher glycogen levels. Other unidentified factors appear to have a greater influence on glycogen level in the L-NAME–treated rats. The very high levels of brain glycogen, increased turnover during functional activation, and reduced levels after NOS inhibition could lead to a reevaluation of the metabolic contributions of astrocytes in working brain.
Brain glycogen is known to be difficult to purify and recover quantitatively, and tissue glycogen levels are reduced by incomplete precipitation or inadequate fixation, extraction, or assay procedures (Bachelard, 1989; Bachelard and Strang, 1974; Lowry et al., 1964; Passonneau et al., 1971; Passonneau and Lauderdale, 1974; Passonneau et al., 1980; Siesjö, 1978; Strang and Bachelard, 1971). Major problems encountered during an analysis of the in vitro or in vivo fate of metabolically labile compounds such as glycogen are that the starting material cannot be easily analyzed to establish its initial concentration in situ and it is difficult to quantitatively account for all of the possible metabolic products that are quickly generated. The combined effects of two critical factors affect the level of glycogen ultimately obtained in any study: (1) its lability during tissue fixation, extraction, and analysis; and (2) its sensitivity to brain activation, which is influenced by animal handling before and during the experimental procedure and during in situ tissue fixation. The first issue has received considerable experimental attention in the neurochemical literature, whereas the second is less appreciated. As discussed below, both of these factors probably contribute to the lower brain glycogen levels that have been routinely reported.
Influence of tissue extraction procedures on glycogen level
Direct comparison of glycogen levels in the same samples prepared by different tissue-extraction procedures and analyzed by the same method demonstrated that the glycogen levels in the ethanol-insoluble fractions were about twice those in HCl digests. Similar results were obtained in samples derived from almost 60 rats in 10 separate experimental groups with different animal-handling histories. Although the exact origin of the difference between the two extraction methods is not yet identified, it is likely that the ethanol is a better denaturing reagent, and even very careful thawing of brain powders in 0.03N HCl by an experienced analyst did not, in our study, appear to prevent glycogenolysis in vitro. Conversion of phosphorylase to the active form is very fast and occurs during immersion freezing in liquid nitrogen (Folbergrová et al., 1978; Lust et al., 1973). More rapid hydrolysis of the outer tiers of the glycogen polymer compared with limit dextrin (Olavarria, 1960; Passonneau et al., 1967; Watanabe and Passonneau, 1973) may confer exceptional sensitivity of these structures to degradation during tissue thawing if enzyme denaturation is not adequate. Unfortunately, microwave fixation was not available for use in the present study for an experiment that may help resolve this issue (i.e., comparisons of glycogen levels in samples prepared by HCl digestion before and after rapid heat-denaturation of frozen powders). In the absence of such data, the “missing” glycogen is presumed to have been degraded in vitro during thawing in HCl; it was not completely converted to lactate. The similarity of tissue glucose levels in all extraction procedures (Table 1) suggests differential lability of glucose and glycogen to thawing and extraction.
Glycogen consumption after brain activation and its rapid, nearly complete loss during postmortem in vitro incubations of frozen brain powders demonstrates its accessibility to endogenous enzymes and its relevance to brain energy metabolism. With increasing incubation time, carbon equivalents of the glycogen that disappeared could be accounted for as lactate, glucose-phosphates, and free glucose; further analysis of postmortem metabolism was not attempted since it is unlikely to be the same as in vivo. These findings are important because they indicate that the routine conduct of glycogen assays (i.e., measurement of only glucose in the amyloglucosidase digests) will not detect even very large in vitro losses of glycogen in the frozen tissue samples if they occur during the thawing process.
Perchloric acid is commonly used for tissue extraction (Lowry and Passonneau, 1972), but is not optimal for glycogen assays because the glycogen contents of perchloric acid precipitates are erroneously low because of its hydrolysis, formation of lower molecular weight glycogen, loss of oligosaccharides to the supernatant fraction, and perhaps other unidentified factors (Nelson et al., 1984; Stetten and Stetten, 1958; Stetten et al., 1956, 1958; Table 1). An alternative extraction procedure (i.e., denaturation in 0.1N HCl in absolute methanol, followed by addition of perchloric acid) completely precipitates glycogen, but heating the precipitate in 0.03N HCl gives low glycogen values and it is necessary to solubilize the pellet in NaOH before enzymatic analysis (Folbergrová et al., 1969; Gross and Ferrendelli, 1980; Passonneau et al., 1967).
There are very few literature reports of normal brain glycogen levels exceeding 4 μmol/g, and when exceptionally high values are obtained there is an obvious concern that the broad amyloglucosidase substrate specificity may release non–glycogen-bound glucose by degradation of glycolipid or glycoprotein. Amyloglucosidase is sufficiently specific, however, to be a reliable, widely used enzyme for tissue glycogen assay, even in the presence of all cellular constituents (Bachelard and Strang, 1974; Gómez-Lechón et al., 1996; Keppler and Decker, 1974; Lust et al., 1975). Passonneau and Lauderdale (1974) obtained similar glycogen levels in their samples of standard glycogen or rodent tissues, including brain, when assayed in parallel by phosphorylase plus debrancher or amyloglucosidase; gangliosides and cerebrosides did not interfere with the two enzymatic assays in their study. Furthermore, the quantity of nonglycogen glucose released by acid hydrolysis (3-hour exposure to 1N HCl) in the Passonneau and Lauderdale (1974) study did increase the apparent glycogen level by 0.3 to 0.8 μmol/g, but this amount represents only a small fraction of the difference in apparent glycogen levels in our HCl compared with the ethanol extracts (about 4 to 7 μmol/g, Table 1). Glycoproteins are also unlikely sources of glucose because although amyloglucosidase can hydrolyze a free glucose-galactose disaccharide, this does not occur when the disaccharide is conjugated to peptides or hydroxylysine (Spiro, 1967). Selectivity of the glucose determination after monosaccharide release by amyloglucosidase was ensured in the present study by enzymatic assays with glucose oxidase or hexokinase or HPLC purification of glucose.
To summarize, on the basis of the rapid postmortem hydrolysis, high selectivity of enzymatic and HPLC assays, and relatively small quantities of polymer-bound glucose in rodent brain compared with that of glycogen in carefully handled rats, it is unlikely that analytical artifacts inflated the glycogen level in ethanol-insoluble fractions compared with HCl digests. Instead, it is probable that the ethanol procedure more effectively inactivated enzymes during in vitro thawing; exceptional care must be taken during this step. In addition, very careful control of laboratory conditions that can cause brain activation in vivo probably contributed to high resting glycogen levels in the present study.
Influence of animal handling and experimental procedures on brain glycogen level
The animal handling procedures used in our recent and present studies were designed to minimize brain activation before determination of arteriovenous differences for glucose, lactate, and oxygen and metabolic labeling to evaluate shifts in functional responses to sensory activation (Dienel et al., 2002; Madsen et al., 1995, 1999).
The rats were not fasted, and after surgical preparation and restraint they were sequestered in a brick shelter for about 3 hours with little exposure to ambient sensory stimuli. Handling before and during funnel freezing of controls was negligible because the venous catheters used to inject the thiopental were exteriorized from the shelter. Brief treatment with thiopental during funnel freezing is unlikely to have a large effect on glycogen content, although prolonged exposure to anesthesia (<1 hour) does lead to increased brain glycogen levels (Nelson et al., 1968). Overnight fasting is commonly used to deplete glycogen in peripheral tissues, thereby stabilizing plasma glucose levels during metabolic studies. Our nonfasted rats might have a higher brain glycogen content since the brain glucose level tracks that in plasma (Dienel et al., 1997; Siesjö, 1978), brain glycogen increases with elevated glucose level (Nelson et al., 1968; Watanabe and Passonneau, 1973), and in primary astrocyte cultures, the glycogen content rises about eightfold within 3 hours after feeding (Cummins et al., 1983a). Brain glycogen also increases in vivo by 50% during sleep (Karnovsky et al., 1980), and if our rats slept during the surgical recovery period, glycogen levels might have risen.
Neurotransmitter-induced glycogenolysis arising from sensory stimuli, anticipation, vigilance, fear, and stress could be expected to trigger glycogen consumption during the course of an experiment and cause a persistent reduction of brain glycogen level. The influence of the stress-responsive noradrenergic system, various neurotransmitters, and modulators of transmitter action on glycogenolysis is well documented (Cambray-Deakin et al., 1988a,b; Cummins et al., 1983b; Hertz, 1992; Magistretti et al., 1993; Subbarao and Hertz, 1990; Quach et al., 1978, 1980; Salm and McCarthy 1992; Siesjö, 1978; Stone, 1994). The stress axis and the pituitaryadrenocortical system are quickly activated even by a novel environment (e.g., simply putting rats in a new cage and into a darkened cabinet), and evoke endocrine responses, including mRNA induction, that are readily detected within 15 to 30 minutes (Sasaki et al., 1990; Wu and Childs, 1990, 1991). The blood concentrations of stress-related variables (e.g., corticosteroid) were not assessed in the present study, but the initial plasma lactate levels were low (<1 mmol/L) in all groups. The functional significance of autonomic regulation of astrocyte activity is underscored by prevention or suppression of glycogenolysis by β-adrenergic blockers or prior lesioning of the noradrenergic locus ceruleus (for a review of early studies, see Harik et al., 1982; Ingvar et al., 1983; Siesjö, 1978). Furthermore, brain glycogen is quickly consumed during a brief, gentle sensory stimulation (Madsen et al., 1999; Swanson et al., 1992; Table 1), and its restoration to control levels after a short, mild stimulus (Madsen et al., 1999; Table 1) and after energy failure (Ghajar et al., 1982; Nowak et al., 1985) is quite slow compared with other energy metabolites.
Taken together, this body of work suggests that commonly employed experimental procedures and conditions (e.g., fasting, animal cage transfers, handling, restraint, exposure to novel or threatening environments, respiratory ventilation after tracheotomy, injections and repeated blood sampling, centrifugation and other laboratory noise, chemical odors, visual stimuli, close proximity of lab personnel, and talking) may contribute to a lower brain glycogen content. When normal brain is fixed by microwave irradiation (Garriga and Cussó, 1992; Kong et al., 2002; Swanson et al., 1989, 1990), glycogen levels are among the highest reported, even though the procedure must involve some sensory stimulation and stress during placement of the animal in the apparatus; in fact, a stress response of DOPA level to restraint is detectable (Lindqvist et al., 1975). Microwave fixation has the advantage that brain enzymes are inactivated before extraction or digestion in 0.03N HCl, thereby eliminating possible in vitro glycogen loss.
However, a high power setting of the microwave apparatus is essential to obtain high glycogen levels. Kong et al. (2002) reported that glycogen in cerebral cortex is about 40% higher (about 8.6 μmol/g) when brains were fixed at 10 kW compared with 6 kW (about 5.4 μmol/g), and the glycogen content of brains fixed at 3.5 kW was equivalent to that in decapitated rats. Freeze blowing requires restraint in a small cage, as well as fixation of the snout on a toothbar and adjustment of the needles (Veech et al., 1973). These placement procedures can cause plasma glucose levels to rise, presumably reflecting stress (Wong and Tyce, 1978). Nevertheless, glycogen levels in representative freeze-blown brain samples from control rats (Ghajar et al., 1982; Veech, 1980) are within the usual range of 2 to 3 μmol/g (Passonneau et al., 1980; Siesjö, 1978). Precautions taken to minimize effects of handling and stress are rarely mentioned in the literature, and it is quite difficult to evaluate the effects of experimental conduct, laboratory conditions, and various procedures, including tissue sampling.
To sum up, the brain clearly has the capacity to greatly increase its glycogen level under normal and abnormal conditions. High levels of glycogen are responsive to physiologic and pharmacological challenge. Owing to the rapid utilization and slow restoration of glycogen, the recent “physiologic and nutritional history” of an individual experimental subject could be expected to strongly influence its brain glycogen level, perhaps contributing to the large variability of “resting” levels in sequestered rats. High energy stores and increased glycogen turnover with brain activation suggest a substantial but unrecognized contribution of astrocytes to the energetics of functional activation.
Footnotes
Acknowledgments:
The authors thank Dr. Louis Sokoloff for his support of this project.