
Abstract
We investigated whether total cerebral blood flow (CBF) was associated with brain atrophy, and whether this relation was modified by white matter lesions (WML). Within the Second Manifestations of ARTerial disease-magnetic resonance (SMART-MR) study, a prospective cohort study among patients with arterial disease, cross-sectional analyses were performed in 828 patients (mean age 58±10 years, 81% male) with quantitative flow, atrophy, and WML measurements on magnetic resonance imaging (MRI). Total CBF was measured with MR angiography and was expressed per 100 mL brain volume. Total brain volume and ventricular volume were divided by intracranial volume to obtain brain parenchymal fraction (BPF) and ventricular fraction (VF). Lower BPF indicates more global brain atrophy, whereas higher VF indicates more subcortical brain atrophy. Mean CBF was 52.0±10.2 mL/min per 100 mL, mean BPF was 79.2±2.9%, and mean VF was 2.03±0.96%. Linear regression analyses showed that lower CBF was associated with more subcortical brain atrophy, after adjusting for age, sex, vascular risk factors, intima-media thickness, and lacunar infarcts, but only in patients with moderate to severe WML (upper quartile of WML): Change in VF per s.d. decrease in CBF 0.18%, 95% CI: 0.02 to 0.34%. Our findings suggest that cerebral hypoperfusion in the presence of WML may be associated with subcortical brain atrophy.
Introduction
Brain atrophy increases with age and is a common finding on magnetic resonance imaging in the elderly (Resnick et al, 2003). It is characterized by widening of the sulci, narrowing of the gyri, as well as enlargement of the ventricles. In cognitively healthy persons, as well as in patients who already experience cognitive problems, the extent and rate of progression of global brain atrophy and ventricular enlargement predict future cognitive deterioration and conversion to Alzheimer's disease (Jack et al, 2005; Mungas et al, 2002).
Although the etiology of brain atrophy remains incompletely understood, there are indications that hypoperfusion plays a role in its development. Hypoperfusion impairs the delivery of oxygen and nutrients to the brain and may subsequently trigger cerebral neurodegeneration. The role of hypoperfusion in the pathogenesis of brain atrophy is supported by experimental data from animal studies (de la Torre, 2000). The brains of gerbils showed ventricular dilatation, cortical atrophy, and rarefaction of the white matter after clipping of the carotid arteries to cause stenosis (Kudo et al, 1993). Furthermore, in healthy and cognitively impaired humans, associations between a decrease in regional cerebral blood flow (CBF) and brain atrophy have been found (Akiyama et al, 1997; Meyer et al, 2000).
In healthy persons, the brain can compensate for hypoperfusion through the process of autoregulation by decreasing the resistance of the cerebral vascular bed and thereby maintaining an adequate cerebral perfusion. In patients who have cerebral small-vessel disease (CSVD), the cerebral vasomotor reactivity is impaired, reducing the capacity to respond adequately to a decrease in cerebral perfusion (Bakker et al, 1999; Marstrand et al, 2002). As a result, the relation between hypoperfusion and brain atrophy may be more pronounced in patients with CSVD.
Measuring perfusion in large groups of patients is not feasible, since most techniques are too invasive or involve the use of ionizing radiation (Wintermark et al, 2005). Two-dimensional phase-contrast magnetic resonance (MR) angiography is a fast, noninvasive, and reproducible method (Spilt et al, 2002) that can be used to measure total CBF. A measure of mean brain perfusion can be obtained by dividing the total CBF by the total brain parenchymal volume (Vernooij et al, 2007). The purpose of this study was to investigate the association between total CBF adjusted for brain volume and global and subcortical brain atrophy. In addition, we assessed whether the presence of white matter lesions (WML), as an indicator of CSVD, modified the relation between total CBF and brain atrophy. We hypothesized that a lower cerebral perfusion was associated with more brain atrophy and that this relation was more pronounced in patients with CVSD.
Methods
SMART and Second Manifestations of ARTerial Disease-MR Study
The Second Manifestations of ARTerial disease (SMART) study is an ongoing prospective cohort study that started in 1996. Since then, all eligible patients, aged 18 to 79 years, newly referred to the University Medical Center Utrecht with symptomatic atherosclerotic disease or risk factors for atherosclerosis, are screened for additional risk factors and severity of atherosclerosis. The baseline examination comprises an extensive questionnaire, a physical and ultrasonographic examination, and blood and urine sampling. The objectives of the SMART study are to determine the prevalence of vascular risk factors and concomitant arterial disease at other sites and to study the incidence of future cardiovascular events and its predictors in these high-risk patients. Definitions of the diseases qualifying for enrollment were reported elsewhere (Simons et al, 1999).
Between May 2001 and December 2005, as part of the SMART-MR study, an MR investigation of the brain was added to the baseline examination in patients who were included with manifest cardiovascular disease, cerebrovascular disease, peripheral arterial disease, or an abdominal aortic aneurysm (AAA) and without MR contraindications. Cardiovascular disease was defined as myocardial infarction, coronary artery bypass graft surgery, or percutaneous transluminal coronary angioplasty in the past or at inclusion. Patients with a transient ischemic attack or stroke at inclusion and patients who reported stroke in the past were considered to have cerebrovascular disease. Peripheral vascular disease was defined as surgery or angioplasty of the arteries supplying the lower extremities in history or intermittent claudication or rest pain at inclusion. Present AAA (distal aortic anteroposterior diameter ≥3 cm) or previous AAA surgery was the criterion for AAA. Cardiovascular disease was present in 59%, cerebrovascular disease in 23%, peripheral arterial disease in 22%, and an AAA in 9% of these patients. The cumulative percentage exceeds 100% because patients can have vascular disease at more than one location. The SMART study and SMART-MR study were approved by the ethics committee of our institution and written informed consent was obtained from all participants.
Magnetic Resonance Imaging Protocol
The MR investigations were performed on a 1.5-T whole-body system (Gyroscan ACS-NT, Philips Medical Systems, Best, The Netherlands). The protocol consisted of a transaxial T1-weighted gradient-echo sequence (repetition time (TR)/echo time (TE): 235/2 ms; flip angle, 80°), a transaxial T2-weighted turbo spin—echo sequence (TR/TE: 2,200/11 and 2,200/100 ms; turbo factor: 12), a transaxial T2-weighted fluid attenuating inverse recovery (FLAIR) sequence (TR/TE/inversion time (TI): 6,000/100/2,000 ms), and a transaxial inversion recovery (IR) sequence (TR/TE/TI: 2,900/22/410 ms) (field of view (FOV), 230 × 230 mm; matrix size, 180 × 256; slice thickness, 4.0 mm; slice gap, 0.0 mm; 38 slices).
Next, on the basis of a localizer MR angiographic slab in the sagittal plane, a two-dimensional phase-contrast section was positioned at the level of the skull base to measure the volume flow in the internal carotid arteries (ICAs) and the basilar artery (BA). Figure 1 illustrates the positioning of the two-dimensional phase-contrast section through the ICAs and the BA (TR/TE: 16/9 ms; flip angle, 7.5°; slice thickness, 5.0 mm; FOV, 250 × 250 mm; matrix size, 256 × 256; eight acquired signals; velocity sensitivity, 100 cm/sec).
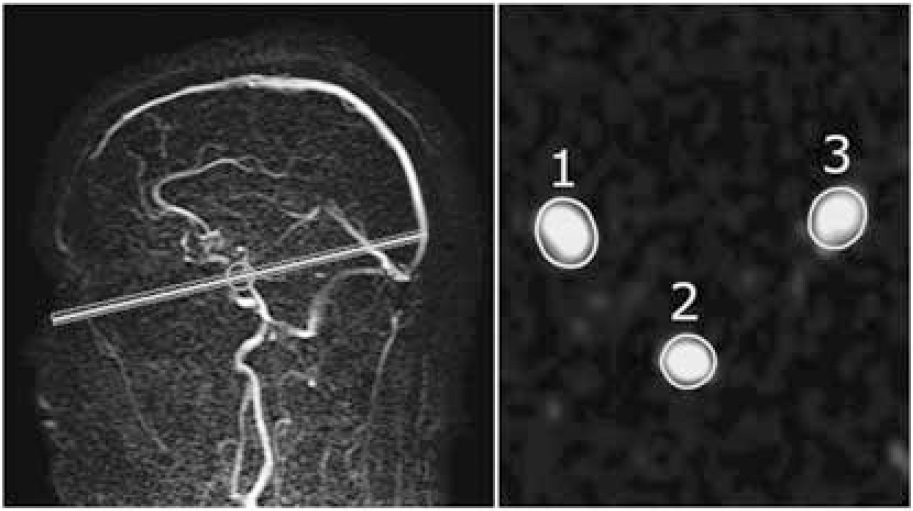
(left) Sagittal localizer magnetic resonance angiography (MRA) image illustrating the positioning of a two-dimensional phase-contrast MR angiographic slab used to measure the volume flow through the ICAs and BA. (right) Quantitative flow values were obtained by integrating across manually drawn regions of interest that enclose the vessels (1 indicates right-sided ICA; 2 indicates BA; 3 indicates left-sided ICA).
Measurement of Total Cerebral Blood Flow
Postprocessing of the flow measurements was performed by one of the authors (APAA) without knowledge of clinical or brain characteristics from the same patient. For each vessel, the spatial and time-averaged flow velocity was calculated from the phase-difference images by manually drawing a region of interest around the vessel (Figure 1). The average flow velocity in each vessel was multiplied by the cross-sectional area of the pixels in the region of interest to obtain the volume flow rate. Agreement between repeated volume flow rate measurement postprocessing procedures was shown in our research group, with a coefficient of variation of 5% (Bakker et al, 1995, 1996). The flow through the left and right ICAs and BA were summed to calculate the total CBF (mL/min).
Part of the differences in total CBF between individuals can be attributed to differences in brain size (Vernooij et al, 2007). However, our objective was to investigate if a low total CBF, relative to a subject's brain volume, was associated with brain atrophy. Therefore, we expressed total CBF per 100 mL brain parenchymal volume to obtain a measure of the mean total brain perfusion (Vernooij et al, 2007).
Brain Segmentation
Brain segmentation was performed using three different MR scans. The scans needed for this purpose were the T1-weighted gradient-echo and IR sequence and the FLAIR sequence.
The probabilistic segmentation technique has been described elsewhere (Anbeek et al, 2005). In short, two preprocessing steps were performed. The first step was an intrapatient rigid registration to compensate for motion and scan variations (Maes et al, 1997). The second preprocessing step was an automatic skull stripping of the T1 image (Smith, 2002), to define a proper region of interest for the segmentation process. The segmentation of the MR images was done with a statistical classification method called k-nearest neighbor classification (Anbeek et al, 2005). The result of the classification method is a probability value for each voxel that quantifies the amount of a specific tissue type contained in that voxel. Total volumes were calculated by multiplying these probabilities by the number and volumes of the voxels (4.0 × 0.9 × 0.9 mm). The segmentation program distinguishes gray matter, white matter, pericerebral cerebrospinal fluid (CSF), ventricles, and lesions.
Both WML and infarcts are classified as ‘lesion’ volume, as the segmentation program cannot distinguish between them. Therefore, an investigator (AMT) and neuroradiologist (TDW) visually checked the results of the segmentation analysis and made a further distinction into WML and infarct volumes by manually assigning the lesion volumes to one of these two categories.
To avoid incorporation of neuronal tissue and CSF outside the cranium, an investigator (APAA) determined the slice that included the foramen magnum. This was done by scrolling through the MR slices in a craniocaudal direction. The first slice caudal to the last slice that contained cerebellar tonsils was defined as the level of the foramen magnum. All volumes cranial to the foramen magnum were included in the segmentation results. As a result, the total brain volume includes the cerebrum, brain stem, and cerebellum.
Assessment of Brain Atrophy
The brain tissue and CSF volumes that were obtained from the segmentation program were used for the assessment of brain atrophy. The total brain volume was calculated by summing the volumes of gray and white matter and, if present, the volumes of WML or infarcts. The total intracranial volume (ICV) was calculated by summing the total brain volume and the volumes of the sulcal and ventricular CSF.
Brain parenchymal fraction (BPF), an indicator for global brain atrophy, represents the percentage of the ICV that is occupied by brain tissue. Ventricular enlargement, an indicator for subcortical brain atrophy, was assessed with the ventricular fraction (VF) and was calculated as the percentage ventricular volume of the total ICV. A lower BPF indicates more global brain atrophy and a higher VF indicates more subcortical brain atrophy.
Assessment of White Matter Lesions
The volumes of WML obtained with the segmentation program were summed to obtain the total volume of WML. We made no distinction between deep and periventricular WML, as it has been shown that deep, periventricular, and total WML are highly correlated with each other (DeCarli et al, 2005). Furthermore, we chose to use total WML volume, as it has been suggested that categorical distinctions between periventricular and deep WML are arbitrary (DeCarli et al, 2005). According to current guidelines (Hachinski et al, 2006), WML volumes were normalized for ICV to correct for differences in head size. Normalized WML (mL) was calculated by dividing the patient's WML volume by the patient's ICV and multiplying by the mean ICV of the study population (1,473 mL).
Assessment of Infarcts
The whole brain, including cortex, brain stem, and cerebellum, was visually searched for infarcts independently by an investigator (AMT) and neuroradiologist (TDW). Discrepancies in rating were re-evaluated in a consensus meeting. Both were blinded for the history and diagnosis of the patient. Infarcts were defined as focal lesions of at least 3 mm in diameter, with signal intensity corresponding to CSF: hyperintense on T2-weighted images and low signal on the FLAIR image. They were differentiated from WML on FLAIR, which were of high signal intensity. Dilated perivascular spaces were distinguished from infarcts on the basis of their location (along perforating or medullary arteries, often symmetrical bilaterally, usually in the lower third of the basal ganglia or in the centrum semiovale), form (round/oval), and the absence of gliosis (Giele et al, 2004). The location, affected flow territory, and type were scored for every infarct. We defined lacunar infarcts as infarcts sized 3 to 15 mm and located in the subcortical white matter, thalamus, or basal ganglia.
Vascular Risk Factors
Risk factors were assessed by means of an extensive questionnaire and physical, laboratory, and ultrasonographic examinations. The subjects' height and weight were measured, and the body mass index was calculated (kg/m2). Systolic and diastolic blood pressures (mm Hg) were measured twice with a sphygmomanometer and the average of the two measurements was obtained. Hypertension was defined as mean systolic blood pressure ≥140 mm Hg or mean diastolic blood pressure ≥95 mm Hg or use of antihypertensive drugs. A fasting venous blood sample was taken to determine glucose and lipid levels. Diabetes mellitus was defined as glucose ≥7.0 mmol/L or use of oral antidiabetic drugs or insulin. Hyperlipidemia was defined as total cholesterol >5.0 mmol/L, low-density lipoprotein cholesterol>3.2 mmol/L, or use of lipid-lowering drugs. Smoking was assessed with the use of pack years. To calculate pack years of smoking, the average number of cigarettes smoked per day was divided by 20 and then multiplied by the number of years of cigarette smoking. Ultrasonography was performed to measure the intima-media thickness (mm) in the left and right common carotid arteries, represented by the mean value of six measurements (Kanters et al, 1998).
Study Sample
A total of 1,309 patients were investigated in the SMART-MR study. Segmentation data were missing in 265 patients (missing MR sequences needed for the segmentation analyses, due to a temporary change in MR protocol (n = 192), MR data irretrievable (n = 19), missing FLAIR sequence (n = 14), motion or other artifacts (n = 40)). As a result, segmentation data were available for 1,044 patients. There were no differences in age, sex, and vascular risk factors between patients with and without segmentation results. Of the remaining 1,044 patients, CBF measurements were missing in 71 patients (due to a missing magneto-optical disc (n = 50), flow measurement failed (n = 14), and flow measurement not performed (n = 7)). Patients without available flow measurements were more often female (36 versus 20%) and more often had hypertension (64 versus 51%). Other patient characteristics were comparable between patients with and without flow measurements. We excluded 114 patients with one or more cortical infarcts, as the brain volume decrease in these patients was primarily the direct effect of tissue loss in the infarcted region. Finally, in 31 patients, not all cardiovascular risk factors were assessed. Consequently, the analyses were performed in 828 patients.
Data Analysis
We used linear regression analysis to investigate changes in BPF and VF per s.d. increase in CBF. The analyses were performed in four steps. In the first model, we adjusted for age and sex. In the second model, we additionally adjusted for hypertension, diabetes mellitus, smoking, body mass index, hyperlipidemia, intima-media thickness, and presence of lacunar infarcts. In the third model, we also adjusted for WML volume. As the volume of WML was positively skewed, we log-transformed WML volume to normalize the distribution. To assess if the relation between CBF and measures of brain atrophy was modified in the presence of WML, an interaction term was entered in the final model. If the regression analyses revealed an interaction between CBF and volumes of WML (P < 0.05), stratified analyses were performed according to volumes of WML. Patients were then categorized as having no or few WML (lower three quartiles of WML volume) or moderate to severe WML (upper quartile of WML volume).
In all analyses, 95% confidence intervals are given. SPSS version 14.0 (Chicago, IL, USA) was used to analyze our data.
Results
In the study sample of 828 patients, the mean normalized CBF (±s.d.) was 52.0±10.2 mL/min per 100 mL, the mean BPF (±s.d.) was 79.2±2.9%, and the mean VF (±s.d.) was 2.03±0.96%.
Patient characteristics according to tertiles of CBF are given in Table 1. Patients with a lower CBF were older and more often male. Vascular risk factors were also more prevalent in patients with a lower CBF; they had a higher body mass index and more frequently hypertension and diabetes. Furthermore, intima-media thickness, a measure for subclinical atherosclerosis, was higher in patients with a lower CBF; volumes of WML were larger, and one or more lacunar infarcts on magnetic resonance imaging were more often present.
Patient characteristics according to tertiles of normalized total CBF (mL/min per 100 mL) (n = 828)
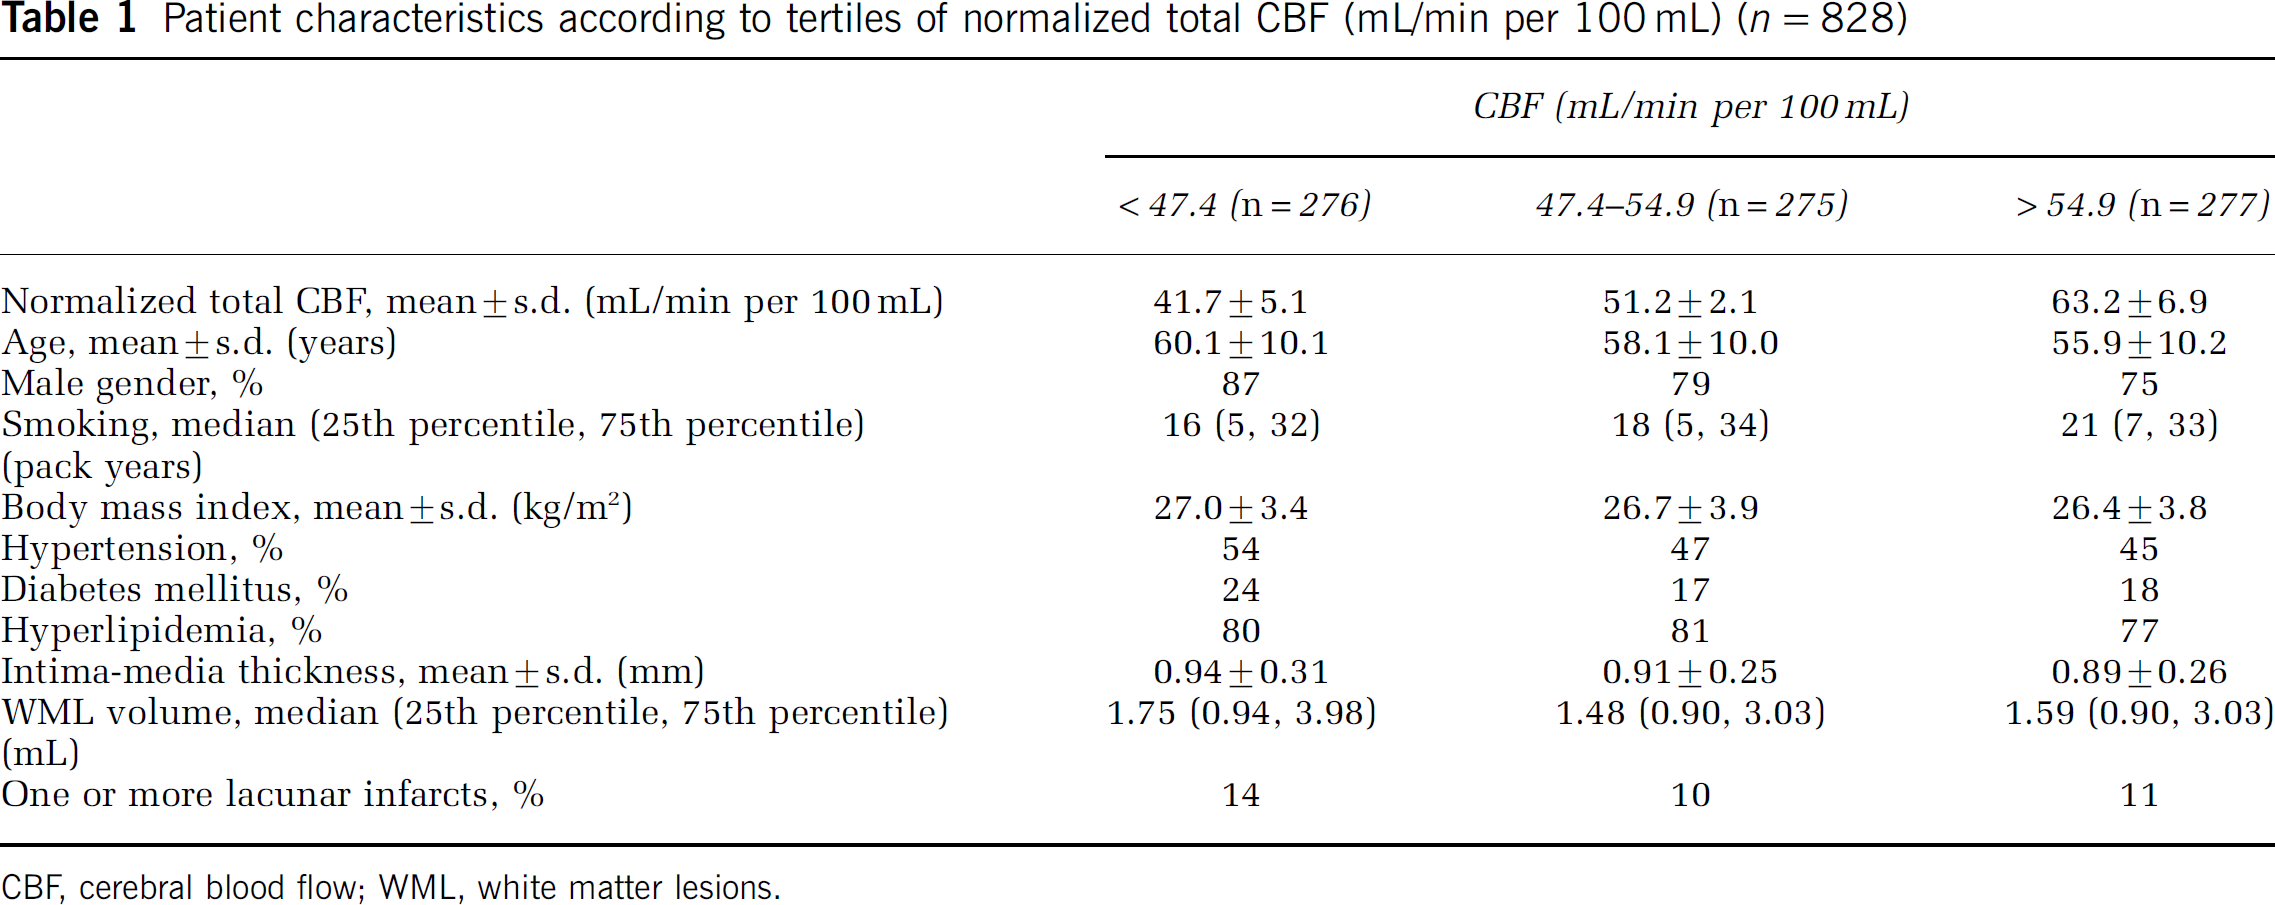
CBF, cerebral blood flow; WML, white matter lesions.
The results for the linear regression analysis with BPF and VF as dependent variables are given in Table 2. No relation between CBF and BPF was found. Furthermore, no interaction between normalized CBF and WML volume was found (interaction term P = 0.11). A small but significant relation was found between an increase in CBF and a decrease in VF, independent of possible confounders and WML volume. When we included the interaction term in the model, a significant interaction between CBF and WML volume for VF was found (interaction term P < 0.001). Therefore the analyses were repeated across strata of WML.
Results of linear regression analyses with CBF as independent variable and measures of brain atrophy as dependent variable (n = 828)
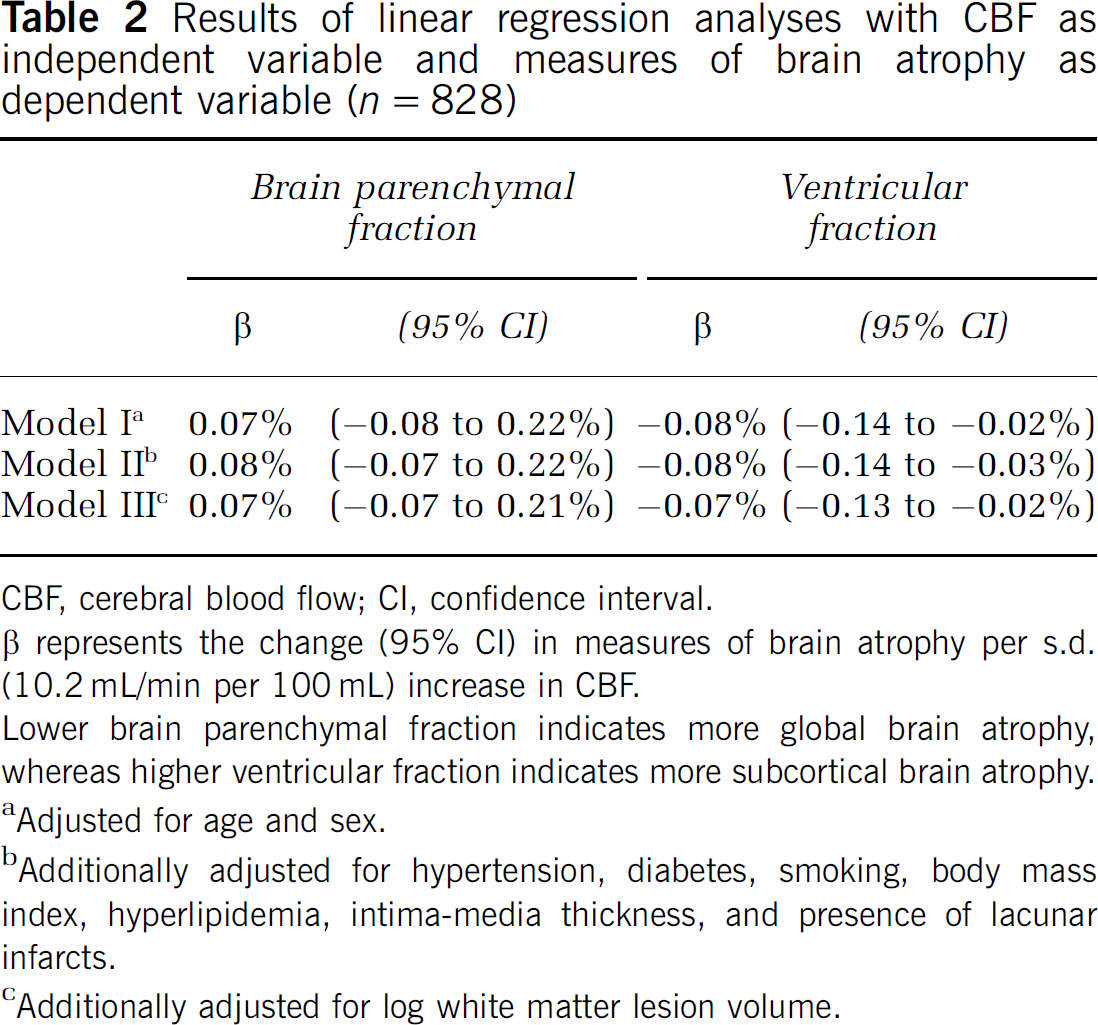
CBF, cerebral blood flow; CI, confidence interval.
β represents the change (95% CI) in measures of brain atrophy per s.d. (10.2 mL/min per 100 mL) increase in CBF.
Lower brain parenchymal fraction indicates more global brain atrophy, whereas higher ventricular fraction indicates more subcortical brain atrophy.
Adjusted for age and sex.
Additionally adjusted for hypertension, diabetes, smoking, body mass index, hyperlipidemia, intima-media thickness, and presence of lacunar infarcts.
Additionally adjusted for log white matter lesion volume.
The results of the stratified analysis are given in Table 3. In the group of patients with no or few WML (lower three quartiles of WML volume) no relation was observed between CBF and VF. However, in the group of patients with moderate to severe WML (upper quartile), there was a relation between an increase in CBF and a decrease in VF after adjusting for age and sex. This relation remained after additional adjustment for vascular risk factors, intima-media thickness and presence of one or more lacunar infarcts. In perspective of the mean VF of 2.03%, a change in VF of 0.18% per s.d. increase in CBF implies a strong relation.
Results of linear regression analyses with CBF as independent variable and ventricular fraction as dependent variable
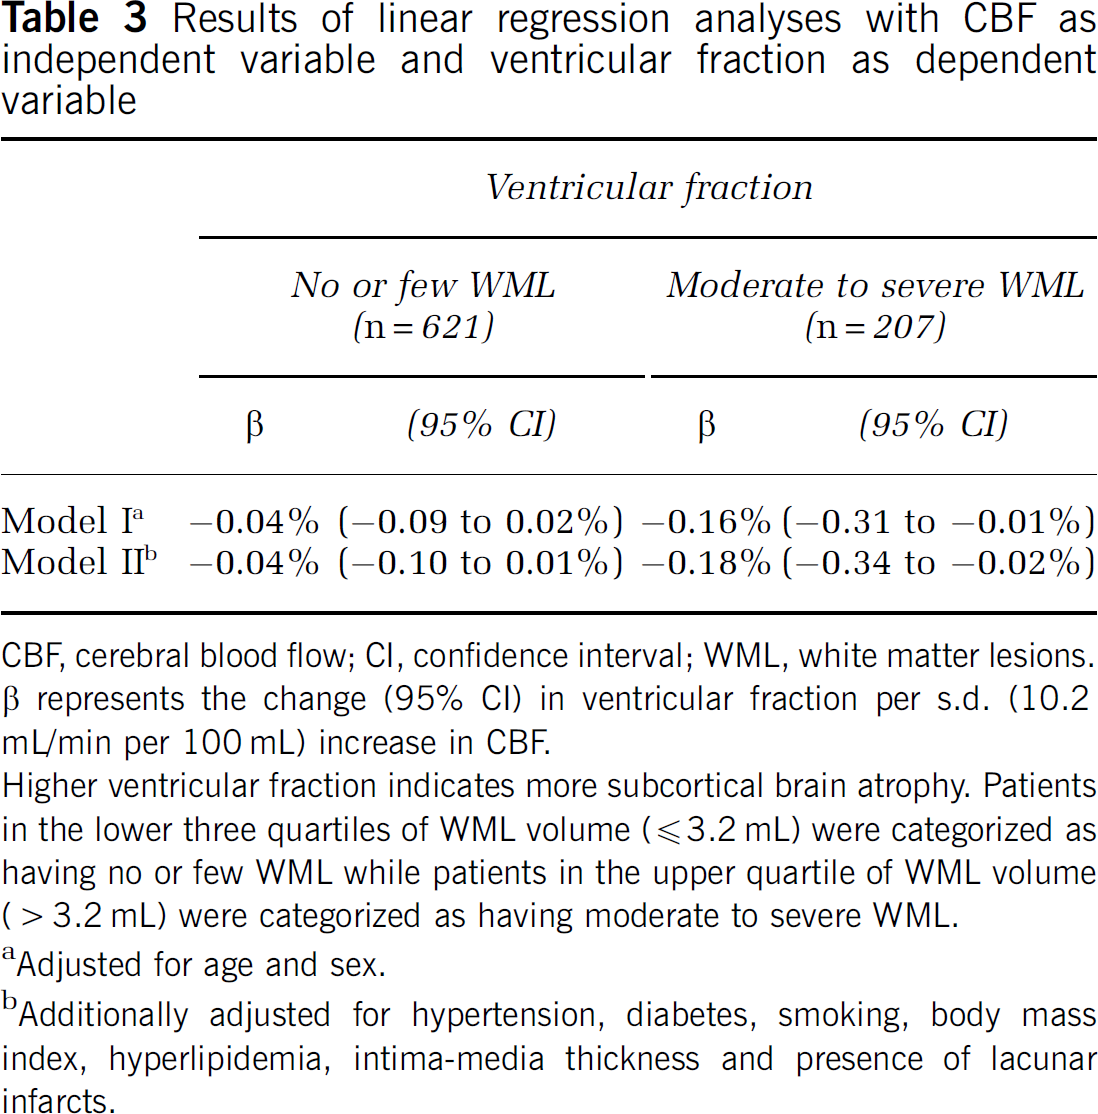
CBF, cerebral blood flow; CI, confidence interval; WML, white matter lesions. β represents the change (95% CI) in ventricular fraction per s.d. (10.2 mL/min per 100 mL) increase in CBF.
Higher ventricular fraction indicates more subcortical brain atrophy. Patients in the lower three quartiles of WML volume (≦3.2 mL) were categorized as having no or few WML while patients in the upper quartile of WML volume (> 3.2 mL) were categorized as having moderate to severe WML.
Adjusted for age and sex.
Additionally adjusted for hypertension, diabetes, smoking, body mass index, hyperlipidemia, intima-media thickness and presence of lacunar infarcts.
Discussion
Among patients with manifest arterial disease, we observed that a lower total CBF was related to more subcortical, but not global, brain atrophy if moderate to severe WMLs were present. In patients with no or few WML, no relation was observed between total CBF and brain atrophy.
The strengths of our study are: first, the large number of patients included, which made precise estimates possible. Second, we used an accurate segmentation program to calculate volumes of WML and quantitative measures of cerebral atrophy, rather than visual rating scales, thereby increasing the power to detect a relation between CBF and measures of atrophy. Third, as brain volume measurements were available, we had the possibility to adjust the total CBF for brain size, thereby removing residual confounding due to differences in brain size between patients. Fourth, we had extensive information on cardiovascular risk factors and other possible confounders, which made it possible to determine unbiased estimates of the relation between CBF and measures of atrophy.
A limitation of our study is the cross-sectional nature, which makes it difficult to disentangle cause from consequence. Although we hypothesized that a decrease in CBF leads to brain atrophy, we cannot exclude the possibility that the lower total CBF was the result of a decrease in metabolic demand caused by brain atrophy. In healthy aging, there is an age-associated decrease in brain volume (Scahill et al, 2003), primarily caused by a decrease in neuronal size and partly due to a reduction in numbers of neurons caused by apoptosis (Anderson and Rutledge, 1996; Mattson et al, 2001; Peters et al, 1998). As the metabolism of the neurons that remain is also reduced, a lower CBF is sufficient to maintain neuronal viability (Shaw et al, 1984). However, if the decrease in CBF was a consequence of brain atrophy, we would have expected to find a relation between global brain atrophy and CBF, because the regional CBF in the cortical gray matter is two to three times higher than in the cerebral white matter. Furthermore, the metabolic activity is larger in the cortical gray matter, which contains the majority of cerebral neurons. Therefore, we believe that it is unlikely that brain atrophy preceded a decrease in CBF.
A possible explanation for the observed relation between lower total CBF and subcortical brain atrophy may be the vascular architecture of the cerebral white matter. The cerebral white matter is primarily supplied by long medullary penetrating arteries, which originate from the large cerebral arteries and run toward the white matter perpendicular to the brain surface. These vessels give off short branches that irrigate the deep white matter. The periventricular white matter is supplied by perforating branches of the medial cerebral artery. As there are no anastomoses between the deep perforating arteries and the medullary arterioles, the periventricular white matter is an arterial border zone and particularly susceptible to injury caused by a decrease in CBF (Pantoni and Garcia, 1997). As a result, cerebral hypoperfusion may result in ischemic damage in the white matter, which, in turn, may lead to loss of brain parenchyma and ex vacuo ventricular enlargement. Our finding that a lower CBF was not related to ventricular enlargement in patients with no or few WML suggests that cerebral hypoperfusion alone may not be sufficient to induce subcortical brain atrophy.
White matter lesions are the result of CSVD and are associated with an increase in cerebrovascular resistance and an incapacity to respond to decreases in cerebral perfusion pressure (Marstrand et al, 2002). Although several vascular risk factors may be involved in the pathogenesis of CSVD, hypertension is considered the most important one (de Leeuw et al, 2002, 2004; Dufouil et al, 2001; van Dijk et al, 2004). The chronic hemodynamic stress of hypertension causes thickening and hardening of the walls of arterioles with narrowing of the lumen. Therefore, only the combination of a decrease in CBF and an impaired autoregulation in the cerebral white matter may result in subcortical brain atrophy.
As our study sample consisted of subjects having atherosclerotic disease, we do not know if our results can be generalized to the general population. However, as the relation between CBF and ventricular enlargement was independent of severity of atherosclerosis and was not explained by the presence of vascular risk factors and lacunar infarcts, we could argue that all persons with a decrease in CBF in the presence of moderate to severe WML may be at risk of developing subcortical brain atrophy. As WMLs are common in the general population (Launer, 2004), our results may be relevant for large groups of elderly.
Furthermore, although we do not know the dementia status of our study population, it is unlikely that our results can be explained by demented patients, as our study was performed in a relative young population with a mean age of 58 years. It is therefore probable that the subcortical brain atrophy in our study population is still in its early phase. If future studies can confirm that a decrease in CBF precedes the development of subcortical brain atrophy, it may be interesting to investigate if changing the CBF can prevent brain atrophy and subsequent cognitive decline.
In conclusion, we found that a lower total CBF was associated with ventricular enlargement, but only in the presence of moderate to severe WML. Prospective studies are needed to investigate the directionality of the relation between total cerebral blood flow and brain atrophy and to confirm the hypothesis that a decrease in total CBF in the presence of WML precedes the development of subcortical brain atrophy and cognitive decline.
Footnotes
Acknowledgements
We gratefully acknowledge the members of the SMART Study Group of University Medical Center Utrecht: A Algra, MD, PhD, Julius Center for Health Sciences and Primary Care and Rudolf Magnus Institute for Neurosciences, Department of Neurology; PA Doevendans, MD, PhD, Department of Cardiology; BC Eikelboom, MD, PhD; FL Moll, MD, PhD, Department of Vascular Surgery; DE Grobbee, MD, PhD and GEHM Rutten, MD, PhD, Julius Center for Health Sciences and Primary Care; LJ Kappelle, MD, PhD, Department of Neurology; FLJ Visseren, MD, PhD, Department of Vascular Medicine.
Disclosure
The authors report no conflicts of interest.