
Abstract
Reduced cerebral perfusion may contribute to the development of cerebrovascular and neurodegenerative diseases. Little is known on cerebral perfusion in the general population, as most measurement techniques are too invasive for application in large groups of healthy individuals. Total cerebral blood flow (tCBF) can be noninvasively measured by magnetic resonance imaging (MRI) but is highly correlated with brain volume. We calculated total brain perfusion by dividing tCBF by brain volume, and we investigated determinants of total brain perfusion in comparison with tCBF. Secondly, we studied whether persons with a low tCBF or low total brain perfusion have a larger volume of white matter lesions (WML). This study is based on 892 persons aged 60 to 91 years from the Rotterdam Study, a population-based cohort study. We performed two-dimensional (2D) phase-contrast MRI for tCBF measurement. Brain volume and WML volume were quantitatively assessed. Cardiovascular determinants were assessed by interview and physical examination. We assessed associations between cardiovascular determinants and flow measures with linear regression models, adjusted for age and sex. Associations between tCBF or total brain perfusion and WML volume were assessed using general linear models. We found that determinants of tCBF and total brain perfusion differed largely due to the large influence of brain volume on tCBF values. Persons with low total brain perfusion had a significantly larger WML volume compared with those with high total brain perfusion. Prospective studies are required to unravel whether hypoperfusion contributes to WML formation or that tissue damage, manifested by WML, leads to brain hypoperfusion.
Introduction
Cerebral perfusion and its regulation are of great importance for the constant supply of oxygen and nutrients to the brain, which are needed to maintain normal brain function and structural integrity (Kirkness, 2005). Reductions in cerebral perfusion have been reported in patients with transient ischemic attack, ischemic stroke, and Alzheimer's disease (Matsuda, 2001; Vorstrup et al, 1983; Yao and Fujishima, 2001). In addition, perfusion was found to be reduced in the white matter of patients with white matter lesions (WML) (Markus et al, 2000; O'Sullivan et al, 2002). This might imply that impaired cerebral perfusion contributes to the development of cerebrovascular and neurodegenerative brain disease. Cerebral perfusion and its correlates have hardly been investigated in the general population. This is mainly related to the invasiveness and complexity of most measurement techniques, such as positron emission tomography and xenon-computed tomography (Hoeffner, 2005; Wintermark et al, 2005). In the past decade, a noninvasive magnetic resonance imaging (MRI) technique, two-dimensional (2D) phase-contrast MRI, has been developed for fast and accurate measurement of total cerebral blood flow (tCBF) by summing blood flow in the internal carotid and basilar arteries (Marks et al, 1992; Spilt et al, 2002a). This MRI technique has shown to be applicable in large populations of healthy subjects (Buijs et al, 1998; Spilt et al, 2002a; van Raamt et al, 2006), and was recently used to study determinants of tCBF in patients with symptomatic vascular disease (Buijs et al, 1998; Spilt et al, 2002a; van Raamt et al, 2006). However, a complicating factor is that tCBF strongly depends on the amount of brain tissue, as it is closely coupled to the cerebral oxidative metabolism (Strandgaard, 1991). To account for this, we introduce total brain perfusion, calculated by dividing tCBF by brain volume. In the general population, we investigated how cardiovascular determinants relate to total brain perfusion in comparison with tCBF. Furthermore, we studied how total brain perfusion and tCBF each relate to WML volume.
Methods
Participants
This study is embedded within the Rotterdam Study, a large population-based cohort study in the Netherlands that started in 1990 (Ott et al, 1998), and is aimed at investigating determinants of various chronic diseases among elderly participants. The original study population consisted of 7,983 participants aged 55 years and older within the Ommoord area, a suburb of Rotterdam. In 2000, the cohort was extended with 3,011 persons (≥55 years) who were living in the study area and had not been included before. Participants are invited at regular time intervals (approximately once every 3 years) to the research center for follow-up examinations (interview and physical examination). From August 2005 to May 2006, we randomly selected 1,073 members of this extended cohort for the current MRI study, the Rotterdam Scan Study. We excluded individuals who were demented (assessed by a previously described three-step protocol (Ott et al, 1998)) or had MRI contraindications (including claustrophobia). The Institutional Review Board approved the study. A total of 975 persons were eligible, of whom 907 participated and gave written informed consent (response 93%). This population consisted of more than 95% of persons of Caucasian descent. Owing to physical inabilities (e.g., back pain), imaging could not be performed or completed in 12 individuals (1.3%). A total of 895 complete MRI examinations were performed.
Magnetic Resonance Imaging Scan Protocol
Magnetic resonance imaging of the brain was performed on a 1.5-T MRI scanner (Signa Excite II, General Electric Healthcare, Milwaukee, WI, USA). An eight-channel head coil was used for reception of the signal. For flow measurement, 2D phase-contrast imaging was performed similar to techniques described previously (Buijs et al, 1998; Spilt et al, 2002b). First, a sagittal 2D phase-contrast MRI angiographic scout image was performed (repetition time (TR) = 24 ms, echo time (TE) = 9 ms, field of view (FOV) = 32 cm2, matrix = 256 × 160, flip angle = 10°, number of excitations (NEX) = 1, bandwidth (BW) = 8.06 kHz, velocity encoding = 60 cm/sec, slice thickness = 60 mm). Acquisition time was 12 secs. On this scout image, a transverse imaging plane perpendicular both to the precavernous portion of the internal carotid arteries and to the middle part of the basilar artery was chosen (Figure 1A) for a 2D gradient-echo phase-contrast sequence (TR = 20 ms, TE = 4 ms, FOV = 19 cm2, matrix = 256 × 160, flip angle = 8°, NEX = 8, BW = 22.73 kHz, velocity encoding = 120 cm/sec, slice thickness = 5 mm). Acquisition time was 51 secs, and no cardiac gating was performed (Spilt et al, 2002a).
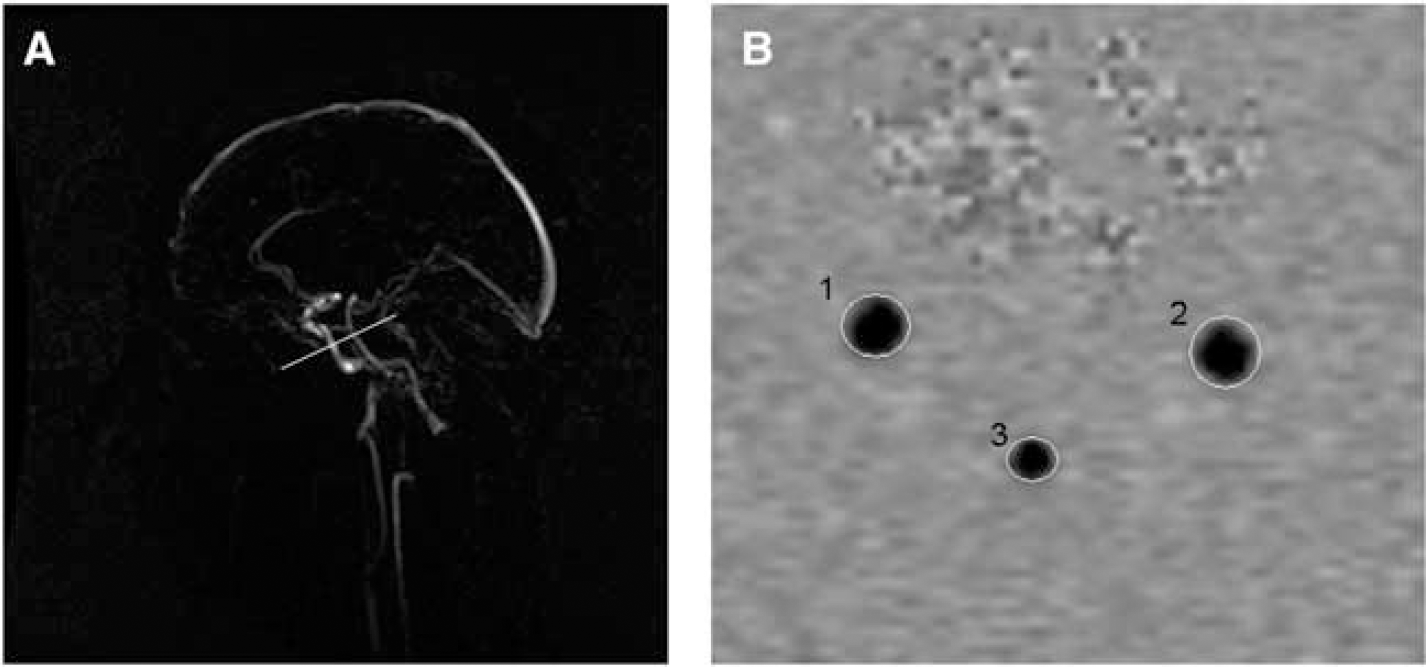
Two-dimensional (2D) phase-contrast MRI flow measurement. (
We further performed three high-resolution axial MRI sequences, that is a T1-weighted three-dimensional fast radio frequency spoiled gradient recalled acquisition in steady state with an inversion recovery prepulse (FASTSPGR-IR) sequence (TR= 13.8 ms, TE = 2.8 ms, inversion time (TI) = 400 ms, FOV = 25 cm2, matrix = 416 × 256, flip angle = 20°, NEX = 1, BW = 12.50 kHz, 96 slices with slice thickness 1.6 mm zero-padded to 0.8 mm), a proton density-weighted sequence (TR= 12,300 ms, TE = 17.3 ms, FOV = 25 cm2, matrix = 416 × 256, NEX = 1, BW = 17.86 kHz, 90 slices with slice thickness 1.6 mm), and a fluid attenuated inversion recovery sequence (TR = 8,000 ms, TE = 120 ms, TI = 2,000 ms, FOV = 25 cm2, matrix = 320 × 224, NEX = 1, BW = 31.25 kHz, 64 slices with slice thickness 2.5 mm). All slices were contiguous.
Measurement of Total Cerebral Blood Flow and Total Brain Perfusion
Flow was calculated from the phase-contrast images using interactive data language-based custom software (Cinetool version 4, General Electric Healthcare, Milwaukee, WI, USA). Circular to elliptical regions of interest (ROIs) were drawn manually around both carotids and the basilar artery on the phase-contrast images (Figure 1B). These ROIs encompassed the entire lumen of the vessel. The value of mean signal intensity in each ROI reflected the flow velocity in the vessel (cm/sec). Flow (in mL/sec) was calculated by multiplying the average velocity with the cross-sectional area of the vessel. To calculate tCBF (in mL/min), flow rates for the carotid arteries and the basilar artery were summed and multiplied by 60 secs/min. This method is similar to flow measurement methods described previously (Buijs et al, 1998; Spilt et al, 2002b). Two independent experienced technicians performed all manual ROI drawing and subsequent flow measurements. Double rating was performed in 533 scans, yielding inter rater correlations >0.94 for all vessels, indicating excellent agreement. In three persons, tCBF could not be measured due to incorrect positioning of the phase-contrast imaging plane, leaving a total of 892 persons in our analysis.
We calculated total brain perfusion (in mL/min per 100 mL) by dividing tCBF (mL/min) by each individual's brain volume (mL) and multiplying the obtained result by 100.
Assessment of Brain Volume and White Matter Lesion Volume
For the assessment of brain volume and WML volume, the structural MRI scans (T1-weighted, proton density-weighted, and fluid attenuated inversion recovery) were transferred offline to a Linux workstation. Preprocessing steps and the classification algorithm have been described elsewhere (Ikram et al, 2007). In summary, preprocessing included coregistration, nonuniformity correction, and variance scaling. We used the k-nearest-neighbor classifier (Anbeek et al, 2005) to classify scans into brain tissue and cerebrospinal fluid. White matter lesions were classified as a separate tissue class using the same method. All segmentation results were visually inspected and if needed manually corrected. Manual editing of WML was necessary in 67 scans (7.6%), owing to WML segmentation problems, which were mainly caused by motion artifacts. In 12 persons, metallic dental implants caused severe artifacts, which necessitated exclusion from analysis. To remove noncerebral tissue, for example, eyes, skull, and cerebellum, we applied nonrigid registration (Rueckert et al, 1999) to register to each brain a template scan in which these tissues were manually masked. Brain volume and WML volume were calculated by summing all voxels of the corresponding tissue class across the whole brain, to yield volumes in mL.
Assessment of Infarcts
Two physicians (MWV and MAI) who were masked to all clinical information rated infarcts on T1-weighted, proton density-weighted, and fluid attenuated inversion recovery sequences. Infarcts were defined as lesions ≥3 mm in size exhibiting the same signal characteristics as cerebrospinal fluid on all sequences, and, if located supratentorially, with a hyperintense rim on the fluid attenuated inversion recovery sequence. Cortical infarcts were those infarcts showing involvement of cortical gray matter. All infarcts were confirmed by an experienced neuroradiologist (AvdL).
Cardiovascular Determinants
We obtained information on cardiovascular determinants from interview and physical examination performed at the participants' regular visit to the research center preceding the MRI examination (average time interval between preceding visit and MRI was 1.2 years, and standard deviation (s.d.) of 0.5). Blood pressure was measured twice on the right arm with a random-zero sphygmomanometer. We used the average of these two measurements. We calculated pulse pressure by subtracting diastolic blood pressure from systolic blood pressure. Hypertension was defined in two ways. First, we defined hypertension according to grades 2 and 3 of 2003 WHO criteria (Whitworth, 2003), as a systolic blood pressure ≥160 mm Hg and/or a diastolic blood pressure ≥100 mm Hg, and/or the use of blood pressure-lowering medication. Second, we applied less stringent criteria and also classified persons as hypertensive according to grade 1 of WHO criteria (systolic blood pressure ≥140 mm Hg and/or a diastolic blood pressure ≥90 mm Hg, and/or the use of blood pressure-lowering medication). We considered diabetes mellitus present if a person was taking oral antidiabetics or insulin, or if fasting plasma glucose was ≥7 mmol/L (≥126 mg/dL). A physician assessed participants' smoking habits, and smoking status was further classified as current, former, or never. Body mass index (BMI) was calculated by dividing weight (kg) by the square of height (m2). Assessment of significant carotid stenosis (>50%) was performed using 5-MHz pulsed Doppler ultrasonography through interpretation of velocity profiles according to standard criteria (Taylor and Strandness, 1987).
Data Analysis
We assessed the association of cardiovascular determinants with tCBF and total brain perfusion using multiple linear regression models. Because the distribution of WML volume was skewed leftward, we used the natural log-transformed (ln) variable for analysis as a continuous variable. To calculate the WML volume for quartiles of tCBF and total brain perfusion, we used analysis of covariance. Next, we used linear regression models, to assess the linear relation between both flow measures (per s.d.) and WML volume. As it is known that hypertension influences autoregulatory functions in the brain (Barry, 1985; Paulson et al, 1990), we also investigated this relation for persons with and without hypertension separately and assessed the presence of any interaction. All linear regression analyses were adjusted, when appropriate, for age and sex. Furthermore, the analyses with WML volume as outcome measure were additionally adjusted for blood pressure, smoking status, diabetes, and BMI. All analyses were performed using the statistical software package SPSS (Chicago, IL, USA), version 11.0.1 for Windows.
Results
Table 1 presents the characteristics of the study population. Mean age of the population at time of MRI was 67.5 years (s.d. = 5.5; age range = 60.7 to 91.7 years), with 451 (50.6%) women.
Characteristics of the study population (N = 892)
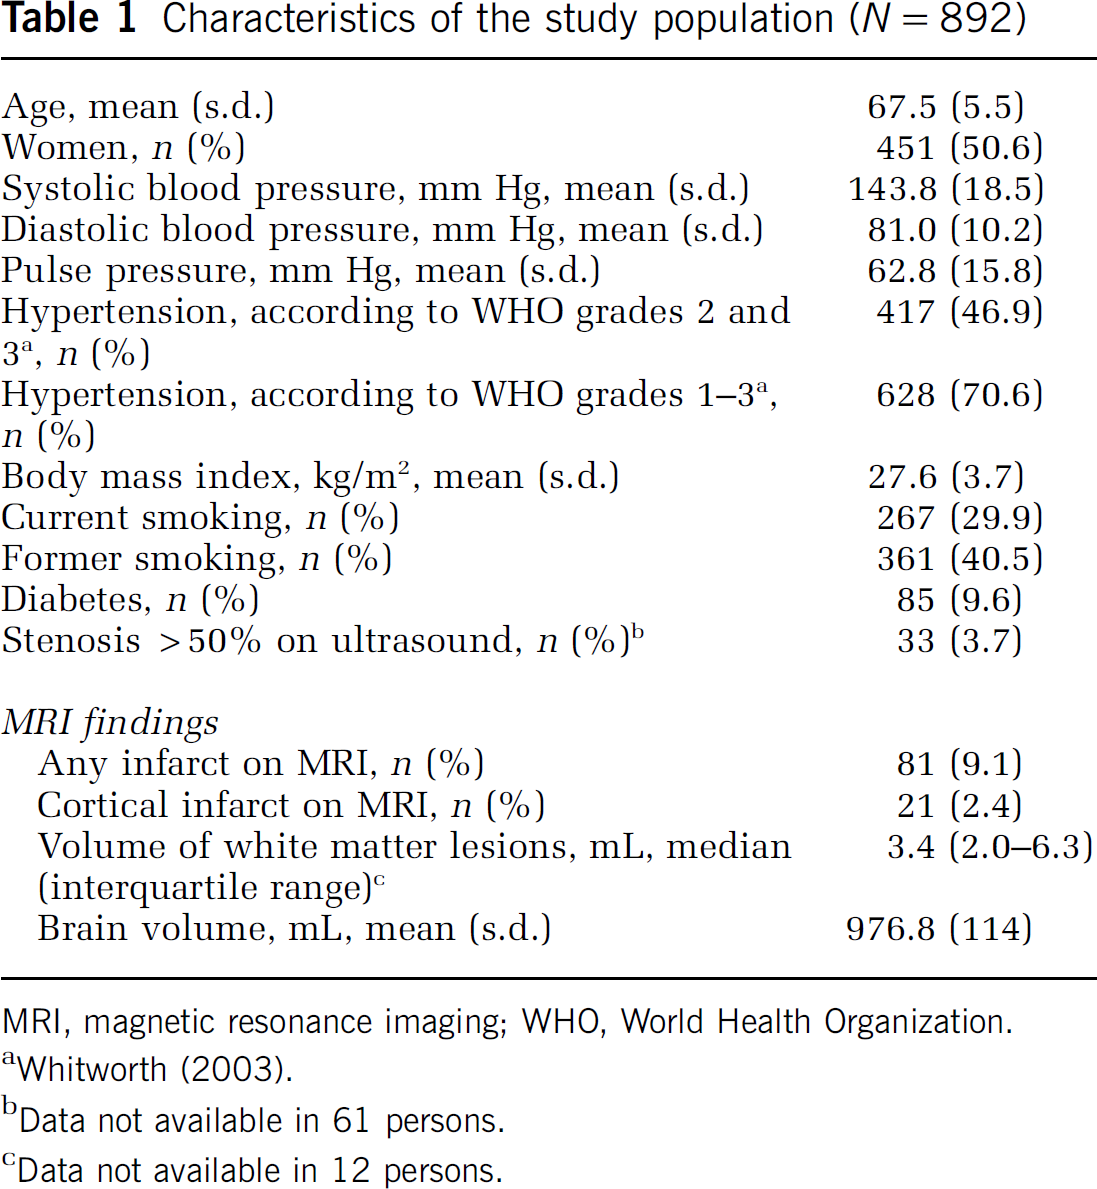
MRI, magnetic resonance imaging; WHO, World Health Organization.
Data not available in 61 persons.
Data not available in 12 persons.
Mean tCBF was 497.4 mL/min (s.d. 86.2) and mean total brain perfusion was 51.2 mL/min per 100 mL (s.d. 8.8). In Table 2, results for tCBF and total brain perfusion are presented for men and women separately. Women had a significantly lower basilar blood flow than men (P < 0.001), whereas flow in the carotid arteries did not differ between sexes (Table 2). As expected, persons with a larger brain volume had a higher tCBF (36.00 mL/min increase in tCBF per s.d. increase in brain volume; 95% confidence interval (CI): 30.00; 42.10).
Total cerebral blood flow and total brain perfusion
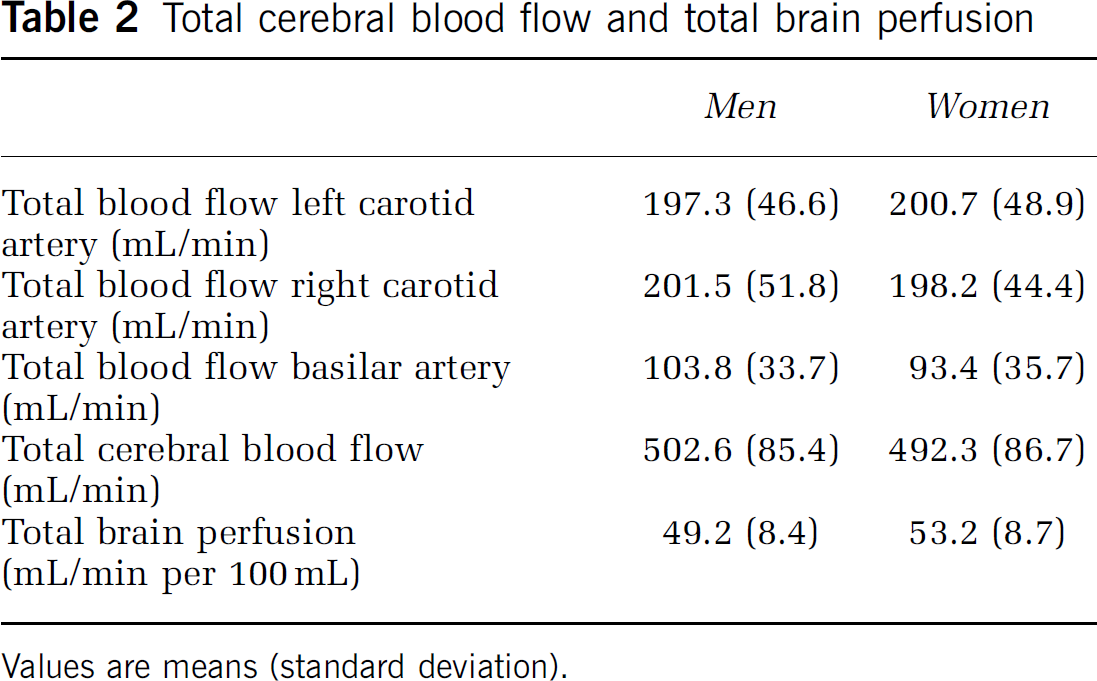
Values are means (standard deviation).
We found that tCBF decreased with increasing age and was lower for women than men (Table 3). Presence of hypertension, a higher BMI, former smoking, and presence of carotid stenosis were all associated with lower tCBF.
Cardiovascular determinants, total cerebral blood flow, and total brain perfusion
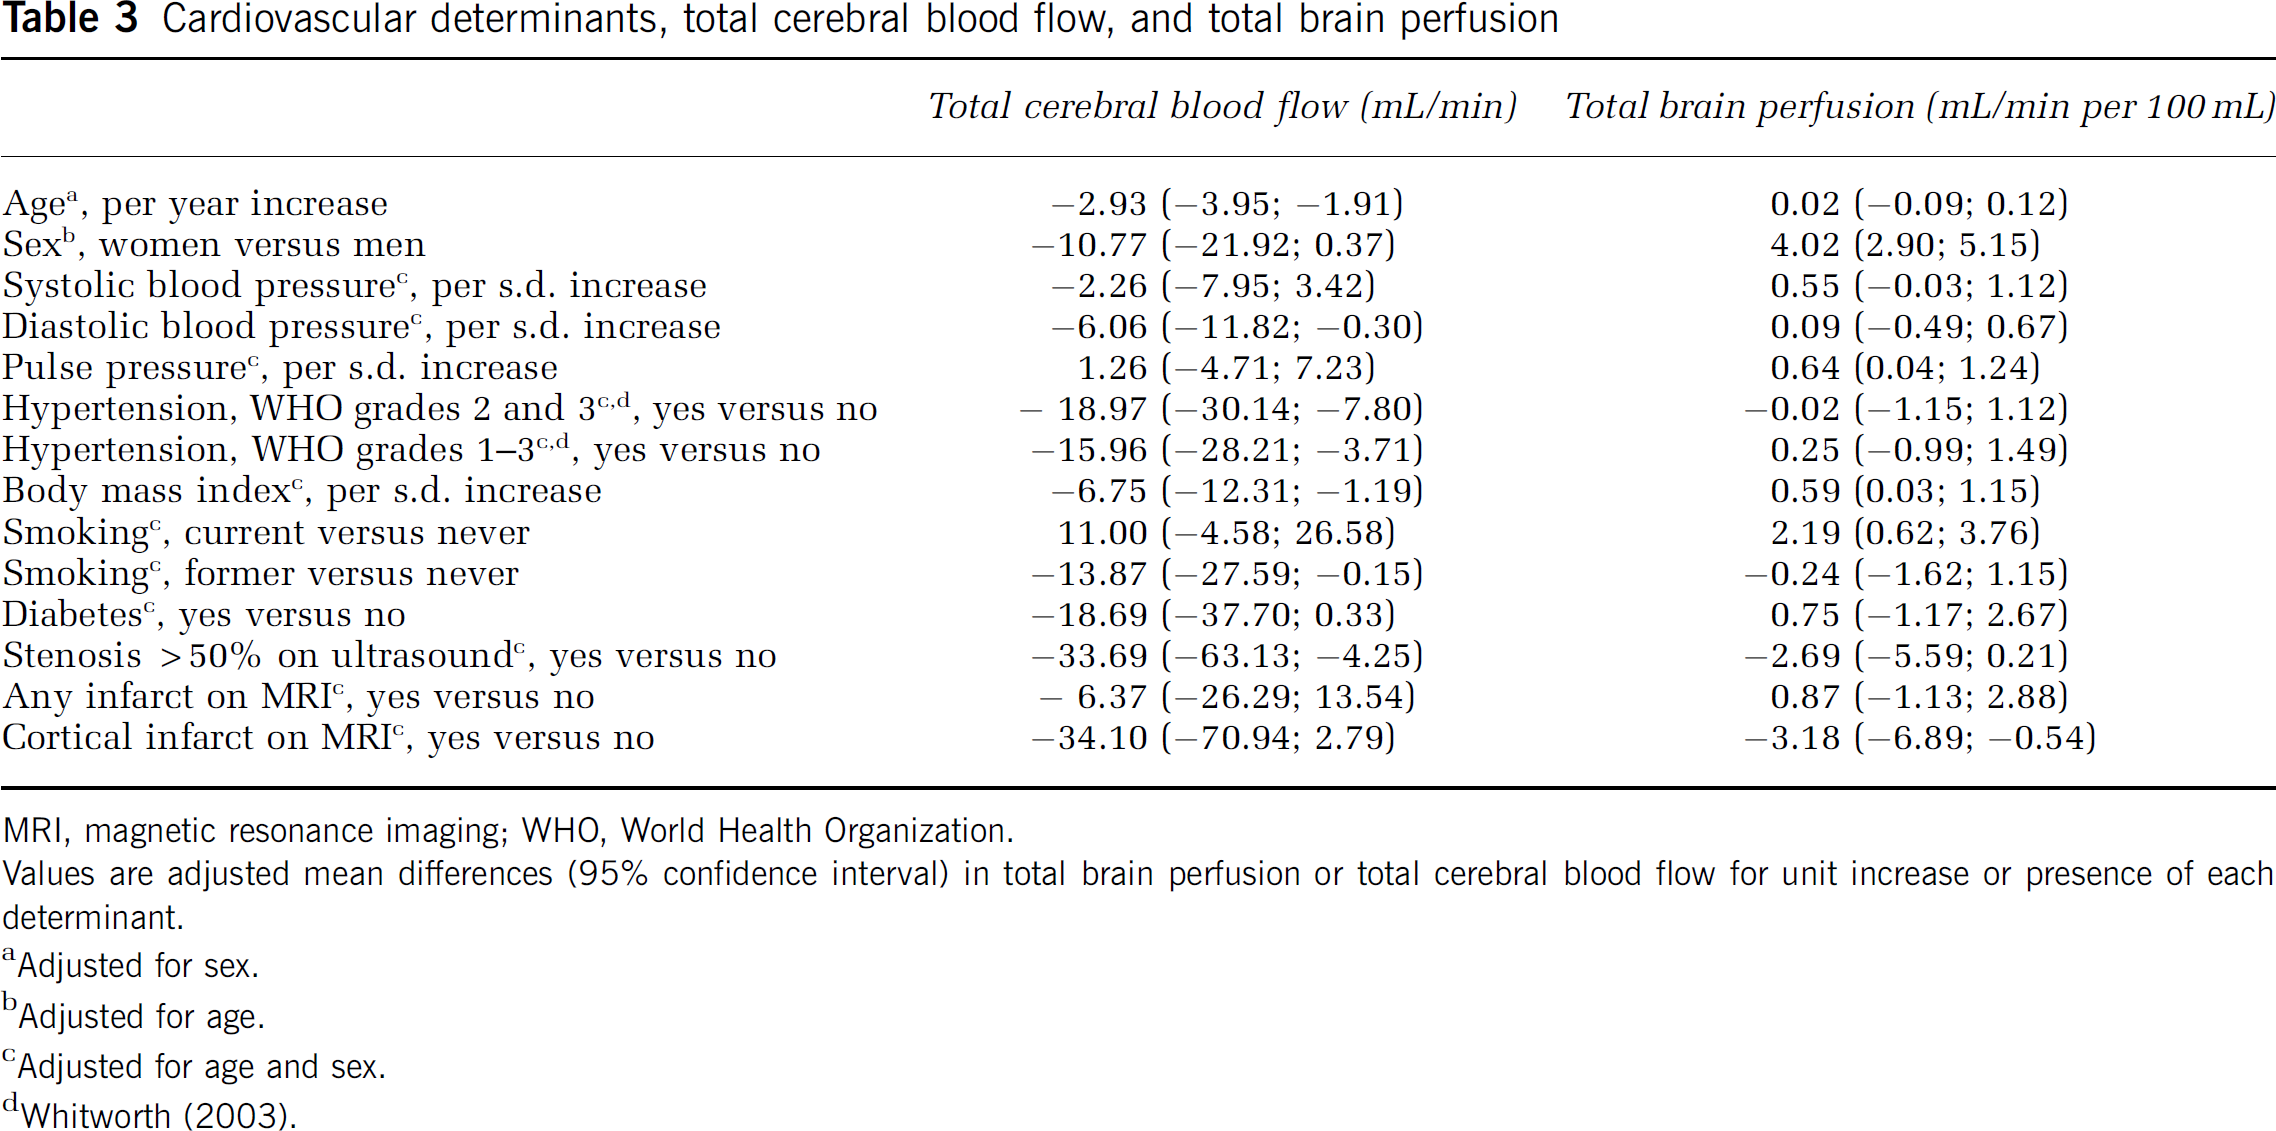
MRI, magnetic resonance imaging; WHO, World Health Organization. Values are adjusted mean differences (95% confidence interval) in total brain perfusion or total cerebral blood flow for unit increase or presence of each determinant.
Adjusted for sex.
Adjusted for age.
Adjusted for age and sex.
In contrast, total brain perfusion did not change with increasing age (Table 3). Moreover, women had on average 4 mL/min per 100 mL higher total brain perfusion than men. Furthermore, increased pulse pressure, increased BMI, and current smoking were all associated with higher total brain perfusion.
Both as a continuous variable and when analyzed in quartiles, tCBF was not related to WML volume (per s.d. increase of tCBF, difference in ln WML volume 0.03 (95% CI: −0.03; 0.09); data for analysis of tCBF in quartiles not shown). In contrast, persons in the lowest quartile of total brain perfusion had a significantly larger total volume of WML than persons in the highest quartile (Figure 2). Per s.d. decrease in total brain perfusion, the difference in ln WML volume was 0.07 (95% CI: 0.02; 0.14). Adjustment for systolic and diastolic blood pressure, smoking status, diabetes, and BMI did not attenuate this association. The association between total brain perfusion and amount of WML seemed more pronounced in persons with hypertension, although the interaction was not significant (per s.d. increase in total brain perfusion, difference in ln WML volume for those with hypertension (WHO grades 2 and 3) was −0.11 (95% CI: −0.20; −0.02) and −0.04 (95% CI: −0.11; 0.04) for persons without hypertension; P interaction = 0.21). Using a definition of hypertension that comprised WHO grade 1 and higher (Whitworth, 2003) did not yield different results. Also, excluding persons with carotid stenosis (n = 33) and/or cortical infarcts on MRI (n = 21) did not change any of the above-mentioned results.
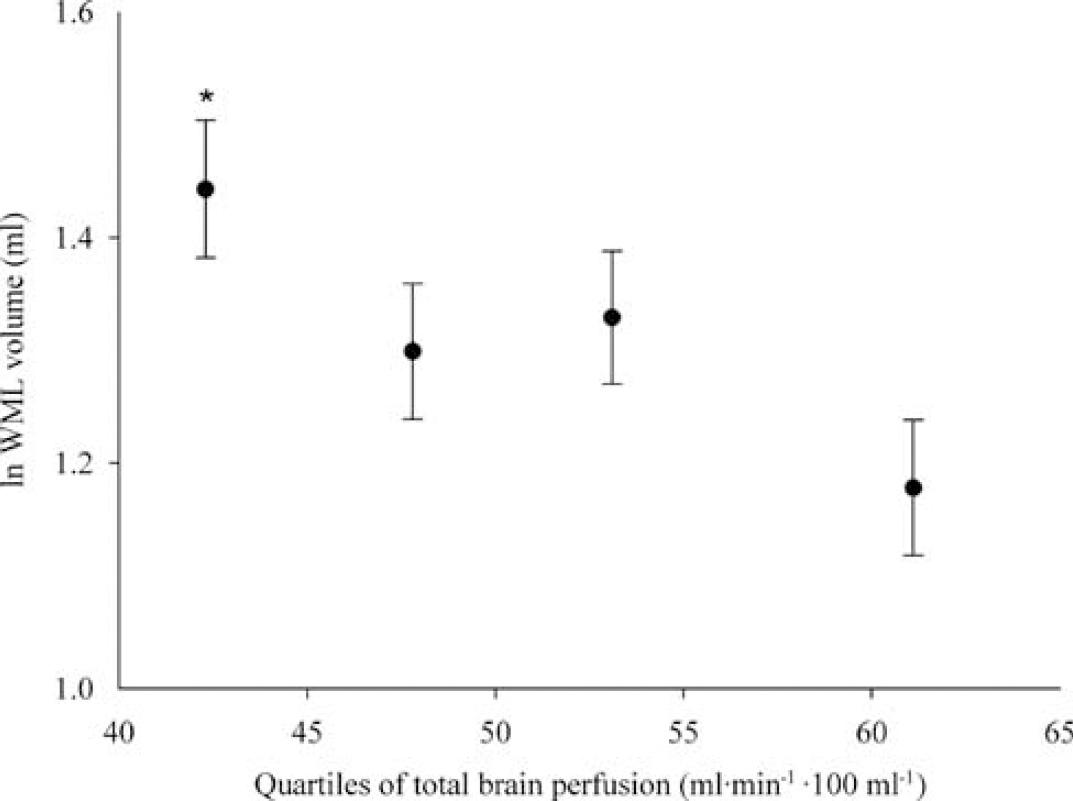
Quartiles of total brain perfusion and WML volume. Age- and sex-adjusted mean WML volume for each quartile of total brain perfusion (plotted at the median of each quartile). Error bars represent standard errors of the mean. *P < 0.01 when compared with fourth quartile (= highest total brain perfusion). P trend = 0.007. WML, white matter lesion.
Discussion
In the general population, we investigated tCBF and total brain perfusion using 2D phase-contrast MRI. We found that determinants of tCBF and total brain perfusion differed largely, which can be explained by the large influence of brain volume on tCBF values. We further found that persons with lower total brain perfusion had significantly more WML compared with persons with high total brain perfusion.
A major strength of our study is the population-based design, with a large sample size of elderly subjects. Other strengths of our study are the quantification of brain volume and WML volume. The 2D phase-contrast MRI technique as used in our study is noninvasive and fast. Superior imaging techniques are available that can assess perfusion at the brain tissue level, including positron emission tomography, xenon-computed tomography, perfusion-computed tomography, and perfusion MRI (Hoeffner, 2005; Wintermark et al, 2005). However, disadvantages such as limited availability, exposure to radiation, and invasiveness of the procedure render all of these techniques inadequate for application in a population-based study (Hoeffner, 2005; Wintermark et al, 2005). To our knowledge, we are the first to use the 2D phase-contrast MRI technique to estimate indirectly total brain perfusion by taking into account brain volume. We found a mean total brain perfusion of 51.2 mL/min per 100 mL. When divided by brain tissue density (1.034 g/mL) (Lescot et al, 2005), this yields a mean total brain perfusion of 49.5 mL/min per 100 g brain tissue, which is in accordance with normal values of cerebral perfusion as assessed by other imaging techniques (Kirkness, 2005). Of note is that we measured blood flow in the basilar artery at the level before the superior cerebellar arteries arise, which supply the dorsal cerebellum, midbrain, and pons. These structures were not included in the measured brain volume that we used to calculate total brain perfusion. However, the resulting underestimation of each individual's brain volume is expected to be proportional to the measured brain volume and will therefore not have influenced the distribution of total brain perfusion in our population.
Taking into account this slight overestimation in total brain perfusion, the mean total brain perfusion we assessed with this method is also very much in concordance with early work by Kety and Schmidt (1948), who established normal values of cerebral perfusion using the nitrous oxide method, a technique which can be regarded as the reference method for measurement of global average cerebral blood flow. They report a total brain perfusion (referred to in their report as mean cerebral blood flow) of 54 mL/min per 100 g. However, later studies proposed that this value should be corrected for a slight overestimation because diffusion equilibrium for inert gas tracer between the brain and its venous blood was not reached (Madsen et al, 1993), leading to a corrected flow value using the Kety and Schmidt method of 46 mL/min per 100 g (Lassen and Lane, 1961; Madsen et al, 1993).
The association we found between increasing age and lower tCBF is comparable to previous reports, taking age differences between populations into account (Buijs et al, 1998; Spilt et al, 2005; van Raamt et al, 2006). Furthermore, the estimates we found for associations of BMI, previous cerebrovascular disease (in our data defined as cortical infarct on MRI), and presence of diabetes mellitus with tCBF are very concordant with results presented recently (van Raamt et al, 2006). Like other studies, we found that men had a higher tCBF than women (Buijs et al, 1998; van Raamt et al, 2006). However, we found that total brain perfusion was higher in women than in men. A higher cerebral perfusion in women compared with men was described in 1988 by Rodriguez et al (1988), using 133-xenon inhalation. Also in contrast to tCBF, total brain perfusion was not associated with age. Moreover, other cardiovascular determinants, including blood pressure and BMI, showed opposite associations to total brain perfusion when compared with tCBF (Table 3). All of this can be explained by the fact that both tCBF and the cardiovascular determinants studied are strongly related to brain volume (Ikram et al, 2007; Knopman et al, 2005; Salerno et al, 1992). This signifies the importance of taking into account brain atrophy when analyzing global blood flow to the brain.
Current smoking was associated with a higher total brain perfusion compared with never smoking and former smoking. This is in line with known effects of nicotine on blood flow in animal studies as well as in healthy volunteers (Gong et al, 2006; Kodaira et al, 1993; Shiba et al, 2006). Most probably, nicotine reduces vascular resistance in cerebral arteries via activation of nicotine receptors causing an increase in cerebral perfusion (Gong et al, 2006; Shiba et al, 2006). Furthermore, inhalation of carbon monoxide results into formation of carboxyhemoglobin through its binding to hemoglobin. Carboxyhemoglobin has a decreased oxygen-carrying capacity, which promotes tissue hypoxia and as such causes release of mediators of hypoxic vasodilatation and a subsequent increase in cerebral perfusion (Koehler and Traystman, 2002; Paulson et al, 1973).
The association we found between a lower total brain perfusion and a higher volume of WML is in accordance with small clinical studies showing that a low tissue perfusion in white matter is associated with the presence of WML (Hatazawa et al, 1997; Markus et al, 2000; O'Sullivan et al, 2002). Using 2D phase-contrast MRI, Bisschops et al (2004) showed a significant association between high tCBF and a lower WML load. With transcranial Doppler, it has been shown that cerebral blood flow velocity and vasomotor reactivity are strongly associated to qualitatively graded amount of WML (Bakker et al, 1999; Tzourio et al, 2001). We did not directly measure tissue perfusion in the white matter, but reasoned that total brain perfusion provides a reflection of perfusion within the white matter. The association between total brain perfusion and WML volume seemed somewhat stronger for persons with hypertension compared with persons without hypertension. It is known that hypertension induces alterations in both large and small arteries and causes both limits of autoregulatory range to shift toward higher pressure limits (Novak et al, 2003; Paulson et al, 1990). It could therefore be hypothesized that persons with hypertension are more vulnerable to relatively small decreases in total brain perfusion, resulting in relative tissue hypoperfusion and subsequent WML formation.
Our study was cross-sectional, which limits drawing conclusions regarding cause and effect. For example, the relation we found between lower total brain perfusion and a higher volume of WML could signify that tissue hypoperfusion contributes to WML pathogenesis (Fazekas et al, 1993; Pantoni and Garcia, 1997). However, it may also be that tissue damage and loss of white matter integrity, manifested by WML, lead to brain hypoperfusion. The same holds true for the relation between cardiovascular determinants and total brain perfusion. We cannot exclude that the association we found between cardiovascular determinants and total brain perfusion is not causal but actually results from cardiovascular determinants leading to tissue damage and other processes, such as brain atrophy (Ikram et al, 2007; Knopman et al, 2005; Salerno et al, 1992), which in turn affect total brain perfusion. By accounting for brain volume in the assessment of total brain perfusion, we tried to eliminate this influence. However, longitudinal studies would be better able to disentangle the causal pathways.
In conclusion, this study underlines the importance of taking into account brain volume when studying total blood flow to the brain. We show that in the general population, persons with a low total brain perfusion have higher WML volumes. Our results suggest that tissue hypoperfusion contributes to WML pathogenesis, although we cannot exclude that tissue damage due to decreasing demand contributes to brain hypoperfusion. This remains to be further elucidated by longitudinal research.
Footnotes
Acknowledgements
We thank Gavin C Houston, PhD, for his technical support concerning the blood flow measurements.
Disclosure
None of the authors has any involvement, financial or otherwise, that might potentially bias their work.