
Abstract
Cerebral hypoperfusion has been associated with worse cognitive function. We investigated the association between cerebral blood flow and cognition and whether this association is independent of brain volume. In 892 participants, aged 60 to 91 years, of the population-based Rotterdam Scan study, we measured total cerebral blood flow (tCBF) and brain volume using magnetic resonance imaging. Lower tCBF was associated with worse information-processing speed, executive function, and global cognition. However, after correcting tCBF for brain volume, these associations disappeared. The association between tCBF and cognition may be mediated or confounded by brain atrophy. Future studies on tCBF should take into account brain atrophy.
Introduction
Elderly persons often suffer from deterioration of cognitive function. Vascular risk factors may contribute to cognitive impairment by affecting blood flow to the brain (Meyer et al, 1988). Moreover, it has been suggested that cerebral hypoperfusion precedes and possibly contributes to the onset of clinical dementia (Ruitenberg et al, 2005). To assess perfusion at the brain tissue level is difficult as most measurement techniques are invasive and complex. Phase-contrast magnetic resonance imaging (MRI) enables fast and accurate measurement of total cerebral blood flow (tCBF) and has shown to be applicable in population-based studies (Spilt et al, 2002). Previous studies showed that lower tCBF assessed with phase-contrast MRI was related to poorer cognition, in particular, information processing speed, and dementia (Rabbitt et al, 2006; Spilt et al, 2005). However, these studies did not assess whether this association was independent of brain atrophy. It can be hypothesized that smaller brain volume leads to decreased cerebral metabolic demand and as such confounds the association between CBF and cognitive function.
Thus, the aim of our study was to investigate whether diminished CBF is associated with specific domains of cognitive function independent of brain volume.
Materials and methods
Participants
This study is embedded within the Rotterdam study, a large population-based cohort study in the Netherlands (Hofman et al, 2007). The original study population consisted of 7,983 participants aged 55 years and older from the Ommoord area, a suburb of Rotterdam. In the year 2000, the cohort was expanded with the addition of 3,011 persons (≥ 55 years) (Hofman et al, 2007). From August 2005 to May 2006, we randomly selected 1,073 members of this cohort expansion for participation in the Rotterdam Scan study, a population-based brain-imaging study. After exclusion of individuals who were demented or had MRI contraindications, 975 persons were found to be eligible, of whom 907 participated and gave written informed consent. Because of physical inabilities (e.g., back pain), imaging could not be performed or completed in 12 individuals. Therefore, a total of 895 complete MR examinations were performed. The institutional review board approved the study.
Magnetic Resonance Imaging Scan Protocol
Magnetic resonance imaging of the brain was performed on a 1.5 T MRI scanner (General Electric Healthcare, Milwaukee, WI, USA), using an 8-channel head coil. For flow measurement, 2D phase-contrast imaging was performed as described previously (Vernooij et al, 2007). In brief, a sagittal 2D phase-contrast MRI angiographic scout image was performed. On this scout image, a transverse imaging plane perpendicular to both the precavernous portion of the internal carotid arteries and the middle part of the basilar artery was chosen for a 2D gradient-echo phase-contrast sequence (repetition time = 20 ms, echo time = 4 ms, field of view = 19 cm2, matrix = 256 times 160, flip angle = 8°, number of excitations = 8, bandwidth = 22.73 kHz, velocity encoding = 120 cm/sec, slice thickness = 5 mm). For an example, see (Vernooij et al, 2007). Acquisition time was 51 secs and no cardiac gating was performed (Spilt et al, 2002). We further performed three high-resolution axial MRI sequences, that is, a T1-weighted sequence, a proton-density-weighted sequence, and a fluid attenuated inversion recovery sequence (Vernooij et al, 2007).
Measurement of tCBF and Total Brain Perfusion
Flow was calculated from the phase-contrast images using interactive data language-based custom software (Cinetool version 4; General Electric Healthcare) (Vernooij et al, 2007). Two independent, experienced technicians drew all the manual regions of interest and performed subsequent flow measurements (interrater correlations (n = 533) > 0.94 for all vessels) (Vernooij et al, 2007). In three persons, tCBF could not be measured because of incorrect positioning of the phase-contrast imaging plane, leaving a total of 892 persons in our analysis.
We calculated total brain perfusion (in mL/min per 100 mL) by dividing tCBF (mL/min) by each individual's brain volume (mL) and multiplying the obtained result by 100 (Vernooij et al, 2007).
Assessment of Brain Volume
For the assessment of brain volume, the structural MRI scans (T1-weighted, PD-weighted, and fluid attenuated inversion recovery) were transferred to a Linux workstation. Preprocessing steps and the classification algorithm have been described elsewhere (Vrooman et al, 2007). In summary, preprocessing included coregistration, nonuniformity correction, and variance scaling. We used the k-nearest-neighbor classifier (Anbeek et al, 2005) to classify scans into brain tissue and cerebrospinal fluid using the multispectral MR intensities. All segmentation results were visually inspected and if needed manually corrected. To remove noncerebral tissue, for example, eyes, skull, and cerebellum, we applied nonrigid registration (Rueckert et al, 1999) to register to each brain a template scan in which these tissues were manually masked. Brain volume was calculated by summing up all the voxels across the whole brain to yield volumes in milliliters.
Cognitive Function
Cognitive function was assessed with a neuropsychological test battery comprising the MMSE (mini-mental state examination), the Stroop test, the LDST (letter-digit substitution task; number of correct digits in 1 min), the WFT (word fluency test; animal categories), and a 15-WLT (15-word verbal learning test; based on Rey's recall of words) (Prins et al, 2005). For each participant, z-scores were calculated for each test separately (individual test score minus mean test score divided by the s.d.), except for MMSE. To obtain more robust measures, we constructed compound scores for information-processing speed, executive function, memory, and global cognitive function. The compound score for information-processing speed was the average of the z-scores for the Stroop reading and Stroop color-naming subtask and the LDST. Executive function included the z-scores of the Stroop interference subtask, the LDST and the WFT (number of animals in 1 min). The compound score for memory was the average of the z-scores for the immediate and delayed recall of the 15-WLT. For global cognitive function, we used the average of the z-scores of the Stroop test (average of the reading, color-naming, and interference subtask), the LDST, the WFT, and the immediate and delayed recall of the 15-WLT (Prins et al, 2005).
Covariates
We assessed the level of education and current smoking by interview. Systolic and diastolic blood pressures were measured twice on the right arm with a random-zero sphygmomanometer. The mean of the two readings was used in the analyses. Diabetes mellitus was defined as the use of blood glucose-lowering medication or fasting serum glucose level ≥ 7.0 mmol/L. Carotid plaque score was assessed by Doppler ultrasound (van Popele et al, 2001).
Data Analysis
We evaluated the association of both tCBF (mL/min) and total brain perfusion (mL/min per 100 mL brain tissue) s.d. increase with cognitive function using multiple linear regression models. All analyses were adjusted for age, sex, and education. To examine whether associations were independent of vascular risk factors, we additionally adjusted for current smoking, systolic and diastolic blood pressure, diabetes mellitus, and carotid plaque score.
Results
Characteristics of the study population are shown in Table 1. Lower tCBF was associated with worse performance on tests of information-processing speed, executive function, and global cognition, but not with the MMSE score and memory performance (Table 2).
Characteristics of the study population
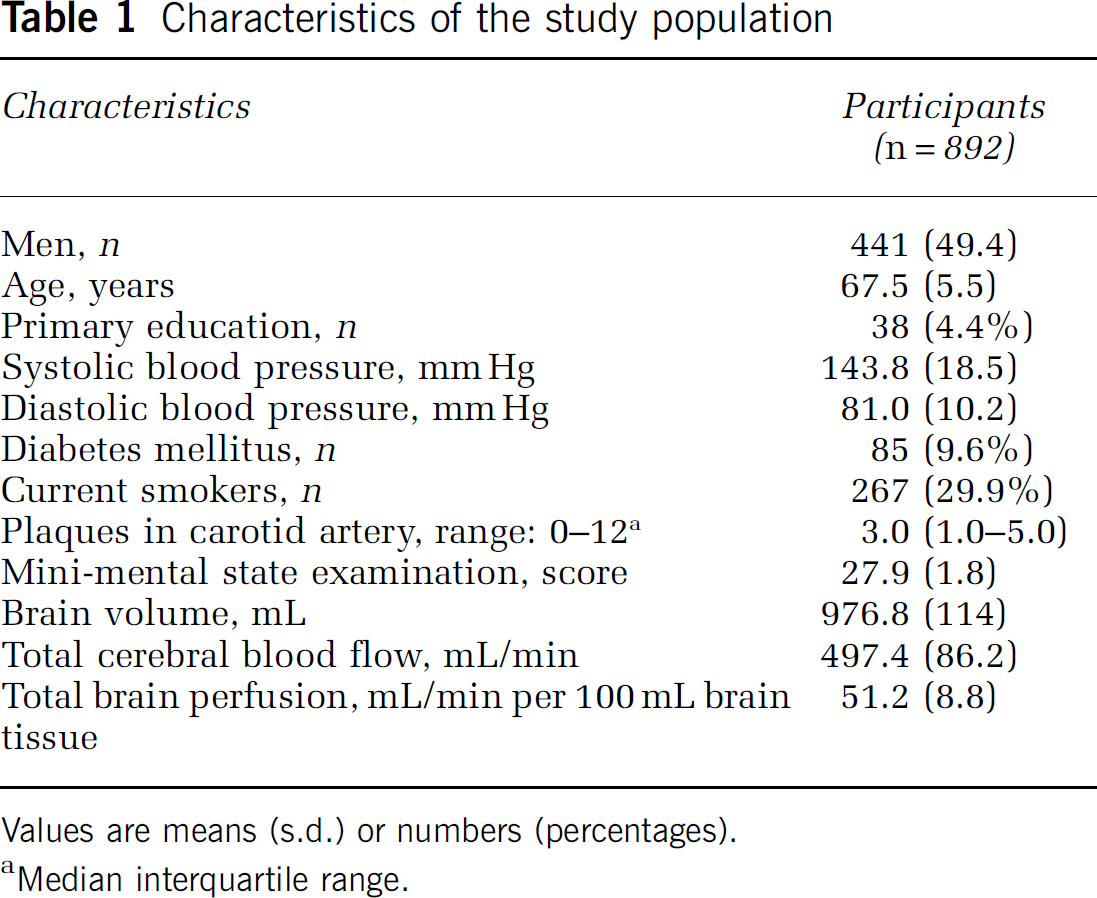
Values are means (s.d.) or numbers (percentages).
Median interquartile range.
Association of tCBF and total brain perfusion with cognitive function (z-scores), using linear regression models (n = 892)
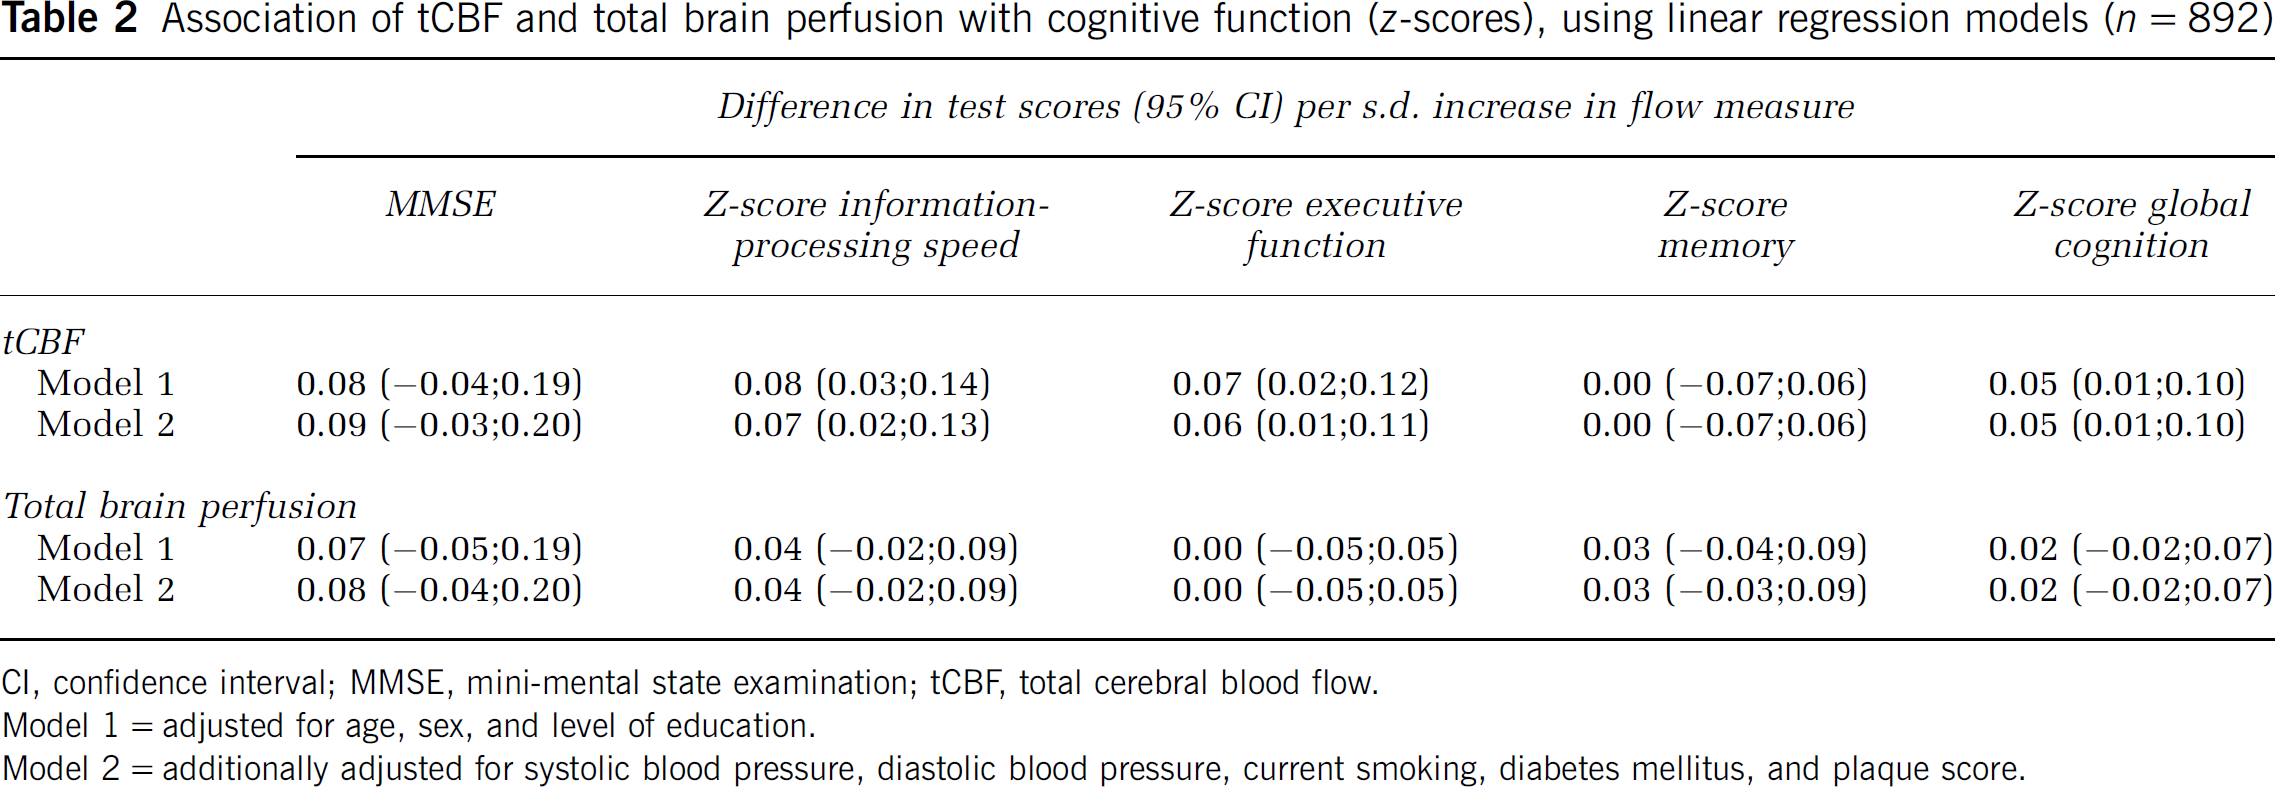
CI, confidence interval; MMSE, mini-mental state examination; tCBF, total cerebral blood flow.
Model 1 = adjusted for age, sex, and level of education.
Model 2 = additionally adjusted for systolic blood pressure, diastolic blood pressure, current smoking, diabetes mellitus, and plaque score.
Total brain volume was a strong determinant of tCBF (per s.d. increase in brain volume 36.00 mL/min increase in tCBF; 95% confidence interval 30.00;42.10). The associations of tCBF with cognition disappeared on correcting for brain volume (Table 2). Adjustments for vascular risk factors did not change any of these associations (Table 2).
Discussion
We found that persons with low tCBF performed significantly worse on tasks assessing information-processing speed, executive function, and global cognitive function, compared with persons with higher tCBF. However, total brain perfusion, indicating the flow in mL per 100 mL of brain tissue volume, was not associated with cognitive function. Adjustments for vascular risk factors did not change the results.
Before interpreting the results, some methodological issues need to be addressed. The strengths of our study are its population-based setting, the high response rate, and the large sample size. A limitation is the cross-sectional design, which restricts our interpretation of the data with respect to cause and consequence. Furthermore, we only assessed average brain perfusion. Hence, we cannot exclude that brain perfusion in distinct brain regions may relate differently to cognitive performance. Finally, we could not measure blood flow into the cerebellum as we measured blood flow in the basilar artery at the level after the anterior and posterior inferior cerebellar arteries arise.
It can be hypothesized that cerebral hypoperfusion causes brain atrophy that subsequently leads to cognitive decline (de la Torre 1999; Meyer et al, 1988). Conversely, it may also be that because of a diminished demand, brain atrophy itself affects CBF. Thus, the association between tCBF and cognitive function may be mediated or confounded by brain atrophy.
In the past, CBF velocity measured by transcranial Doppler ultrasonography has been used as a proxy measure for CBF. Several studies using CBF velocity reported that subjects with greater CBF velocity were less likely to have dementia (Ruitenberg et al, 2005). Furthermore, a greater CBF velocity was found to be related with larger hippocampal and amygdalar volumes (Ruitenberg et al, 2005).
More recently, associations of tCBF with speed, executive function (Rabbitt et al, 2006), and dementia (Spilt et al, 2005) were found using phase-contrast MRI. Our data are in line with these studies, as we also found the strongest associations for cognitive domains of speed and executive function (Rabbitt et al, 2006; Spilt et al, 2005). However, none of those previous studies assessed whether the associations between CBF and cognitive function were independent of brain volume. We went a step further by correcting for brain volume, and found no associations between total brain perfusion and cognitive function.
Thus far, only a few small studies reported that regional patterns of hypoperfusion in the brain may relate to cognitive decline or dementia independent of global differences (Johnson et al, 2005; Kogure et al, 2000). As mentioned, we could not evaluate this in our study. Further studies are needed to investigate this.
In conclusion, our findings show that the relation between total CBF and worse performance on several domains of cognitive function is dependent on brain volume.
Our study emphasizes that future studies on tCBF should take into account brain atrophy.
Footnotes
The authors state no conflict of interest, and have no involvement, financial or otherwise, that might potentially bias their work.