
Abstract
A novel organic anion transporter selectively expressed at the blood—brain barrier (BBB), originally designated BBB-specific anion transporter type 1 (BSAT1), and now classified as Slco1c1, has been cloned from a BBB genomics program as a partial cDNA; this study describes the cloning and expression of the full-length cDNA from a rat brain capillary cDNA library. Northern analysis revealed the selective expression of the transporter at the BBB, and the transporter was expressed after permanent transfection of human 293 cells with cDNA encoding either the full length or open reading frame mRNA. The full-length transporter cDNA was 2.6 kb, and the mRNA was highly expressed at the rat brain microvasculature, but not in kidney, liver, heart, or lung, or in glial cells or brain glial tumors. Blood—brain barrier-specific anion transporter type 1 expression in 293 cells was poor after the transfection of the full-length cDNA, whereas transporter expression in 293 cells was high after transfection of the open reading frame. The transporter showed asymmetric kinetic properties in comparison of the influx and efflux of model substrates, thyroxine (T4), triiodothyronine (T3), and estradiol-glucuronide (E2G). Thyroxine and T3 inhibited the influx of E2G, but E2G did not inhibit thyroxine influx, and T3 only weakly inhibited the influx of T4. Extracellular E2G stimulated the transefflux of intracellular T4. Blood—brain barrier-specific anion transporter type 1 is a novel organic anion transporter that is a sodium-independent exchanger that may participate in the active efflux of iodothyronines and steroid conjugates at the BBB.
Introduction
Drug penetration into the brain is determined by transport across the brain capillary endothelial wall, which forms the blood—brain barrier (BBB) in vivo. The exchange of polar solutes across the BBB is mediated via specific transport systems. One approach to the discovery of novel BBB transporters is the use of BBB genomics methodology, such as suppression subtractive hybridization (SSH) (Diatchenko et al, 1996). Initial applications of the SSH methodology to the rat BBB led to the identification of a transcript, which encoded a protein with distant amino-acid homology to the organic anion transporting polypeptide type 2 (oatp2) (Li et al, 2001a, 2002). This orphan transporter was originally designated BBB-specific anion transporter type 1 (BSAT1) (Li et al, 2001a, 2002), and was subsequently shown to transport organic anions (Sugiyama et al, 2003), and was named oatp14, and finally designated Slco1c1 (Hagenbuch and Meier, 2003). Blood—brain barrier genomics investigations are viewed as a two-part process. In part 1, partial cDNAs are isolated in a gene microarray. In part 2, these partial cDNAs are used to screen BBB cDNA libraries to clone the full-length cDNA, so that the novel gene may be expressed, and its function characterized. This study describes the cloning of a full-length rat BSAT1 cDNA, the restricted expression of this gene product to the BBB in vivo, and the expression of the cDNA in human 293 epithelial cells based on measurements of organic anion transport. These studies compare the expression of the 2.0 kb BSAT1 open reading frame (orf) and the expression of the 2.6-kb full-length BSAT1 cDNA, which includes nearly 400 nucleotides of 5′-untranslated region (UTR). The kinetic properties of influx and efflux of organic anions are examined, and show asymmetric binding sites for organic anions on this transporter.
Materials and methods
Materials
The PCR-SelectTM cDNA subtraction kit was obtained from BD Biosciences Clontech (Palo Alto, CA, USA). [α32P]dCTP (3,000 Ci/mmol; 1Ci = 37 GBq), [3H]estradiol 17 β-
Isolation of Poly(A+) RNA
Poly(A+) RNA was isolated from rat brain capillaries, C6 and RG2 implanted rat brain tumor, and rat brain and peripheral tissues using a single step method described previously (Boado and Pardridge, 1991). RG2 and C6 brain tumors were produced in Fischer rats as described previously (Suzuki et al, 2004). The yield of poly(A+) RNA from rat brain capillaries isolated from a pool of 21 cerebral rat brain hemispheres was 3.2 μg, whereas the yield averaged 20 μg/g tissue of total brain and peripheral organs.
Suppression Subtractive Hybridization
Suppression subtractive hybridization was performed using the PCR-Select cDNA subtraction kit as reported previously (Li et al, 2001a). The SSH procedure was performed using rat brain capillary mRNA to produce tester cDNA and rat liver/kidney mRNA to produce driver cDNA. Double-stranded cDNA was synthesized using 1 μg of either tester or driver poly(A+) RNA. cDNA size was normalized by digestion with RsaI, and specific oligodeoxynucleotide adaptors were ligated to the RsaI-digested tester cDNA. After hybridization of tester and driver cDNAs, the rat brain capillary-specific sequences were amplified by polymerase chain reaction (PCR) (Li et al, 2001a). The PCR products were cloned into the pCR2.1 vector, and INVαF′ super competent cells were transformed to form a subtracted rat brain capillary cDNA library (Li et al, 2001a). For the differential hybridization, randomly selected colonies were blotted onto GeneScreen Plus membranes using a 96-well dot-blot apparatus (Bio-Rad). The hybridization was performed with 32P-labeled subtracted or unsubtracted tester cDNA as described previously (Li et al, 2001a). Clones that produced stronger hybridization signal with the subtracted probe compared with that of the unsubtracted cDNA were selected for further characterization. The insert size was determined by EcoRI digestion and agarose gel electrophoresis.
Cloning of Full-Length cDNA
To isolate full-length cDNAs corresponding to clones identified in the SSH cloning, a rat brain capillary cDNA library in the pSPORT vector was produced as described previously (Li et al, 2001b). This library was screened with 32P-partial cDNAs isolated by SSH using colony hybridization (Boado et al, 2003a). Clones K-2 and LK-3 were isolated in the SSH cloning, and the DNA sequence of the partial clone indicated that the clone was novel and warranted further examination. The partial insert was released and labeled with [32P] and was used to screen 2.4 × 10⁵ recombinants of the rat brain capillary pSPORT cDNA library. Forty positive clones were identified, and 25 of them were isolated for further characterization. The cDNA inserts were released by double digestion with NotI and SalI, and samples were characterized by ethidium bromide staining of agarose gels after electrophoresis. Clones were confirmed by Southern blot analysis performed with 32P-labeled LK-3 cDNA under high-stringency conditions as described previously (Boado et al, 1999).
DNA Sequence Analysis
DNA sequencing of isolated clones was performed in both directions as described previously (Boado et al, 2003a). Initial DNA sequencing was performed with M13 forward and reverse primers, which are located in pSPORT at the 5′- and 3′-flanking regions of NotI and SalI sites, respectively. Full-length cDNAs were entirely sequenced in both directions by primer walking using custom synthesized oligodeoxynucleotides as described previously (Boado et al, 2003a). Primers were designed using the program Oligos 4.0 with Tm > 60°C and absence of either stable stem loops or secondary structures. Similarities with other transporters in GenBank were investigated using the BLAST program (NCBI, NIH, USA). DNA sequencing indicated the partial clone, LK-3, isolated in the SSH procedure, corresponded to a 2.6 kb full-length cDNA with novel sequence (AF306546) with distant homology to organic anion transporters. Since subsequent Northern blotting showed the gene was only expressed at the BBB, the gene was named BBB-specific organic anion transporter type 1 or BSAT1.
Northern Blot Analysis
Two micrograms of poly(A+) RNA were resolved on 1.5% agarose/2.2 mol/L formaldehyde gels, and blotted onto GeneScreen Plus membranes. Northern blots were hybridized with 32P-labeled LAT1, 4F2hc, BSAT1, or β-actin cDNAs as described previously (Boado et al, 1999). cDNAs were labeled with [32P]dCTP by the random priming technique using the Megaprimer DNA labeling kit (Boado et al, 2003a). Autoradiograms were performed with Biomax MS film and exposed at −70°C for various periods. Films were scanned with an Umax PowerLook III scanner.
In Situ Hybridization
In situ hybridization was performed on cytocentrifuged isolated rat brain capillaries. An ∼0.6 kb BSAT1 cDNA fragment was obtained from the partial BSAT1 clone by double digestion of the pCR2.1 vector with SalI and XbaI and subcloned into the pSPT19 vector at the same restriction endonuclease sites (Li et al, 2001a). Antisense and sense RNA probes were generated using SalI and XbaI linearized pSPT19-BSAT1 plasmid and T7 or SP6 polymerases, respectively, in the presence of digoxigenin-11-uridine triphosphate (DIG-11-UTP). Freshly prepared rat brain capillaries were cytocentrifuged onto glass slides, and the capillaries were fixed with 10% formalin and stored at −70°C (Li et al, 2001a). The slides were hybridized with 12 ng digoxigenin-labeled probes in 30 μL of hybridization solution overnight at 42°C, and control sections were hybridized with equal amount of sense cRNA as reported previously (Li et al, 2001a).
Real-Time Polymerase Chain Reaction Measurement of Rat Brain Capillary and Whole Brain mRNA
Poly(A+) RNA was isolated from rat brain capillaries or rat whole brain using a single step method as previously described (Boado and Pardridge, 1991). Reverse transcription (RT) was performed according to the Invitrogen SuperScript III First-Strand Synthesis System for PCR using 0.4 μg of poly(A+) RNA as the template and oliogodeoxythymidine as primer in a total volume of 21 μL per reaction. The RT product was diluted by 20-fold before real-time PCR assays. Real-time PCR was performed using the BioRad iQ SYBR Green Supermix according to the manufacturer's instruction. In each PCR reaction in 25 μL, 2 μL of the diluted RT product was used as the template. The primer sequences for rat β-actin (GenBank accession no 42475962) are 5′-GGGACGATATGGAGAAGATTTGG-3′ and 5′-TGAAGGTCTCAAACATGATCTGG-3′. The primer sequences for rat BSAT1 are 5′-AACCTCACTCCCAACATCTCTC-3′ and 5′- GTATCCACTTCACACTCATCGTTTA-3′.
Each primer pair was selected to amplify the sequence shared by contiguous exons of a target gene, to eliminate the possible interference of genomic DNA. Polymerase chain reaction was initiated by a 3-min incubation at 95°C, followed by 40 cycles consisting of 10 secs annealing at 58.3°C, 10 secs extension at 72°C, and 10 secs denaturing at 95°C. Melting curve of each PCR product was determined by measuring the ratio of single-strand DNA versus double-strand DNA at each 0.5°C of temperature increase from 55 to 94°C. Single peak in the melting curve with a signature Tm suggests pure PCR product and specificity of the reaction. The threshold cycle (Ct) value represents the relative amount of the target mRNA in the RNA pool.
Western Blotting
A rabbit polyclonal antiserum against the C-terminus of rat BSAT1 was prepared using the synthetic peptide LQPKYWPGKETRL corresponding to amino acids 706 to 718 of the deduced amino acid sequence of BSAT1. The synthetic peptide was used to screen for antibody titer by enzyme-linked immunosorbent assay. Anti-BSAT1 antibodies were affinity purified after production of an affinity column by coupling the synthetic peptide to cyanogen bromide-activated Sepharose 4B. Rat brain capillary protein was resolved in a 12% sodium dodecyl sulfate-polyacrylamide gel electrophoresis under reducing conditions for Western blotting. Proteins on the gel were electroblotted onto a nitrocellulose membrane. Immunoblot analysis was performed with the affinity-purified anti-BSAT1 antibodies either without or with absorption of the antibody by the synthetic peptide. Biotinylated goat anti-rabbit IgG was used as secondary antibody. Results were visualized with the ABC Elite detection kit as described previously (Pardridge et al, 1990). Western blot analysis with the affinity-purified anti-rat BSAT1 antibody showed that the antibody reacted with a single 55-kDa immunoreactive protein in rat brain capillaries, and that this signal was completely removed by absorption of the anti-BSAT1 antibody with the BSAT1 C-terminal synthetic peptide. However, it is believed that this represents a sequence-specific artifactual cross-reaction of this C-terminal peptide antibody with a non-BSAT1 protein, because the same 55-kDa immunoreactive species was detected in multiple tissues, which do not express the BSAT1 mRNA.
Stable Transfection of Human Embryonic Kidney 293 Cells
The full-length (fl) BSAT1 cDNA was released from the pSPORT vector by double digestion with NotI and EcoRI and cloned into the pcDNA3.1 vector (Invitrogen) at the same restriction endonuclease sites, and this plasmid is designated pcDNA/BSAT1(fl). Human 293 cells transfected with this plasmid are designated 293/BSAT1(fl) cells. Human embryonic kidney 293 cells were plated in minimal essential medium/10% horse serum in six-well dishes a day before the transfection. Four μg of pcDNA3.1-BSAT1(fl) or pcDNA 3.1 control (no insert) were used to transfect human embryonic kidney 293 cells using 8 μL, of lipofectamine 2000 as per the manufacturer's instructions (Invitrogen). Forty-eight hours after transfection, cells were selected in minimal essential medium/10% horse serum containing 600 to 750 μg/mL of G418 for 14 days. Cells transfected with the BSAT1 (fl) cDNA are designated 293-BSAT1 (fl) cells.
A second human embryonic kidney 293 stably transfected cell line was established with a rat BSAT1 expression construct lacking both the 5′- and 3′-UTR of the rBSAT1 transcript. The 2.0-kb BSAT1 orf was obtained from pSPORT-BSAT1 by PCR cloning with Stratagene PfuUltra Hotstart DNA polymerase, forward primer (5′-phosphate-AATGGACACTTCATCCAAAGAAAATGC) and a reverse primer (5′-phosphate-CTTAAAGTCGGGTCTCCTTGCCTG). The PCR-generated BSAT1 orf cDNA was subcloned in the pcDNA3.1(+) vector at the EcoR V site to form the pcDNA-BSAT1(orf) plasmid named clone 994. Positive clones with the correct orientation of the BSAT1(orf) were identified by restriction endonuclease mapping (i.e., XbaI), and verified by DNA sequencing. Insertion of the full Kozak site immediately preceding the ATG initiation codon (i.e., GCCGCCACC) and single nucleotide errors introduced in the PCR cloning were corrected by site-directed mutagenesis using the Stratagene QuikChange II XL Kit as described previously (Boado et al, 2003a). Cells transfected with the BSAT1(orf) cDNA are designated 293-BSAT1(orf) cells.
Influx Assays in Stably Transfected 293 Cells
293-BSAT1(orf) or 293-BSAT1(fl) cells were washed with physiological buffer (PB: 118 mmol/L NaCl, 25 mmol/L HEPES (4-(2-hydroxyethyl)-1-piperazineethanesulfonic acid), pH 7.4, 4.9 mmol/L KCl, 1.4 mmol/L K2HPO4, 1.2 mmol/L MgCl2, 1 mmol/L CaCl2, and 11 mmol/L
[125I]Thyroxine Efflux in Stably Transfected 293 Cells with Prealbumin Trap Technique
The isolation of the efflux kinetics in cells preloaded with [125I]T4 is complicated by the rapid re-entry of the isotope into the cell. The re-entry of T4 was eliminated by the addition of human prealbumin to the medium. Human plasma prealbumin is a high-affinity binder of T4, and this rapid binding prevents any further influx of T4 into the cell. 293-BSAT1(orf) cells were plated in Biocoat collagen I-coated 24-well cluster dishes and grown to confluency. The cells were washed with warm physiological buffer (118 mmol/L NaCl, 25 mmol/L HEPES, 4.9 mmol/L KCl, 1.4 mmol/L K2HPO4, 1.2 mmol/L MgCl2, 1 mmol/L CaCl2, 11 mmol/L glucose, pH 7.4) and incubated with 200 μL of physiological buffer containing 3.26 μCi/mL 125I-T4 (34 nmol/L) at 37°C for 15 mins. Efflux was initiated by adding 10 μL of 2 μg/μL of prealbumin (2 μmol/L final concentration) to the medium, and was terminated by the rapid addition of 2.5 mL of ice-cold physiological buffer. After three washes with ice-cold physiological buffer, the cells in each well were solubilized with 200 μL 1N NaOH by overnight incubation at room temperature. Uptake result was determined by γ-counting and protein assay of the lysates.
In Vitro Transcription and Cross-Linking of BSAT1 RNA to Polysome Proteins
The full-length rat BSAT1 cDNA was obtained by NruI/NotI double digestion of the pCD-BSAT1(fl) plasmid, followed by Qiagen gel purification. 32P-labeled BSAT1(fl) cloned RNA (cRNA) was synthesized by in vitro transcription in a 20 μL volume using 0.3 μg DNA template and T7 polymerase with the MAXIscript in vitro transcription kit for 1 h in the presence of [32P]UTP, as described previously (Tsukamoto et al, 1996). Purity and activity of the 32P-labeled cRNA was determined by trichloroacetic acid precipitation of the cRNAs before and after filtration through a G-25 column. The purity of the BSAT1(fl) cRNA was 89%. The activity the BSAT1(fl) cRNA was 2.0 × 10⁶ c.p.m./μL. The size of the BSAT1(fl) cRNA was estimated to be 2.7 kb by electrophoresis in a 1.5% agarose/formaldehyde gel. To perform ultraviolet cross-linking of the 32P-cRNA to brain capillary endothelial polysome or cytosolic proteins, 2.0 × 10⁵ c.p.m. of freshly labeled cRNA was incubated with 2 μg protein from either the P100 polysomic extracts or the S100 cytosolic extracts of the bovine brain capillary endothelial cells for 10 mins at 30°C in 20 μL of binding buffer, as described previously (Boado et al, 2003b). The binding buffer is 12 mmol/L HEPES, pH 7.5, 0.25 mmol/L EDTA (ethylenediaminetetraacetic acid), 10 mmol/L potassium chloride, 5 mmol/L magnesium chloride, 0.5 mmol/L dithiothreitol, 0.2 mg/mL yeast tRNA, 5% glycerol, and 0.5 U/μL of RNasin RNase inhibitor. RNase T1 (5 U/μL) was then added to reaction mixtures for a 30 mins incubation at 37°C. Reaction mixtures were cross-linked using a Stratalinker 1800 UV oven (Stratagene, San Diego, CA, USA) at 254 nm for 5 mins. Binding reactions were transferred to 1% sodium dodecyl sulfate sample buffer and boiled for 3 mins. RNA/protein complexes were separated by electrophoresis using a 10% sodium dodecyl sulfate-polyacrylamide gel electrophoresis. The gels were dried and exposed to Kodak BioMax MS-1 film for 2 days at −70°C using intensifying screens.
Results
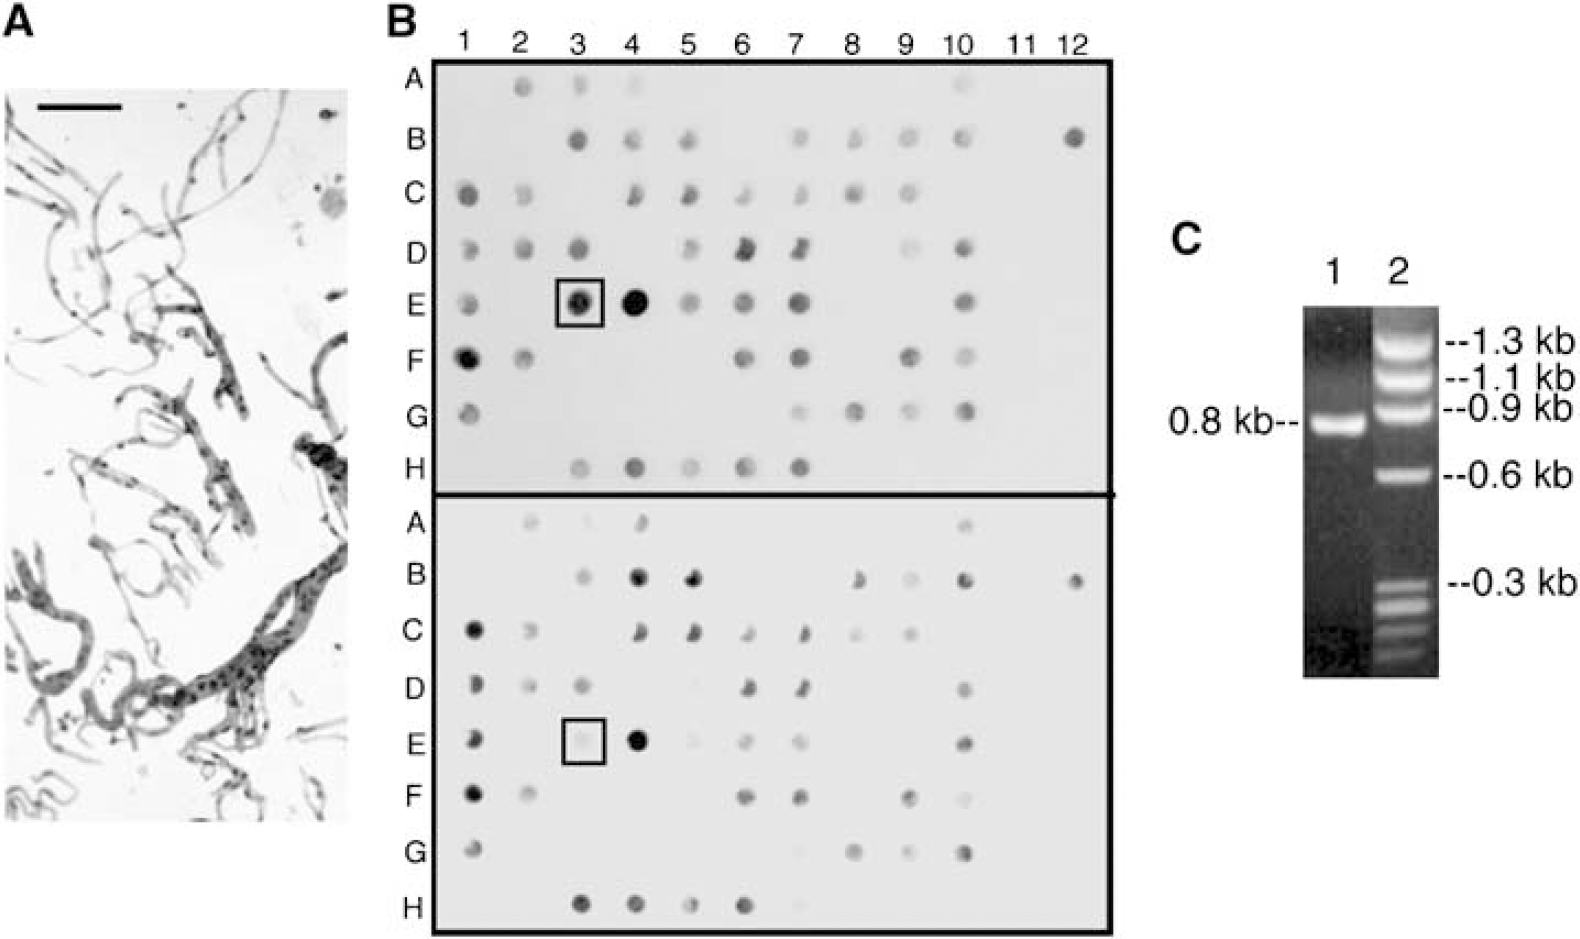
Rat brain capillaries were purified free of adjoining brain tissue (Figure 1A). The RNA isolated from the brain capillaries was used to produce the subtracted rat brain capillary cDNA library using SSH (Materials and methods). Southern blotting with subtracted tester cDNA (Figure 1B, top panel) or unsubstracted cDNA (Figure 1B, bottom panel) allowed for the isolation of individual clones that were highly enriched at the BBB, such as the clone in well E3 (Figure 1B). This clone comprises a 0.8 kb cDNA insert (Figure 1C). The insert was 32P-labeled, and was used to screen a rat brain capillary cDNA library composed of full-length transcripts. DNA sequence analysis of this clone, designated BSAT1 (Materials and methods), showed the transcript was composed of 2,736 nucleotides (nt), with a 374 nt 5′-UTR, a 2,148 nt coding region, a stop codon, a 204 nt 3′-UTR, and a 17-mer poly A region (GenBank accession no. AF306546). The protein is predicted to be composed of 716 amino acids including the methionine initiation codon. The protein is predicted to lack a signal peptide, to be composed of 12 transmembrane regions, which include five predicted extracellular-projected N-linked glycosylation sites, and intracellular N- and C-termini. The human homologue of rat BSAT1, SLCO1C1, maps to chromosome p12.2. There is 84% identity in the amino acid sequence of human and rat BSAT1.
(
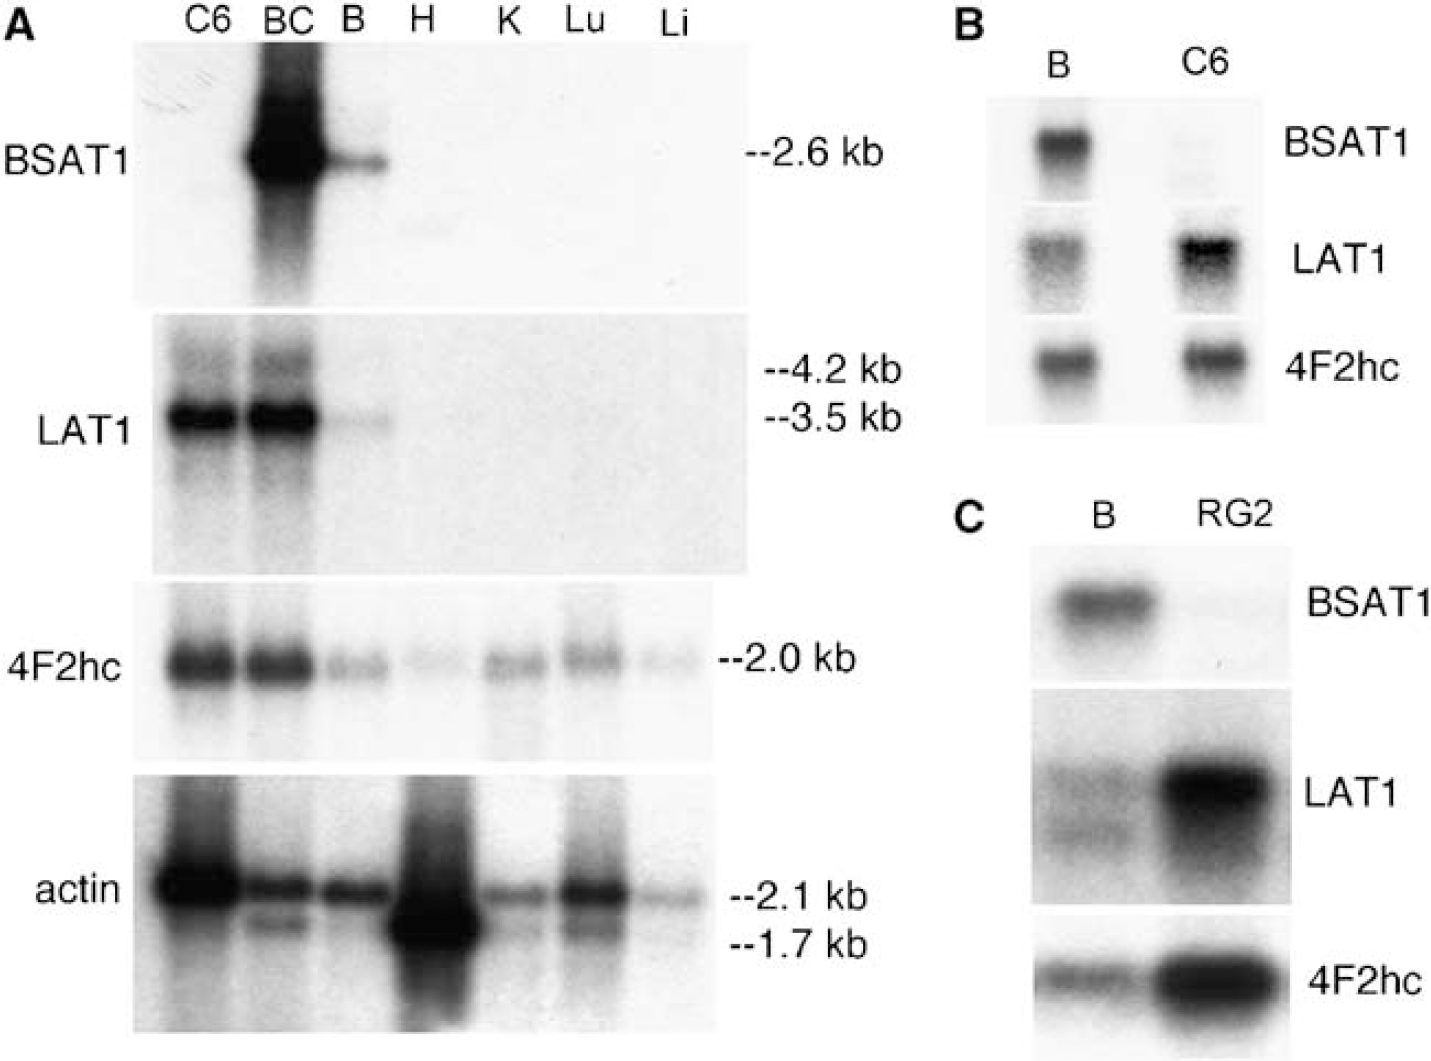
Northern blot analysis with poly(A+) RNA isolated from rat organs shows the BSAT1 mRNA is not detectable in rat heart, kidney, lung, or liver, whereas actin and 4F2hc mRNA is readily detected in these organs (Figure 2A). The BSAT1 mRNA is highly abundant at the rat BBB, and the signal is overexposed with a 16 h exposure of the film (Figure 2A). The low BSAT1 signal in whole rat brain suggests the transcript is preferentially expressed at the BBB, and this was confirmed by real-time PCR. The BSAT1 mRNA in the rat brain capillary compartment was enriched 19-fold relative to whole brain, whereas the β-actin mRNA content in both compartments was comparable (Table 1). The expression of the LAT1 is also confined to the BBB; however, LAT1 is expressed in C6 rat glioma cells, whereas BSAT1 is not expressed in cultured C6 cells (Figure 2A). In vivo, LAT1 is expressed in either C6 (Figure 2B) or RG2 (Figure 2C) intracranial rat brain tumors, whereas there is no expression of BSAT1 in C6 or RG2 rat brain tumors (Figures 2B and 2C). The size of the rat BBB BSAT1 mRNA is 2.6 to 2.7 kb (Figure 2) when capillaries are isolated from young rats (> 2 months); however, when Northern analysis was performed with RNA isolated from brain capillaries removed from old rats (5 months), a high-size 7.0 kb BSAT1 mRNA was observed, which was expressed equally with the 2.6 kb mRNA.
BSAT1 and β-actin mRNA in rat brain capillary and whole brain
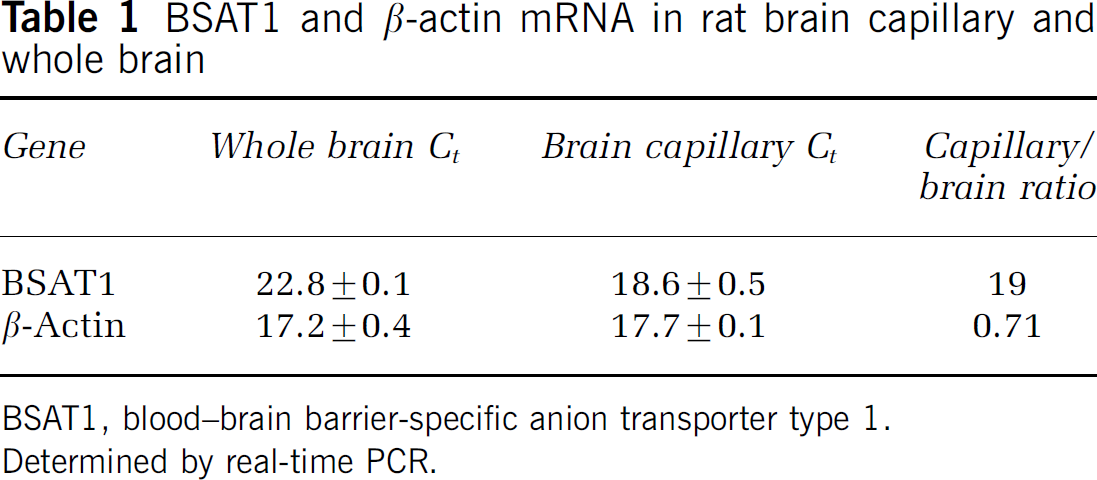
BSAT1, blood-brain barrier-specific anion transporter type 1.
Determined by real-time PCR.
(
In situ hybridization (ISH) with isolated rat brain capillaries produced continuous immune staining (Figure 3A), which indicates the microvascular cell producing the BSAT1 mRNA is the capillary endothelial cell. No capillary signal was detected when ISH was performed with the sense RNA (Figure 3B).
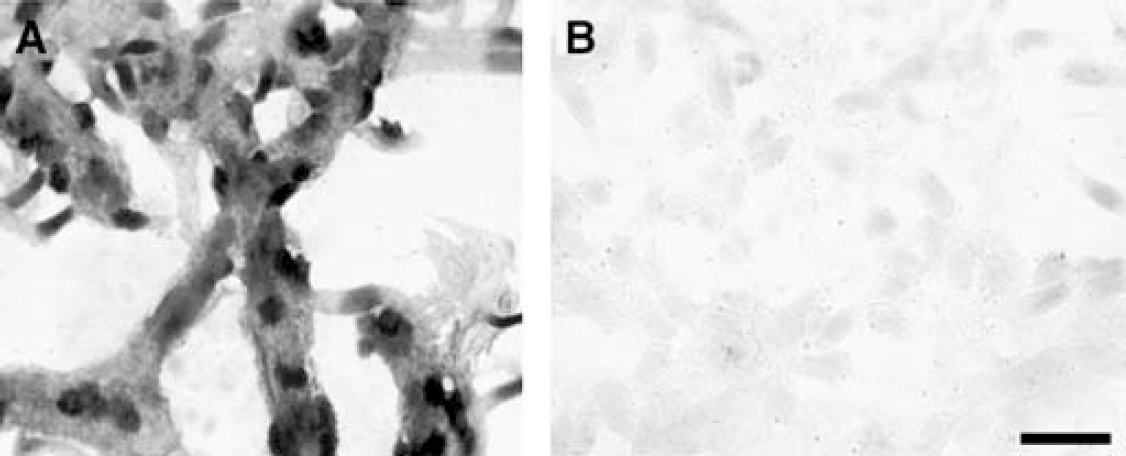
In situ hybridization with BSAT1 antisense (
Human 293 cells were permanently transfected with the pcDNA3.1 vector expressing either the rat BSAT1(orf), pcDNA/BSAT1(orf), or the full-length rat BSAT1 mRNA, pcDNA/BSAT1(fl), and [3H]E2G was used as a model organic anion substrate for both cell lines. There was minimal uptake of the [3H]E2G by 293 cells exposed to only lipofectamine, and the VD in these control cells was < 2 μL/mg protein. E2G transport into the 293/BSAT1(fl) cells was reduced several fold compared with E2G transport into 293/BSAT1(orf) cells (Figure 4). The reduced E2G transport in cells expressing the full-length BSAT1 mRNA was not due to poor expression of the transcript. Northern analysis of RNA isolated from 293/BSAT1(fl) cells showed abundant expression of the full-length 2.6 kb mRNA, whereas there is no transcript in either control 293 cells or 293 cells transfected with the empty pcDNA3.1 vector (Figure 5). These observations suggested that the translation of the BSAT1 protein was suppressed in cells expressing the full-length BSAT1 mRNA, as compared with the mRNA encoding only the BSA-T1(orf). Such translation arrest would be mediated by the interaction of cell proteins with the BSAT1(fl) mRNA. This was verified by an RNase protection assay using ultraviolet light cross-linking (Materials and methods). Although no bovine brain endothelial cytosolic proteins bound to the full-length cloned BSAT1 RNA (Figure 6, lane 3), there was prominent binding of endothelial polysome proteins to the BSAT1 cloned RNA (Figure 6, lane 1), including a doublet of approximately 50 kDa and a single protein of approximately 80 kDa. The suppression of BSAT1 translation could involve cis sequences in either the 5′- or 3′-UTR of the full-length mRNA. The observation that the translation of the full-length rat BSAT1 mRNA is suppressed in human 293 cells suggest there must be phylogenetic conservation of ucleotide sequence in either the 5′- or 3′-UTR of human BSAT1 (NM_017435) and rat BSAT1 (AF306546). Blast2 analysis indicates there is no conservation in the 3′-UTR. However, there is 77% identity in nucleotide sequence between human and rat BSAT1 mRNA (nucleotides 8 to 350 of rat BSAT1), where the 5′-UTR is composed of nucleotides 1 to 374. There is 100% nucleotide identity in multiple regions of the 5′-UTR with lengths up to 22 nucleotides (Figure 7).
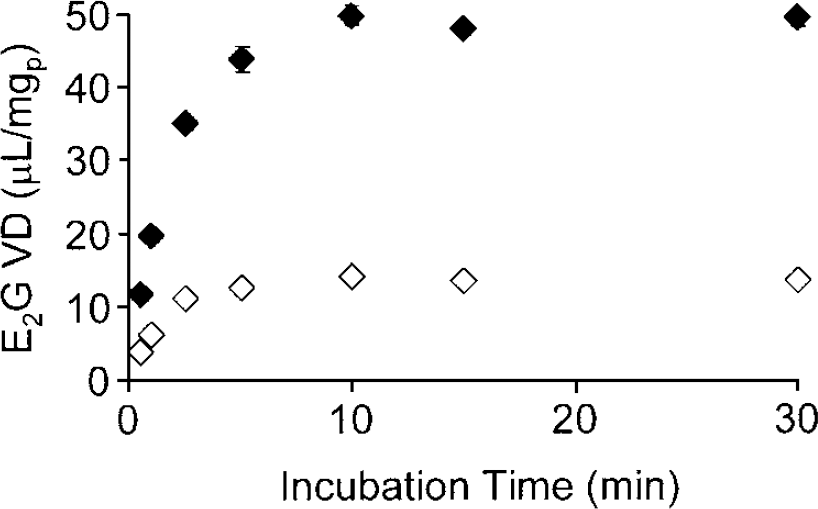
Time course of 3H-E2G uptake at 37°C in 293 cells permanently transfected with the pcDNA/BSAT1(orf) (closed diamonds) or the pcDNA/BSAT1(fl) (open diamonds). Data are mean ± s.e. (n = 3 dishes per time point). VD, volume of distribution. The VD of the E2G is corrected for the VD of sucrose.
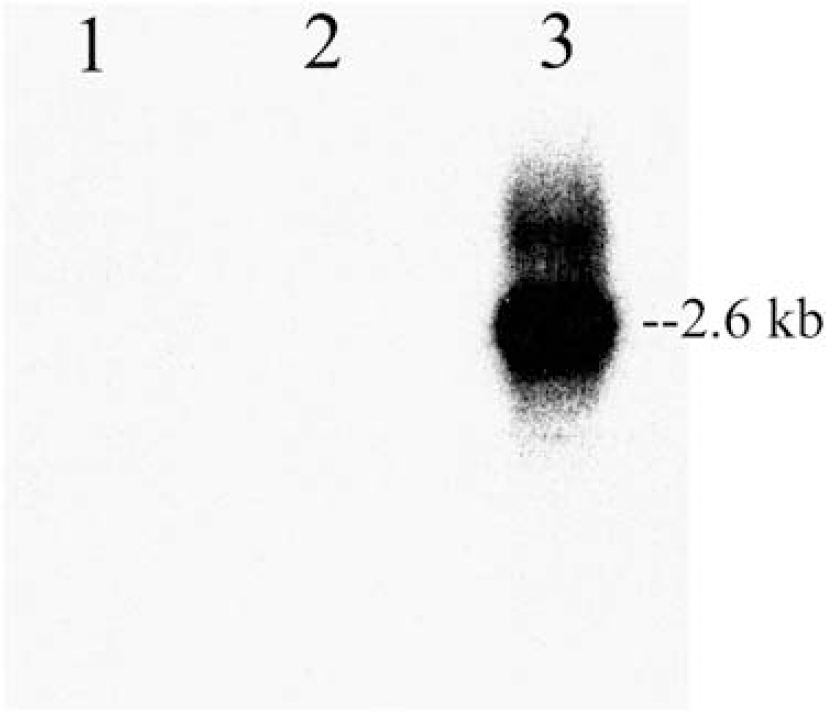
Northern blot of polyA(+) RNA probed with the 32P-rat BSAT1 cDNA. RNA was isolated from control 293 cells (lane 1), 293 cells transfected with the empty pcDNA3.1 vector (lane 2), and 293 cells transfected with the pcDNA/BSAT1(fl) (lane 3). The film was exposed to the blot for 16 h at −70°C.
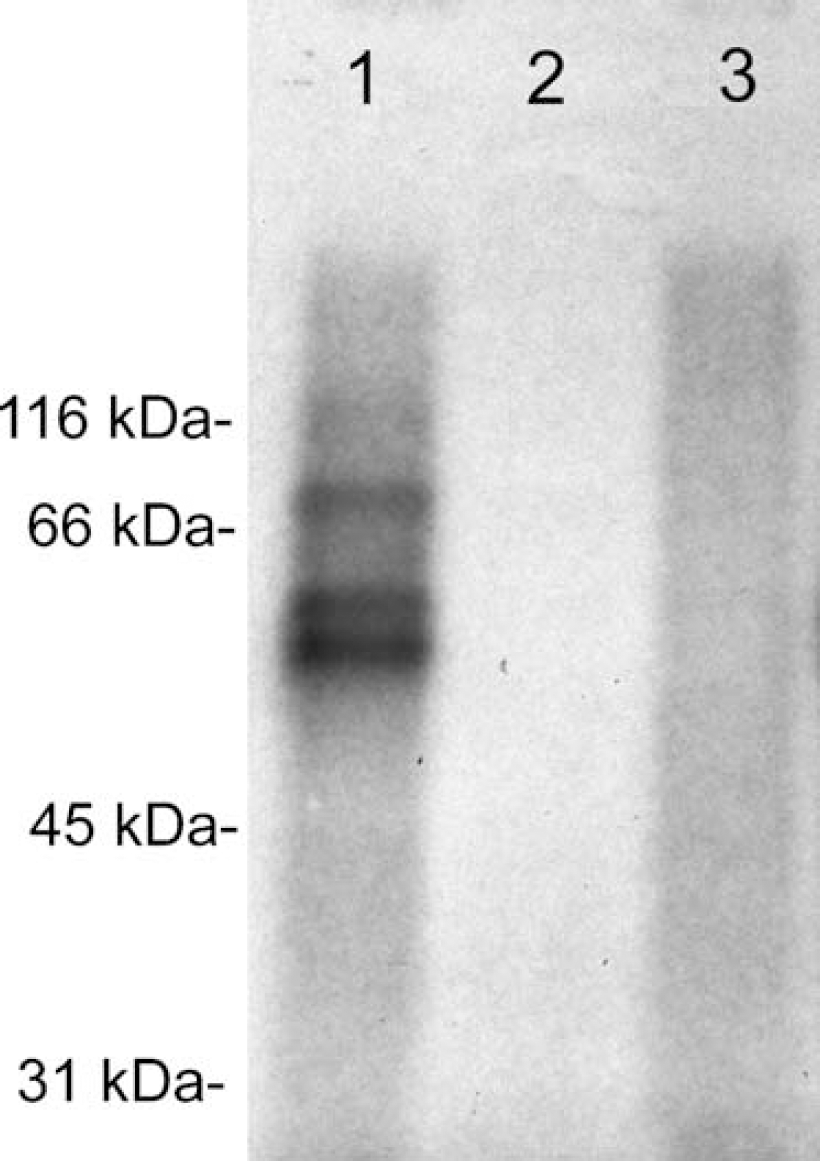
Ultraviolet light cross-linking of brain endothelial proteins to 32P-labeled full-length BSAT1 cRNA. RNA (2.0 × 10⁵ c.p.m.) was incubated with 2 μg protein from either the P100 polysome fraction (lane 1) or the S100 cytosolic fraction (lane 2) of bovine brain capillary endothelial cells, or buffer (lane 3), for 10 mins at 30°C. After RNase T1 digestion, the cRNA/protein mixture was resolved by electrophoresis in a 10% sodium dodecyl sulfate-polyacrylamide gel electrophoresis gel. Film autoradiography of the gel shows RNAse protection by three proteins selectively localized to the polysome fraction of the cell.
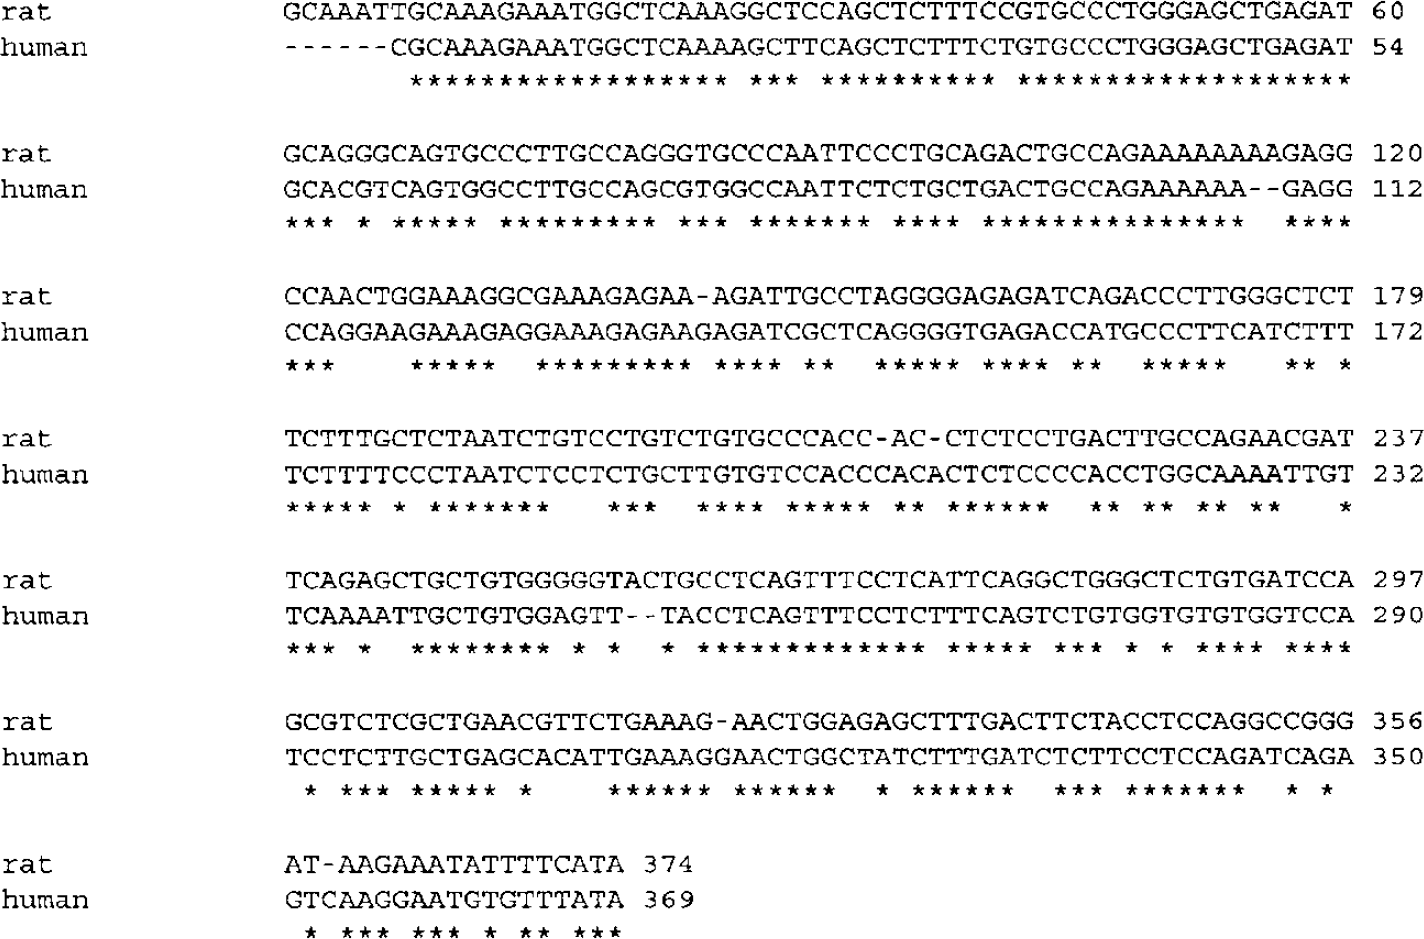
ClustalW alignment of nucleotide sequence of 5′-UTR of human and rat BSAT1 mRNA.
The saturation of E2G influx was measured at 2.5 mins, which is within the initial rate part of the time course of cell uptake (Figure 4). The E2G influx into the 293/BSAT1(orf) cells was saturable, with Km = 6.1 ± 0.5 μmol/L, Vmax = 72.8 ± 4.8 pmol/min per mg protein, and KD = 0.29 ± 0.07 μL/min per mg protein (Table 2). BSAT1 also transported azidothymidine (AZT), which inhibited E2G transport with Ki = 4.2 ± 0.7 mmol/L (Figure 8). The clearance of [125I]T4 at 2.5 mins by 293 cells permanently transfected with the pcDNA3.1 vector expressing the rat BSAT1(orf) and pcDNA/BSAT1(orf) was 108 ± 4 μL/min per mg protein, as compared with the clearance of [125I]T4 293 cells transfected with the empty vector, pcDNA3.1, which was 19 ± 4 μL/min per mg protein. Thyroxine transport via BSAT1 was saturable, and the T4 transport was characterized by a Km that was 9-fold lower than the E2G Km, and a Vmax that was not significantly different from the Vmax for E2G (Table 2). Unlabeled T4 also inhibited the transport of [3H]E2G with a Ki, 0.53 ± 0.09 μmol/L (Table 2) that was not significantly different from the Km of T4 self-inhibition (Table 2). However, the reverse was not observed. Unlabeled E2G does not inhibit [125I]T4 transport, as no inhibition was observed at very high concentrations of E2G (Table 2). This pattern was also observed with T3. Unlabeled T3 inhibited the transport of [3H]E2G with a Ki of 4.4 ± 0.7 μmol/L, but very high concentrations of unlabeled T3 were required to inhibit [125I]T4 transport (Table 2). The transporter was sodium independent, as the complete removal of NaCl from the medium by equi-molar replacement with choline chloride, at concentrations ranging from 0 to 110 mmol/L sodium, had no effect on the transport of [125I]T4.
Summary of kinetic parameters of BSAT1-mediated transport into transfected 293 cells
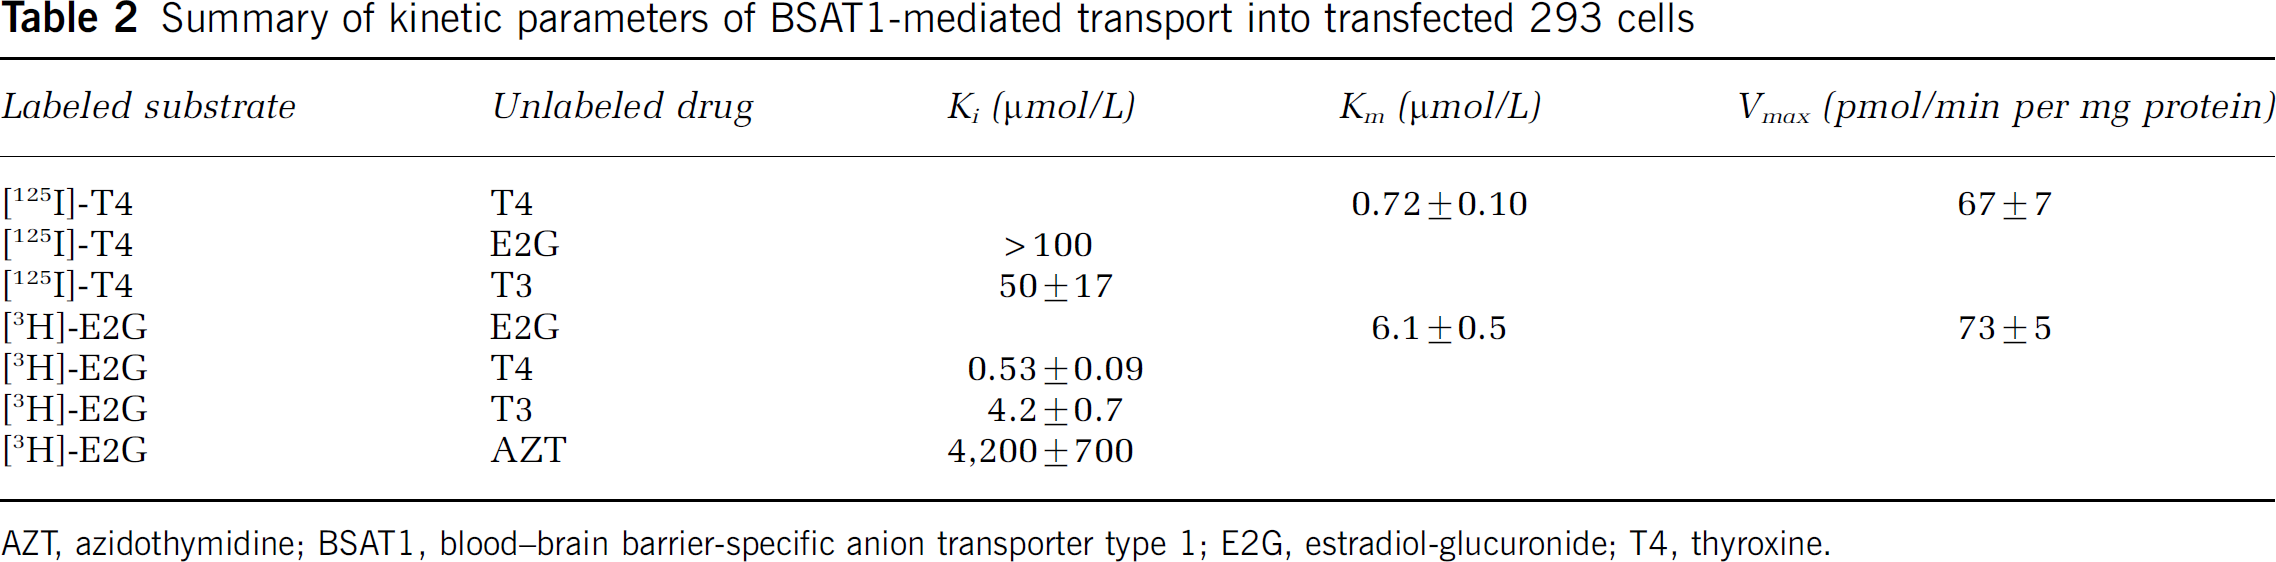
AZT, azidothymidine; BSAT1, blood-brain barrier-specific anion transporter type 1; E2G, estradiol-glucuronide; T4, thyroxine.
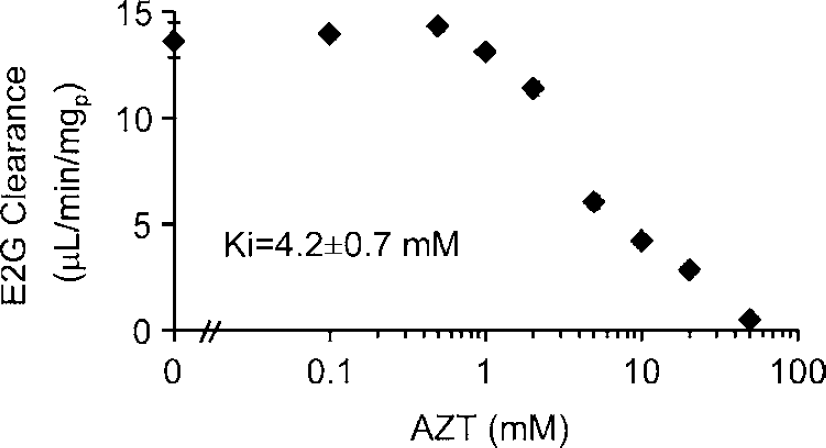
Competition of uptake of 3H-E2G transport by unlabeled AZT in 293 cells permanently transfected with the pcDNA/BSAT1(orf). Data are mean ± s.e. (n = 3 dishes per time point). All transport assays were terminated after 2.5 mins of incubation at 37°C.
Using the prealbumin trap technique to monitor the efflux of [125I]T4 from 293-BSAT1(orf) cells, the efflux was rapid and characterized by a rate constantof 0.082 ± 0.007 min−1, which is equivalent to a half-time of 8.5 ± 0.7 min (Figure 9). Thyroxine efflux was accelerated in the presence of 50 μmol/L E2G in the medium, which showed an efflux rate constant of 0.286 ± 0.032 min−1, which is equivalent to a half-time of 2.4 ± 0.3 min (Figure 9). The identical efflux experiment was performed with 293 cells transfected with the empty expression plasmid, and medium E2G had no effect on T4 efflux from these control cells. The rate constant of T4 efflux was 0.109 ± 0.007 and 0.101 ± 0.009 min−1 in the cells exposed to either 0 or 50 μmol/L E2G, respectively.
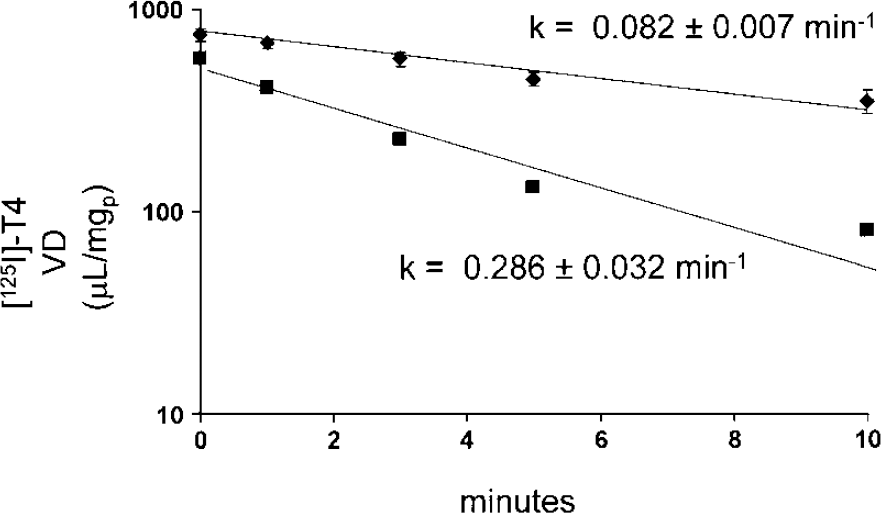
Thyroxine efflux from preloaded 293-BSAT1(orf) cells is monitored with the prealbumin trap technique (Materials and methods). The cells are exposed to fresh medium containing [125I]T4 for 15 mins, and either 0 (closed diamonds) or 50 μmol/L E2G (closed squares). The efflux is monitored starting with the addition of prealbumin to the medium at zero time, and the T4 efflux is linear for 10 mins. The addition of E2G to the medium accelerates the efflux of T4, as indicated by the 3.5-fold increase in T4 efflux rate constant.
Discussion
The results of these studies are consistent with the following conclusions. First, the SSH procedure allows for the rapid cloning of partial cDNAs corresponding to BBB-selective genes (Figure 1), and the availability of the brain capillary cDNA library allows for cloning of the full-length cDNAs corresponding to the BBB-selective gene. Second, one such gene, originally designated BSAT1 (Li et al, 2001a), is highly expressed at the BBB, and is not expressed in major rat peripheral tissues (Figure 2A). Third, unlike another BBB-selective gene, LAT1, which is expressed in rat glial tumors, the BSAT1 gene is not expressed in rat glial cells either in cell culture or as rat brain tumors (Figure 2B). Fourth, ISH shows the continuous microvascular immune staining (Figure 3), which indicates BSAT1 is expressed in the capillary endothelial cell. Fifth, the production of stably transfected 293 cell lines with the BSAT1(orf) results in the transport of organic anions, including E2G and T4 (Table 2). Sixth, the transporter mediates the efflux of T4 from cells, and this efflux is accelerated by extracellular E2G (Figure 9). Seventh, the expression of the transporter is suppressed in cells expressing the full-length BSAT1 mRNA as compared with the BSAT1(orf) (Figures 4 and 5), and this may be due to the interaction of the BSAT1 mRNA with specific polysome proteins (Figure 6), and conserved sequence within the 5′-UTR of the BSAT1 mRNA (Figure 7).
BSAT1 was originally isolated in a BBB genomics program using the SSH methodology (Li et al, 2001a). DNA sequence analysis indicated BSAT1 was an orphan transporter member of the oatp gene family. Sugiyama et al (2003) showed that E2G and T4 were ligands for BSAT1. This finding is confirmed by this study, which also shows a marked reduction in E2G transport via 293/BSAT1(fl) cells as compared with 293/BSAT1(orf) cells (Figure 4), despite high expression of the full-length BSAT1 mRNA (Figure 5). These observations suggest there is post-transcriptional regulation of BSAT1 gene expression, which produces low transporter in cells despite high mRNA levels. Such translational repression would be mediated by the binding of cellular proteins to specific sequences within the 5′- or 3′-UTR of the BSAT1 mRNA, similar to that previously showed for other BBB transporters, including the GLUT1 glucose transporter mRNA (Tsukamoto et al, 1996), or the LAT1 amino acid transporter mRNA (Boado et al, 2003b). The selective binding of brain endothelial polysome proteins to the full-length BSAT1 cloned RNA is showed in Figure 6. A triplet of polysome proteins bind to the BSAT1 RNA, whereas there is no binding of cytosolic proteins (Figure 6). The observation that there is minimal expression of the full-length rat BSAT1 mRNA in human 293 cells suggests there may be nucleotide conservation between the 5′-UTR of the human and rat BSAT1 mRNA. Blast2 analysis of the 374 nucleotide sequence of the rat BSAT1 mRNA 5′-UTR with the human genome indicates there is 77% sequence conservation between rat and humans approximately 350 nucleotides corresponding to nucleotides 8 to 350 of the rat BSAT1 mRNA 5′-UTR, where the methionine initiation codon starts at nucleotide 375 (Figure 7). Placement of cis-regulatory sequence within the 5′-UTR is supported by the observation that there is no phylogenetic conservation of BSAT1 mRNA sequence in the 3′-UTR of the transcript (Results), although the role of the 3′-UTR has not been investigated experimentally.
The hypothesis of translation repression of the BSAT1 mRNA may explain the unexpected finding of the very high level of BSAT1 mRNA in brain capillary endothelial cells (Figure 2). The high expression of BSAT1 mRNA at the BBB underlies the frequent detection of this transcript in BBB genomics programs (Li et al, 2001a; Enerson and Drewes, 2006). The level of the BSAT1 mRNA at the BBB is as high as any known transcript, and much higher than the level of the GLUT1 or LAT1 mRNA. It is hypothesized that the combined effects of a very high brain capillary endothelial level of the BSAT1 mRNA, in combination with translation repression, would allow for a very rapid activation of BSAT1 transporter activity via a post-transcriptional mechanism. The expression of the BSAT1 gene is highly focused to the BBB, as showed by the Northern blotting studies of rat organs in Figure 2A. The selective expression of the BSAT1 gene is further showed by the lack of BSAT1 gene expression in brain tumors (Figures 2B and 2C). The C6 and RG2 tumors are rat models of astrocytoma and glioblastoma multiform, respectively (Barth, 1998), and BBB-specific genes such as LAT1 are expressed in rat brain tumors (Boado et al, 1999). However, there is no BSAT1 gene expression in C6 or RG2 tumors (Figure 2). BSAT1 is expressed in the endothelium of the brain microvessel, based on the finding of continuous immunostaining in the ISH study (Figure 3).
The principal endogenous substrate of BSAT1 at the BBB is not known, although thyroxine has high affinity for this transporter (Tohyama et al, 2004), and these findings are extended in this study. E2G also is transported via BSAT1, and thyroxine inhibits E2G transport with a Ki value, which is not significantly different from the Km value of thyroxine self-inhibition (Table 2). However, the substrate kinetics for BSAT1 are asymmetric, as E2G does not inhibit T4 influx into the cell (Table 2). Moreover, T3 inhibits E2G transport, and the Ki for T3 is comparable to the Km for E2G (Table 2). However, T3 weakly inhibits T4 transport, and the Ki of T3 inhibition of T4 influx is approximately 10-fold higher than the Ki of T3 inhibition of E2G transport (Table 2). These findings indicate BSAT1 is composed of asymmetric transport sites, which may arise from an asymmetric topology of the transporter within the membrane. Such asymmetric topology has been described for other transporters (Kilic and Rudnick, 2000; Tate et al, 2001), including other BBB transporters such as CNT2 (Li et al, 2001c). One site on the transporter is selective for T4 and does not transport E2G or T3. The other site transports all three substrates, with an approximate of 10-fold higher affinity for T4 as compared with E2G or T3 (Table 2).
BSAT1 is also an efflux system. The use of the prealbumin trap technique (Materials and methods) allowed for immediate restriction of influx of thyroxine, which is avidly bound by prealbumin. The prealbumin trap technique allows for accurate measurements of the kinetics of T4 efflux via BSAT1. The T4 efflux via BSAT1 is rapid with a half-time of 5.1 ± 0.2 min (Figure 9). Preloading the medium with unlabeled E2G accelerated the efflux of T4 from transfected cells by nearly fourfold (Figure 9). The design of the T4 efflux study takes advantage of the asymmetric kinetic properties of BSAT1 regarding T4 and E2G. The E2G in the medium has no effect on the T4 influx during the initial loading period, but the presence of E2G in the extracellular space accelerated the efflux of intracellular T4. These findings indicate that BSAT1 is a sodium-independent exchanger. The influx of E2G via BSAT1 accelerates the efflux of T4 via the transporter, since both ligands share binding sites on the same transporter protein.
There is no ultrastructural data that localizes BSAT1 to either the luminal or abluminal membrane of the brain capillary endothelial cell. However, it can be inferred that BSAT1 is an active efflux transporter at the BBB. This is because E2G is a high-affinity ligand for BSAT1 (Table 2), but sex steroid conjugates in blood do not enter brain (Pardridge et al, 1988). However, E2G is actively effluxed across the BBB from brain to blood (Sugiyama et al, 2001). Blood—brain barrier BSAT1 may function to mediate the efflux of iodothyronines, steroids, and other ligands that are conjugated via brain metabolism. In addition, BSAT1 may serve as a drug efflux system at the BBB. This study shows that AZT is transported via BSAT1 (Figure 8) with a Km comparable to that of AZT transport into brain microglial cells (Hong et al, 2001). However, it is unlikely that BSAT1 is the microglia AZT transporter, since BSAT1 is not expressed in glial cells (Figures 2B and 2C). AZT is also transported via other organic anion transporters, including members of the organic anion transporter family (Hong et al, 2001; Wada et al, 2000; Takeda et al, 2002). The availability of the 293/BSAT1(orf) cell line allows for future screening of other drugs that are potential substrates for the BSAT1 BBB active efflux transporter.