
Abstract
In this study, the neurovascular coupling relationship was noninvasively studied in the human visual cortex. Graded neuronal/hemodynamic suppression conditions were generated using a paired-stimulus paradigm. Visual evoked potential was measured to quantify neuronal activity. Hemodynamic activities were measured and quantified by perfusion and blood oxygenation level-dependent changes. All quantification was normalized to the same activation condition induced by a single stimulus paradigm within each experimental session. This experiment design eliminated the confounding factors such as anesthesia and inconsistent neurovascular coupling patterns within and/or among tasks. The results reveal that (i) there is a tight neurovascular coupling at graded neuronal suppression conditions; (ii) the neurovascular coupling relationship contains a subtle, but significant, nonlinear component; and (iii) the linear model, nevertheless, is still a good approximation reflecting the neurovascular coupling relationship. This study extends the range of the neurovascular coupling relationship from graded neuronal excitation conditions to graded neuronal suppression conditions.
Keywords
Introduction
Brain function is characterized by distributed yet localized neuronal activities. Local neuronal activities, although occurring in different brain regions with variable amplitudes, are always spatially coupled with vascular and metabolic changes (Roy and Sherrington, 1890; Sokoloff, 1981). These accompanied vascular and metabolic changes (also referred as perfusion-related changes)—including cerebral blood flow (CBF), cerebral blood volume (CBV), and cerebral metabolic rate of oxygen (CMRO2) and glucose—have been widely used to infer local neuronal activities. Neuroimaging techniques, such as functional magnetic resonance imaging (fMRI), positron emission tomography, single-photon emission computed tomography, optical imaging, and near-infrared spectroscopy, have been used to measure these vascular and metabolic changes in neuroscience research and application.
Despite its robustness, activity-dependent perfusion-related change is a complicated result of several cascaded processes. These processes include neuronal processing to external input, neurovascular coupling, and vascular response. Quantitatively inferring neuronal activity from accompanied perfusion-related signal implicitly assumes a linear neurovascular coupling relationship. Unfortunately, this assumption is yet to be completely validated and findings in the literature remain controversial (Arthurs et al, 2000; Brinker et al, 1999; Devor et al, 2003; Hewson-Stoate et al, 2005; Hoffmeyer et al, 2007; Martin et al, 2006; Mathiesen et al, 1998; Nemoto et al, 2004; Ngai et al, 1999; Norup Nielsen and Lauritzen, 2001; Sheth et al, 2003, 2004; Wan et al, 2006). For instance, a linear neurovascular coupling relationship was reported in the rat somatosensory cortex (Brinker et al, 1999; Ngai et al, 1999). Nevertheless, Devor et al (2003) observed a nonlinear power—law relationship in similar brain areas in the same species. Sheth et al (2004) suggested the neurovascular coupling relationship can be better described by nonlinear power-law or threshold models compared with a linear model.
A variety of possibilities could lead to the discrepancy described above: a significant possibility being anesthesia. Notably, the majority of literature studies addressing the issue of neurovascular coupling used the anesthetic rat model (Brinker et al, 1999; Devor et al, 2003; Hewson-Stoate et al, 2005; Martin et al, 2006; Mathiesen et al, 1998; Nemoto et al, 2004; Ngai et al, 1999; Norup Nielsen and Lauritzen, 2001; Sheth et al, 2003, 2004). Recently, Martin et al (2006) have showed that anesthesia has a profound effect on both temporal and amplitude characteristics of neuronal and hemodynamic activities. They found a linear neurovascular correlation in awake rat, whereas a strong nonlinear correlation was found in anesthetized animals (Martin et al, 2006). This observation suggests that the neurovascular coupling relationship is intrinsically sensitive to different levels of anesthesia. Hence, an experiment design that can rule out this confounding factor should provide better insight in studying neurovascular coupling, in particular for the human brain function study.
Another factor that could potentially obscure the neurovascular coupling relationship is complex and nonuniform neuronal responses within each experimental task such that inconsistent neurovascular coupling patterns can be induced within and among tasks. In aforementioned studies, stimuli used were usually in the form of a train of electrical or mechanical pulses that activated rat somatosensory cortex. Neuronal activities were then quantified by integrating the magnitude of evoked potentials for a certain stimulation period. In these studies, delays between consecutive stimulation pulses can be as short as 100 to 200 ms (corresponding to 5 to 10 Hz stimulation) in a stimulation train. At such short delays, evoked potential can be remarkably nonuniform within task as showed by a number of publications: some evoked potentials are diminished, whereas some others are pronounced (Ogawa et al, 2000; Sheth et al, 2003, 2004). Under this circumstance, amplitude of diminished evoked potentials might not be large enough to induce any hemodynamic change, provided the threshold effect exists, whereas pronounced ones can. As a result, the accompanied hemodynamic changes probably follow different patterns so that inconsistent neurovascular coupling relationship can exhibit from pulse to pulse and from train to train. Similar argument applies to other nonlinear relationships that possibly exist in the neurovascular coupling relationship. Consequently, integrating all evoked potentials within entire stimulation train and pooling all the integrals from different trains possibly either mask the true relationship or induce an artificial one.
To overcome these obstacles, a noninvasive experimental design that uses a paired-stimulus paradigm has been applied to study the neurovascular coupling relationship in human visual cortex. A paired-stimulus paradigm is composed of two brief stimuli with a variable interstimulus interval (ISI) between them. Relatively, long intertrial interval (ITI) is allowed between two consecutive pairs to avoid interpair interference. As a result, consistent neuronal activities and neurovascular coupling relationship are repeatedly generated from pair to pair. Neuronal and hemodynamic activities can be modulated by varying ISI to elicit graded levels of neuronal suppression lasting only within stimulation pair, thus exerting no effect on the following pair (i.e., every stimulation pair elicits the same neuronal activity and neurovascular coupling within entire task). This paradigm has been extensively used to extract fast temporal information of neuronal interaction based on the amplitude change of slow blood oxygenation level-dependent (BOLD) response of fMRI (Ogawa et al, 2000; Zhang and Chen, 2006; Zhang et al, 2005). There are several advantages using a paired-stimulus paradigm to investigate neurovascular coupling. First, the neuronal response to each individual stimulus can be unambiguously quantified by the amplitude of the corresponding evoked potential, so that integrating evoked potentials for a certain stimulation period used in invasive animal studies is not needed. Second, owing to a relatively long ITI, neuronal and hemodynamic responses to the first stimulus of paired stimuli (conditioning stimulus) are always constant and variation of the activities is solely determined by the responses to the second stimulus (test stimulus), which are the function of ISI (Nelson, 1991a, b ; Ogawa et al, 2000). Therefore, by normalizing all the variable activities from the second stimulus to a constant activation condition within each experiment, it is feasible to allow inter-and intrasubject comparison of neuronal and hemodynamic responses in a variety of conditions. Third, this normalization method further allows a direct and quantitative comparison of activities from different signals modalities (e.g., between evoked potential and CBF) at the same stimulation condition regardless of the absolute signal change.
In this study, a pair of brief flashing lights with ISIs ranging from 100 to 800 ms has been used to elicit various levels of neuronal suppression in human visual cortex. Neuronal activity has been measured and quantified by visual evoked potentials (VEPs) induced by the stimuli. Perfusion-based fMRI has been acquired to quantify the hemodynamic response to the same paradigm. All the activities have been normalized to a single-flash condition, and the neurovascular coupling relationship has been examined by comparing the normalized amplitudes of the corresponding neuronal and hemodynamic activities.
Materials and methods
Eleven subjects (eight males and three females, 19–29 years old; seven for the fMRI experiment and four for the VEP experiment) participated in this study. The number of subjects needed for the VEP experiment was smaller because of relatively high reproducibility of VEP signal across subject. The subjects provided informed consent, which was approved by the Institutional Review Board of the University of Minnesota.
Visual stimulation presented as short flashing light (10 ms duration per flash) was generated by a pair of LED goggles (Grass Instruments, Quincy, MA, USA). Visual stimuli consisted of a pair of binocular flashes separated by an ISI. Six ISIs of 100, 200, 300, 400, 600, and 800 ms, which induced graded suppression of neuronal activity in response to the test stimulus were chosen. It has been shown that interference between two flashes disappears if the interflash delay is longer than 1 sec in human visual cortex (Ogawa et al, 2000). Therefore, the same ITI of 2 secs was chosen for all the experiments to ensure consistent neuronal response and neurovascular coupling induced by each stimulation pair within the same task.
All fMRI studies were performed on a 4 T/90 cm bore magnet (Oxford, UK) system interfaced with the Varian INOVA console (Varian Inc., Palo Alto, CA, USA). A half-volume quadrature 1H radiofrequency surface coil was used to allow for sufficient radiofrequency field homogeneity in the visual cortex. Head motion was limited with a foam-padded holder. At the beginning of the experiment, axial, sagittal, and coronal anatomic MR images were acquired by a conventional T1-weighted TurboFLASH method (Haase, 1990). On the basis of anatomic images, flow-sensitive alternating inversion recovery (FAIR) images using conventional gradient-echo echo-planar imaging sequence were acquired (Kim, 1995). During FAIR acquisition, single-slice coronal images located in the middle of calcarine fissure with echo-planar imaging acquisition preceded by slice-selective inversion recovery and nonslice-selective inversion recovery were obtained in an interleaved manner. Typical imaging parameters were field of view (FOV) = 20 × 20 cm2; 64 × 64 image matrix size; inversion time (TI) = 1.4 secs, echo time (TE) = 24 ms; repetition time (TR) = 4 secs; 1 coronal slice; 5-mm-slice thickness. Since the characteristic of FAIR images is interleaved acquisitions of label and control images, it is possible that difference in blood oxygenation status between the two consecutive scans can cause incomplete cancellation of the static signal on image subtraction, resulting in a BOLD-related artefact in the CBF signal (Lu et al, 2006). To eliminate this potential detrimental BOLD effect, FAIR images were generated using a ‘surround subtraction’ strategy suggested in the literatures (Liu and Wong, 2005; Lu et al, 2006; Wong et al, 1997). Blood oxygenation level-dependent signal was obtained from nonslice-selective inversion recovery images in which T1 contrast is absent.
The fMRI experiment was conducted in a block design manner. During the task period, paired flashes with a selected ISI was repeatedly presented with a relatively long ITI (2 secs) to avoid interference between consecutive pairs (Ogawa et al, 2000). Each fMRI run was composed of three task periods (eight pairs of FAIR images each period), sandwiched by four control periods (eight pairs of FAIR images each period) when the subject was in uniform darkness. The same ISI was used within each fMRI run. A total of six fMRI runs corresponding to six different ISIs were acquired in a pseudorandomized order for each study. One additional run was acquired as a calibration control with the same experimental setting except that a single flash was repeatedly presented with the same ITI (2 secs) during the task period. The fMRI data were averaged within each run (n = 3) for subsequent data processing.
All the fMRI data analysis was performed using the STIMULATE software package (Stimulate, Center for Magnetic Resonance Research, University of Minnesota Minneapolis, Minnesota, USA) (Strupp, 1996) and Matlab (The Mathworks Inc., Natick, MA, USA). Three FAIR image pairs after the onset of stimulation were excluded to allow hemodynamic signal to reach steady state (Hoge et al, 1999a, b ). Because no obvious undershoot was observed in CBF data, only one image pair after the cessation of stimulation was excluded to account for hemodynamic delay. Cerebral blood flow activation maps were generated using the cross-correlation (CC) method with a boxcar function as the reference (Bandettini et al, 1993; Xiong et al, 1995). The voxels located at the proximity of calcarine fissure were included in the region of interest. The time course for each task was averaged from the activated ROI voxels with CC > 0.45 (P < 0.001) (Xiong et al, 1995). Blood oxygenation level-dependent contamination in CBF time course was corrected using the equation suggested in the literature (Kim, 1995; Kim et al, 1997). Amplitude of CBF activities in all conditions was calculated as percentage change. All CBF amplitudes were then normalized to the single-flash condition. The same processing was performed on BOLD images.
The VEP experiment was conducted inside an electrically shielded room. The paradigm was identical to that used in the fMRI experiment. Continuous electroencephalography (EEG) signals were acquired from 64 channels placed according to the standard 10–10 montage (BrainAmp MR 64 Plus, Brain Products, Gilching, Germany). The scalp potentials were referred to Cz and digitized at 1,000 Hz with 0.3 to 70 Hz bandpass filtering and 60 Hz notch filtering. Vertical eye movements and blinks were monitored with an electrode above the left eyebrow. During the off-line processing, the electrooculograph artifacts were semiautomatically identified and rejected from the subsequent analysis. The signals were further low-pass filtered at 40 Hz. Then they were segmented from 100 ms before and 500 ms after the stimulation for paired-flash conditions. For the single-flash condition, the signals were segmented from 100 ms before and 1,300 ms after the stimulation. After the segmentation, linear trend correction and baseline correction were sequentially performed. At least 200 segments were averaged to obtain the final VEP signal.
Neuronal activity was quantified by the amplitude of VEP peak, which was defined as the difference between the peak height and peak offset (Arthurs et al, 2000; Brinker et al, 1999; Ogawa et al, 2000). The quantification of the second VEP peak in paired-flash conditions needs to eliminate the superimposed signal from its preceding VEP signal. This step was accomplished by subtracting the VEP signal for the single-flash condition from that of paired-flash conditions, considering the fact that the first VEP peak in paired-flash conditions is constant and is the same as the peak in the single-flash condition (Nemoto et al, 2004; Ogawa et al, 2000 and Results). All VEP amplitudes were finally normalized to the single-flash condition.
Normalized neuronal and hemodynamic responses were fit to three models suggested in the literature: a linear model (Y = AX) and two nonlinear models including a threshold model (Y = AX+B) and a power-law model (Y = AXb) (Brinker et al, 1999; Devor et al, 2003; Ngai et al, 1999; Sheth et al, 2004), using least-square regression to examine the linearity of the neurovascular coupling relationship. Fitting performance between the linear and nonlinear models was evaluated using a method introduced in a previous publication (Endre and Duggleby, 1993). The rationale of this evaluation method is briefly described here.
When a mathematical model is fitted to an experimental data set by regression analysis, a residual sum of square (RSSc) is calculated with Vc degrees of freedom. If the same data set is fitted by a reduced model, which is a subset of the first one, a new and greater value of residual sum of square, RSSr, with a larger number of degrees of freedom, vr, will be calculated. If the increase in the sum of squares associated with the reduced model is purely ascribed to statistical fluctuation, reduced model can be used to replace the original model because the original model overfits the data; if the increase in the sum of squares associated with the reduced model is due to lack of fitting (underfitting), the reduced model has to be rejected. Comparison between the variance due to lack of fit (σ2lf) in the reduced model and the variance due to pure error (σ2pe), which is assumed to be approximated by the variance of the fit by the original model, illustrates the relative fitting performances between the two models (Ellis and Duggleby, 1978). The value of F score is calculated from the ratio of these variances:
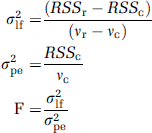
If the calculated value of F is larger than that for probability P with (vr–vc, vc) degrees of freedom, there is less than P chance that the increased sum of squares is solely due to random fluctuations. In the case that P is smaller than the statistical threshold, the reduced model should be discarded. In the present study, the reduced model is the linear model and the original model is either the threshold model or the power-law model.
Results
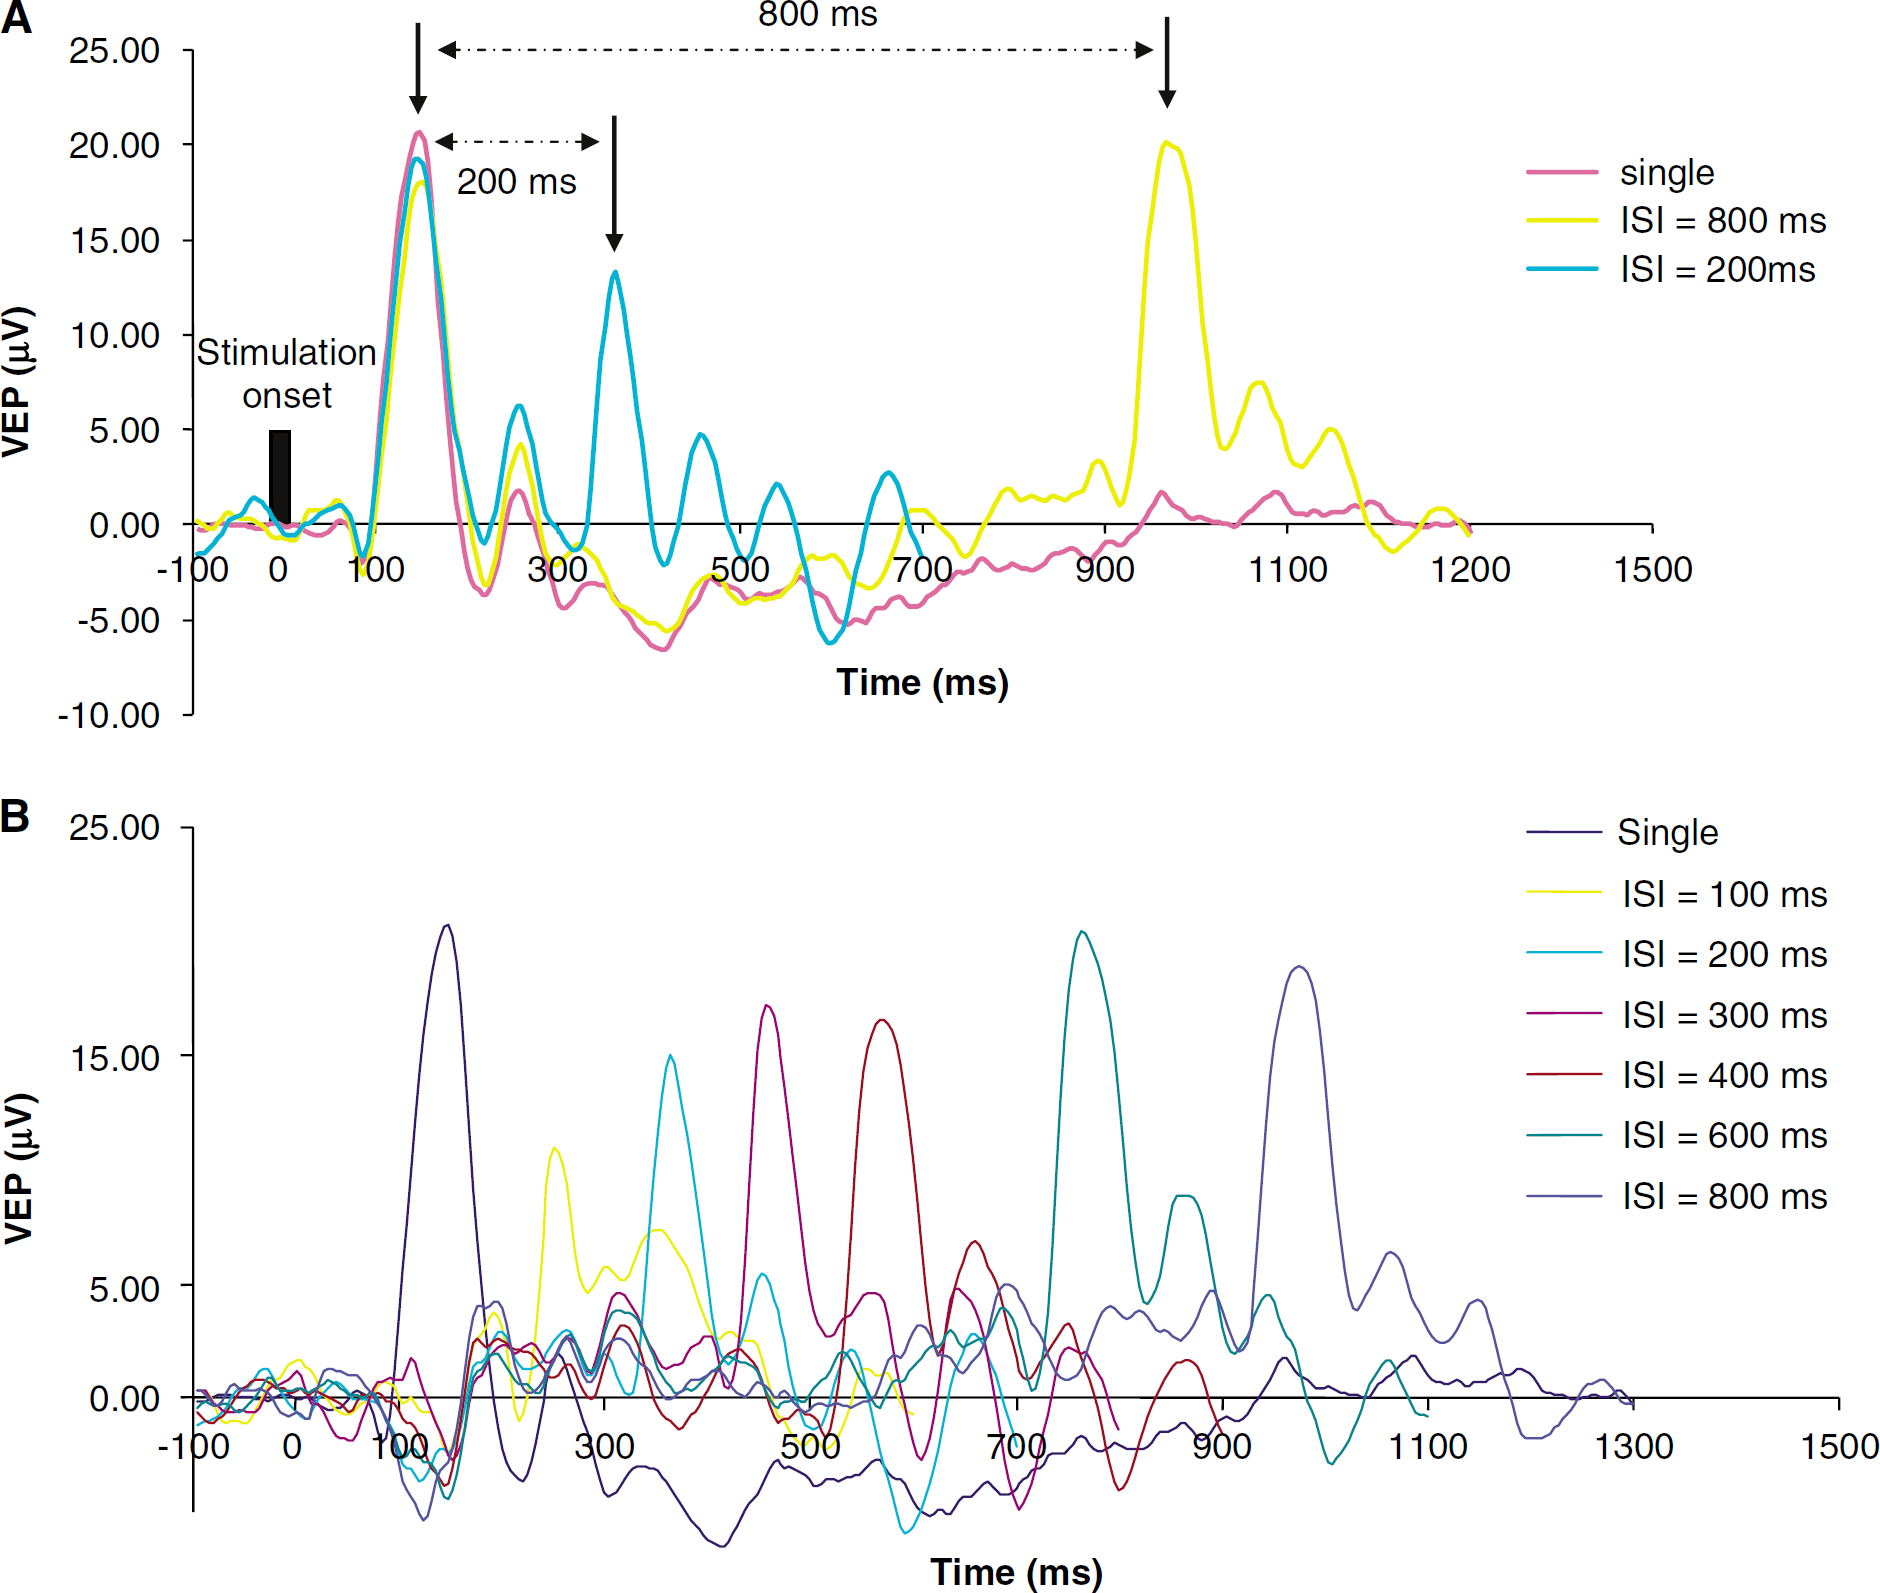
Figure 1A shows the averaged VEP waveforms from the single-flash condition and two paired-flash conditions from one representative subject. Figure 1B shows the VEP peak from the single-flash condition and the second (test) VEP peaks from the paired-flash conditions after the superimposed signals of the first (conditioning) peaks were removed. All data are from the ‘Oz’ VEP channel. The VEP waveform is consistent with our earlier measurement (Im et al, 2006). The data indicate that the first VEP peak in the paired-flash conditions is independent of ISI and statistically identical to that in the single-flash condition, whereas the second VEP peak strongly depends on ISI. At short ISIs, neuronal activity in response to the test flash is significantly suppressed, whereas this suppression gradually disappears when ISI becomes longer. This notion can be manifested in Figure 2, in which the VEP amplitudes of both peaks from the paired-flash conditions were normalized to that from the single-flash condition. A value < 2 signifies proportional suppression in neuronal activity at paired-flash conditions. Statistically, there is no significant difference in VEP amplitudes between the first peak at the paired-flash conditions and the peak at the single-flash condition at all ISIs (Table 1). By contrast, VEP response to the second flash at the paired-flash conditions is significantly weaker than the response to the first flash at short ISIs; this difference gradually becomes smaller, eventually disappearing, when ISIs get longer (Table 1). These data verify that suppression of neuronal activity during paired-flash conditions results entirely from neuronal response to the second flash at different ISIs, and the ITI chosen in this study is long enough to ensure consistent neuronal response and neurovascular coupling induced by each stimulation pair within the task period.
Comparisons of normalized VEP amplitudes in the single- and paired-flash conditions
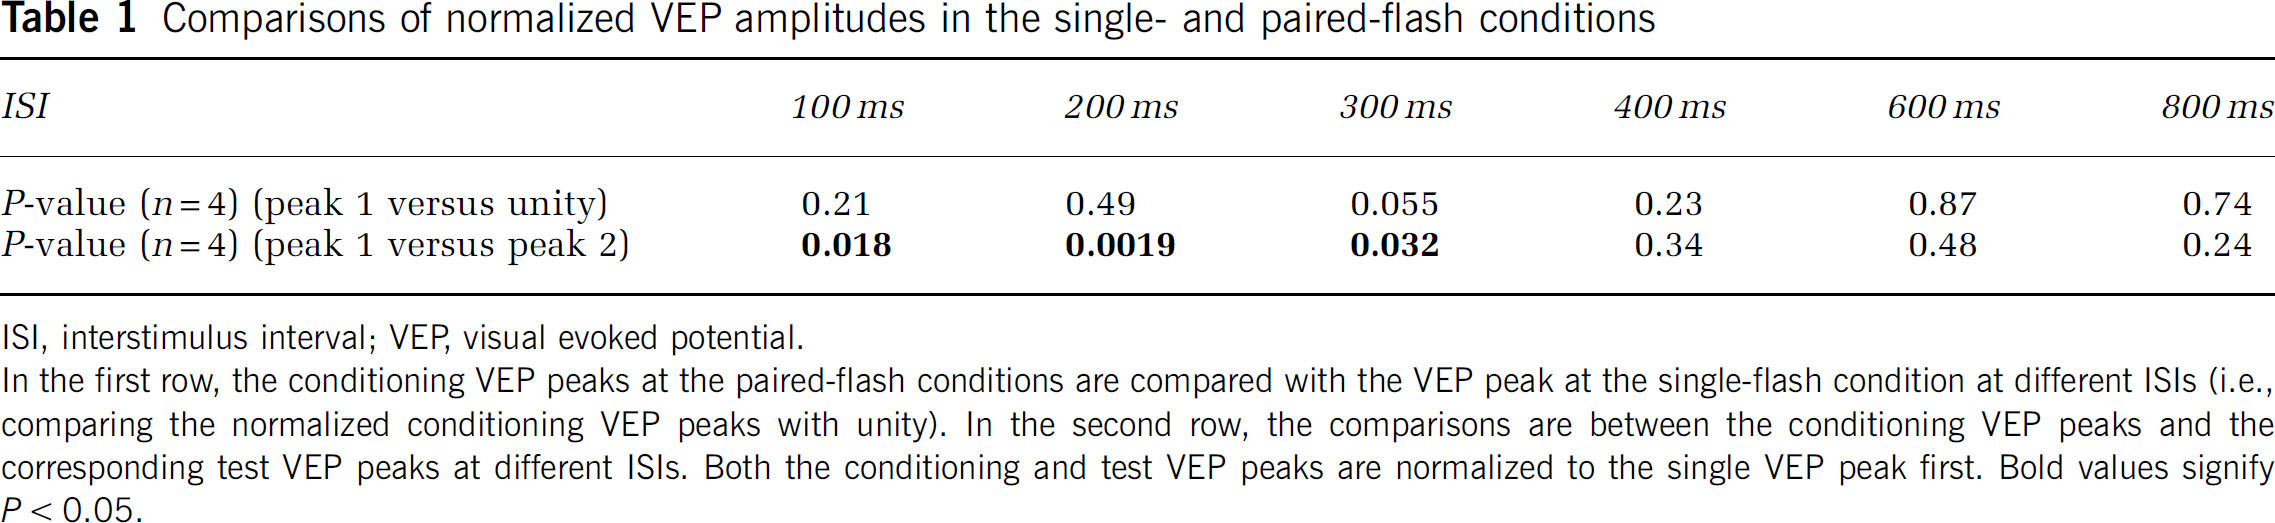
ISI, interstimulus interval; VEP, visual evoked potential.
In the first row, the conditioning VEP peaks at the paired-flash conditions are compared with the VEP peak at the single-flash condition at different ISIs (i.e., comparing the normalized conditioning VEP peaks with unity). In the second row, the comparisons are between the conditioning VEP peaks and the corresponding test VEP peaks at different ISIs. Both the conditioning and test VEP peaks are normalized to the single VEP peak first. Bold values signify
P < 0.05.
(
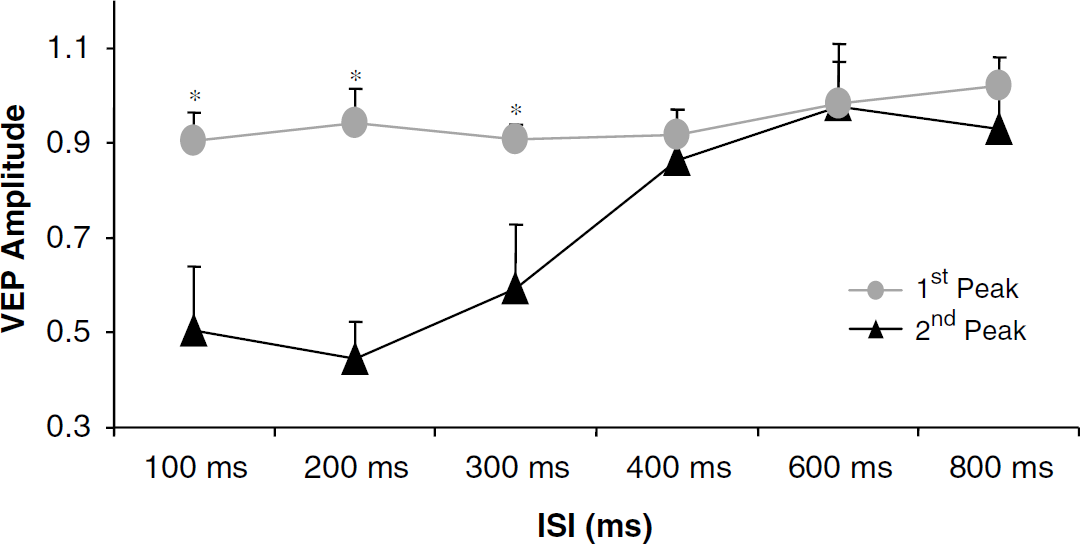
Normalized amplitudes of the conditioning and test VEPs at different ISIs. Data are the average from four subjects and bars indicate 1 s.e.
Hemodynamic response to the stimulation paradigm is shown in Figure 3. As the hemodynamic activities induced at the paired-flash conditions are normalized to that at the single-flash condition, it allows intersubject averaging of normalized time courses from the same stimulation condition. Figure 3 shows the time courses and averaged amplitudes (represented by the heights of the square waves) of normalized CBF changes at the single-flash and paired-flash conditions averaged from all the subjects. The first three FAIR pairs after the onset of stimulation (dark-gray portion in the figure) were discarded to allow the hemodynamic signal to reach steady state. A value < 2 signifies proportional suppression in hemodynamic activity at paired-flash conditions. It is evident that hemodynamic activity is significantly suppressed at short ISI, whereas this suppression is progressively reduced at long ISI.
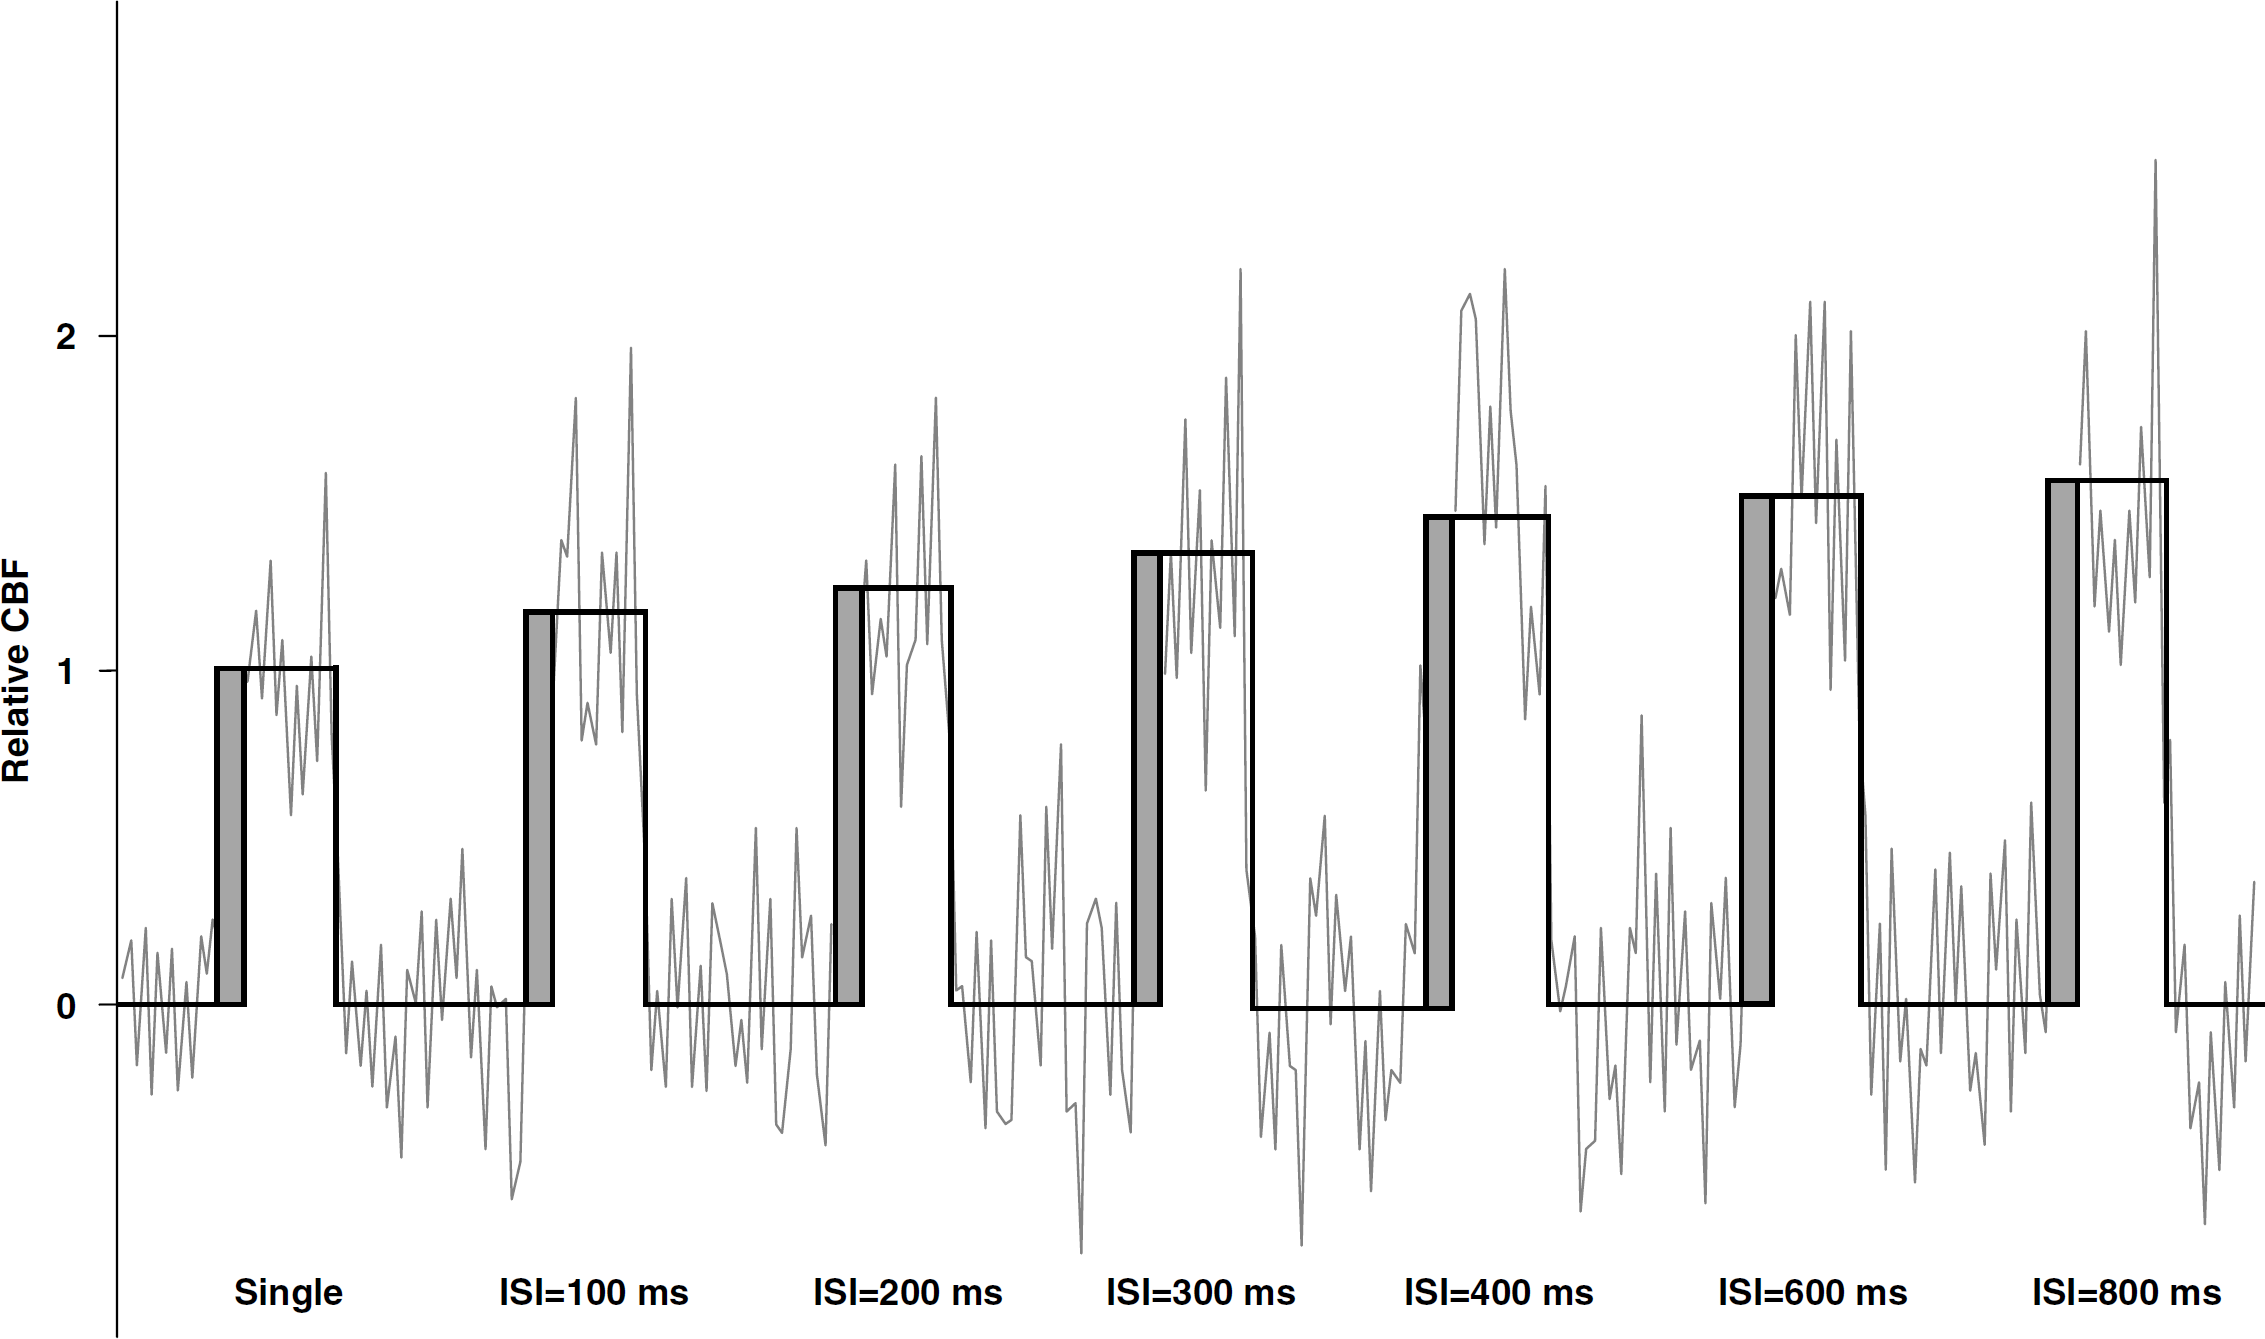
Averaged time courses and amplitudes (represented by the heights of the square waves) of normalized CBF changes at the single- and paired-flash conditions. A value of 1 represents the amplitude of CBF activity at the single-flash condition. The averaged time courses were generated by the following process. The time course of each stimulation condition was firstly averaged from the signal intensity of activated ROI voxels. The obtained time course in absolute signal intensity was then converted into percentage change. Subsequently, the calculated time courses in percentage change of all the stimulation conditions were normalized to the single-flash condition within each fMRI session. This processing method allows intersubject averaging of time courses from the same stimulation condition regardless of absolute signal change. Finally, the normalized time courses were averaged across all subjects. The first three FAIR pairs after the onset of stimulation (dark-gray portion in the figure) were discarded to allow the hemodynamic signal to reach steady state and CBF amplitude was quantified using the steady-state data.
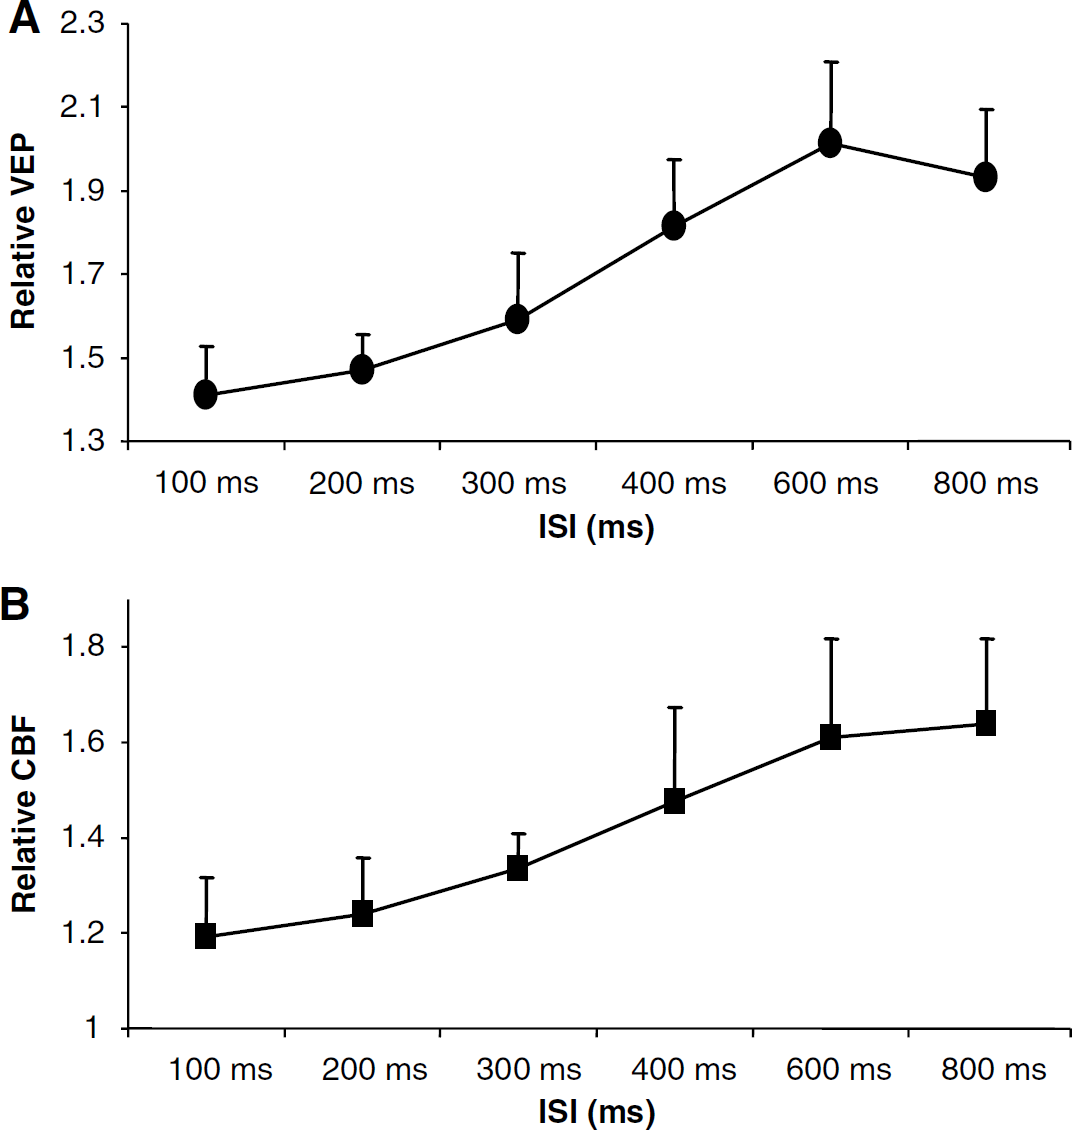
Figure 4A shows the summation of the normalized amplitudes of conditioning and test VEPs as a function of ISI averaged from all subjects. The summed amplitudes represent total normalized neuronal activities elevated by the paired-flash stimulation at different ISIs. Figure 4B shows ormalized CBF amplitudes at paired-flash conditions as a function of ISI averaged from all subjects. The data in Figure 4B represent total normalized hemodynamic activities elevated by the paired-flash stimulation at different ISIs. Both neuronal and hemodynamic responses show a similar trend of significant suppression at short ISIs and a progressive recovery at long ISIs, indicating a tight coupling between the two physiologic activities at graded suppression levels of neuronal activity in response to the visual stimuli.
(
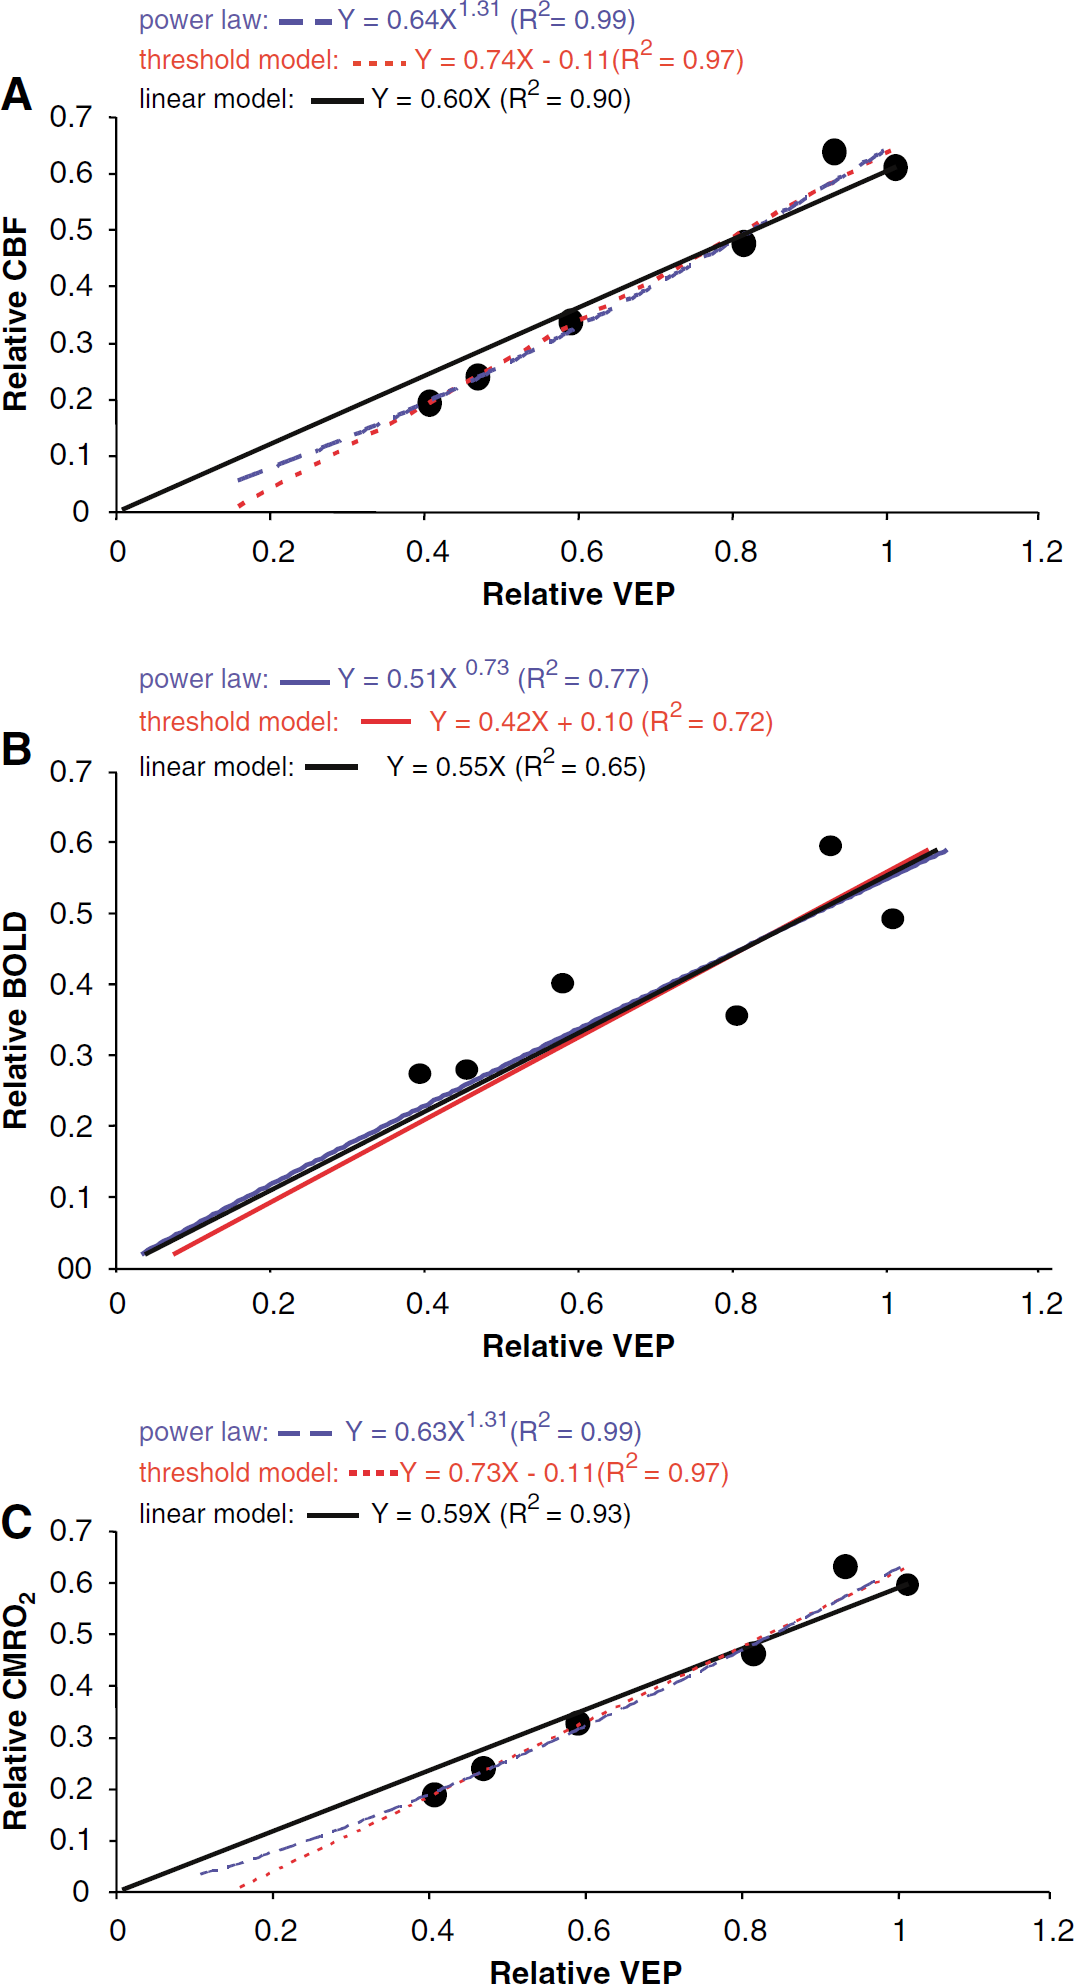
The correlation between neuronal and hemodynamic activities across all the paired-flash conditions is showed in Figure 5. To only account for the variable part of the activities, the contribution of the neuronal and hemodynamic responses to the first flash is removed from the normalized total neuronal and hemodynamic activities (i.e., a unity is subtracted from the relative amplitudes of total neuronal and hemodynamic activities, respectively) before the correlation is calculated. Data are fit to three different models mentioned in Materials and methods. Fitting performance of the linear model is evaluated by comparing with the threshold model and the power-law model, respectively. The results reveal that the threshold model fits the data significantly better than the linear model (F(1,4) = 11.34, P = 0.028). Similarly, the power-law model fits the data significantly better than the linear model (F(1,4) = 12.93, P = 0.023). Collectively, the data suggest that the neurovascular coupling relationship might not strictly follow a linear pattern and can be better described by nonlinear functions such as threshold or power-law models. However, the linear model still offers a fair approximation reflecting the neurovascular coupling relationship (R2 = 0.9), at least within the dynamic ranges of VEP and CBF changes as studied in this work. Notably, the dynamic ranges in this study are limited and the neurovascular relationship might become increasingly nonlinear in larger physiologic ranges.
(
Discussion
In the present study, the neurovascular coupling relationship was noninvasively investigated in the visual cortex of the awake human. The experiment design eliminated the confounding factors such as anesthesia and inconsistent neurovascular coupling patterns within or among tasks. Our experimentalresults suggest that neuronal and hemodynamic activities are tightly coupled at graded neuronal suppression conditions. The data also show that there is a significant nonlinear component in the neurovascular coupling relationship. Nevertheless, the nonlinearity is subtle and the linear model is still a good approximation of this relationship. This observation agrees well with the findings from several other groups (Nemoto et al, 2004; Sheth et al, 2004). More importantly, we believe that the controversy in the literature is partially caused by the experimental settings and conditions that involve the confounding factors mentioned earlier (Brinker et al, 1999; Devor et al, 2003; Martin et al, 2006; Ngai et al, 1999; Sheth et al, 2004). Martin et al (2006) have shown that the neurovascular coupling relationship can change from being nonlinear to linear with different anesthesia conditions. Moreover, any inconsistency in neurovascular coupling pattern within or among tasks may lower the reliability of the calculated neurovascular coupling relationship, particularly when nonlinearity in the relationship is small. With an experimental design that is capable of ruling out these confounding factors, our data are able to partially reconcile this controversy even though the physiologic mechanisms might be different between the present and literature studies.
Different neurovascular coupling relationships might suggest different neurovascular coupling mechanisms (Devor et al, 2003; Martin et al, 2006; Sheth et al, 2004): the linear relationship (Y = aX) suggests that neuronal and vascular activities coordinate proportionally; a power law relationship (Y = aXb) indicates a nonlinear coupling relationship between neuronal and vascular activities; a threshold relationship (Y = aX + b) points out that a certain threshold of coordinated synaptic activity must be reached to trigger a hemodynamic response. The threshold relationship implies that small changes in neuronal activity may be undetectable by perfusion-based imaging techniques. Our experimental results can give a direct estimation of the threshold which is equivalent to a factor of 0.11 of the neuronal response to a single flash (Figure 5A) in the threshold model.
A very interesting observation in our result is that the coefficients A in all three models are significantly different from unity (P < 10−5, < 10−4, and < 10−5 for linear, threshold, and power-law models, respectively). Given the fact that all data are normalized to the same constant activation condition, this observation suggests that neuronal and hemodynamic activities change disproportionately. Similar disproportion also exists in other coupled physiologic parameters such as CBF and CMRO2 (Buxton and Frank, 1997; Hoge et al, 1999b). This disproportionate change in neuronal and hemodynamic activities, which was also observed in CBF data measured using laser Doppler flowmetry (Hewson-Stoate et al, 2005), can be explained by two possibilities. One possibility is that the mechanism underlying neurovascular coupling involves disproportionate process(es). Although still remaining unclear and controversial, the mechanism that mediates or modulates neurovascular coupling most probably involves multiple physiologic parameters and processes (Dirnagl et al, 1994; Lou and Edvinsson, 1986; Paulson and Newman, 1987; Skinhoj, 1966; Wahl and Kuschinsky, 1976, 1977). As a result, it is a reasonable speculation that any nonlinear step inside the cascaded chain of neurovascular coupling would induce disproportionate neuronal and hemodynamic activities. The other possibility is that the single-flash stimulus generates nonequivalent activations between neuronal and hemodynamic responses and, thus, generates a mismatch in normalized neuronal and hemodynamic activities. Nonequivalent activations between neuronal and hemodynamic responses from the same stimulation condition itself imply a nonlinear neurovascular coupling relationship. Notably, this possible mismatch in the calibration condition will not change the conclusion on the assessment of linearity of the neurovascular coupling relationship based on normalized data. Although our data cannot directly verify any of these two possibilities, they together suggest a significant nonlinearity in the neurovascular coupling relationship and further support our conclusion.
In addition to examining the correlation between CBF and VEP activities, it is also interesting to investigate the relationship between BOLD and VEP activities induced by the same stimulation paradigm as BOLD-based fMRI is most commonly used. Blood oxygenation level-dependent signal depends on interplay among the parameters of CBF, CBV and CMRO2. Increase in CBF reduces the concentration of deoxyhemoglobin in the blood and thus increases the BOLD signal, whereas increases in CMRO2 and CBV lowers it. Therefore, perturbation of one or multiple parameters would vary BOLD signal. In view of this argument, it can be predicted that BOLD signal may have larger variation in correlation with neuronal activity compared with fundamental hemodynamic signal such as CBF and CBV. This prediction can be verified in our experimental data. Figure 5B plots the normalized BOLD activity against the normalized VEP activity. The data were fit to the same three models. The correlation coefficients (R2) are considerably smaller than those between CBF and VEP signals (Figure 5A). Notably BOLD signal was simultaneously acquired with CBF signal and processed identically. In addition, subtle nonlinearity previously detected in the correlation of CBF and VEP activities is not observed between BOLD and VEP activities (linear model versus power-law model, P > 0.8; linear model versus threshold model, P > 0.8), presumably due to the larger variation of BOLD activity when correlating neuronal activity. This result is consistent with the observation in the literature (Nemoto et al, 2004) and suggests that BOLD signal has a larger fluctuation reflecting neuronal activity.
Using the measured data, the relationship between neuronal activity and CMRO2 can also be estimated. On the basis of the model of Davis et al (1998), the dependence of activation-induced CMRO2 change on CBF and BOLD signals can be described as
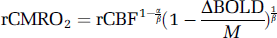
where rCMRO2 and rCBF are CMRO2 and CBF signals relative to baseline, respectively, ΔBOLD the relative BOLD changes; M is the maximum BOLD signal change for the current baseline state and needs to be calibrated using a separate hypercapnia experiment (Davis et al, 1998; Hoge et al, 1999a, b ); the constants α and β, which reflect the influences of blood volume and deoxyhemoglobin concentration, were assigned values of 0.38 (Grubb et al, 1974) and 1.5 (Boxerman et al, 1995; Davis et al, 1998; Hoge et al, 1999b), respectively.
M is calibrated as 0.22 at 1.5 T (Hoge et al, 1999b) and expected to be larger at 4 T due to a monotonic increasing dependency of BOLD on field strength (Kruger et al, 2001; Yacoub et al, 2001). Notably, ΔBOLD (∼0.01 to 0.02) is very small compared to M owing to the fact that the stimuli used are relatively weak in our experimental settings. Therefore, given the condition M≫ ΔBOLD, equation 2) can be reduced to
Using equation 3) and the CBF data, CMRO2 values at single- and paired-flash conditions can be estimated. The coupling relationship between the neuronal activity and oxygen consumption can be calculated as the correlation between normalized CMRO2 and VEP at all ISIs. As plotted in Figure 5C, it is very interesting that the relationship of CMRO2 change induced by neuronal activity follows almost the identical pattern as CBF change, which indicates a tight coupling between CMRO2 and CBF signals (Hyder et al, 1998). Statistically, there is a significant difference between the power-law model and the linear model (F(1,4) = 11.36, P = 0.028). Similarly, there is a significant difference between threshold model and the linear model (F(1,4) = 9.57; P = 0.036). These estimations further support our conclusion that there is a subtle nonlinearity in the relationship of neurovascular coupling.
One limitation in this study is that neuronal and hemodynamic changes were measured separately. There exists the possibility that difference in mental states or environment factors might cause systematic discrepancy between neuronal and hemodynamic activities and in turn induce a systematic difference in signals between the two experiments. However, as all the data are calibrated within each experimental session, any potential systematic discrepancy in absolute signal change should not significantly change normalized results. In addition, difference in environmental factors or mental states would involve random fluctuation in measured data and lower the correlation between the results from the two experiments. Nevertheless, our data show a very high correlation between the data sets from the two experiments (R2 = 0.99). This provides further evidence supporting the notion that our experimental design and quantification method are relatively insensitive to systematic variation in absolute signal. Therefore, the neurovascular coupling relationship found in our study based on normalized data should be reliable. This conclusion can be further examined by simultaneously acquiring EEG and fMRI data using the same paradigm.
Alternatively, the neurovascular coupling relationship can be examined based on the perfusion signal measured from an event-related experiment, considering that the VEP signal is obtained in an event-related manner in the present study. However, there are two advantages of using a block design in perfusion measurement in the present experimental condition. First, block design has higher sensitivity in detecting BOLD and CBF changes, which is the key characteristic in studying neurovascular coupling. Second, block design does not require very high temporal resolution, which is technically challenging in perfusion measurement using pulsed arterial spin labeling technique. Conversely, in an event-related design, insufficient temporal sampling speed using pulsed arterial spin labeling can induce an unreliable recording of hemodynamic amplitude (e.g., the peak of hemodynamic response can be missed due to an insufficient sampling rate) and in turn results in an unreliable neurovascular coupling relationship. Furthermore, since all hemodynamic changes in the present study are calibrated within each session, both block and event-related designs should provide similar information regarding hemodynamic amplitude change. Given the aforementioned advantages, we believe that a block design should provide a better solution in addressing the issue of neurovascular coupling with our experiment setting and paradigm design.
In summary, the novel stimulation paradigm used in this study makes it possible to noninvasively and reliably study the neurovascular coupling relationship in the range from graded neuronal excitation to graded neuronal suppression. It was successfully applied in this study to elucidate the quantitative neurovascular coupling relationship in the human visual cortex under the graded neuronal suppression conditions. This paradigm can be conveniently extended to other imaging modalities and other cortical regions. The results in this study should have profound implications for the interpretation of all perfusion-based functional signals associated with brain activity.
Footnotes
Acknowledgements
We thank Dr Xiao-Hong Zhu, Ms Han Yuan, and Mr Cameron Sheikholeslami for their insightful discussion and technical support.