
Abstract
The specific role of postsynaptic activity for the generation of a functional magnetic resonance imaging (fMRI) response was determined by a simultaneous measurement of generated field excitatory postsynaptic potentials (fEPSPs) and blood oxygen level-dependent (BOLD) response in the rat hippocampal CA1 region during electrical stimulation of the contralateral CA3 region. The stimulation electrode was placed either in the left CA3a/b or CA3c, causing the preferentially basal or apical dendrites of the pyramidal cells in the right CA1 to be activated. Consecutive stimulations with low-intensity stimulation trains (i.e., 16 pulses for 8 seconds) resulted in clear postsynaptic responses of CA1 pyramidal cells, but in no significant BOLD responses. In contrast, consecutive high-intensity stimulation trains resulted in stronger postsynaptic responses that came along with minor (during stimulation of the left CA3a/b) or substantial (during stimulation of the left CA3c) spiking activity of the CA1 pyramidal cells, and resulted in the generation of significant BOLD responses in the left and right hippocampus. Correlating the electrophysiologic parameters of CA1 pyramidal cell activity (fEPSP and spiking activity) with the resultant BOLD response revealed no positive correlation. Consequently, postsynaptic activity of pyramidal cells, the most abundant neurons in the CA1, is not directly linked to the measured BOLD response.
Keywords
Introduction
Although functional magnetic resonance imaging (fMRI) studies became a widely used tool to study cognitive processes in humans, the underlying neurophysiologic processes are still somewhat enigmatic. In contrast to electroencephalography or magnetoencephalography, fMRI only indirectly visualizes neurophysiologic processes by measuring hemodynamic parameters, such as variations in blood flow, blood volume, or blood oxygenation. Functional magnetic resonance imaging signals are certainly affected by changes in ongoing neuronal activity, but how neuronal activity specifically controls the measured hemodynamic parameters (i.e., neurovascular coupling) is still not entirely clear. Various factors and processes exist that control neurovascular coupling, but to what degree they actually contribute to the measured fMRI signal is often unknown. The most frequently measured hemodynamic parameter for fMRI studies is blood oxygenation. The blood oxygen level-dependent (BOLD) signal depends primarily on the ratio between oxyhemoglobin and deoxyhemoglobin,
1
which in turn is affected by neuronal activity.2, 3 For example, both the activity of principal neurons and interneurons control the BOLD response,
4
but to allocate the exact input of the two different neuron populations for the fMRI response is often uncertain. Similarly, synaptic,
5
spiking activity,
6
and the prevailing intrinsic excitability of the neurons
7
control the BOLD response, but to what extent each of these factors determines the hemodynamic response is not known. Furthermore, the hemodynamic response, the physiologic correlate of the measured fMRI response, may reflect a feedback regulation mechanism (i.e., energy metabolism-related) or a feedforward regulation mechanism (i.e., synaptic (transmitter-release) related).
2
Because of this complexity, a simple approach should be used to study the neurophysiologic basis of fMRI. The authors have previously introduced such an approach that uses monosynaptic activation of dentate gyrus neurons by electrical stimulation of the perforant pathway.
8
Within the dentate gyrus, the generated BOLD response and the spiking activity of principal cells (i.e., granular cells) were simultaneous measured. Consequently, this system focused on the role of principal cell spiking for the generation of the fMRI response in the dentate gyrus. To specifically address the role of postsynaptic activity for the generation of an fMRI response, the hippocampal CA3-CA1 system is now introduced for combined fMRI and electrophysiology measurement. Electrical stimulation of the CA3 causes monosynaptic activation of ipsilateral CA1 pyramidal cells (through Schaffer collaterals) and contralateral CA1 pyramidal cells (through commissural fibers).9, 10 Placing the recording electrode in the
Assuming the (post)synaptic activity of principal neurons is the main factor controlling the magnitude of the generated BOLD response, the relation between postsynaptic activity and resultant BOLD response should be similar, irrespective of the mode of spiking. By varying the location of the stimulation electrode in the CA3 region, the activation pathways of contralateral CA1 pyramidal cells can be modified. According to Lorente de Nó, the CA3 region can be divided into three subfields: CA3a, b, and c, 14 with the CA3a subregion distal; the CA3b in the mid part; and the CA3c proximal (close to the dentate gyrus). Stimulation of the left CA3a/b region activates predominantly basal dendrites, whereas stimulation of the left CA3c region activates predominantly apical dendrites of CA1 pyramidal cells.15, 16 As a result, only stimulation of the left CA3c region triggers clear spiking of pyramidal cells, whereas stimulation of the left CA3a/b region only does not (Figure 1). Using these two stimulation conditions, the specific relation between postsynaptic activity and the resultant BOLD response is measured, as well as how additional spiking affects this relation.
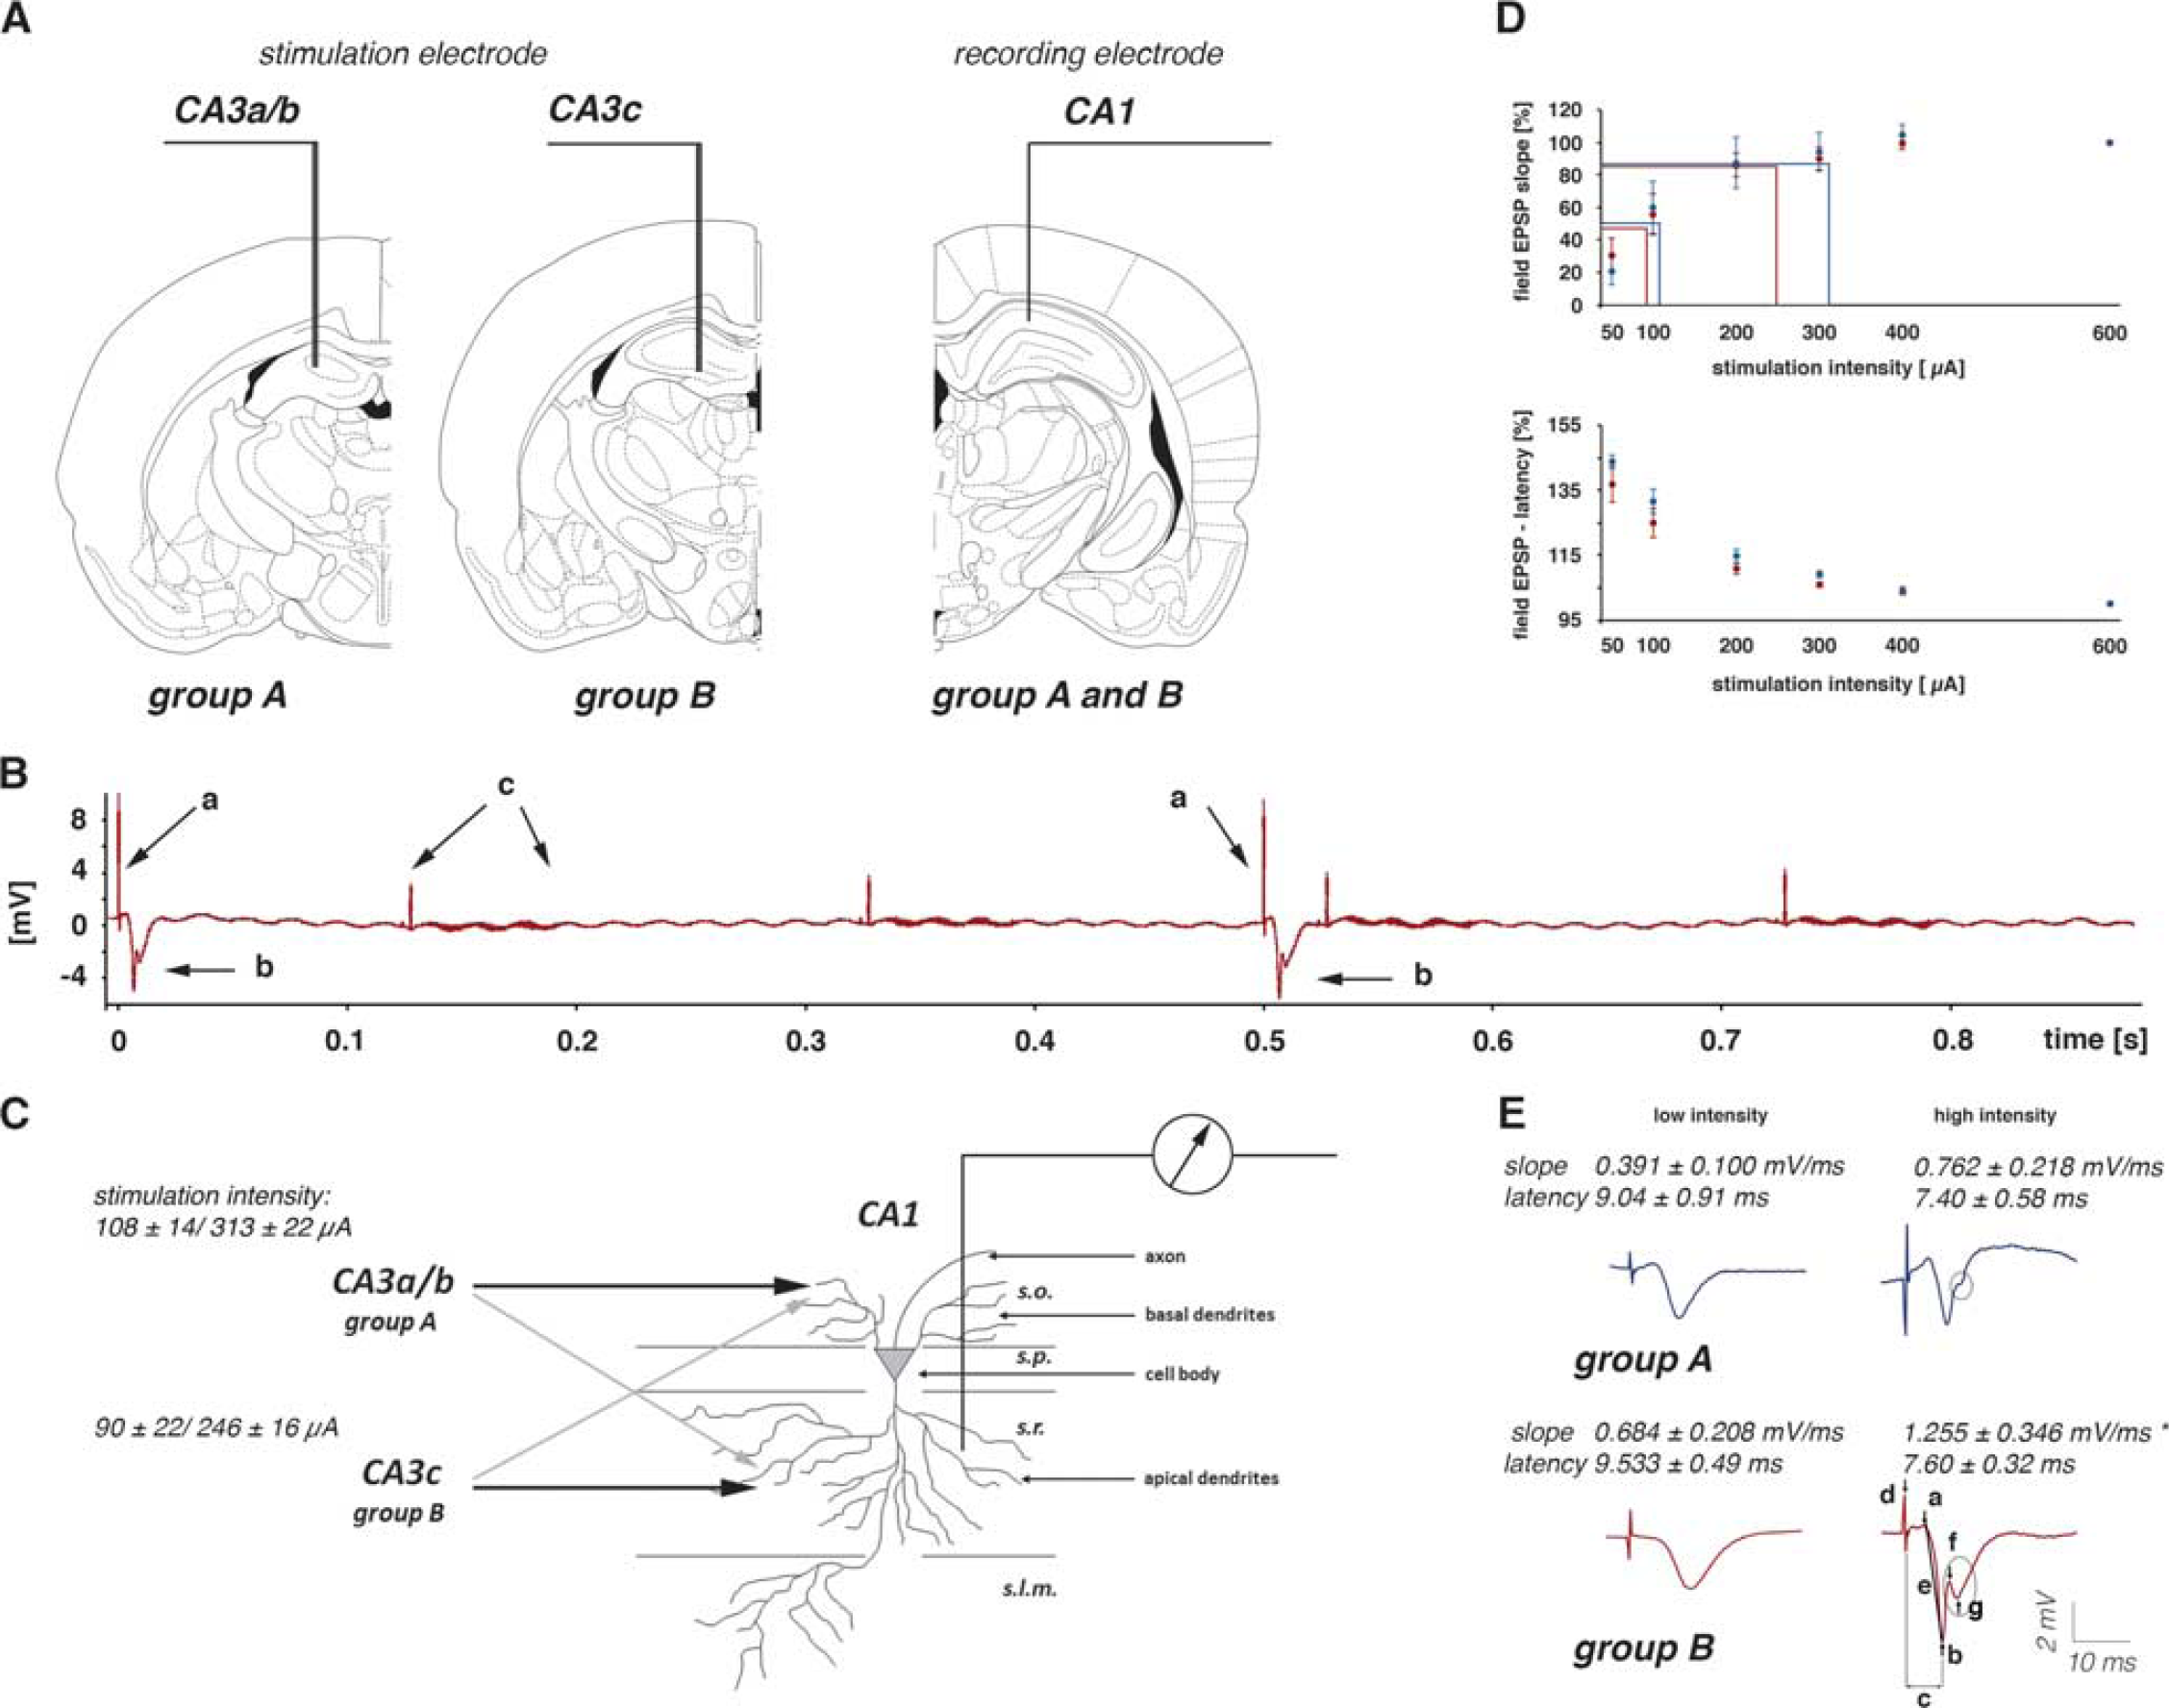
Experimental approach to measure postsynaptic activity during a functional magnetic resonance imaging (fMRI) session. (
Materials and methods
Animals and Surgical Procedure
Animals were cared for and used according to a protocol approved by the animal experiment committee, and in conformity with the European convention for the protection of vertebrate animals used for experimental purposes and institutional guidelines 86/609/CEE, 24 November 1986. The experiments were approved by the animal care committee of the State Saxony-Anhalt, Germany (No. 203h.-42502-2-852-IfN).
For electrode implantation, 9-week-old male Wistar rats (
Magnetic Resonance Imaging Measurements and CA3 Stimulation
Rats were initially anesthetized with 1.0% to 1.5% isoflurane (in 50:50 N2:O2; v:v), and connected to the stimulation and recording electrodes. After placing the animal on the stereotactic platform, narcosis was switched to deep sedation by applying medetomidine (Domitor, Pfizer GmbH, Karlsruhe, Germany), bolus of 50 μg/kg subcutaneously, and after 15 minutes 100 μg/kg per hour subcutaneously. 18 The animals were fixed using a head holder with a bite bar to reduce motion artifacts. Heating was provided from the ventral side (body temperature was measured in some animals before and after the fMRI session and the temperature remained stable between 37.5°C and 38.5°C), breathing rate (between 40 and 60 per minute), heart rate (between 220 and 300 heart beats per minute), and oxygen saturation (between 97% and 99%) were monitored during the whole experiment using an MRI-compatible pulse oxymeter (Mouse Ox, Starr Life Sciences, Pittsburgh, PA, USA). Electrophysiologic responses were evoked by a stimulus generator (Isolated Pulse Stimulator, Model 2100, Science Products, Hofheim, Germany) and recorded with a 5,000-Hz sampling rate and pass filtered from 1 to 5 kHz by using a quad channel differential extracellular amplifier (Ex4-400, Science Products). The signals were transformed by an analog-to-digital interface (power-CED, Cambridge Electronic Design, Cambridge, UK) and stored on a personal computer. Because the switching gradients required for the acquisition of fMR images only generated minor artifacts (Figure 1) no preprocessing of the recorded electrophysiologic data was necessary. For each generated fEPSP, the slope (measured at the steepest rise of the first negative deflection in mV/ms) and the latency were determined (Figures 1C and 1D). To calculate the appropriate stimulation intensities for the fMRI experiment, biphasic constant current pulses (pulse duration 0.2 ms) were applied to the hippocampal CA3 (30 minutes after switching to deep sedation by applying medetomidine) with increasing intensities (i.e., three test pulses at 10-second intervals for the following intensities: 50, 100, 200, 300, 400, and 600 μA) and the evoked CA1 field potentials were recorded. The recordings were taken at 2-minute intervals for lower intensities than 400 μA and 4-minute intervals for all subsequent higher intensities. According to this input/output curve, the intensity required to evoke an fEPSP and the maximal measured slope function could be determined. The correlation between stimulus intensity and measured slope allows for the definition of the two stimulation intensities for the experimental design: a low-stimulation intensity (approximately 50% of the maximal measured slope) without the spiking component in the shape of the fEPSP, and a high-stimulation intensity (approximately 80% of the maximal measured slope) with the spiking component inside the shape of the fEPSP (Figure 1D). Electrical stimulation of the hippocampal CA3, both single test stimuli and burst stimuli, caused no eye or head movements that could perturb the fMRI measurement. Magnetic resonance imaging experiments were performed on a Bruker Biospec 47/20 scanner (Bruker BioSpin GmbH, Ettlingen, Germany) at 4.7T (free bore of 20 cm), equipped with a BGA09 (400 mT/m) gradient system (Bruker BioSpin GmbH, Ettlingen, Germany). A 50-mm Litzcage small animal imaging system (Doty Scientific, Columbia, SC, USA) was used for radio frequency excitation and signal reception. For anatomic images, eight horizontal T2-weighted spin-echo images were obtained using a rapid acquisition relaxation enhanced sequence, 19 configured using the following parameters: repetition time 4,000 ms, echo time 15 ms, slice thickness 0.8 mm, field of view 37 × 37 mm, matrix 256 × 256, rapid acquisition relaxation enhanced factor 8, averages 4. The total scanning time was 8 minutes 32 seconds. Functional MRI was performed using an EPI (echo planar imaging) sequence with the following parameters: repetition time 2,000 ms, echo time 24 ms, slice thickness 0.8 mm, field of view 37 × 37 mm, matrix 92 × 92, and total scanning time per frame 2 seconds (Figure 2A).
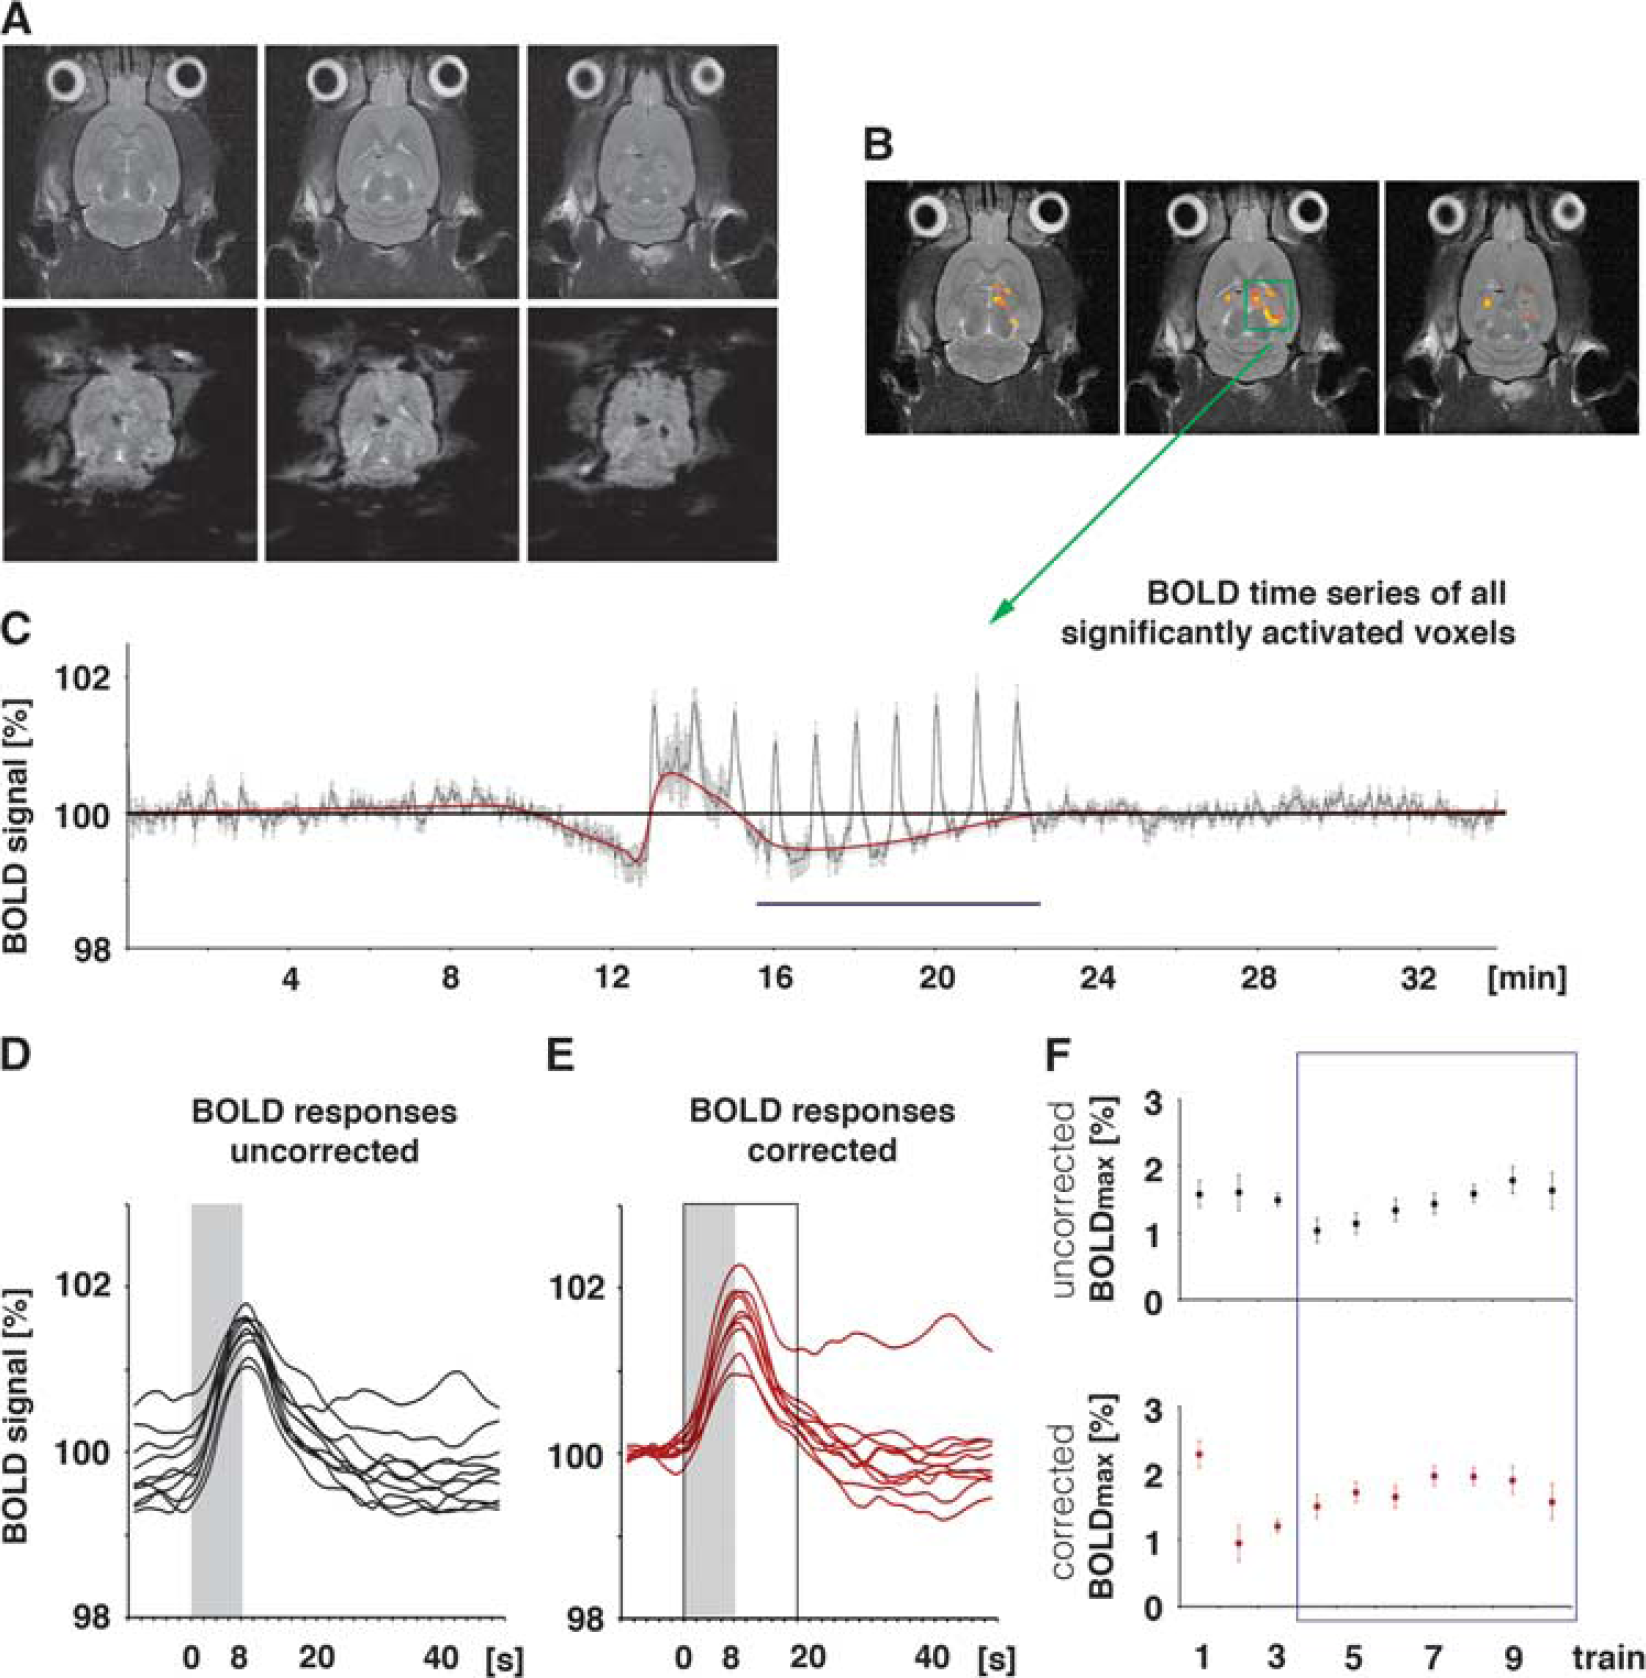
Calculation of the blood oxygen level-dependent (BOLD) response. (
For the combination of the fMRI and electrophysiologic experiments, the stimulation protocol was divided into three stimulation blocks. Each stimulation block contained 10 stimulation trains with identical stimulus intensities. During the first and third stimulation block, low-intensity pulses were applied. During the second stimulation block, high-intensity pulses were applied. One stimulation train was given every minute (duration of 8 seconds followed by an intertrain interval of 52 seconds) and consisted of 16 pulses with an interpulse interval of 500 ms (i.e., 2 Hz). Trigger pulses that were generated by the scanner at the beginning of every volume, i.e., every 2 seconds, were used to synchronized fMR-image acquisition and electrophysiologic stimulations. The total time for the combined fMRI electrophysiology session was 34 minutes (1,020 frames in fMRI).
Data Processing and Analysis
The functional data were loaded and converted into the BrainVoyager data format. A standard sequence of preprocessing steps implemented in the
Statistical Analysis
All data were reported as group averages±SEM. For statistical comparison of values among individual experiments, the nonparametric Wilcoxon-signed rank test from the statistical program
Results
As initially determined, electrical stimulation of the two different regions in the left CA3 region generated fEPSPs in the right CA1 region that differed in the size of the population spike component. Stimulating the left CA3a/b region triggered fEPSPs in the right CA1 region with exiguous population spike components, whereas stimulation of the left CA3c region triggered fEPSPs in the right CA1 region with strong population spike components (Figure 1E). The two stimulation conditions caused substantial postsynaptic activations in the same right CA1 region. The fEPSPs show this postsynaptic activation was accompanied by minor spiking, yet substantial spiking of pyramidal cells. To address the question of whether postsynaptic activity alone or only the combined postsynaptic and spiking activity controls the magnitude of a BOLD response, the authors compared the generated BOLD response in the right CA1 region during stimulation of the left CA3a/b (Figure 3) or left CA3c (Figure 4) region with low- and high-intensity pulses.
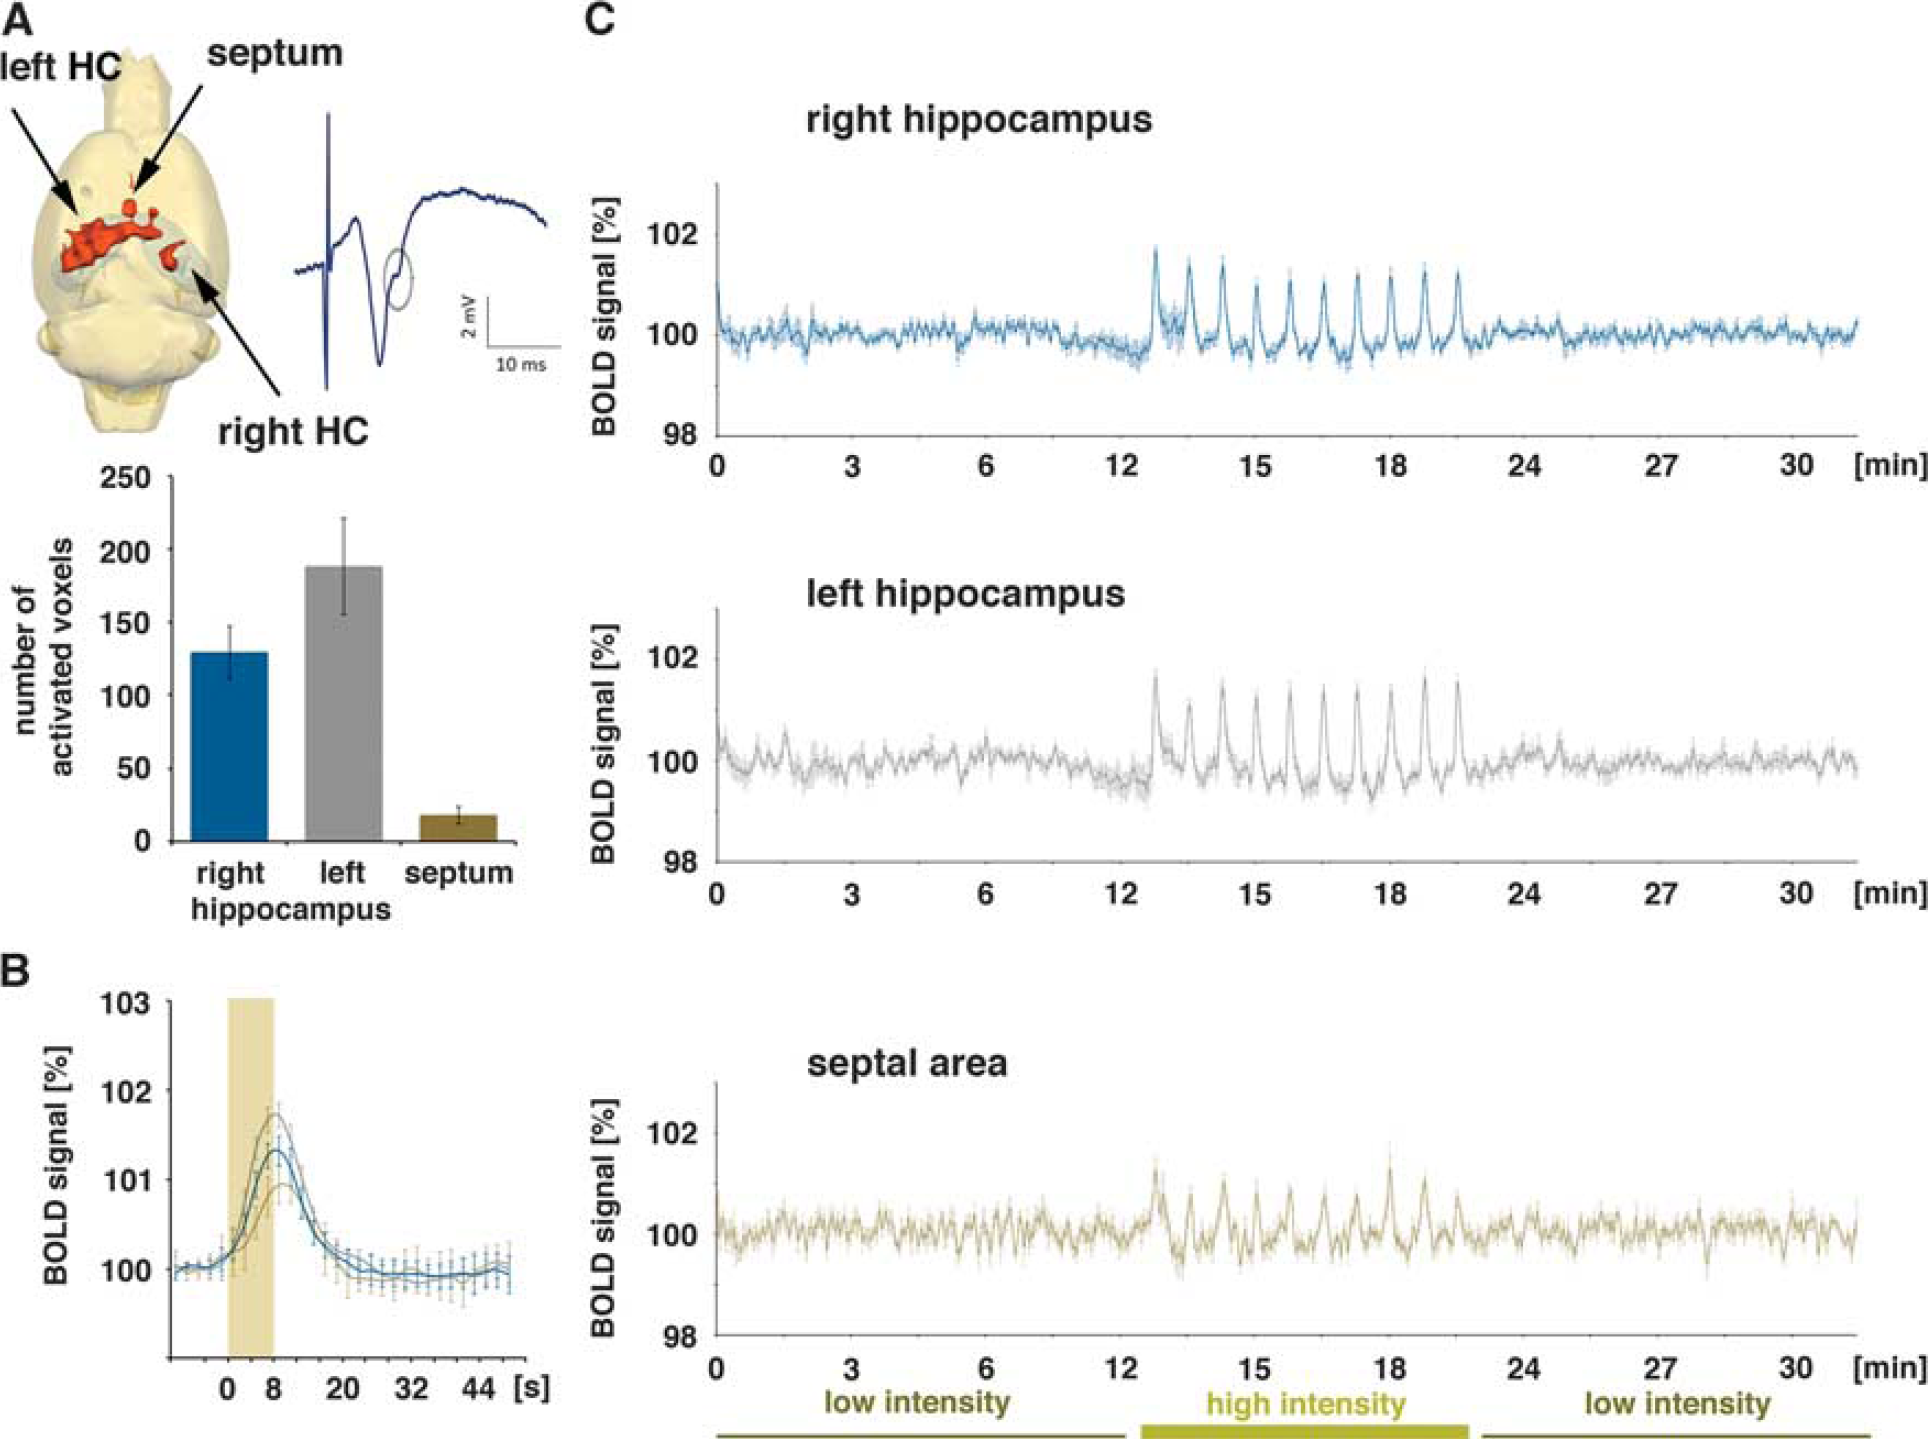
Blood oxygen level-dependent (BOLD) activation pattern generated during repetitive electrical stimulation of the left CA3a/b region (group A,
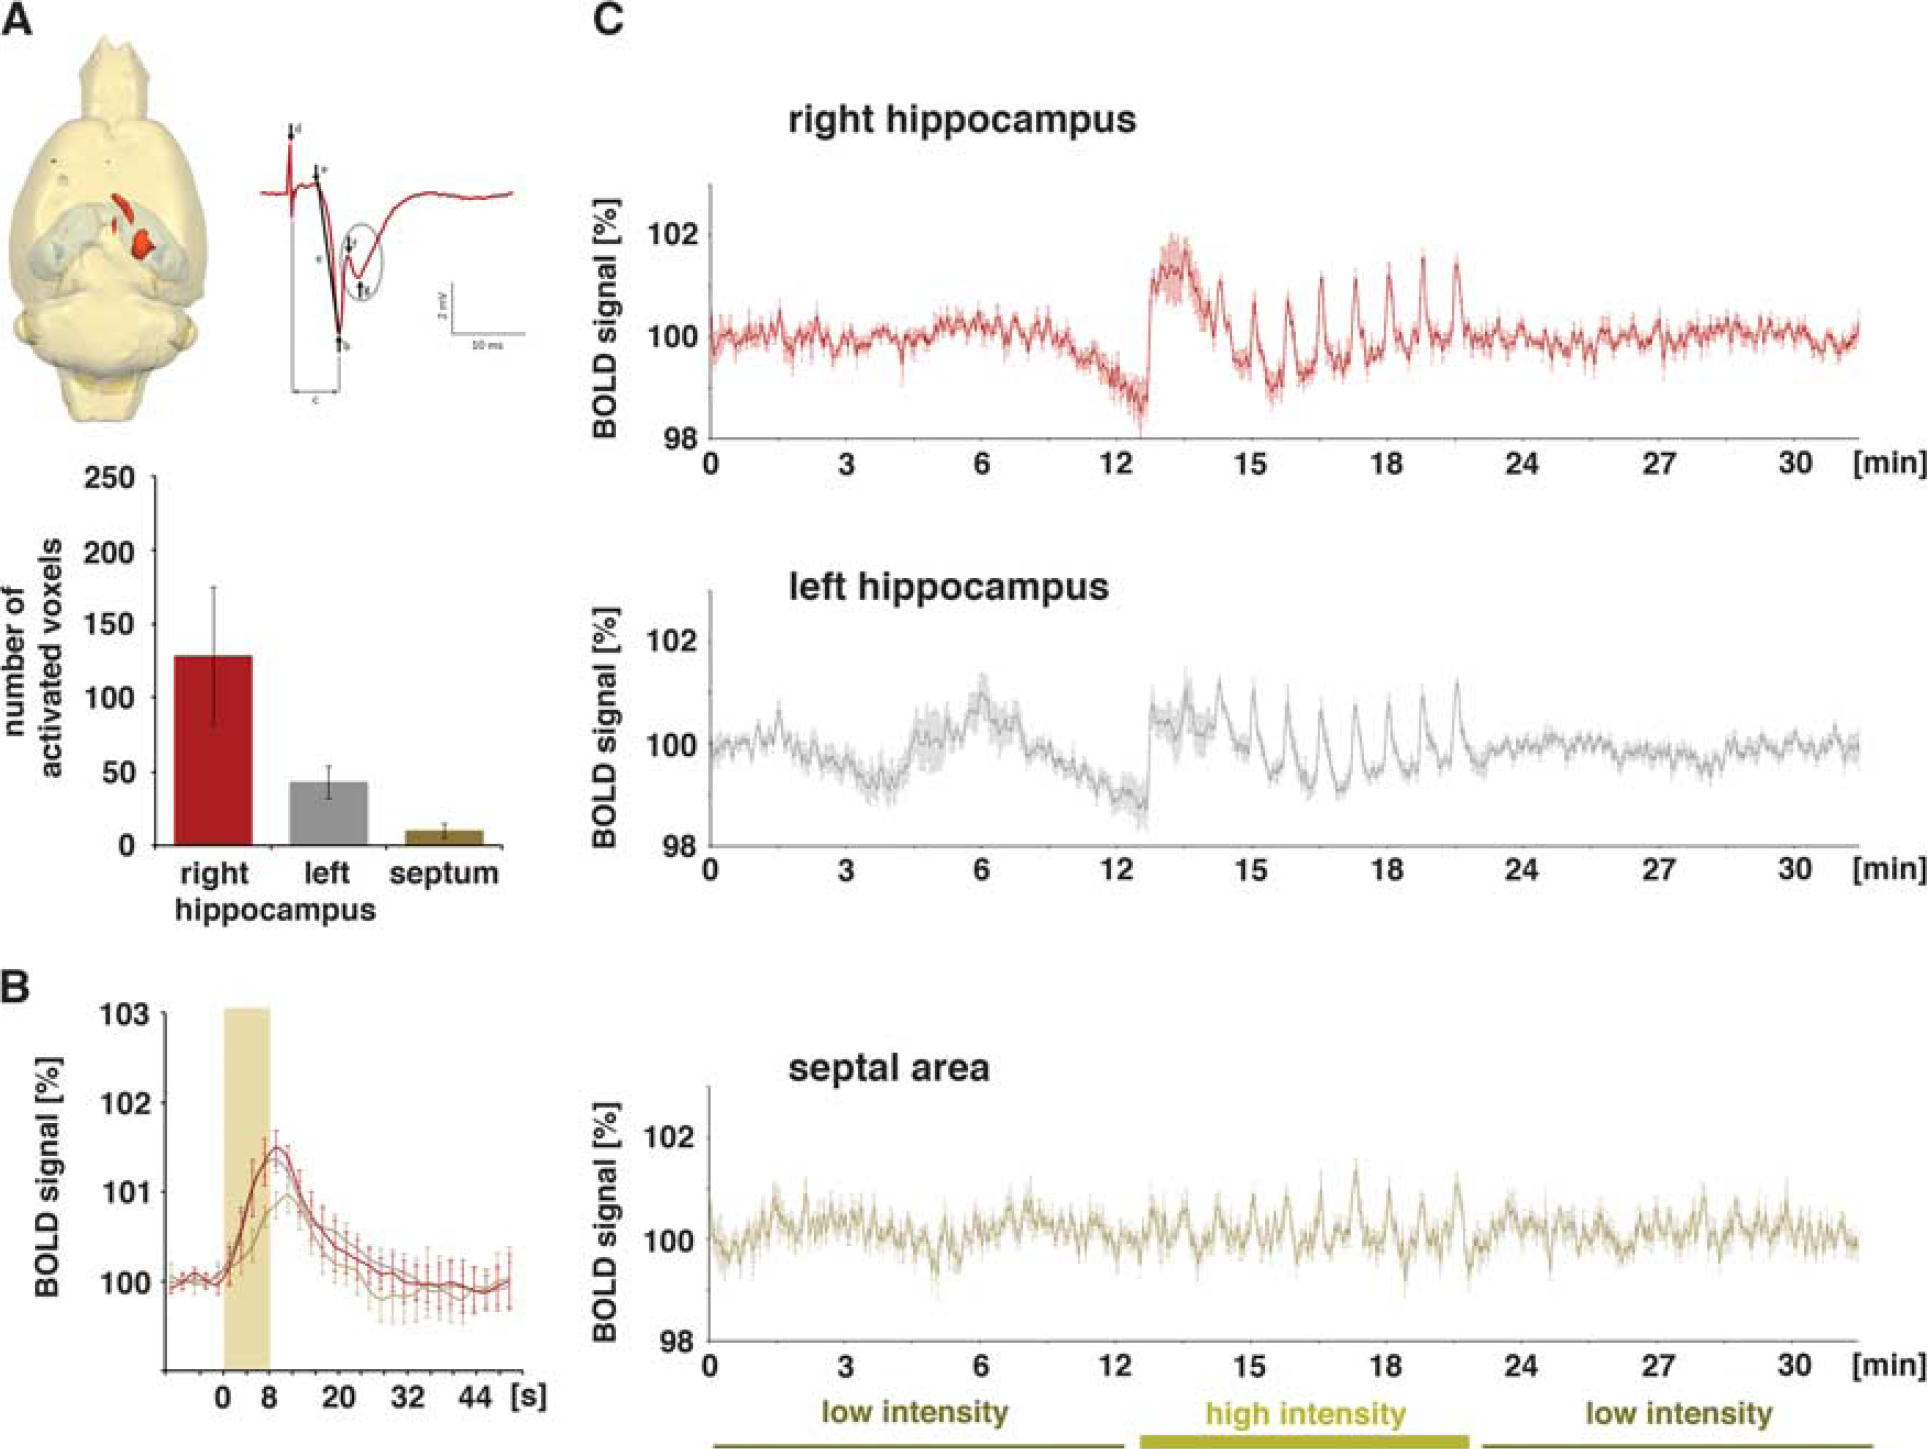
Blood oxygen level-dependent (BOLD) activation pattern generated during repetitive electrical stimulation of the left CA3c region (group B,
Correlation of the Blood Oxygen Level-Dependent Response and Pyramidal Cell Activity in the Right CA1 Region during Electrical Stimulation of the Left CA3a/b Region
Similar to previous studies, repetitive identical stimulation trains generated different BOLD responses, concurrently with different pyramidal cell activations. In general, low-intensity stimulations of the left CA3 region caused similar electrophysiologic responses in the right CA1 region to all consecutive pulses in one individual train. These substantial postsynaptic activations were not accompanied by any significant changes in BOLD signal intensities—neither in the stimulated left hippocampus nor in the concurrently activated right hippocampus.
Increasing the stimulation intensity caused significantly stronger postsynaptic activations and the appearance of minor deflections in the fEPSPs, indicating minor spiking of CA1 pyramidal cells (Figures 1 and 3). Within each individual train, the 16 consecutive pulses generated slightly decreasing fEPSPs, i.e., the slope of the last fEPSP was significantly smaller than the slope of the first fEPSP (Figure 5), whereas the latency remained similar. In addition, the average synaptic responses varied during consecutive stimulation trains, i.e., the average slope of the fEPSPs increased significantly after the first stimulus train and then remained almost stable during the following nine trains. In contrast to the slope, the latencies of the average fEPSPs remained similar during all consecutive trains (Figure 6). Consequently, consecutive applied pulses within each individual stimulus train, as well as repetitive stimulation trains, caused changes in the signal processing within the right CA1 region.
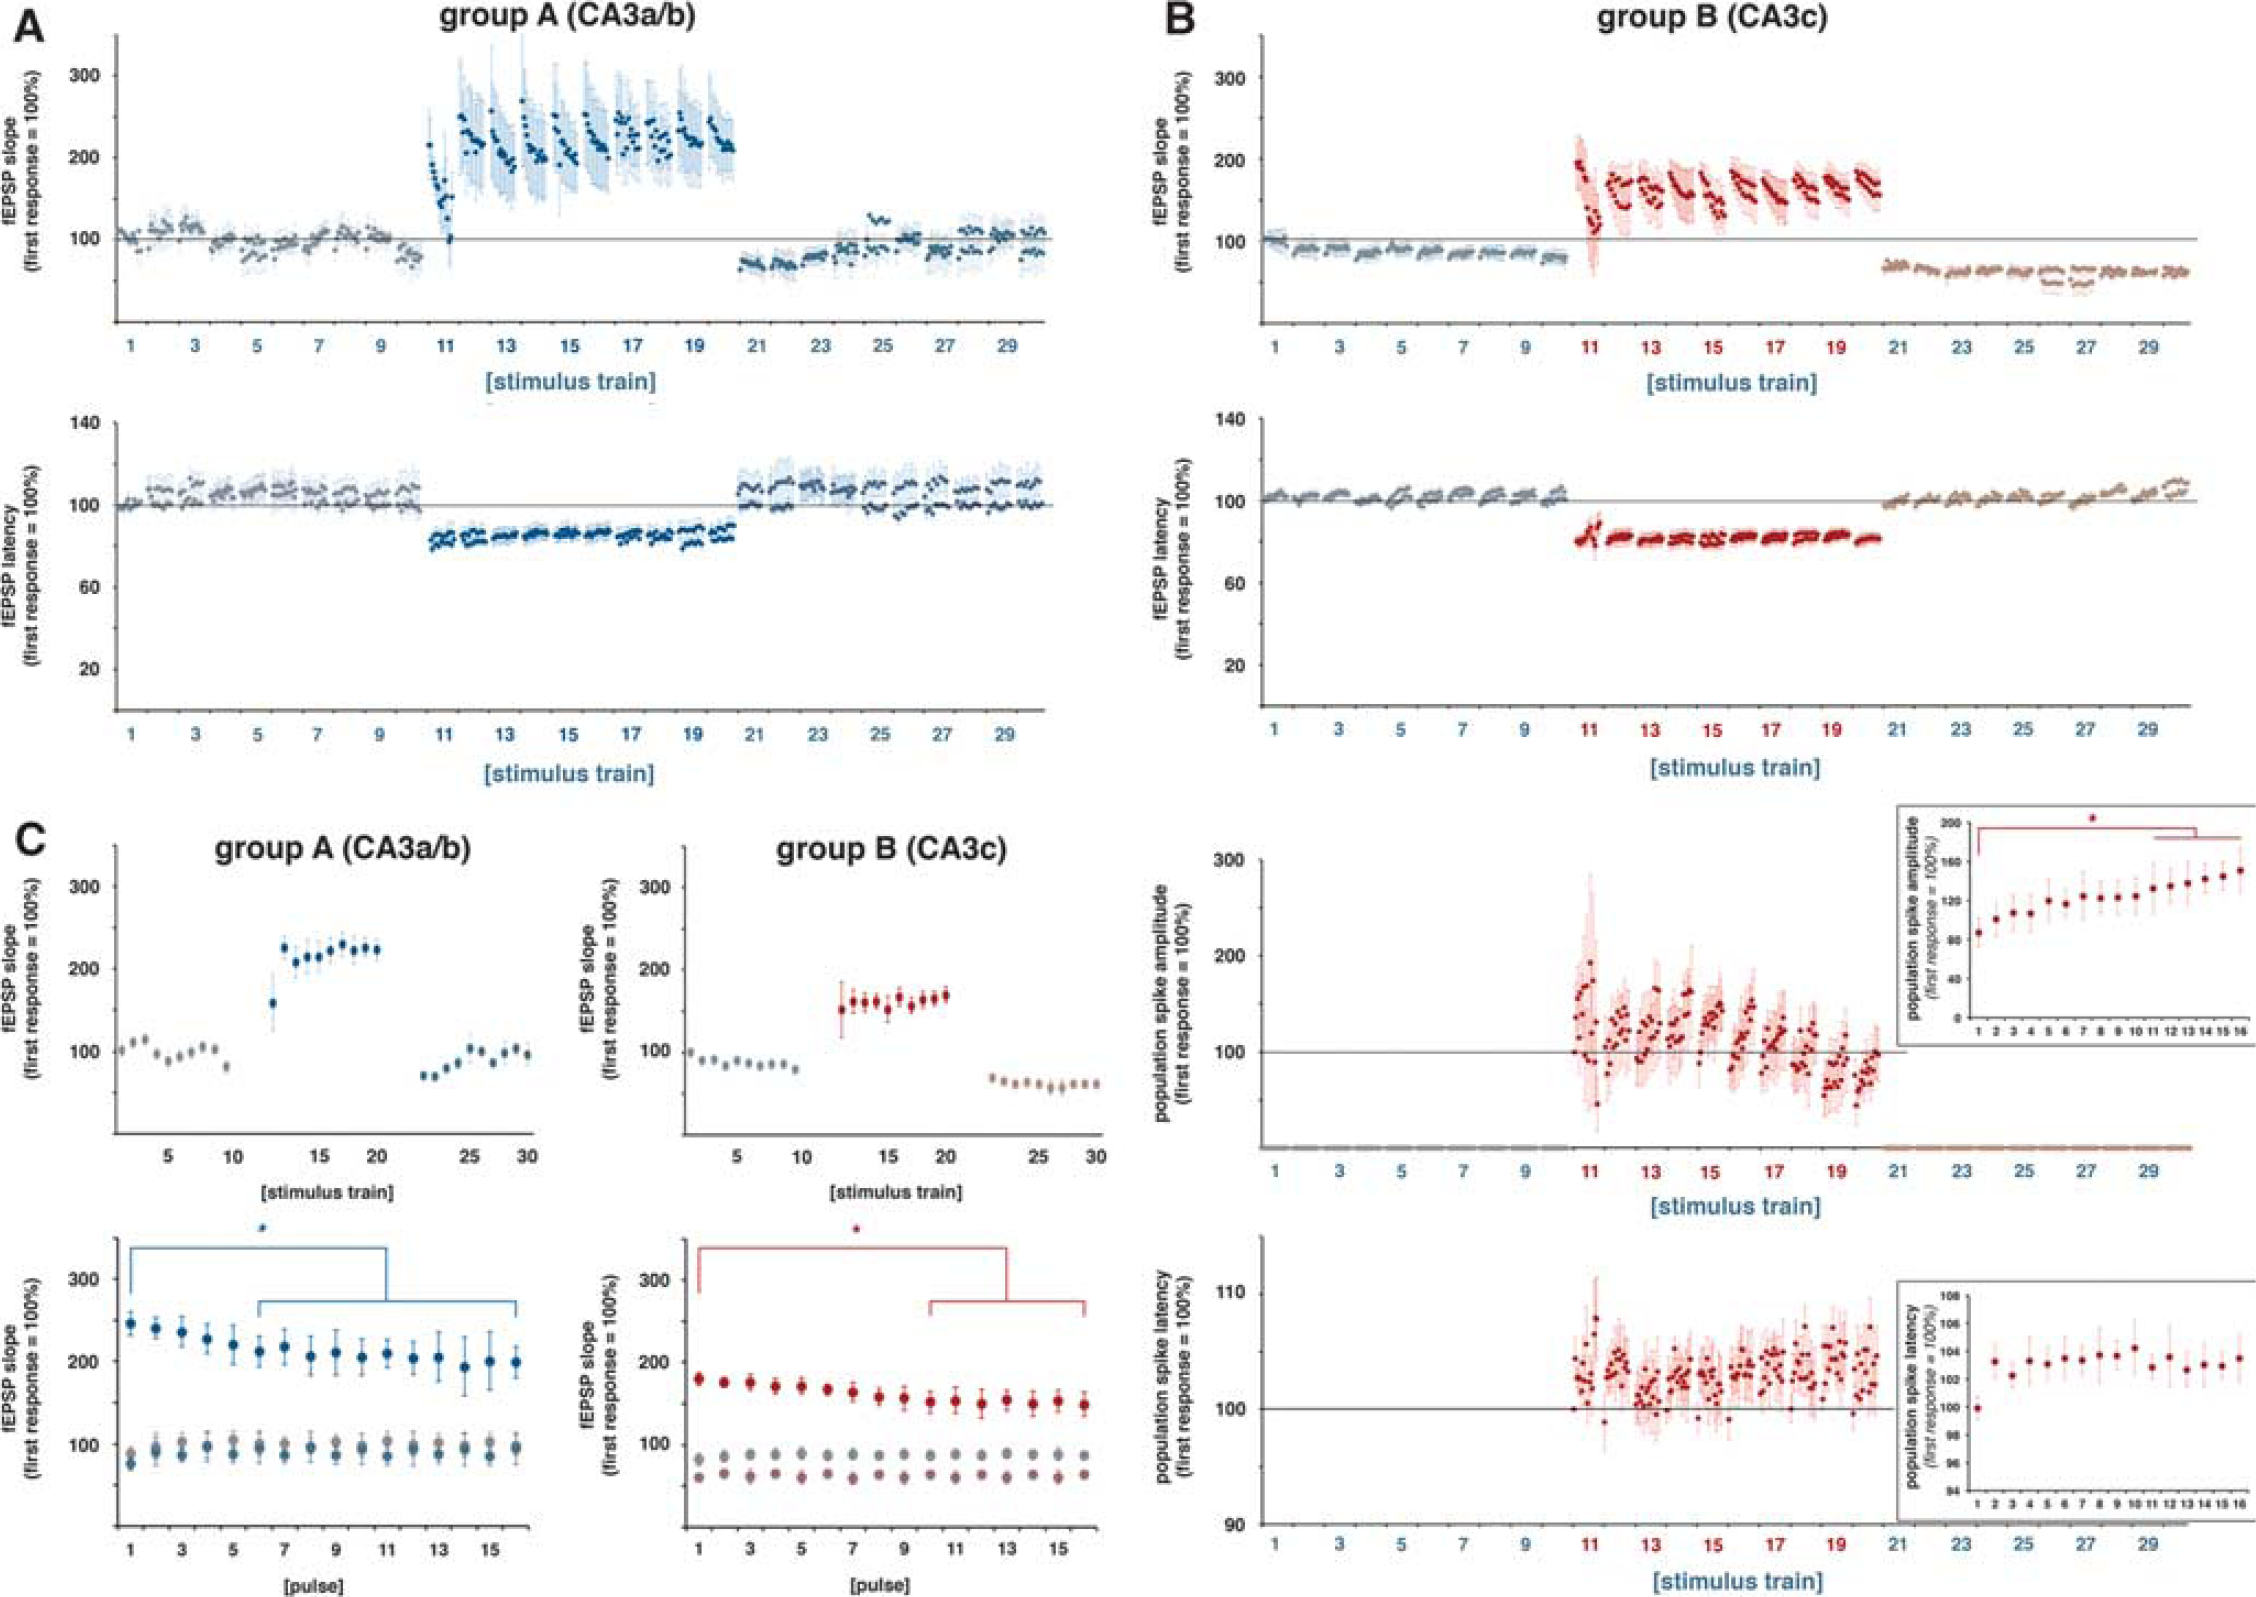
Consecutively applied pulses within one stimulation train and between consecutive stimulation trains caused variations in the electrophysiologic responses of the right CA1 pyramidal cells. (
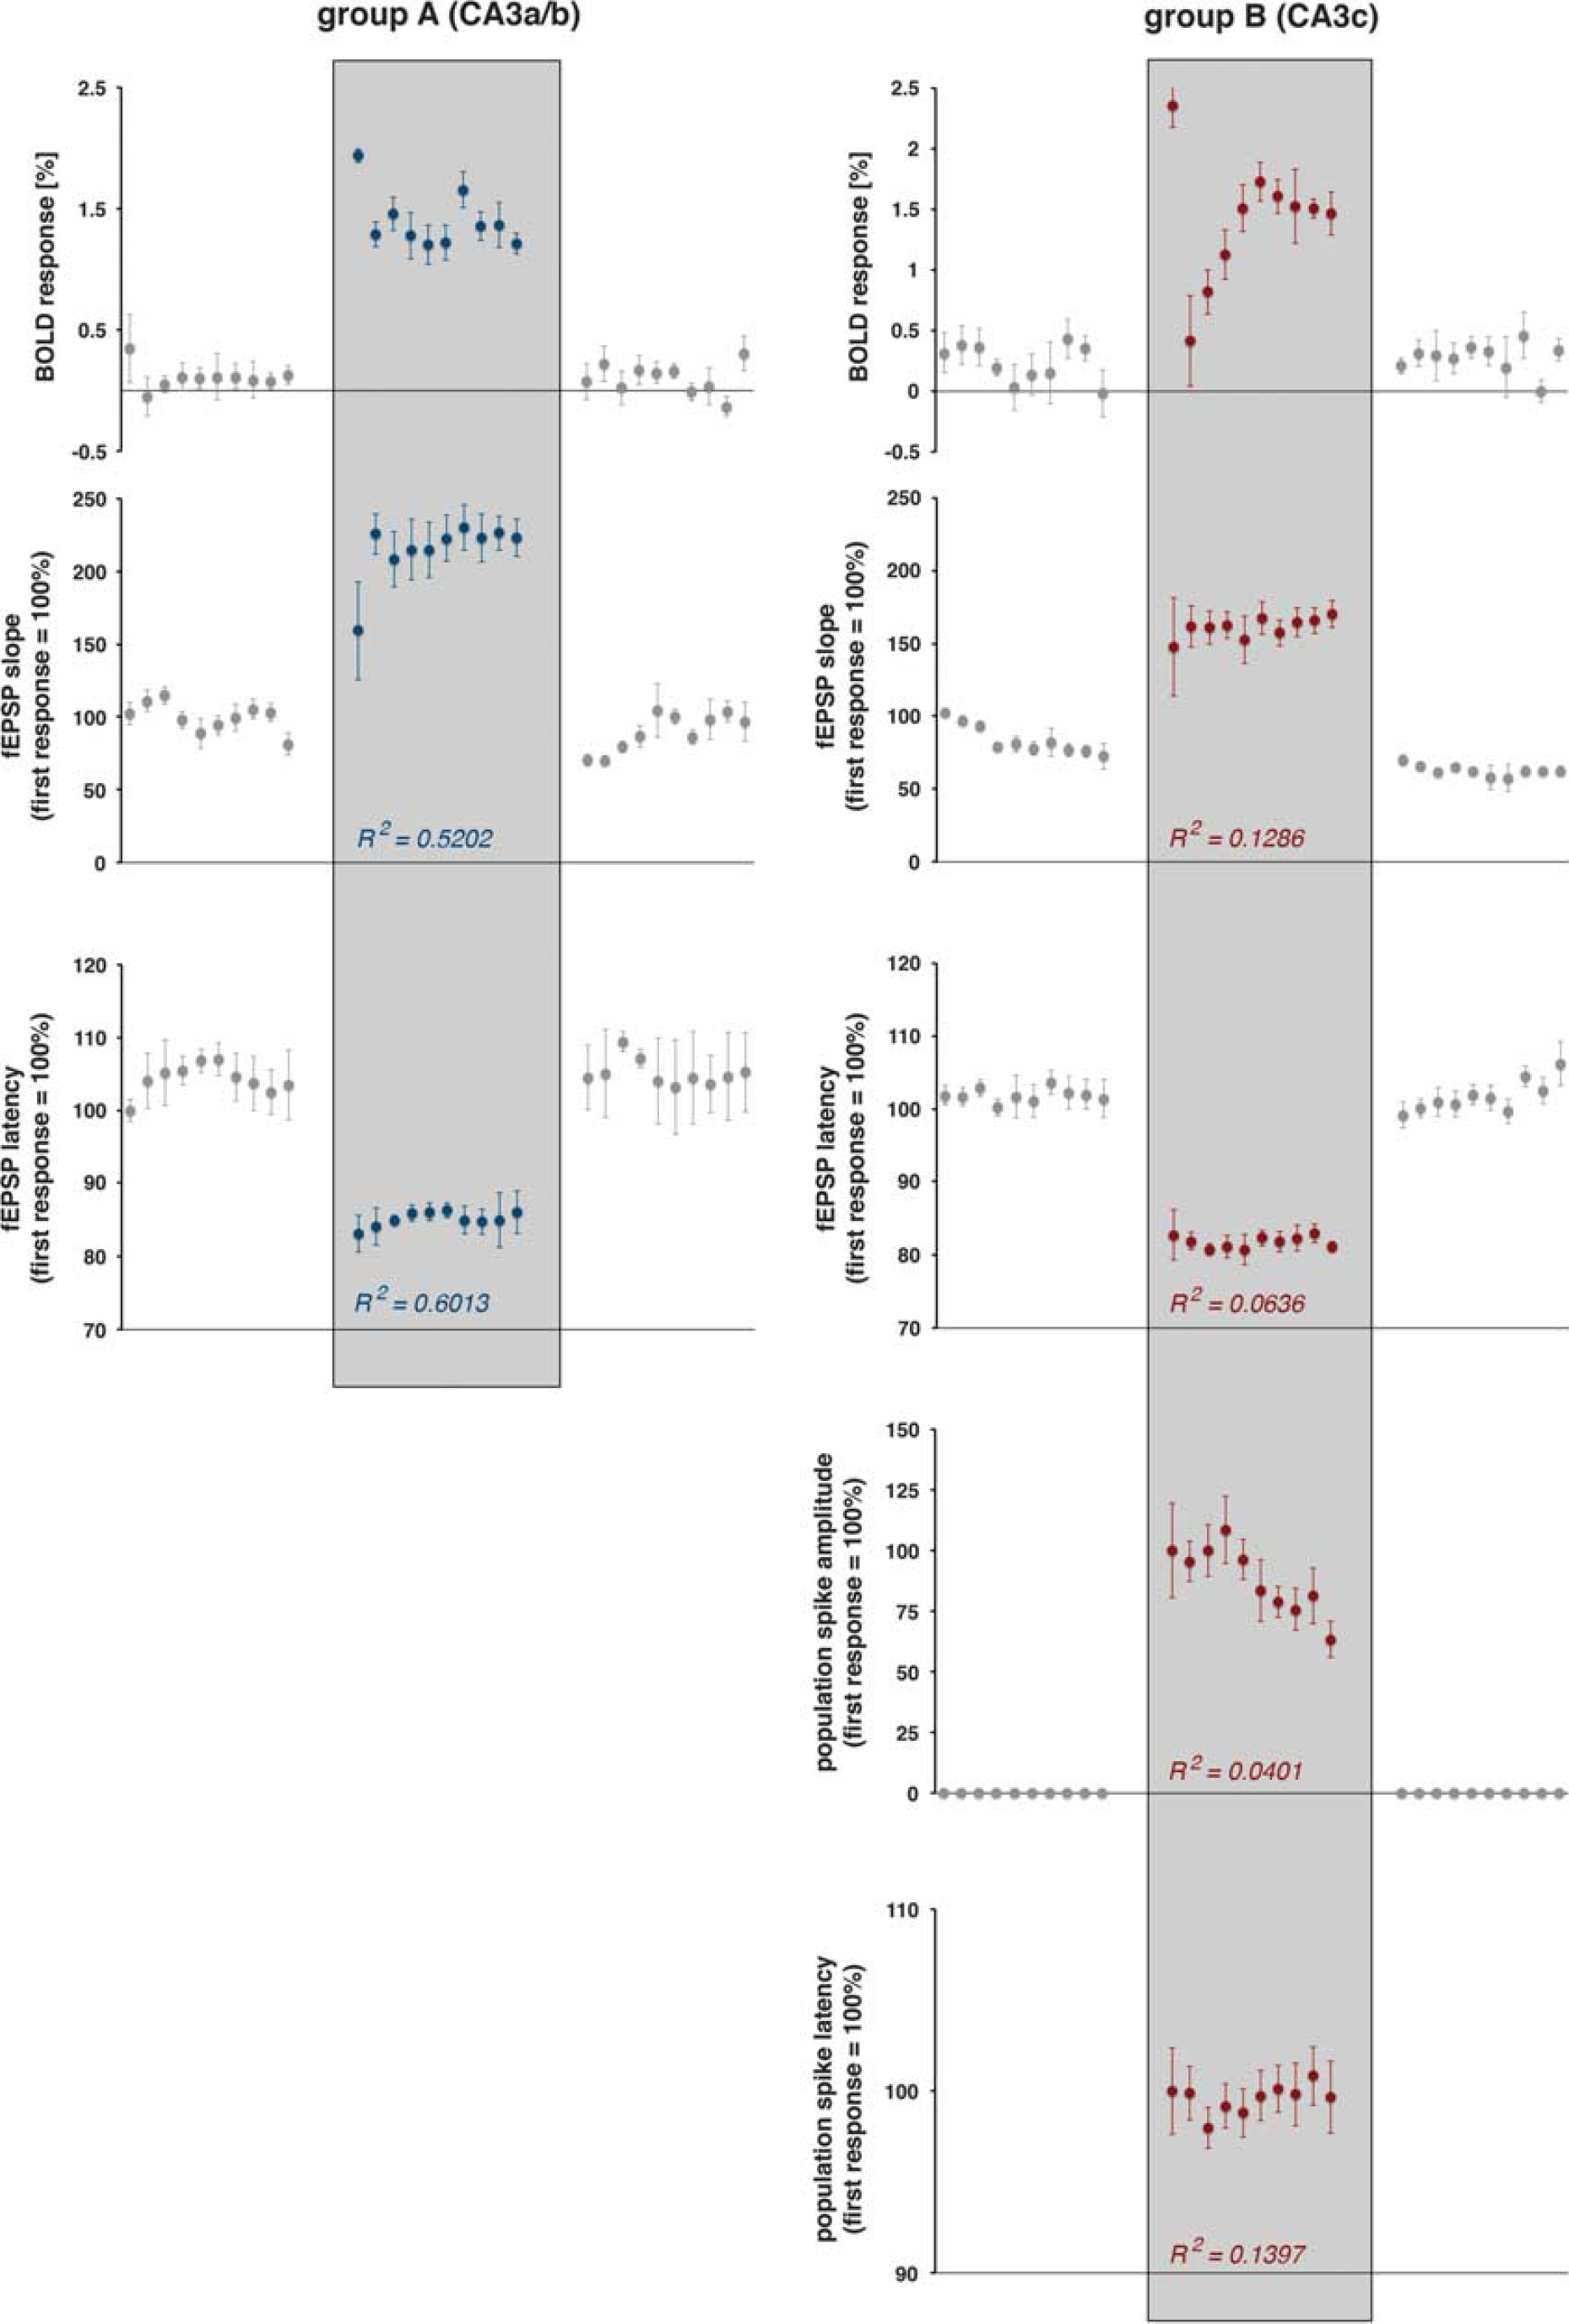
Development of blood oxygen level-dependent (BOLD) responses and simultaneously measured electrophysiologic responses during consecutive stimulation trains. The magnitude of the BOLD response and the concurrently measured average values of electrophysiologically measured parameters of neuronal activity are shown The Pearson correlation coefficient (
The high-intensity stimulation protocol induced significant BOLD responses in the stimulated left hippocampus, in the concurrently activated right hippocampus, and in the septal region. Within the hippocampal formation, the stimulation caused a widely distributed BOLD response in the left, stimulated hippocampus and a more focused BOLD response in the right hippocampus (Figure 3A). This wide distribution of significant BOLD responses in the left hippocampus confirms the presence of a large number of associational fibers projecting to the whole transverse extent of the CA3b, and to all CA3 pyramidal cells in the septal direction (CA3a) within the CA3 associational pathway. 15 The HRF to individual stimulation trains was similar in the left and right hippocampus, but different in the septum. A smaller magnitude and a slower raising slope characterized the HRF in the septum, so that the maximal BOLD signal intensity was delayed by 1.4 seconds when compared with the hippocampus (Figure 3B, Table 1).
Summary of the measured maximal BOLD responses during consecutive high-intensity stimulation trains (corrected BOLD values)
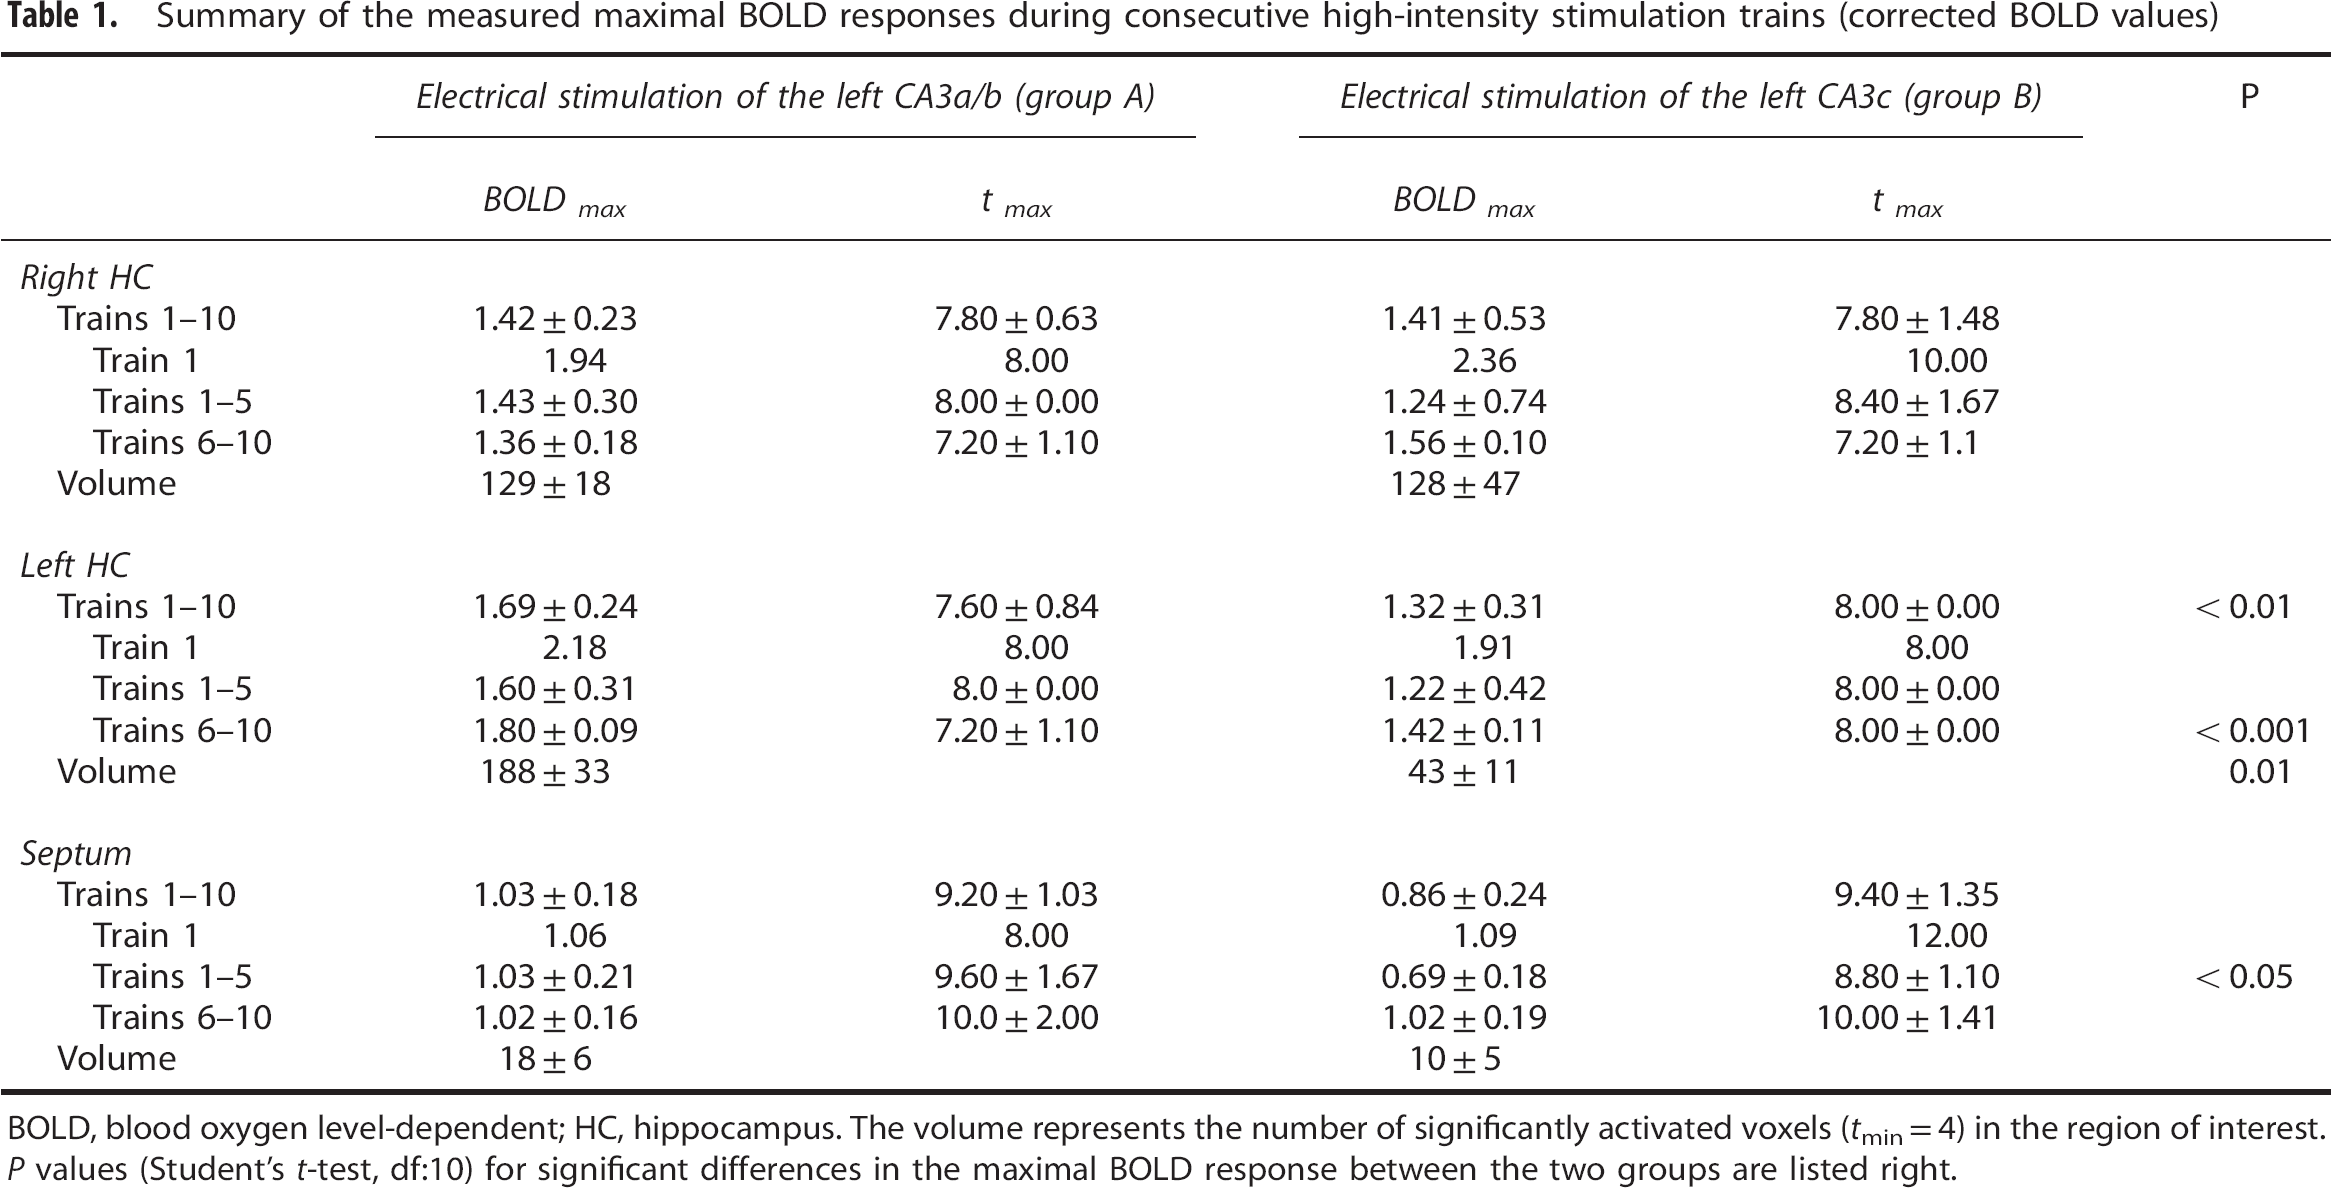
BOLD, blood oxygen level-dependent; HC, hippocampus.
The volume represents the number of significantly activated voxels (
The BOLD responses in the right hippocampus to individual stimulation trains varied; the first stimulation train triggered the strongest BOLD response, and all subsequent stimulation trains generated smaller BOLD responses (Figures 3C and 6). The variations of the BOLD responses moderately correlated with variations in the average slopes of the fEPSP (
Correlation of the Blood Oxygen Level-Dependent Response and Pyramidal Cell Activity in the Right CA1 Region during Electrical Stimulation of the Left CA3c Region
Electrical stimulation of the left CA3c with low-intensity pulses also caused substantial postsynaptic activations in the right CA1 region. Similar to repetitive stimulations of the left CA3a/b region, the fEPSPs did not change during consecutive pulses within each stimulus train and during consecutive trains. Again, these postsynaptic activations did not cause significant changes in BOLD signal intensities. Increasing the stimulation intensity triggered significantly stronger postsynaptic activations in the right CA1 region that coincided with substantial spiking of the CA1 pyramidal cells as detected by the clear population spike component (Figures 1 and 4A). Within all stimulation trains the slopes of fEPSPs declined, whereas the corresponding latencies increased (Figure 5). In contrast to the postsynaptic responses, spiking—as measured as amplitude of the population spike component—gradually increased in each stimulus train; thus, a facilitation of the spiking activity occurred during each train. The corresponding population spike latencies increased only after the first pulse and then remained on this elevated level (Figure 5). During consecutive stimulation trains, the average postsynaptic activations remained similar, i.e., no significant changes in the average slope and latency of the fEPSP were observed. In contrast, the average population spike amplitude decreased and the average population spike latency decreased after the first train and recovered to almost the initial level during all subsequent trains (Figure 6).
The high-intensity stimulation of the left CA3c region also triggered significant BOLD responses in the left and right hippocampus, as well as in the septal region (Figure 4A). However, in contrast to electrical stimulation of the left CA3a/b region, stimulation of the left CA3c region only resulted in a sparse distribution of significant BOLD responses in the left hippocampus, whereas the spatial distribution in the right hippocampus and septal area was similar. This sparse distribution of significant BOLD responses in the left hippocampus confirms the known limited local projection of the CA3c neurons within the CA3 associational pathway. 15
The BOLD responses in the right CA1 region during consecutive high-intensity stimulation trains varied (Figures 4C and 5). Correlation of the generated BOLD response with concurrent measured parameters of postsynaptic activity (fEPSP slope:
Discussion
The current study aimed to determine the specific role of postsynaptic activity of principal neurons for the resultant BOLD response in the rat CA1 region. By using two related stimulation protocols, i.e., stimulating either the left CA3a/b or CA3c region, the postsynaptic activity was, on the one hand, associated with strong spiking, and on the other hand, only associated with minor spiking of the principal cells.
The main results of the present study are as follows: (1) substantial postsynaptic activity of principal cells without spiking do not necessarily generate significant BOLD responses; (2) repetitive identical electrical stimulations of the left CA3 cause variations in postsynaptic responses of pyramidal cells in the right CA1 region, which were also accompanied with variations in the resultant BOLD responses; (3) parameters of postsynaptic activity of pyramidal cells, such as slope and latency of the fEPSP, did not positively correlate with the concurrent generated BOLD response; and (4) additional strong spiking of CA1 pyramidal cells causes a greater variability in the triggered BOLD response, but spiking activity of the pyramidal cells did not correlate with the magnitude of the BOLD response.
Synaptic activity, meanwhile, is generally assumed to be the main factor controlling the magnitude of a BOLD response. In a seminal study, Logothetis
In the hippocampal CA1 region, pyramidal neurons are by far the most numerous neurons. 23 Interneurons account for only 7% 24 to 11% 25 of all neurons. Thus, the synchronized activity of the principal neurons should have a significant effect on the generated BOLD responses, at least as soon as their summed neuronal activity determines the magnitude of the BOLD response. Evidently, this was not the case. The development of the summed postsynaptic responses and, if present, the spiking of the CA1 pyramidal neurons to repetitive stimulation trains did not match the development of concurrently generated BOLD responses. Consequently, a simple metabolic-mediated feedback control of vascular systems resulting from an increased energy demand of the activated pyramidal neurons appears, at least in the CA1 region, very unlikely. This implies that under the used experimental circumstances, the activity of the principal cells may still contribute to the fMRI response, but this activity is not pivotal for the measured size of the BOLD response. Therefore, other factors control the magnitude of the BOLD response. These may include (1) the activity of (inhibitory) interneurons that are also activated during stimulation and (2) stimulus-induced mechanisms upstream of the pyramidal neuron within the CA1 region.
Commissural collaterals projecting to the CA1 region target both pyramidal neurons and (inhibitory) interneurons. Furthermore, once activated, pyramidal neurons target GABAergic basket cells, bistratified cells, and OL-M cells, which in turn mediate a feedback inhibition on the pyramidal neurons. 26 A stimulus-dependent increase in the activity of these GABAergic interneurons should have a detectable inhibitory effect on principal neurons, the pyramidal neurons. During the high-intensity pulse stimulation protocol (i.e., trains 11 to 20), the synaptic responses to the 16 consecutive pulses significantly decreased (Figure 5). However, whether the decline in postsynaptic responses of the pyramidal cells relates to variations in the presynaptic transmitter release or to an increased activity of inhibitory synapses cannot be addressed by the used experimental approach. At the same time, the population spike amplitude increased, thus during consecutive high-intensity pulses the excitatory postsynaptic potential-spike coupling (E-S coupling) enhanced. This coincides with the generation of a significant BOLD response. The observation that under this condition the size of the BOLD response did not correlate with the spiking or postsynaptic activity of the pyramidal cells supports previous findings, 7 indicating that in the presence of an increased intrinsic excitability of the principal neurons mainly signaling cascades upstream of the principal cells determine the BOLD response.
In contrast, during the low-intensity stimulation protocol (i.e., trains 1 to 10 and 21 to 30) the synaptic responses to consecutive pulses did not decline, indicating that no inhibitory components were activated. Even though the slope of the fEPSP increased during consecutive low-intensity stimulation pulses no population spikes were generated. Consequently, possible changes in the intrinsic excitability of the pyramidal cells cannot be determined. However, under this condition no significant changes in BOLD signal intensities were observed.
It appears that mechanisms upstream of the principal cells that become activated by the incoming stimuli control the magnitude of the BOLD response. This may include glia cells, which may become directly activated by the presynaptically released glutamate or may become metabolically active as a result of glutamate uptake and glutamate-glutamine cycling. 2 Activated glia cells may in turn release various vasoactive substances, such as arachidonic acid metabolites (e.g., prostaglandin E2), epoxyeicosatrienoic acid, and D-serine,27, 28, 29, 30 and control by that vascular response.
In the current study, the strength of presynaptic activity in the right CA1 region was not studied, nor were any putative variations in presynaptic transmitter release during consecutive stimulations. Therefore, the authors can only speculate about the specific role of presynaptic activity for the generation of a BOLD response. However, as long as the postsynaptic and spiking activity of the most abundant neurons do not directly control the vascular response, other mechanism(s) that are activated by the presynaptically released transmitter and cofactors become(s) crucial for mediating the neurovascular coupling. No BOLD response was observed during sole presynaptic/postsynaptic activations, i.e., during application of consecutive low-intensity pulses. This may indicate that the amount of input activity in the CA1 region is not sufficient enough to modify the vascular response, or that input-related mechanisms can affect only the vascular response when concurrent principal cells and/or interneurons in the CA1 regions generate action potentials and process by that the incoming signals. The second assumption would support previous findings that the neurovascular coupling consists of at least two different mechanisms, namely, a presynaptically and a spiking-controlled component, whereupon the actual contribution depends on the current intrinsic excitability of the principal neurons. 7
In conclusion, direct evidence was presented that postsynaptic and spiking activity of CA1 pyramidal cells, the most abundant neurons in this region, do not control the magnitude of the BOLD response in the rat CA1 region. For that, a new experimental approach was used to measure simultaneously the summed postsynaptic activity of pyramidal cells in the rat CA1 region and the concurrently generated BOLD response during electrical stimulation of contralateral CA3 neurons that monosynaptically project to the CA1 region. Furthermore, more indirect evidence exclude a pivotal role of the local interneurons in the formation of a BOLD response. All of those results indicate that the magnitude of the BOLD response is not linearly related to the postsynaptic activity of local principal and interneurons. However, for eventually forming a stimulus-related BOLD response, a strong postsynaptic activity, sufficient to generate action potentials, appears to be necessary. Consequently, the postsynaptic activity of principal neurons is not the main predictor for the magnitude of formed BOLD responses in the hippocampal CA1 region.
Footnotes
ACKNOWLEDGMENTS
The authors wish to thank Jeanette Maiwald for her excellent technical assistance in the histological verification of the electrode locations.
The authors declare no conflict of interest.