
Abstract
Blood oxygen level dependent (BOLD) functional magnetic resonance imaging (fMRI) is the most widely used method for mapping neural activity in the brain. The interpretation of altered BOLD signals is problematic when cerebral blood flow (CBF) or cerebral blood volume change because of aging and/or neurodegenerative diseases. In this study, a recently developed quantitative arterial spin labeling (ASL) approach, bolus-tracking ASL (btASL), was applied to an fMRI experiment in the rat brain. The mean transit time (MTT), capillary transit time (CTT), relative cerebral blood volume of labeled water (rCBVlw), relative cerebral blood flow (rCBF), and perfusion coefficient in the forelimb region of the somatosensory cortex were quantified during neuronal activation and in the resting state. The average MTT and CTT were 1.939±0.175 and 1.606±0.106 secs, respectively, in the resting state. Both times decreased significantly to 1.616±0.207 and 1.305±0.201 secs, respectively, during activation. The rCBVlw, rCBF, and perfusion coefficient increased on average by a factor of 1.123±0.006, 1.353±0.078, and 1.479±0.148, respectively, during activation. In contrast to BOLD techniques, btASL yields physiologically relevant indices of the functional hyperemia that accompanies neuronal activation.
Introduction
Neurovascular coupling, defined as the close spatial and temporal relationship between neural activity and cerebral blood flow (CBF), forms the basis for neuroimaging techniques that map regional changes in the brain activity. The increase in local CBF that follows neural activity (Leniger-Follert and Hossmann, 1979) is mediated by complex interactions between neurons, glial cells, and vascular smooth muscle cells (D'Esposito et al, 2003) and can be used to provide contrast between an active brain region and surrounding resting tissue. Functional magnetic resonance imaging (fMRI) has emerged as the foremost method for visualizing these vascular correlates of brain activation.
The first fMRI maps of brain activation were generated by measuring the first passage of an exogenous intravascular contrast agent, termed as dynamic susceptibility contrast magnetic resonance imaging (Belliveau et al, 1991). The original technique provided regional cerebral blood volume (rCBV) maps of the brain during photic stimulation of the human visual cortex. Dynamic susceptibility contrast magnetic resonance imaging has since become a useful method for perfusion quantification that enables the quantification of mean transit time (MTT), CBF, and CBV, and changes in these parameters during focal increases in neural activity have been reported in both animal and human studies (Mandeville et al, 1998; Li et al, 2000). However, because contrast administration is required for each measurement, the use of dynamic susceptibility contrast magnetic resonance imaging for fMRI applications has declined.
Most present-day fMRI studies apply the blood oxygenation level dependent (BOLD) technique (Ogawa et al, 1990). The BOLD signal depends on the change in concentration of deoxyhemoglobin in the microvasculature when a neural event occurs. The increase in local blood flow in the activated region results in a decrease in the concentration of deoxyhemoglobin and this in turn leads to an increase in the BOLD signal, which can be imaged by a suitable magnetic resonance imaging protocol (Bandettini et al, 1992).
The physiologic basis of the BOLD contrast mechanism is complex and the quantification of the changes in parameters such as CBF, CBV, and the metabolic rate of oxygen consumption (CMRO2) using this technique has proven difficult. A number of quantitative approaches for the BOLD technique have been proposed (Buxton and Frank, 1997; Davis et al, 1998; Hyder et al, 1998), but these approaches typically rely on assumptions about a number of parameters, which cannot be determined directly with noninvasive MRI techniques (Li et al, 2000).
Alterations in the BOLD signal with aging and disease provide a considerable challenge for the interpretation of BOLD fMRI studies (D'Esposito et al, 2003). For example, it is well known that Alzheimer's disease is associated with a decrease in cerebral microvessel density, flattening of endothelial cells, and smooth muscle cell degeneration. Each of these effects has a function in reducing both resting CBF and the increase in CBF produced by activation (Hock et al, 1997). It follows that if the BOLD fMRI technique is not sensitive to alterations in brain pathologic study, it may not be the optimum technique to assess neural activity in cohorts of aged and or diseased subjects.
To improve the quantitative information from BOLD studies, a calibration technique and corresponding deoxyhemoglobin dilution model that quantifies the CMRO2 has been proposed (Davis et al, 1998). This approach estimates the maximum possible BOLD fMRI signal change by inducing either hypercapnia or hyperoxia. These states cause an increase in CBF without increasing the CMRO2 and thereby calibrate the BOLD signal for quantification of CMRO2. A recent review of these techniques (Bulte et al, 2009) suggests that inspiration of a CO2/O2 mixture should not be used for calibration, as the stimuli can produce BOLD signal changes that cannot be accounted for by a model based purely on CMRO2 consumption. This, coupled with the invasiveness of the technique, particularly in aged or diseased subjects, is a significant disadvantage of the quantitative BOLD approach. More recently, noncapnic and nonhypoxic challenges have also been applied for calibration of the BOLD signal. For example, BOLD measurements have been combined with electrophysiologic recordings during electrical stimulation of the rat forepaw to establish the relationship between hyperemic components and neural activity (Sanganahalli et al, 2009). This approach has identified a component of the BOLD signal that can be attributed to changes in CMRO2.
Arterial spin labeling (ASL) (Detre et al, 1992) uses tagged arterial blood as an endogenous contrast agent as opposed to the change in deoxyhemoglobin concentration used by the BOLD technique and has been applied to fMRI studies in the rat brain (Kerskens et al, 1996). Activation imaging using ASL has several potential advantages over the BOLD fMRI technique. Arterial spin labeling is insensitive to magnetic susceptibility effects that can degrade BOLD studies. By interleaving labeled images with control images, long-term instabilities in the image intensity can be alleviated (Siewert et al, 1996). This makes ASL more suitable for longitudinal studies in which changes in the perfusion response to neural activity are tracked over time. There have also been indications that the ASL signal is better localized at the site of neural activity than the BOLD signal (Wang et al, 2003). However, the primary advantage of ASL fMRI over BOLD fMRI is the fact that the signal is directly related to blood flow, not blood oxygenation, and, therefore, contains information that can be extracted to quantify the perfusion of active brain regions. Changes in physiologic parameters such as CBF during neural activity can be accurately quantified and tracked over time.
The quantification of CBF (mL/g/min) during neuronal activation is typically achieved with ASL by applying the modified Bloch equation approach (Kwong et al, 1992). This formulation assumes that the exchange of water molecules between the capillaries and the extravascular water is rapid. However, it has been well established through the use of diffusion sensitive gradients in combination with ASL that the fraction of labeled arterial water exchanging with tissue water decreases from 0.9 at normal flow rates (1.0 mL/g/min) to as low as 0.6 at elevated flow rates (4.0 mL/g/min) (Silva et al, 1997). As a result, the assumption of near perfect capillary permeability to water leads to errors in perfusion quantification when CBF is elevated because of neural activity.
A recently developed technique, bolus-tracking ASL (btASL) (Kelly et al, 2009a), is applied in this study to ASL data acquired during neuronal activation in the left primary somatosensory cortex forelimb (S1FL) region of the rat brain. This noncompartmental approach to ASL perfusion quantification is based on a Fokker–Planck equation for the variation in the distribution of labeled spins within the brain over time. The MTT, capillary transit time (CTT), relative cerebral blood volume of labeled water (rCBVlw), relative cerebral blood flow (rCBF), and perfusion coefficient,
Materials and methods
Theory
A theoretical model to facilitate the quantification of cerebral perfusion with ASL has been described in detail earlier (Kelly et al, 2009a). The model is based on the following Fokker–Planck equation for the concentration of labeled spins,
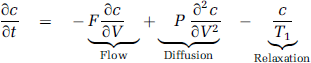
This equation describes the variation of
The btASL (described below) can be described by a rectangular input function or bolus,
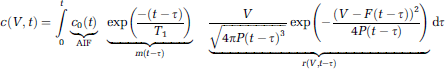
From this it can be seen that the solution has the conventional structure of a residue detection experiment with bolus dispersion (Petersen et al, 2006) and is equivalent to the convolution of an arterial input function (AIF) with a relaxation function,
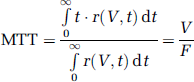
which is defined as the average time it takes a particle to traverse the vasculature (Meier and Zierler, 1954). The CTT is calculated from the second moment of
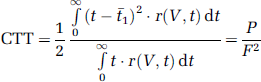
which has been interpreted as the time taken for labeled arterial water to be distributed at the region of interest (ROI) (Kelly et al, 2009a).
Anesthesia and Animal Preparation
Female Wistar rats (
Temperature was monitored with a rectal thermometer and maintained using a warming surface controlled by a water pump-driven temperature regulator. The respiration signal was continuously monitored using custom hardware and software (SA Instruments Inc., Stony Brook, NY, USA). The electrical stimulation resulted in neuronal activation when the respiration rate was in the range of 60 to 80 breaths per minute. The partial pressure of carbon dioxide (pCO2) for each animal was measured using a calibrated transcutaneous blood gas analyzer (TCM4, Radiometer Copenhagen, Willich, Germany) before commencing the magnetic resonance imaging scanning. The mean pCO2 for the 60 to 80 breaths per minute respiration rate range was 49.1 ± 6.7 mmHg.
Anatomic Scan
All imaging was carried out on a 7T, preclinical magnetic resonance imaging system (Biospec 70/30 USR, Bruker Biospin, Ettlingen, Germany). The imaging slice with maximal S1FL coverage was located by comparing images acquired using a rapid acquisition with relaxation enhancement high resolution anatomic scan with the rat brain atlas. The following parameters were used for the rapid acquisition with relaxation enhancement acquisitions: slice thickness = 2 mm, echo time, TE = 12 ms, repetition time, TR = 3.134 secs, FOV = 3.0 × 3.0 cm, image matrix = 256 × 256. This imaging slice was then used for the subsequent ASL sequence.
Arterial Spin Labeling Sequence
The btASL sequence described earlier (Kelly et al, 2009a) was used to provide signal–time curves of the passage of a 3-secs bolus through the S1FL region. The sequence consisted of a 5-secs preparation interval containing the inversion pulse, followed by snapshot fast low angle shot image acquisition (Kerskens et al, 1996). A 7.2-cm diameter bird-cage linear resonator, optimally tuned to 300.3 MHz, coil was used for transmission of the ASL and fast low angle shot excitation pulses. Signal detection was performed using an actively decoupled, circularly polarized, 20 mm diameter surface coil.
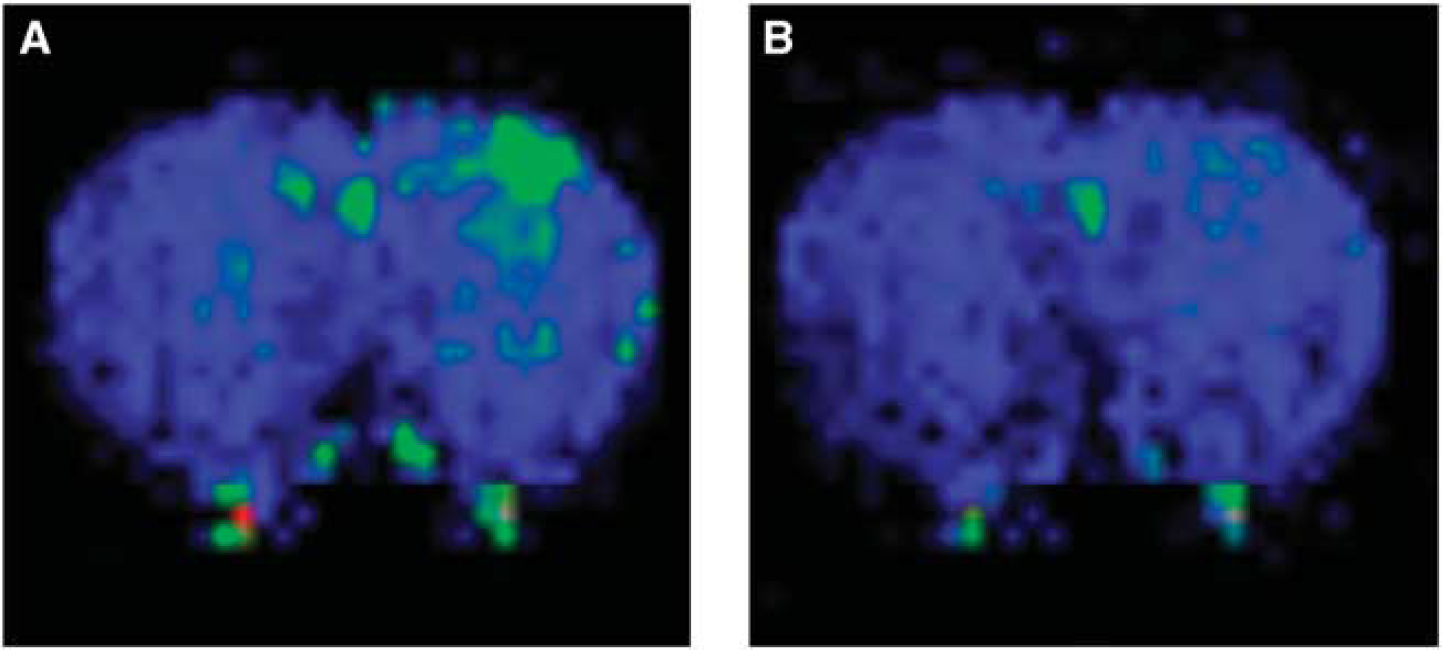
During the labeling phase of the ASL measurement, the principle of flow-induced fast adiabatic passage (Dixon et al, 1986) was used to supply inverted arterial spins to the imaging location. A rectangular pulse with maximum B1 amplitude of 120 mG was approximated by 10 shorter pulses with durations defined by a duty cycle of 80% to reduce demands on the RF amplifier. The RF power of the inversion pulse was set to achieve inversion at the desired location. The pulse had a bandwidth of 2.8 kHz and the gradient strength was set to 14 mT/m to provide an inversion region thickness of 4.7 mm. The pulse frequency was offset by −12 kHz, resulting in a tagging location 2 cm proximal to the imaging slice. A control image with the offset frequency reversed (+ 12 kHz) was also acquired, in which inflowing spins were left undisturbed. Corresponding pairs of labeled and control images were subtracted to provide perfusion-weighted maps (Figure 1). The preparation interval contained the inversion pulse and two variable delays. The delays and the inversion pulse duration were varied (Kelly et al, 2009a) to allow the full signal–time curve to be plotted (Figure 2).
(
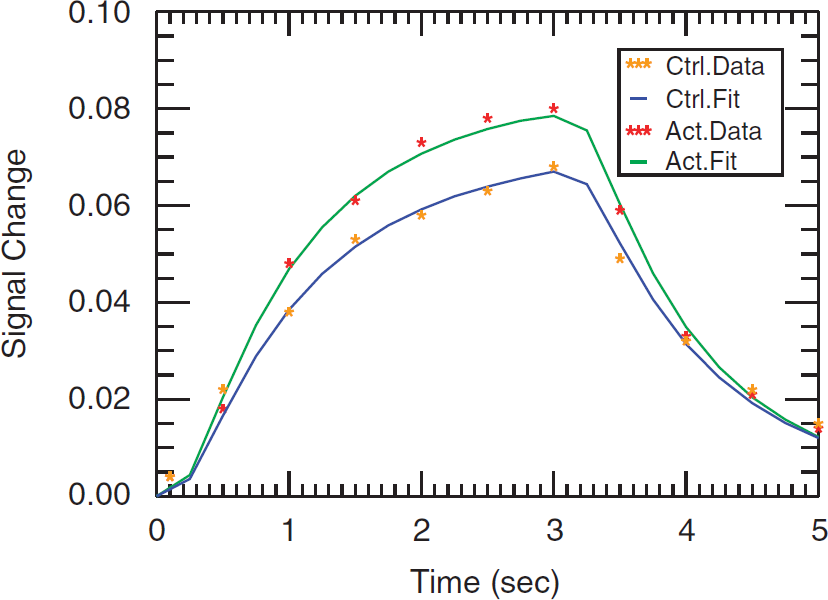
Least-squares fit of ASL data (yellow and red asterisks for control and activation experiments, respectively) to theoretical model (blue and green solid lines for control and activation experiments, respectively) for the left S1FL of animal 1. LSF results for animals 2–5 can be found in Supplementary Figure 2.
The snapshot fast low angle shot imaging was acquired with centric phase encoding to enhance sensitivity to contrast provided by inflowing labeled magnetization (Holsinger and Riederer, 1990). The following parameters were used: slice thickness = 2 mm, TR = 6.66 ms, TE = 2.99 ms, RF flip angle = 30°, field of view = 3.0 × 3.0 cm, image matrix = 128 × 64, receiver bandwidth = 50 kHz. The total time for the ASL preparation and image acquisition for a single measurement point was 5.426 secs.
Stimulation Protocol
A square pulse nerve and muscle stimulator (Grass Technologies Inc., West Warwick, RI, USA) was used to electrically stimulate the right forepaw (3 V, 5 Hz, 5 ms duration pulses). This resulted in neuronal activation in the S1FL region, at + 0.2 mm Bregma (Figure 1). Stimulation was started 10 secs before the beginning of the btASL sequence and was maintained throughout the labeling phase of the experiment, which was 59.7 secs in duration. This was followed by a rest period of 5 mins and was repeated six times for signal averaging.
Before the acquisition of the btASL signal–time curves (Figure 2), the ASL sequence was used to ensure that the electrical stimulus was providing a consistent hemodynamic response in the activated S1FL region. The inversion pulse was fixed at the position within the preparation interval that produces the maximum perfusion-weighted signal in the btASL signal–time curves (Figure 2). Eight perfusion-weighted images were acquired during 60secs of electrical stimulation to investigate the variations in the ASL signal within the activated S1FL region during stimulation, with the results for each animal shown in Figure 3.
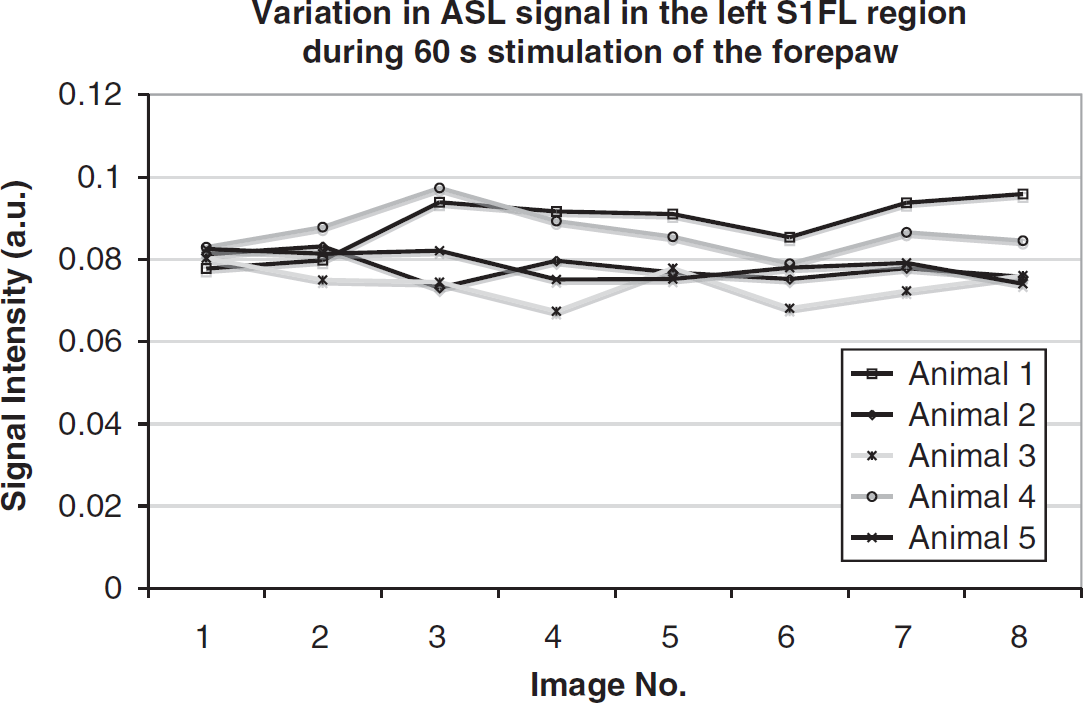
Variation in ASL signal in the activated left S1FL region during 60 secs stimulation of the right forepaw animal 1 to 5.
Curve Fitting and Calculation of Transit Times
The activated left S1FL region was manually selected as the ROI in each dataset using the ImageJ ROI tool (Rasband W.S., Bethesda, MD, USA). Concentration–time curves for this ROI were created by calculating the mean signal intensity within the ROI and plotting the change in signal versus time. The resultant curves from the left S1FL region during electrical stimulation (red asterisks) and in the resting state (yellow asterisks) are shown in Figure 2 for one animal. To fit the theoretical model to these curves, the solution in Equation (2) was rewritten as follows (Kelly et al, 2009a):
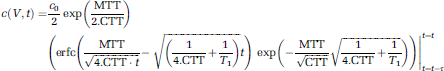
where erfc is the complementary error function and τ is the bolus duration and
To facilitate quantification of the transit times from the curve-fitting procedure, Equation (5) was parameterized by three fitting parameters,
Estimation Regional Cerebral Blood Volume of Labeled Water
The fitting parameter
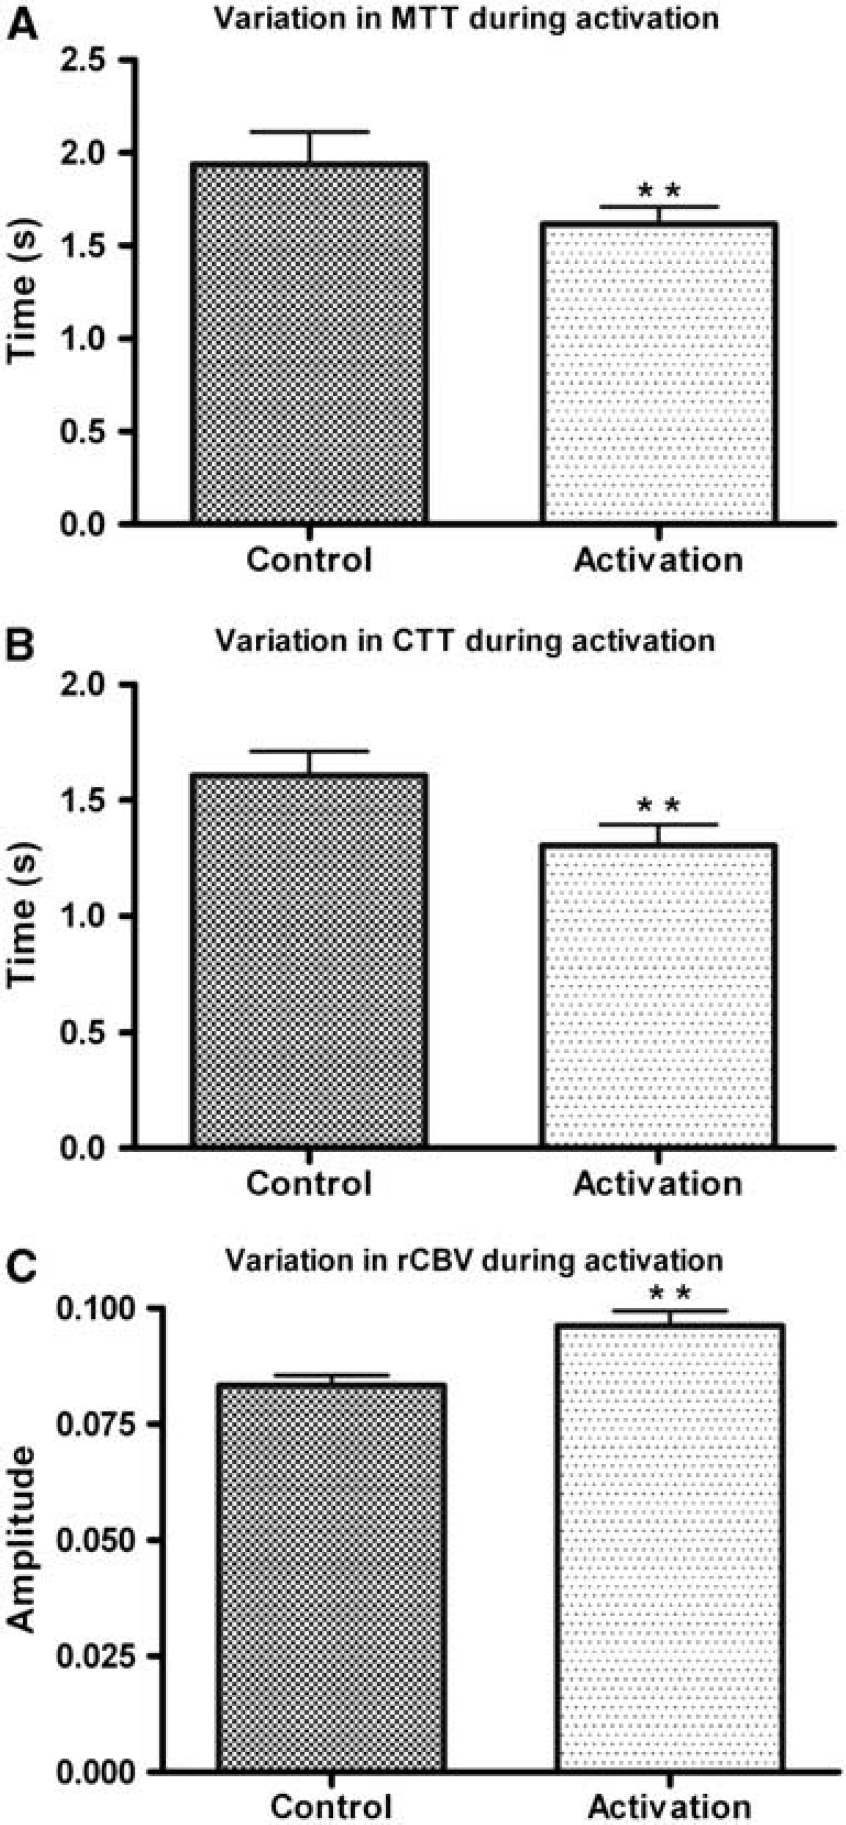
MTT and CTT measured during resting state (control) and neuronal activation
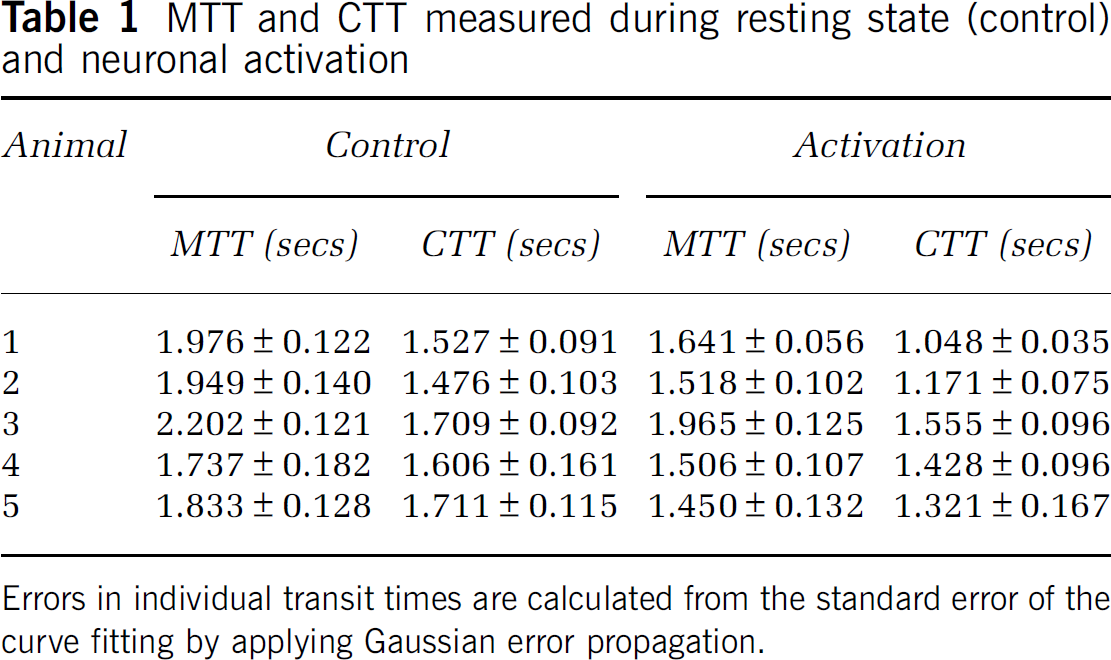
Errors in individual transit times are calculated from the standard error of the curve fitting by applying Gaussian error propagation.
Calculation of the increase in rCBVlw in the S1FL during neuronal activation
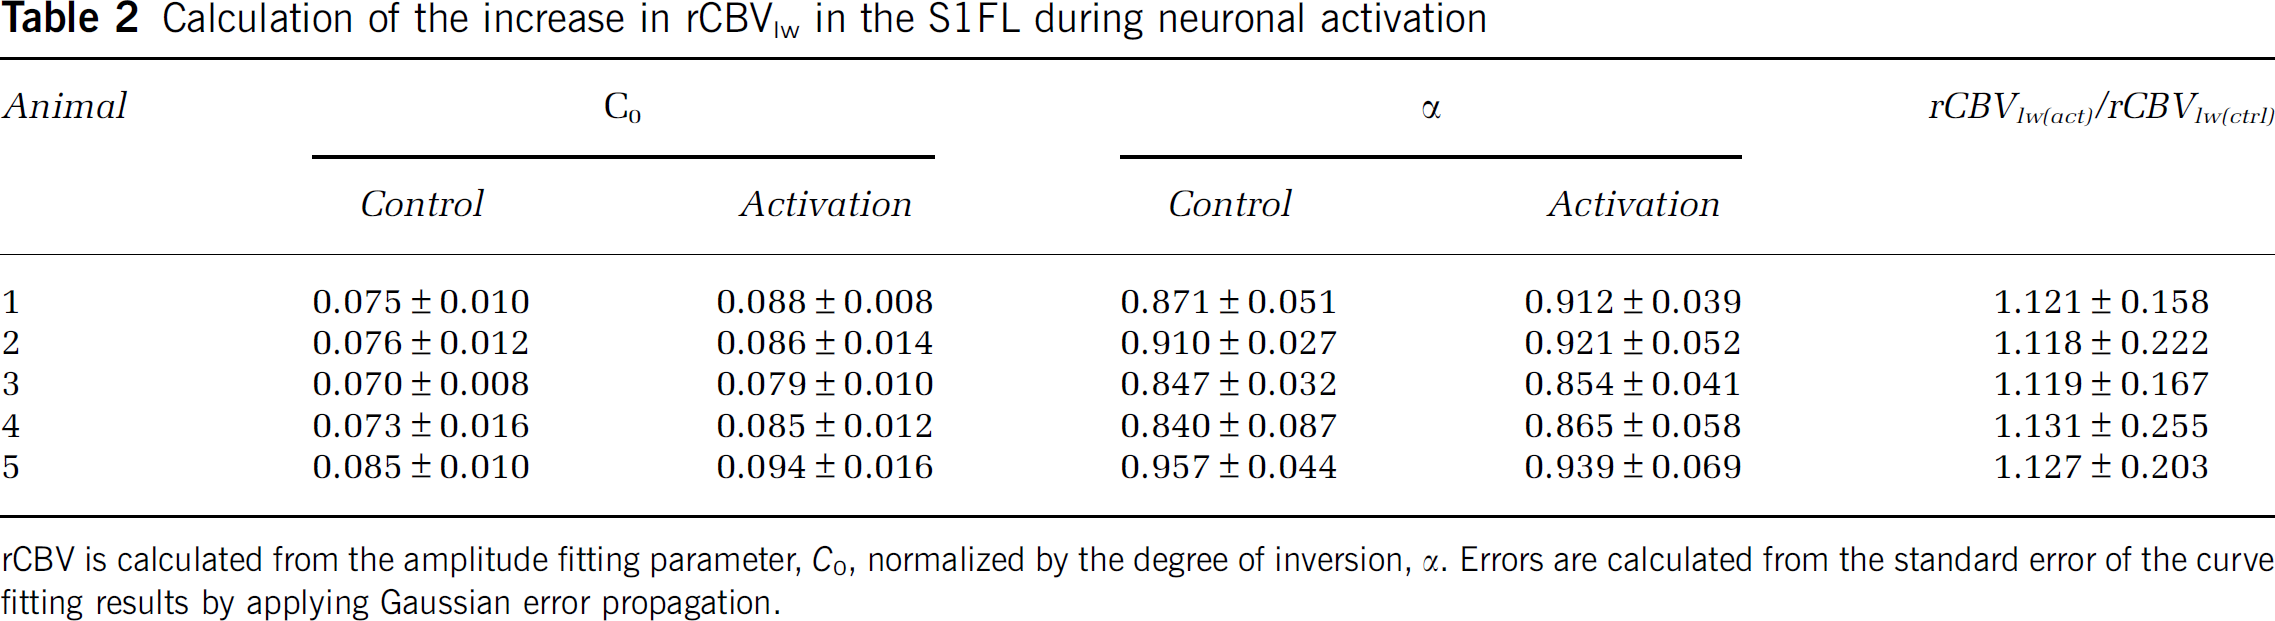
rCBV is calculated from the amplitude fitting parameter,
Regional Extent of Neuronal Activation
To establish the regional extent of the neuronal activation in terms of the MTT, CTT, and rCBVlw, pixel-by-pixel maps of the perfusion parameters were created. The maps were formed by creating a signal–time curve for each pixel within the brain and performing the least-squares fit of Equation (5) to these signal–time curves on a pixel-by-pixel basis. Figures 4A, C, and E show the MTT, CTT, and rCBVlw maps obtained during electrical stimulation of the right forepaw of animal 1. The decrease in both the MTT and CTT and the increase in the rCBVlw in the activated left S1FL region can be clearly identified. Figures 4B, D, and F show the MTT, CTT, and rCBVlw maps obtained in the resting state (control).
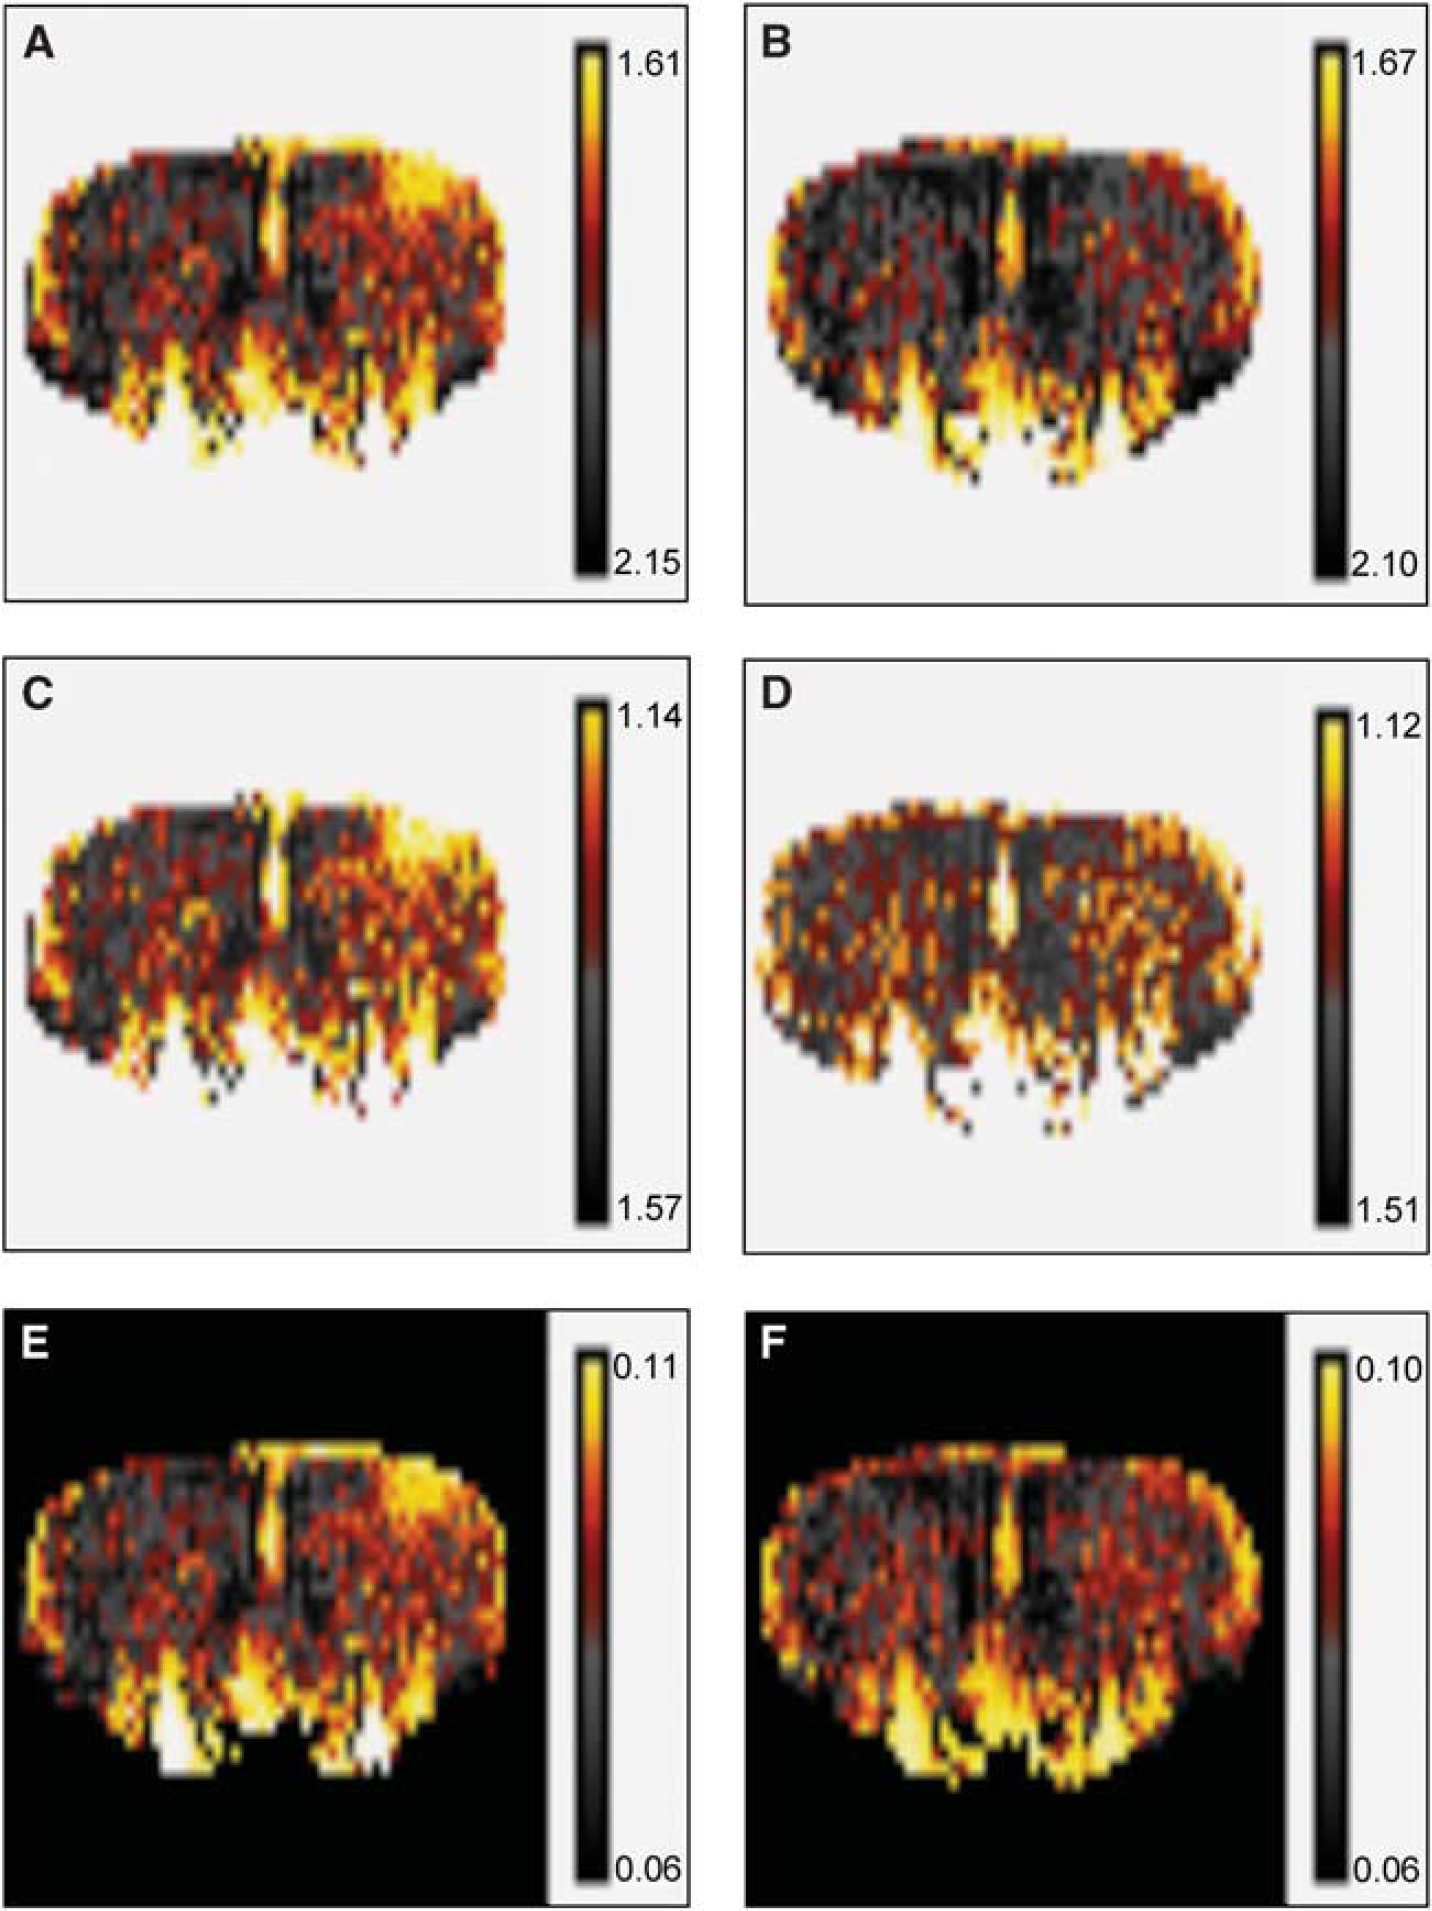
Pixelwise maps of the MTT, CTT, and rCBVlw of animal 1 during neuronal activation (
Measured Change in Regional Cerebral Blood Flow and Perfusion Coefficient
The change in rCBF and
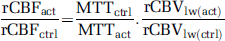
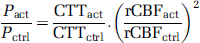
Similarly, from the definition of CTT in Equation (4), the ratio of the perfusion coefficient during the activation experiment,
Results
Variation in Transit Times During Neuronal Activation
Table 1 shows the individual MTT and CTT values obtained from the fitting parameters of the least-squares fit. The error in the individual transit times was calculated from the standard error of the curve-fitting procedure. Both transit times were found to decrease in all subjects during neuronal activation. The MTT decreased on average from 1.939 ± 0.175 secs (control) to 1.616 ± 0.207 secs (activation) and the CTT decreased on average from 1.606 ± 0.106 secs (control) to 1.305 ± 0.201 secs (activation) (errors represent one standard deviation from the mean). These results are illustrated in Figures 5A and B, in which a two-tailed paired
(
Variation in Relative Cerebral Blood Volume of Labeled Water, Relative Cerebral Blood Flow, and Perfusion Coefficient During Neuronal Activation
Table 2 shows the values obtained for the change in rCBVlw during neuronal activation. The rCBVlw was found to increase on average from 0.086 ± 0.003 to 0.096 ± 0.005 arbitrary units, which corresponds to an increase in rCBVlw during neuronal activation by a factor of 1.123 ± 0.034. This result is illustrated in Figure 5C, in which a two-tailed paired
Calculation of factor by which rCBF and the perfusion coefficient,
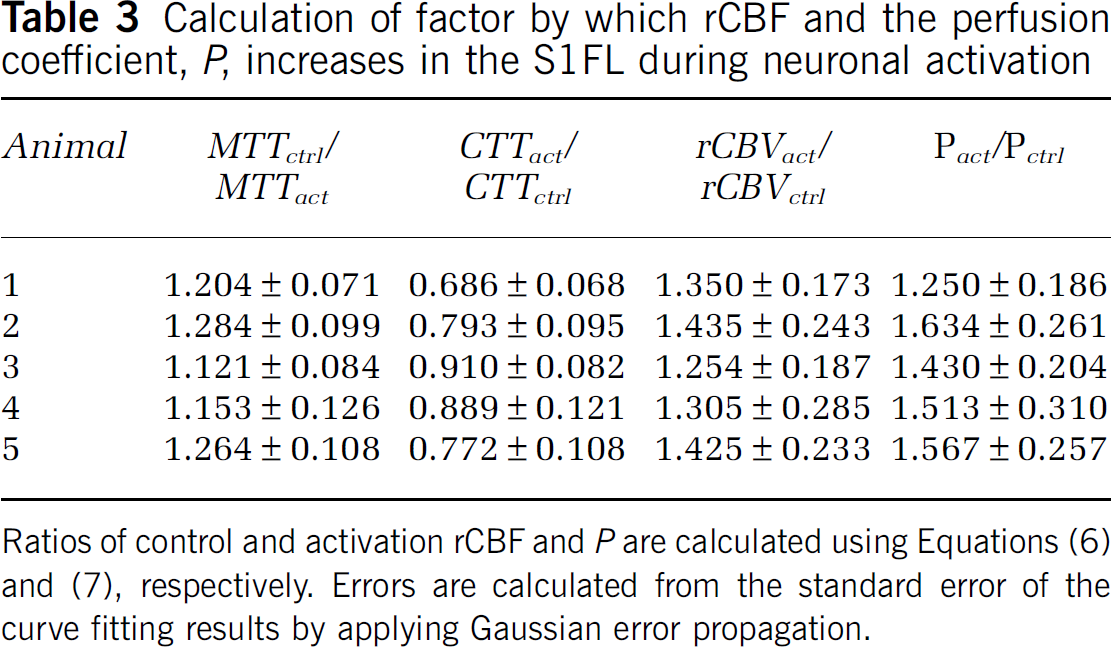
Ratios of control and activation rCBF and
Discussion
The functional btASL technique introduced in this study provides a unique insight into the hemodynamic response to neuronal activation. The findings show the ability of the technique to simultaneously quantify variations in MTT, CTT, rCBF, rCBVlw, and the perfusion coefficient,
The increases in rCBF and rCBVlw (35.3 ± 7.8% and 12.3 ± 1.1%, respectively) were expected, as increases in these parameters during neuronal activation have been measured earlier by both contrast agent techniques and conventional ASL approaches. In a contrast agent study by Mandeville et al, 1998, an increase in focal CBV of 24% was reported in the somatosensory cortex during electrical stimulation of the rat forepaw. A human study comparing the hemodynamic response measured by contrast agent bolus-tracking, ASL, and BOLD measured increases in rCBV and rCBF increases of 19% and 35%, respectively, in the motor cortex with the contrast agent technique during finger-tapping stimulation of the motor cortex (Li et al, 2000). In the same study, an increase in rCBF of 36% was also measured by the flow-sensitive alternating recovery pulsed ASL technique, with the original ASL perfusion model (Detre et al, 1992) used for quantification. More recently, a comparison of the change in CBF as measured by flow sensitive alternating recovery ASL and positron emission tomography reported a 22% increase in CBF in the visual cortex, which was slightly lower than the 28% change measured by positron emission tomography (Chen et al, 2008). A continuous ASL fMRI study of perfusion changes during a finger-tapping task reported a 31% increase in rCBF in the primary motor cortex (Garraux et al, 2005).
Most quantitative ASL techniques are based on the theory of the early perfusion experiments carried out by Kety and Schmidt, 1948. These approaches are intrinsically based on Fick's principle, which assumes that magnetically labeled water protons act as a freely diffusible tracer. When a freely diffusible tracer is assumed, the CBV cannot be estimated and either an intravascular tracer-based measure of CBV or the application Grubb's power law (Grubb et al, 1974) with a constant exponent (α = 0.38) is required to estimate the change in CBV during neuronal activation. An alternative to these methods is desirable as the former relies on the invasive injection of a contrast agent and the latter is known to produce systematic errors as it has been established that α can vary depending on the experimental conditions (Kida et al, 2007).
The btASL quantitative fMRI technique is capable of quantifying the change in both CBV and CBF during neuronal activation. The rCBVlw is calculated from the area under the ASL concentration–time curve (or zeroth moment), which allows the rCBF to be calculated from the decrease in the MTT. The increase in the perfusion coefficient,
The btASL technique has earlier been applied to an aging study in the rat brain (Kelly et al, 2009b), in which both the MTTand CTTwere found to increase in a group of aged rats compared with young and middle aged group. In the absence of a change in the rCBVlw, the increase in the transit times corresponded to a decrease in rCBF and
The btASL fMRI technique has a number of shortcomings in its present form. First, the temporal resolution required to acquire the ASL signal–time curves (Figure 2) necessitates long stimulation periods of approximately 1 min duration. Although 11 time points were used to generate these curves, the aim was to provide proof of concept and assess the applicability of the btASL technique to an fMRI study. As only three fitting parameters are necessary to perform the least-squares fit, conceivably four time points would be sufficient for quantification of the perfusion parameters. This would greatly reduce the stimulation duration. In addition, the technique is restricted to single-slice acquisition because of magnetization transfer effects. The use of a dedicated labeling coil (Zhang et al, 1995) or a more sophisticated labeling scheme such as the double adiabatic inversion approach (Alsop and Detre, 1998) would facilitate multi-slice imaging and allow more comprehensive mapping of the activated region. Finally, the calculation of the rCBVlw requires the DOI to be estimated. The method used in this study involves measuring the signal intensity in the middle cerebral arteries and includes a partial volume error. The DOI was not found to vary significantly between the control and activation experiments (Table 2) and as a result, when considering the relative change in rCBVlw between the control and activation states, the DOI error is mainly cancelled out. However, a more accurate quantification of the inversion efficiency, such as the phase contrast magnetic resonance angiography method (O'Gorman et al, 2006), would improve the accuracy of the results.
In conclusion, the results of this study show the ability of the btASL technique to provide a novel quantitative assessment of the hemodynamic response to neuronal activation in terms of a unique set of perfusion parameters (MTT, CTT, rCBVlw, rCBF, and
Footnotes
Acknowledgements
This work was supported in part by the Irish Research Council for Science, Engineering and Technology (IRCSET), Trinity College Institute of Neuroscience, Health Research Board (HRB), and Higher Education Authority (HEA).
The authors declare no conflict of interest.