
Abstract
High-resolution fMRI enables noninvasive mapping of the hemodynamic responses from individual penetrating vessels in animal brains. Here, a 2D multi-echo single-vessel fMRI (MESV-fMRI) method has been developed to map the fMRI signal from arterioles and venules with a 100 ms sampling rate at multiple echo times (TE, 3–30 ms) and short acquisition windows (<1 ms). The T2*-weighted signal shows the increased extravascular effect on venule voxels as a function of TE. In contrast, the arteriole voxels show an increased fMRI signal with earlier onset than venules voxels at the short TE (3 ms) with increased blood inflow and volume effects. MESV-fMRI enables vessel-specific T2* mapping and presents T2*-based fMRI time courses with higher contrast-to-noise ratios (CNRs) than the T2*-weighted fMRI signal at a given TE. The vessel-specific T2* mapping also allows semi-quantitative estimation of the oxygen saturation levels (Y) and their changes (ΔY) at a given blood volume fraction upon neuronal activation. The MESV-fMRI method enables vessel-specific T2* measurements with high spatiotemporal resolution for better modeling of the fMRI signal based on the hemodynamic parameters.
Introduction
Functional MRI (fMRI) has been developed to noninvasively map the large-scale brain function.1–9 With high field MRI, numerous efforts have been made to improve the spatial specificity for functional brain mapping.10–13 The increased signal-to-noise ratio (SNR) inherent to high field MRI enables detection of functional cortical columns14–20 and laminar-specific fMRI signals in both animal and human brains.21–30 Given the vascular hemodynamic origin of the fMRI signal,31,32 when the spatial resolution of fMRI is improved to distinguish individual penetrating vessels in the cortex, the fMRI signal can be mapped from individual vessel voxels in both rat and cat brains.22,26,33 In particular, penetrating venules dominate the BOLD signal, and penetrating arterioles mainly highlight the iron oxide particle-based cerebral blood volume (CBV) signal from the two-dimensional (2D) T2*-weighted images.33,34 Instead of the echo-planar imaging (EPI)-fMRI method, the fast low-angle shot (FLASH) method with reshuffled line-scanning fMRI,23,35 or the balanced steady-state free precession (bSSFP) method36,37 has been implemented to map the single-vessel fMRI in both task-related or resting-state conditions. 33
Optical methods have been routinely used to characterize the hemodynamic microvascular origin of the fMRI signal in animal brains.38–42 By measuring the absorption spectrum of oxy- and deoxy-hemoglobin, the blood oxygen saturation changes in cortical vessels can be estimated upon neural activation.43–46 Using two-photon microscopic (2-PM) imaging, the laminar and temporal features of neural activity-coupled arteriole dilation or pericyte-controlled capillary dilation, as a direct measurement of vascular volume change upon neuronal activation, and the blood flow changes can be integrated to interpret the fMRI signal.38–40,47,48 Gagnon et al. 42 have implemented the vessel-specific oxygen saturation measurement based on the pO2-nanosensor in the reconstructed 3D cerebrovasculature model of rodent brains, showing a step forward in estimating the BOLD signal from previous fMRI modeling studies.49–53 In particular, the altered arteriole oxygen saturation levels in the cerebrovasculature have demonstrated the direct arteriole contribution to the BOLD signal. 42 This study is an extension of the pial vessel oxygen tension measurement with the oxygen sensor, showing that the oxygen saturation level can be less than 80% in an artery with a diameter of less than 50 µm. 54 Simultaneous optical measurements of the hemodynamic responses with fMRI have revealed a strong temporal correlation,40,55 but the conventional fMRI method does not provide a vessel-specific validation platform to distinguish the fMRI signal from arteriole and venule voxels. Due to the limited spatiotemporal resolution of conventional fMRI methods, the vessel-specific fMRI signal has been seldom measured to validate the modeling of the fMRI signal based on the estimated hemodynamic factors, e.g. the oxygen saturation level (Y) and the blood volume fraction (Vf). 32 The single-vessel fMRI mapping scheme enables semi-quantitative estimation of the hemodynamic parameters for modeling the vessel-specific fMRI signal directly.
In the present study, we implemented a multi-echo acquisition scheme for the line-scanning fMRI method23,34 to measure the fMRI signal from individual vessels.23,34 With the improved method, each k-space line was acquired consecutively along the block design paradigm, and the on/off stimulation trials were repeated for the number of phase-encoding steps.34,35 Since only one k-space line was acquired per echo, the acquisition window could be significantly reduced to ∼1 ms, which is much shorter than the readout echo train (10–20 ms) of the EPI method. The short acquisition window not only avoided the long echo train-induced extra T2*-weighting under the high magnetic field but also shortened the minimal TE.22,56–60 Here, we used the multi-echo single-vessel fMRI (MESV-fMRI) method to measure the MRI signal at different TEs and hence specify the spatiotemporal patterns of the T2* signal changes from distinct arteriole and venule voxels. This work also enables direct estimation of the dynamic changes of the oxygenation saturation level from individual vessel voxels at a given vessel volume fraction.
Materials and methods
Animal preparation
All animal experiments were performed according to a protocol approved by the animal protection committee (KY 02/14, Regierungspräsidium Tuebingen, Germany), and in accordance with the guidelines of the European Communities Council Directive 2010/63/EU. Experiments were reported according to the Animal Research: Reporting in Vivo Experiments (ARRIVE) guidelines.
fMRI experiments were performed on five male Sprague Dawley rats. All procedures have been described in a previous study.33,34,61,62 Rats were initially anesthetized with isoflurane (5% induction, 1.5% maintenance), and orally intubated and placed on a mechanical ventilator (SAR-830/AP, CWE Inc.). Plastic catheters were inserted into the right femoral artery and vein to allow monitoring of arterial blood gasses and administration of anesthetics. After surgery, each rat was given an intravenous bolus of α-chloralose (80 mg/kg), and isoflurane was discontinued. Anesthesia was maintained with a constant infusion of α-chloralose (26.5 mg/kg/h). The animals were placed on a heated pad to maintain a rectal temperature at 37°C while in the magnet. Each animal was secured in a head holder with a tooth-bar to prevent head motion. End-tidal CO2, rectal temperature, tidal pressure of ventilation, heart rate, and arterial blood pressure were continuously monitored during the experiment. Arterial blood gas levels were checked periodically, and corrections were made by adjusting the respiratory volume or administering sodium bicarbonate to maintain blood gas levels when required. An intravenous injection of pancuronium bromide (4.0 ± 0.18 mg/kg, mean ± SD, n = 5 rats) was given once per hour to reduce motion artifacts. Voluntary respiration-induced resonance offset reduced significantly following the administration of the pancuronium injection.
MRI image acquisition
All images were acquired with a 14.1 T/26 cm horizontal bore magnet (Magnex), interfaced to an AVANCE III console (Bruker, Germany) and equipped with a 12 cm gradient set, capable of providing 100 G/cm with a rise time of 150 µs (Resonance Research). A transceiver surface coil with a 6 mm diameter was used to acquire images.
MESV-fMRI
Previously, the line-scanning method was applied to acquire a single k-space line along the on/off block design to map the fMRI signal with high spatial and temporal resolution.23,34,35 Here, multi-gradient echoes were implemented in the single-vessel line-scanning fMRI method. In contrast to the multi-echo EPI-fMRI and FLASH-fMRI methods,63–66 MESV-fMRI acquired only one k-space line for each echo at every time-of-repetition (TR) during an on/off stimulation block-design trial, and the k-space was filled sequentially by repeating the fMRI block-design stimulation trials for the number of phase-encoding steps (Figure 1(b)). This acquisition scheme sampled fMRI signals from multiple echoes ranging from 3 ms to 30 ms at every 100 ms with an acquisition window for each echo of less than 1–2 ms.
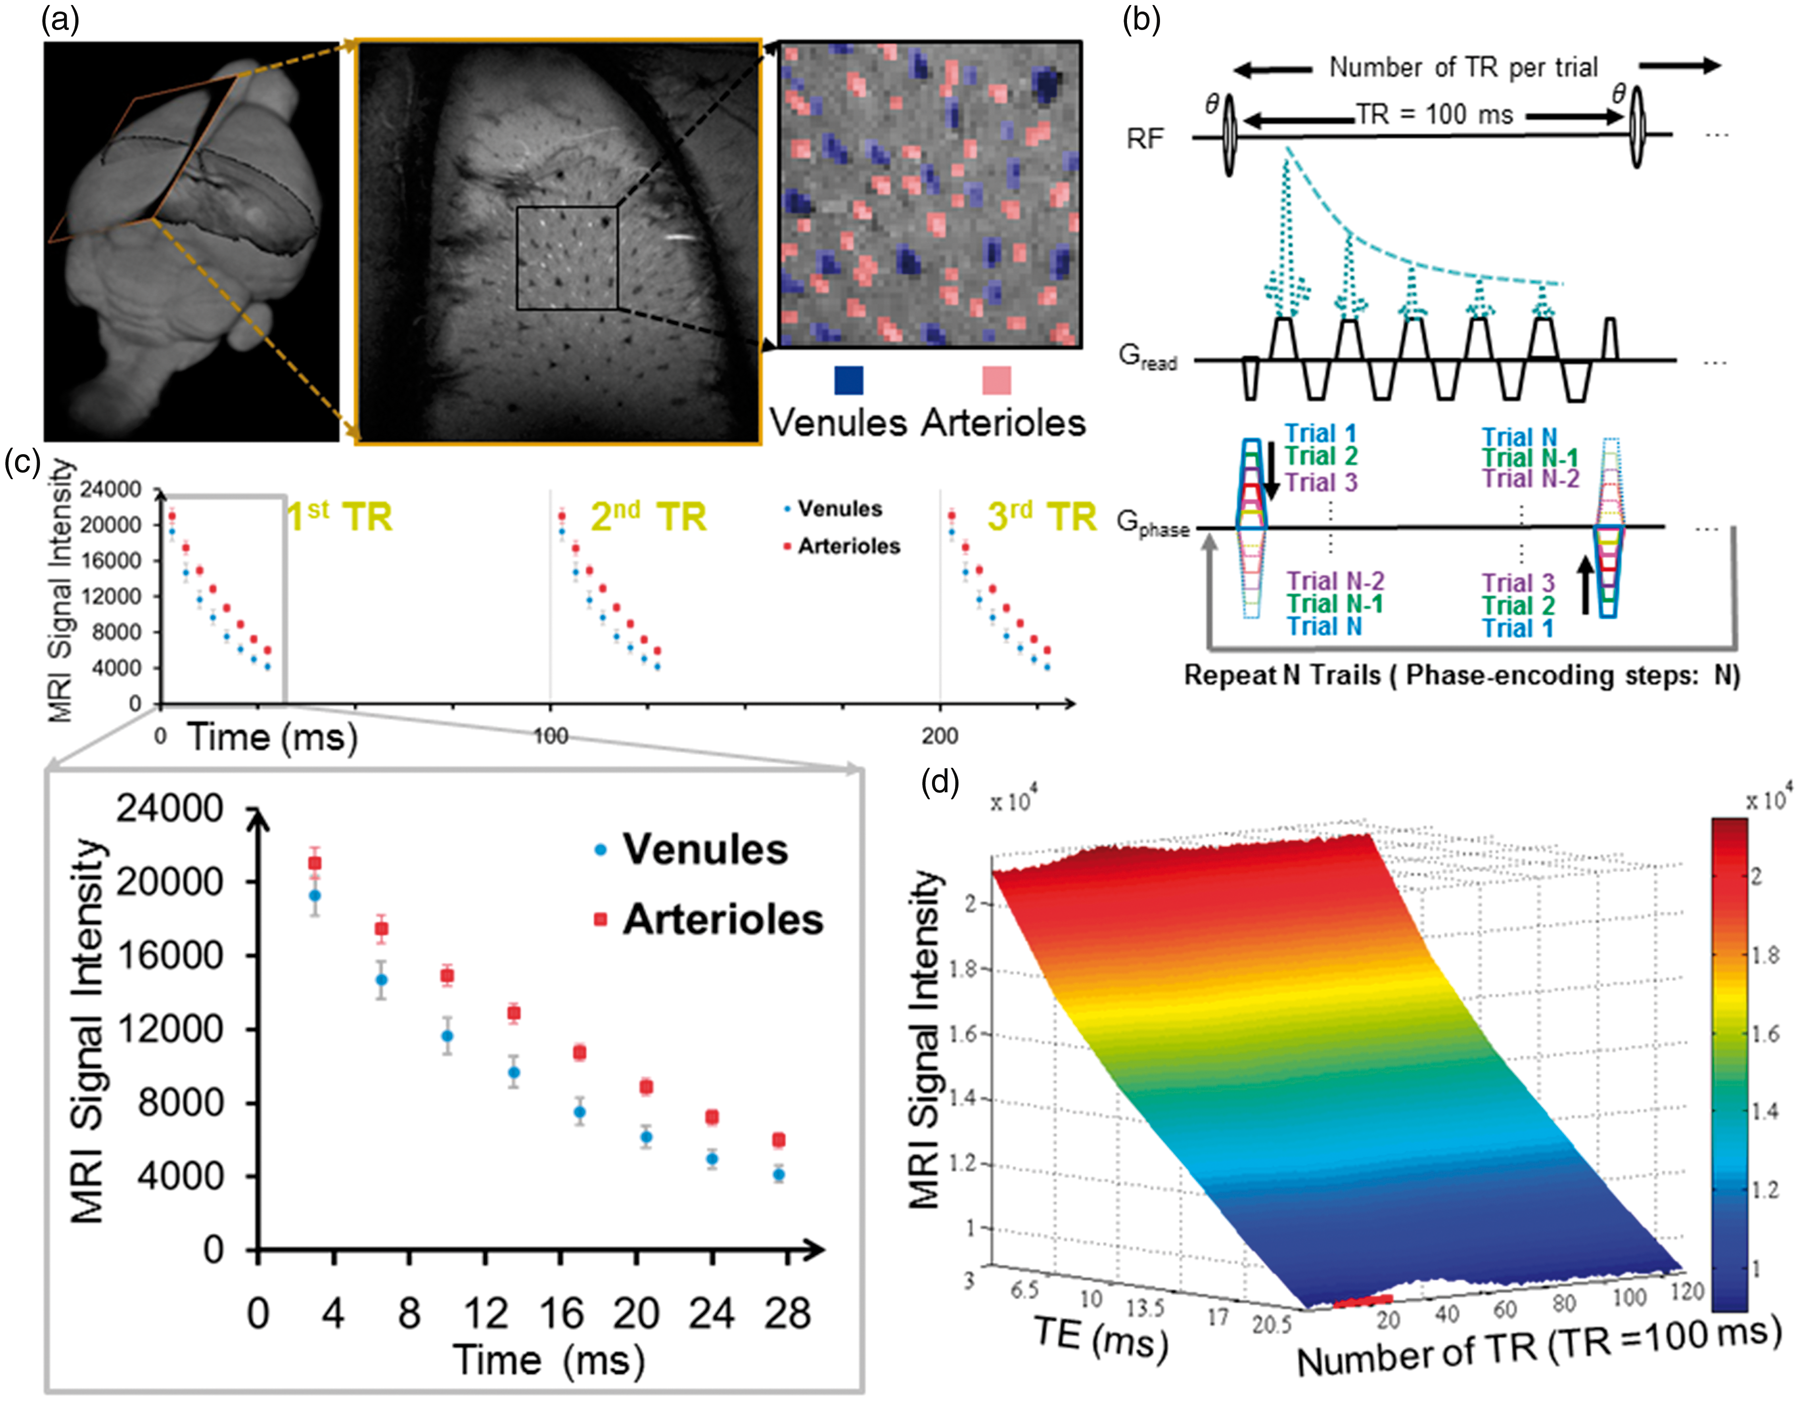
Mapping the vessel-specific fMRI signal with the MESV-fMRI method. (a) The 2D slice position of the A-V map was shown in the 3D rat brain (left panel). The arteriole voxels were marked as red ROIs and the venule voxels as blue ROIs (right panel), (b) MESV-fMRI pulse sequence diagram. Only one phase-encoding step was employed in each trial. The trials were repeated for the number of phase-encoding steps to fill up the k-space, (c) The signal intensity of venule voxels (blue circles) and arteriole voxels (red squares) was shown at different TEs from three consecutive TRs (100 ms). The enlarged data showed that the venule voxels had faster decay curves than the arteriole voxels (one representative rat from five rats, venules: n = 25, arteriole: n = 32, mean (95% CI)), (d) The three-dimensional plot of the mean signal intensity with multiple echoes TEs (3.5 ms to 21.5 ms) from venule voxels as a function of the on/off block design time (1 s off, 2 s on, and 10 s off).
A 2D multiple gradient echo (MGE) sequence was modified to perform multi-echo line-scanning fMRI with the following parameters: TEs, 3 ms, 6.5 ms, 10 ms, 13.5 ms, 17 ms, 20.5 ms, 24 ms, 27.5 ms, 31 ms; TR, 100 ms; flip angle, 22°; matrix, 96 × 64; slice thickness, 400 µm; in-plane resolution, 100 × 100 µm; acquisition bandwidth, 96 kHz. Two saturation slices were applied every TR to suppress the signal outside of the field of view (FOV) and hence reduce the potential aliasing effect along the phase-encoding direction. The frequency-encoding direction was set along the z0 direction toward the lung to reduce the respiration-induced resonance offset. The block-design stimulation paradigm was used in the MESV-fMRI experiment. The electrical stimulation was delivered by a stimulation isolator (AD Instruments) (2.0 mA, 300 µs pulses repeated at 3 Hz) through two needle electrodes that were inserted between digits of the forepaw. The block-design paradigm consisted of 60 dummy scans to reach steady state, followed by 10 pre-stimulation scans, 20 scans during electrical stimulation, and 100 post-stimulation scans (with a total of 13 s for each on/off stimulation experiment). For image acquisition, only one single-phase k-space line was acquired at each TE per 100 ms before the second set of k-spaces was filled during the block design trial (Supplementary Fig. 1). Each trial consisted of three epochs of on/off stimulation periods with a total of 390 TRs. The trials were repeated for the number of phase-encoding steps. The total duration was 40 min, and –three to six MESV-fMRI trials were acquired for each rat.
The single-vessel arteriole-venule map
A 2D MGE sequence was used to detect individual arterioles and venules with the following parameters: TR, 50 ms; TEs, 2.5 ms, 5 ms, 7.5 ms, 10 ms, 12.5 ms, 15 ms, 17.5 ms; flip angle, 40°; matrix, 192 × 128; in-plane resolution, 50 µm × 50 µm; slice thickness, 400 µm, acquisition bandwidth, 96 kHz. This slice orientation was perpendicular to the penetrating vessels and covered forepaw S1 areas based on the Paxinos atlas. The horizontal slice angle was set at 15°, and the center of the slice was positioned 1.2 mm from the cortical surface to cover layer 5 (Figure 1(a)). Similar to the previous study, 34 by averaging the MGE images acquired from the second echo to the fourth echo, the single-vessel A-V map showed the venule voxels as dark dots due to fast T2* de-phasing, while arteriole voxels remained as bright dots due to the in-flow effect. The individual vessel voxels were determined based on their signal intensity as either higher than the mean signal intensity plus three times the standard deviation (arterioles) or lower than the mean signal intensity minus three times the standard deviation (venules) of the local areas in a 7 × 7 kernel. The venule voxels were color-coded in blue, and the arterial voxels were color-coded in red (Figure 1(a)). After the vessel voxels were characterized, an “imdilate” function67,68 was applied to dilate each vessel voxel. The differences between the vessel voxels and the dilated vessel voxels specify the peri-vessel area surrounding the vessel voxels. To avoid peri-vessel voxels being overlapped by different vessel voxels, a dilating factor of 2 was chosen to set the expanded peri-vessel voxels to a width of two voxels (Figure 2(c)).
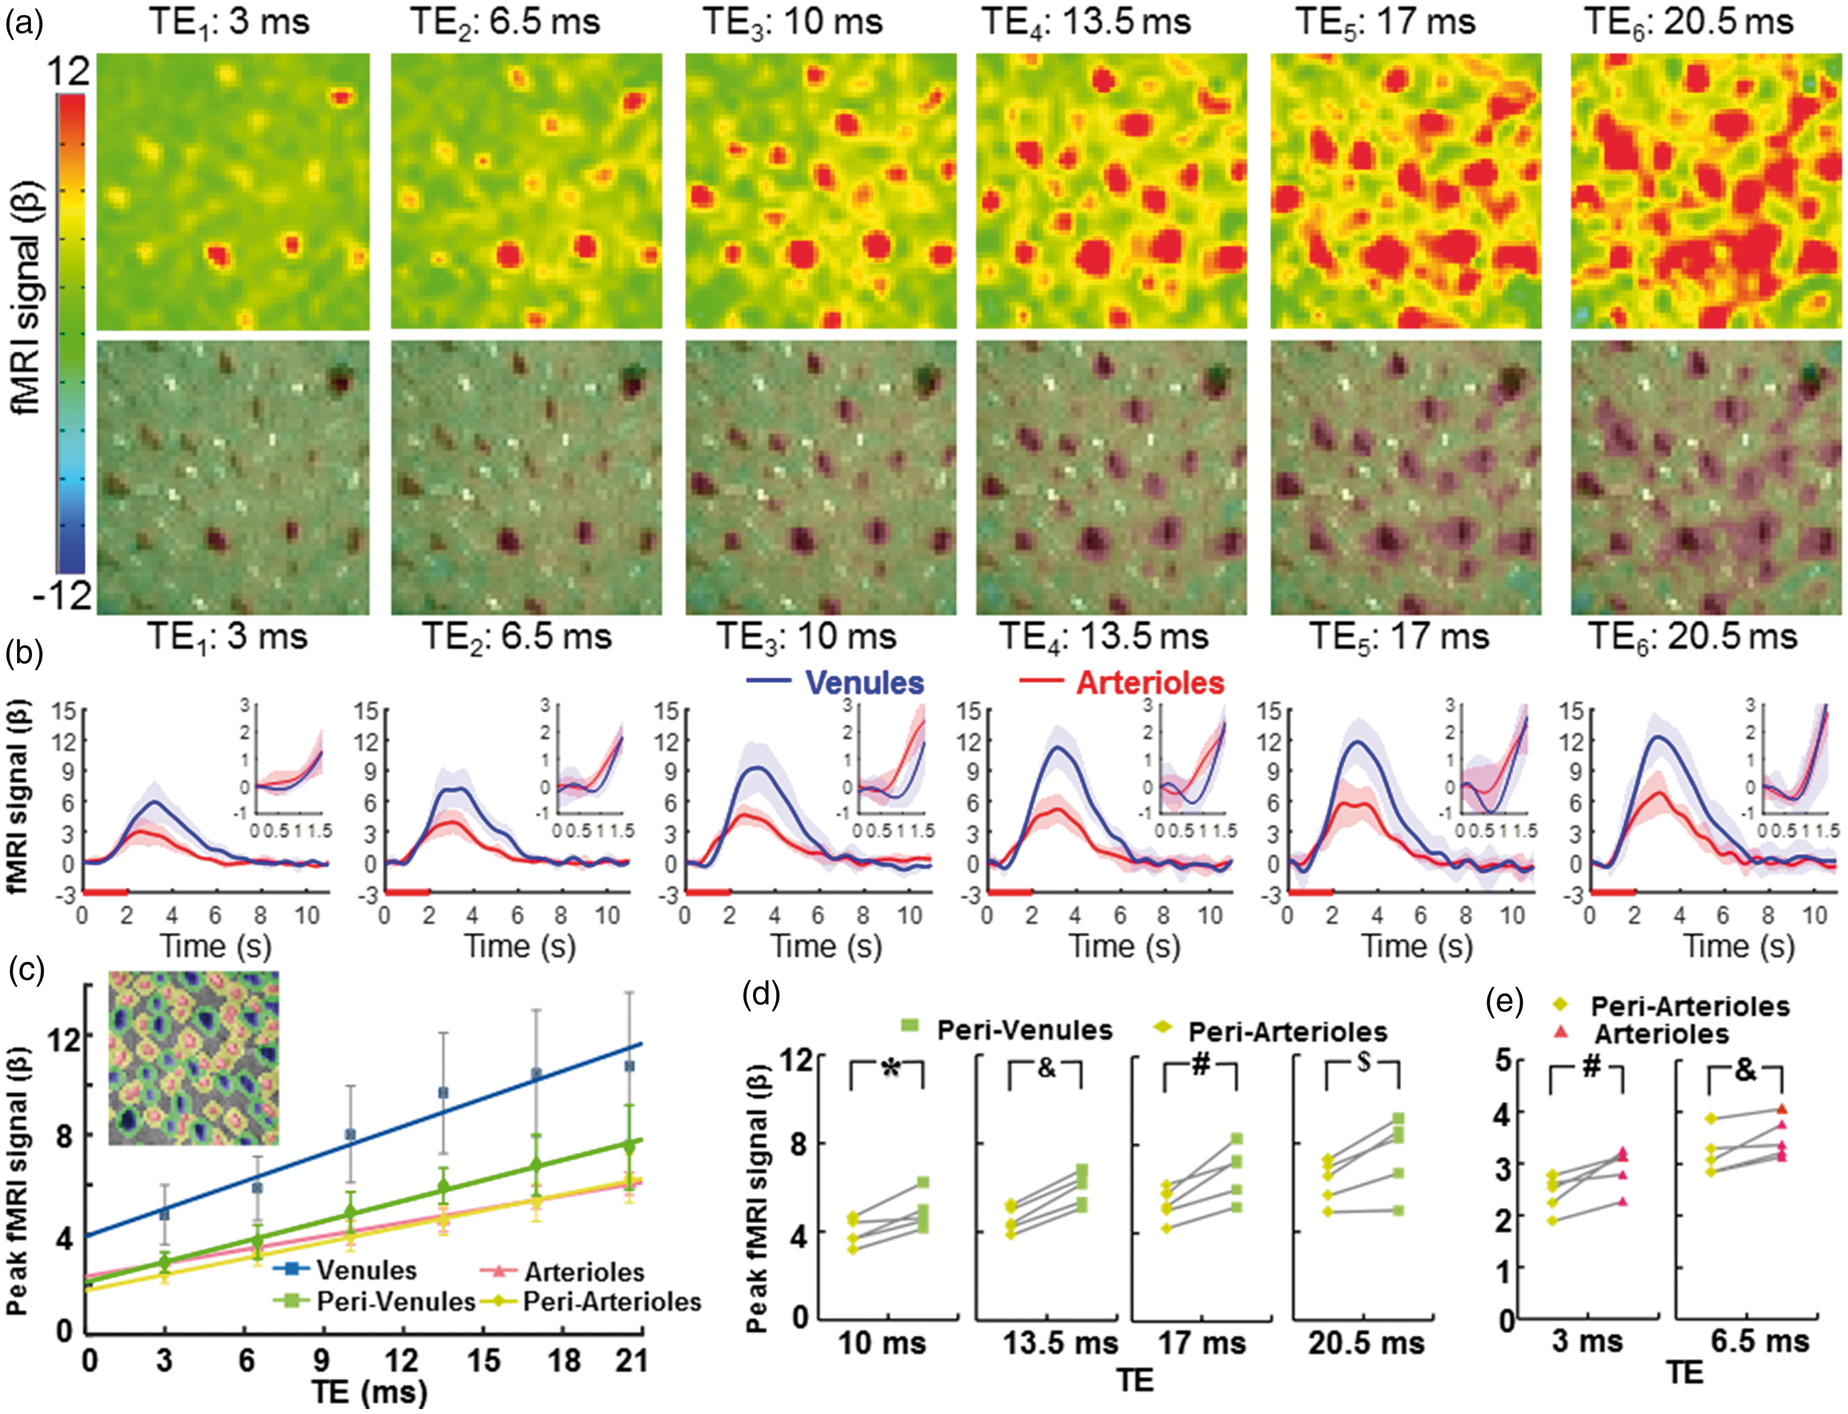
The vessel-specific fMRI patterns acquired at different TEs. (a) The color-coded fMRI maps were shown at six different TEs (top). The images overlapped with the A-V map represented the venule-dominated peak fMRI signal distribution patterns (bottom), (b) The averaged time courses of the fMRI signal from venule (blue) and arteriole (red) voxels (n = 5 rats, mean ± SD; inset: the time course from 0 s to 1.5 s after stimulus onset), (c) The peak amplitudes of the normalized fMRI signal from arteriole (red), venule (blue), peri-venule (green), and peri-arteriole (yellow) voxels were shown at different TEs (n = 5 rats, mean ± SD). The peak fMRI signal (β) was calculated by normalizing the baseline of the raw fMRI time course to 100. (inset: a demo A-V map with different vascular component ROIs in different colors), (d) The peak fMRI signal of peri-venule voxels was significantly higher than that of peri-arteriole voxels acquired at TEs ranging from 10 ms to 20.5 ms (n = 5, *p = 0.007, &p = 0.0001, #p = 0.005, $p = 0.012, paired t-test), (e) The peak fMRI signal of arteriole voxels was significantly higher than that of peri-arteriole voxels acquired at TEs 3 ms and 6.5 ms (#p = 0.012; &p = 0.017, paired t-test, n = 5).
Image processing and statistical analysis
MESV-fMRI data analysis was performed using the “Analysis of Functional NeuroImages” (AFNI) 69 software (NIH) and MATLAB. A detailed description of the processing was provided in a previous study. 23
MESV-fMRI preprocessing
The MESV-fMRI 2D k-space data were first reordered by a MATLAB script, and then reconstructed to MESV-fMRI images using a function embedded in the Bruker ParaVision 5.1 software. For AFNI analysis, a 2D registration function was applied to align all MESV-fMRI images to a template for multiple datasets acquired in the same orientation setup. To register the MESV-fMRI images with the single-vessel map, a tag-based registration method was applied. Ten to 12 tags were chosen from the venule voxels distributed around the 2D slices of the MESV-fMRI and single-vessel images. The baseline level of the MESV-fMRI images was scaled to 100, and multiple trials of block-design time courses were averaged for statistical analysis. The hemodynamic response function (HRF) was estimated by the linear regression using a tent basis function as previously reported. 34
T2* mapping
T2* values were calculated on a voxel-by-voxel basis by fitting the following exponential decay equation

Contrast-to-noise ratio
Contrast-to-noise ratio (CNR)
70
was estimated based on the following equation

Estimation of the temporal hemodynamic features of vessel-specific fMRI signal
A two-gamma-variate fitting process was used to fit the fMRI signal acquired from individual vessel voxels
71

Blood volume fraction (Vf)

where D is the diameter of the vessels, NROI is the mean number of voxels defining the venules and arterioles, and Svoxel is the area per voxel which is equal to 50 µm × 50 µm.
Estimated saturation (Y) and saturation changes (ΔY) of individual vessels 72


where R2 is the relaxation rate of vessels, and R2′ is a contribution to the signal relaxation rate from local field inhomogeneities. Here R2 was estimated by the R2 fitting of gray matter from Pohmann et al.'s
73
work which provided the following equation fitted by using different field strengths (4.0 T, 9.4 T, 11.7 T, and 16.4 T):
In equations (6)
72
and (7),
72
Vf is the blood volume fraction,
Substituting


According to equations (4) to (9), the saturation Y and saturation changes ΔY were calculated based on the measured R2* and estimated R2 from vessel voxels. A paired Student’s t-test was performed to compare the mean signal intensity, T0, TTP, and the FWHM of the T2* fMRI signal from the venule voxels and arteriole voxels. The error bar in each graph represents the standard deviation (SD) of the mean or 95% confidence interval (CI).
Results
Mapping the T2*-weighted fMRI signal from arterioles and venules with MESV-fMRI
Individual arterioles and venules penetrating the cortex could be directly mapped by an inflow-based MGE sequence, 34 which has been previously proposed for the human brain mapping to identify pial arteries and veins. 66 At shorter TEs, both arterioles and venules were detected as brighter voxels due to the inflow effect. In contrast, at longer TEs, only venules were detected as darker voxels due to the fast T2* decay of the deoxygenated venule blood, but arterioles were not differentiated because of the similar susceptibility of oxygenated blood to the surrounding parenchyma voxels. MGE images at different TEs were integrated into the A-V map, demonstrating arterioles as bright dots and venules as dark dots (Figure 1(a)). The size of the penetrating vessels detected by the A-V map ranged from 30 to 70 µm in the rat brain. 34 The vessel diameter was previously estimated based on the vessel distance of the A-V map in comparison to the mean distance of penetrating vessels in the 3D reconstruction of the vascular network characterized by 2-PM imaging.42,76,77
The same slice orientation was applied to both the MESV-fMRI images and the A-V map so that the vessel-specific fMRI signal could be identified from individual arteriole and venule voxels penetrating the deep layer cortex. The primary somatosensory (S1) cortex was covered in the A-V map (Figure 1(a)). The fMRI signal detected by the MESV-fMRI method was acquired from the multi-echoes in a reshuffled k-space acquisition scheme (Figure 1(b), Supplementary Figure 1). Figure 1(c) illustrates the T2* decay curves of arteriole and venule voxels as a function of TE, which were acquired every 100 ms based on an on/off block design paradigm. Figure 1(d) shows the three-dimensional plot of the mean signal intensity acquired at multiple echoes from venule voxels as a function of time, demonstrating the increased T2*-weighted signal at different TEs of the decay curves upon stimulation.
The detailed functional patterns were characterized at different TEs ranging from 3 ms to 20.5 ms using MESV-fMRI (Figure 2(a) and (b), Supplementary Movie 1; the normalized fMRI signal at different TEs from venule and arteriole voxels, Supplementary Figure 3). The peak fMRI signal acquired at different TEs was located primarily on venule voxels which is consistent with the previous studies.33,34 Even at short TEs, the peak fMRI signal matched well with the venules voxels detected in the A-V map, which could be caused by the oxy/deoxy-hemoglobin changes in the venule blood, i.e. the BOLD effect, since the venule blood has a very short T2.56,78 The venule-dominated BOLD fMRI responses were also demonstrated by comparing the peak amplitude of fMRI time courses from arteriole and venule voxels (Figure 2(c)). The other voxels, enriched with capillaries or small vessels not identified by the A-V map, showed a higher fMRI peak amplitude than arteriole voxels, but lower than venule voxels at different TEs (Supplementary Figure 4).
The MESV-fMRI multi-echo scheme enabled specification of the extravascular effect on the functional patterns with different T2* weighting, as well as the potential contribution from the T1-weighted signal due to cerebral blood flow changes from arterioles. To better characterize the fMRI signal from different vascular components, the parenchyma voxels surrounding arterioles, i.e. peri-arteriole voxels, and parenchyma voxels surrounding venules, i.e. peri-venule voxels, were defined based on a dilatory function to label the voxels surrounding each individual vessel voxels. The peak fMRI signal from peri-arteriole and peri-venule voxels was compared with that of the arteriole and venule voxels at different TEs, showing highly proportional BOLD signal changes as a function of TE (Figure 2(c)). Linear fitting detected positive intercepts of the fMRI signal at zero echo time, which can be primarily contributed to the inflow effects as previously reported. 79 Also noteworthy is that the non-linear relationship of BOLD signal and short echo times 79 can potentially deviate the flow-related TE-independent signal changes, in particular, the intercept values of the venule voxels given the very short T2* of deoxygenated blood.42,56,78
Quantitative analysis demonstrated that the peak fMRI signal from peri-venule voxels was significantly higher than that from peri-arteriole voxels at longer TEs ranging from 10 to 20 ms (Figure 2(d)). In addition, the TE-dependent peak fMRI signal from the other non-vessel voxels showed a similar amplitude to that of the peri-venule voxels (Supplementary Figure 5). These results indicate that the extravascular effect from venules can be directly measured from the peri-venule voxels and the other non-vessel voxels enriched with capillaries or small vessels using the MESV-fMRI method. In contrast, the peak fMRI signal from arterioles was significantly higher than that from the peri-arteriole voxels for shorter TEs (3 and 6.5 ms), but not for longer TEs (Figure 2(e)). This result indicates that the inflow effect due to activity-coupled cerebral blood flow and volume changes directly contributes to the fMRI signal acquired at short TEs. Besides the peak fMRI signal, the fMRI signal acquired from 1 s to 2 s following stimulus onset was compared for arteriole, venule, peri-arteriole and peri-venule voxels at the short TE (3 ms) (Supplementary Figure 6). The early fMRI signal (e.g. 1 s, 1.2 s after stimulus onset) from arteriole voxels was significantly higher than that from the other voxels. These results indicate that the blood flow and volume-dependent arteriole-specific fMRI signal could be detected by MESV-fMRI independently of the BOLD effect dominating the fMRI signal in venule voxels.
Distinguishing the T2*-based fMRI signal from arterioles and venules with MESV-fMRI
We also estimated the T2* values every 100 ms by fitting the T2* decay curves acquired from each voxel. Figure 3(a) demonstrates the T2* maps acquired at 2 s and 3 s after stimulus onset. The estimated T2* values of venules voxels were much lower than the arteriole and non-vessel parenchyma voxels due to the high susceptibility of the deoxygenated venule blood. Because of the similar susceptibility of arteriole blood with a high concentration of oxy-hemoglobin to that of non-vessel parenchyma voxels enriched with capillaries or small vessels, the arteriole and non-vessel parenchyma voxels showed similar T2* values. Figure 3(b) illustrates an example of fitting the T2* decay curves and the averaged time courses of T2* values of arteriole and venule voxels. The transverse relaxation rate change, ΔR2* (1/T2*), of individual venule voxels is 6.78 ± 1.02 s−1, while that of individual arteriole voxels is 2.60 ± 0.18 s−1 (mean ± 95% CI), which are comparable to the ΔR2* (4.15 ± 0.44 s − 1) value measured in the superficial cortical layers with the 15.2 T scanner. 80 Also, the ratio of ΔR2*/R2* of venule (0.102 ± 0.013, mean ± 95% CI) and arteriole (0.056 ± 0.004, mean ± 95% CI) voxels is similar to the previously reported value of ∼0.053 (calculated from ΔR2*/(1000/T2*) = 3.09/(1000/17.1 ms)) from the rat somatosensory cortex measured at 15.2 T. 80
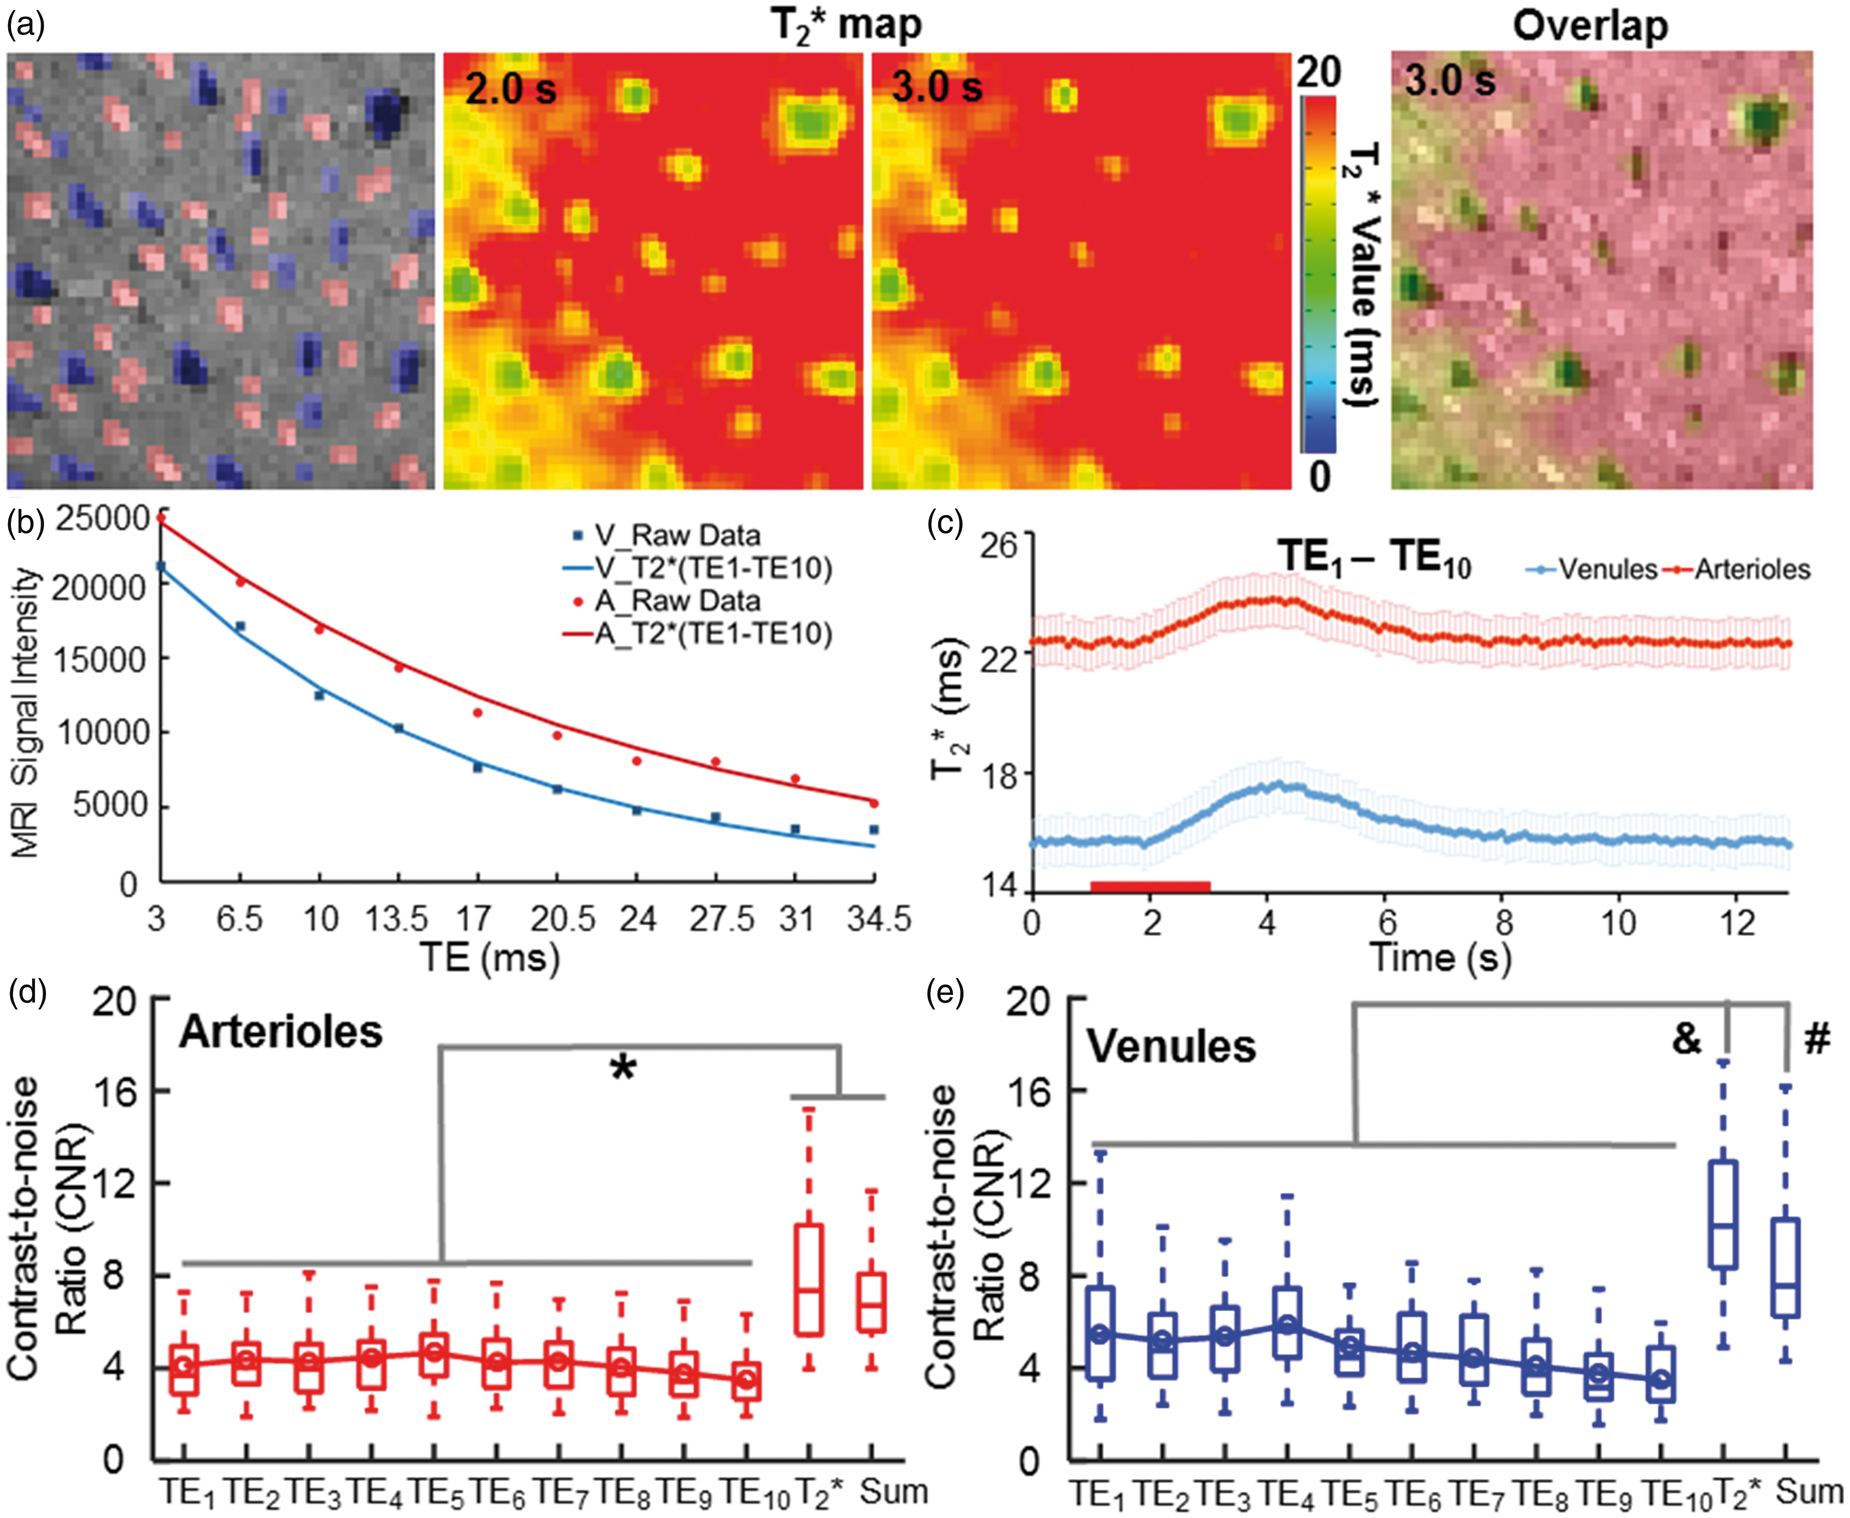
The vessel-specific T2* map with the MESV-fMRI method. (a) The individual arterioles (red) and venules (blue) voxels were identified in the A-V map. The T2* maps of the 2D slice acquired at 2 s and 3 s after stimulus onset (left and middle panels). The T2* map (3 s) overlapped with the A-V map showed all venule voxels with a shorter T2* time than the other voxels (right panel), (b) The T2* decay signal from a representative venule was fitted with decay curves with 10 TEs. (c) The T2* values were plotted as a function of time during the on/off block-design from venule and arteriole ROIs (n = 5 rats, mean (95% CI)), (d–e) The contrast-to-noise ratios (CNRs) of the T2*-weight fMRI signal acquired at different TEs were significantly lower than the CNR of the T2*-based fMRI signal from both arteriole and venule voxels. The T2*-based fMRI signal showed a similar or higher CNR than the CNR of the averaged T2*-weighted image of all TEs. (*F = 31.4, p < 0.00001, &F = 28.12, p < 0.00001, #F = 28.12, p < 0.01, one-way ANOVA followed by Tukey’s multiple comparison test).
Similar to previous multi-echo EPI studies,63,81,82 the CNR of the T2*-based fMRI signal changes was significantly higher than that of the T2*-weighted fMRI signal changes acquired at each echo for both arteriole and venule voxels (Figure 3(d) and (e)). In addition, the T2*-based fMRI signal showed a similar or higher CNR than that of the averaged T2*-weighted image acquired at all TEs (Figure 3(d) and (e)). The higher CNR of the T2*-based fMRI signal allows better characterization of the temporal hemodynamic features of individual vessels. Similar to the T2*-weighted functional maps acquired at different TEs (Figure 2), the peak T2*-based fMRI signal was primarily located at the penetrating venules (Figure 4(b), Supplementary Movie 2). The vessel-specific temporal features of the T2*-based fMRI signal could be characterized from individual arterioles and venules. Figure 4(c) shows the time courses of the T2*-based fMRI signal with fitting curves acquired from individual arteriole and venule voxels. The averaged time courses of the T2*-based fMRI signal showed an earlier onset from arteriole voxels than from venule voxels (Figure 4(d)). The T2* value of arteriole voxels detected at 0.8 s after stimulus onset was significantly higher than that of venule voxels, which was reversed at later time points, e.g. at 1.8 s after stimulus onset (Figure 4(e) and (f)). This is consistent with a previous study using the EPI-fMRI method to decipher the distinct vascular components contributing to the BOLD-fMRI signal. 22 The onset time (T0), time-to-peak (TTP) and full-width-of-half-maximum (FWHM) plots of the T2*-based fMRI signal readily separated arteriole and venule responses into distinct clusters (Figure 4(g)). The T0 and TTP of the arteriole voxels were significantly shorter than those of the venule voxels (Figure 4(h)), demonstrating the potential hemodynamic signal propagation through the cerebrovasculature directly mapped by MESV-fMRI, which has not been well detected by the T2*-weighted single-vessel fMRI method.33,34 Therefore, MESV-fMRI enables characterization of the temporal hemodynamic features of the fMRI signal detected from individual arteriole and venules.
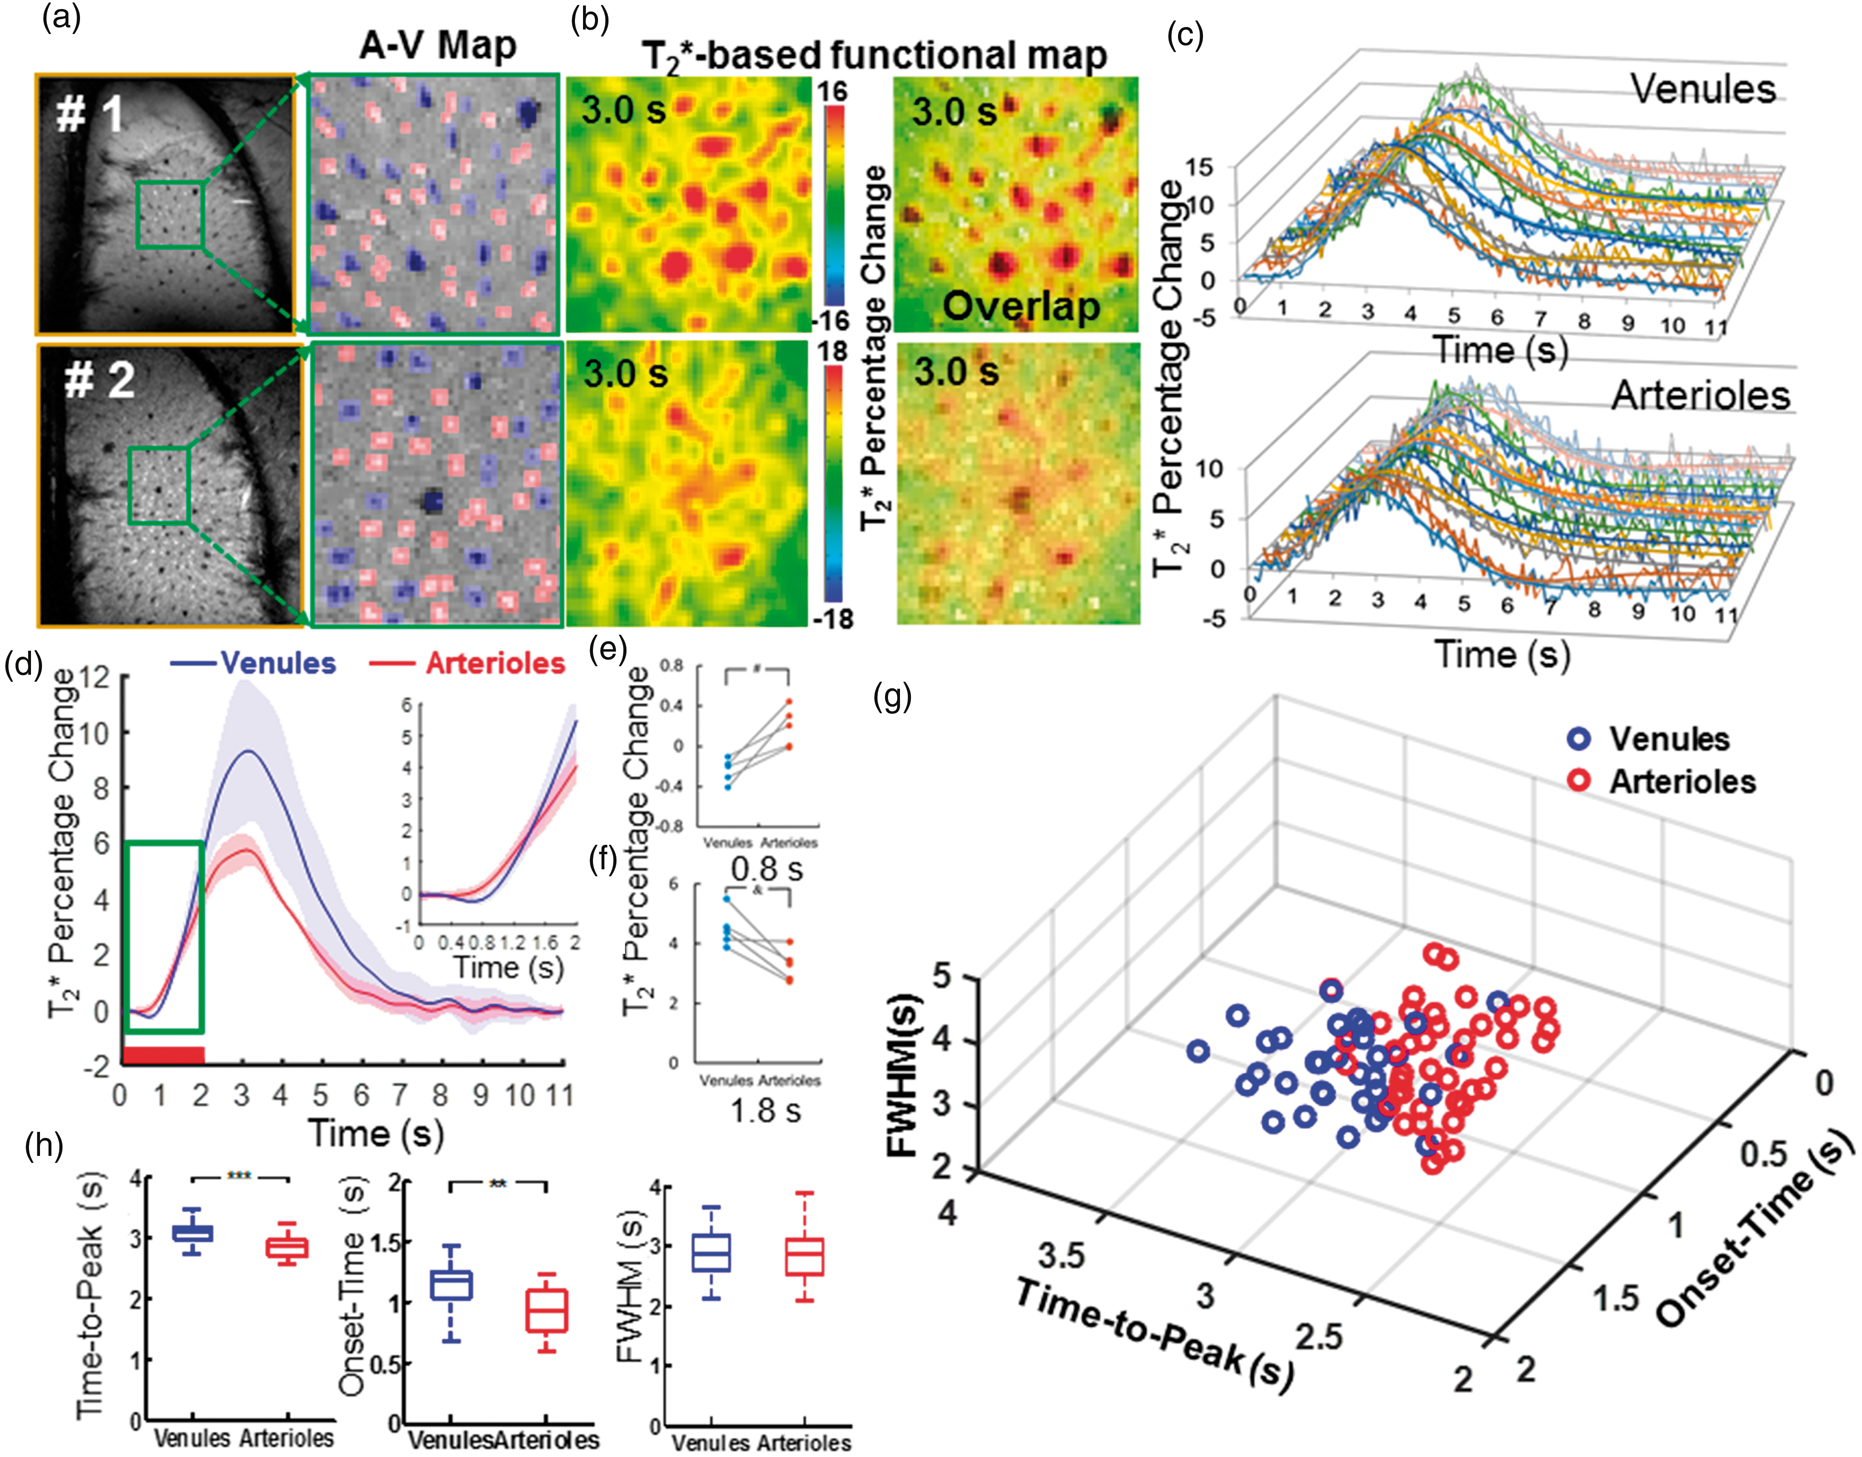
The hemodynamic feature of the T2*-based fMRI signal with the MESV-fMRI method. (a) The A-V maps from two representative rats of five rats showed arteriole (red) and venule (blue) ROIs, (b) The T2*-based fMRI maps were represented at 3.0 s after stimulus onset (the left panel), and the fMRI maps were overlapped with A-V maps, (c) The time courses (raw data and fitting curves) of the T2*-based fMRI signal were plotted from the individual venule voxels (upper panel) and arteriole voxels (lower panel) of one representative rat, (d) The averaged time courses of the T2* fMRI signal from venule (blue) and arteriole (red) voxels (n = 5 rats, mean ± SD; inset: the time course from 0 s to 2.0 s after stimulus onset), (e–f) T2* fMRI signal percentage changes from arteriole and venule voxels were shown at 0.8 s and 1.8 s after stimulation onset from individual rats (#p = 0.006; &p = 0.012, paired t-test, n = 5), (g) The 3D plot of onset-time (T0), time-to-peak (TTP), and the full-width-of-half-maximum (FWHM) of the T2* fMRI signal from individual arteriole (red circles, 43, r2 > 0.7) and venule (blue circles, 34, r2 > 0.8) voxels demonstrated two distinct clusters, (h) The quantitative analysis of the TTP, T0, and FWHM of the T2* fMRI signal from venule (blue) and arteriole (red) voxels (**p = 6.2 × 10⁻⁸, ***p = 8.1 × 10⁻⁹, unpaired t-test, arteriole voxels, 43, venule voxels, 34).
Estimating the baseline oxygen saturation level (Y) and its changes (ΔY) from individual vessels
The MESV-fMRI method allows estimation of the T2* signal from arterioles or venule voxels (though the flow and volume changes detected at the short TE may deviate the T2* fitting), providing the simplified “vessel voxel” condition for the analytical modeling of the NMR dephasing behavior in the brain tissue as proposed by Yablonskiy and Haacke. 72 Assuming the static dephasing regime, we provide a semi-quantitative estimation of the hemodynamic factor, oxygen saturation level (Y) from individual vessel voxels based on the measured R2* value (converted to R2ʹ based on the previously measured R2 using the same system 73 ) and blood volume fraction (Vf). Figure 5 shows the vessel-specific Y maps of individual venule and arteriole voxels, assuming that the vessel diameter is either 35 µm (Figure 5(b)) or 50 µm (Figure 5(c)). Supplementary Table 1 provided the mean Y of venules (0.39–0.65 up to 50 µm) and arterioles (0.74–0.94 from 35 µm to 70 µm). In parallel, we also calculated the oxygenation saturation changes (ΔY) during stimulation based on the T2*-based fMRI signal at given arteriole Vf changes (ΔDiameter: 5%, 10%, 15%) and no venule Vf changes (ΔDiameter = 0) based on previous studies.38,39,54 Based on the estimated baseline vessel diameter (35 µm vs. 50 µm), the vessel-specific ΔY maps of individual venule and arteriole voxels were presented at varied ΔVf values (Figure 5(e), (f), (h) and (i)), showing the venule ΔY at 6.4–11.1% and arteriole ΔY at 3.3–6.5% with ΔVf at 5% (Figure 5(g) and (j)). Supplementary Table 2 shows the mean ΔY of venules and arterioles with the diameter ranging from 35 µm to 70 µm, respectively. In particular, in contrast to the ΔY calculated at 10% or 15% arteriole ΔVf, the 5% arteriole ΔVf provides more practical estimates of arteriole ΔY, which is also consistent with the previous optical ΔY measurements of arterioles with a diameter of 50 µm by Vazquez et al. 54
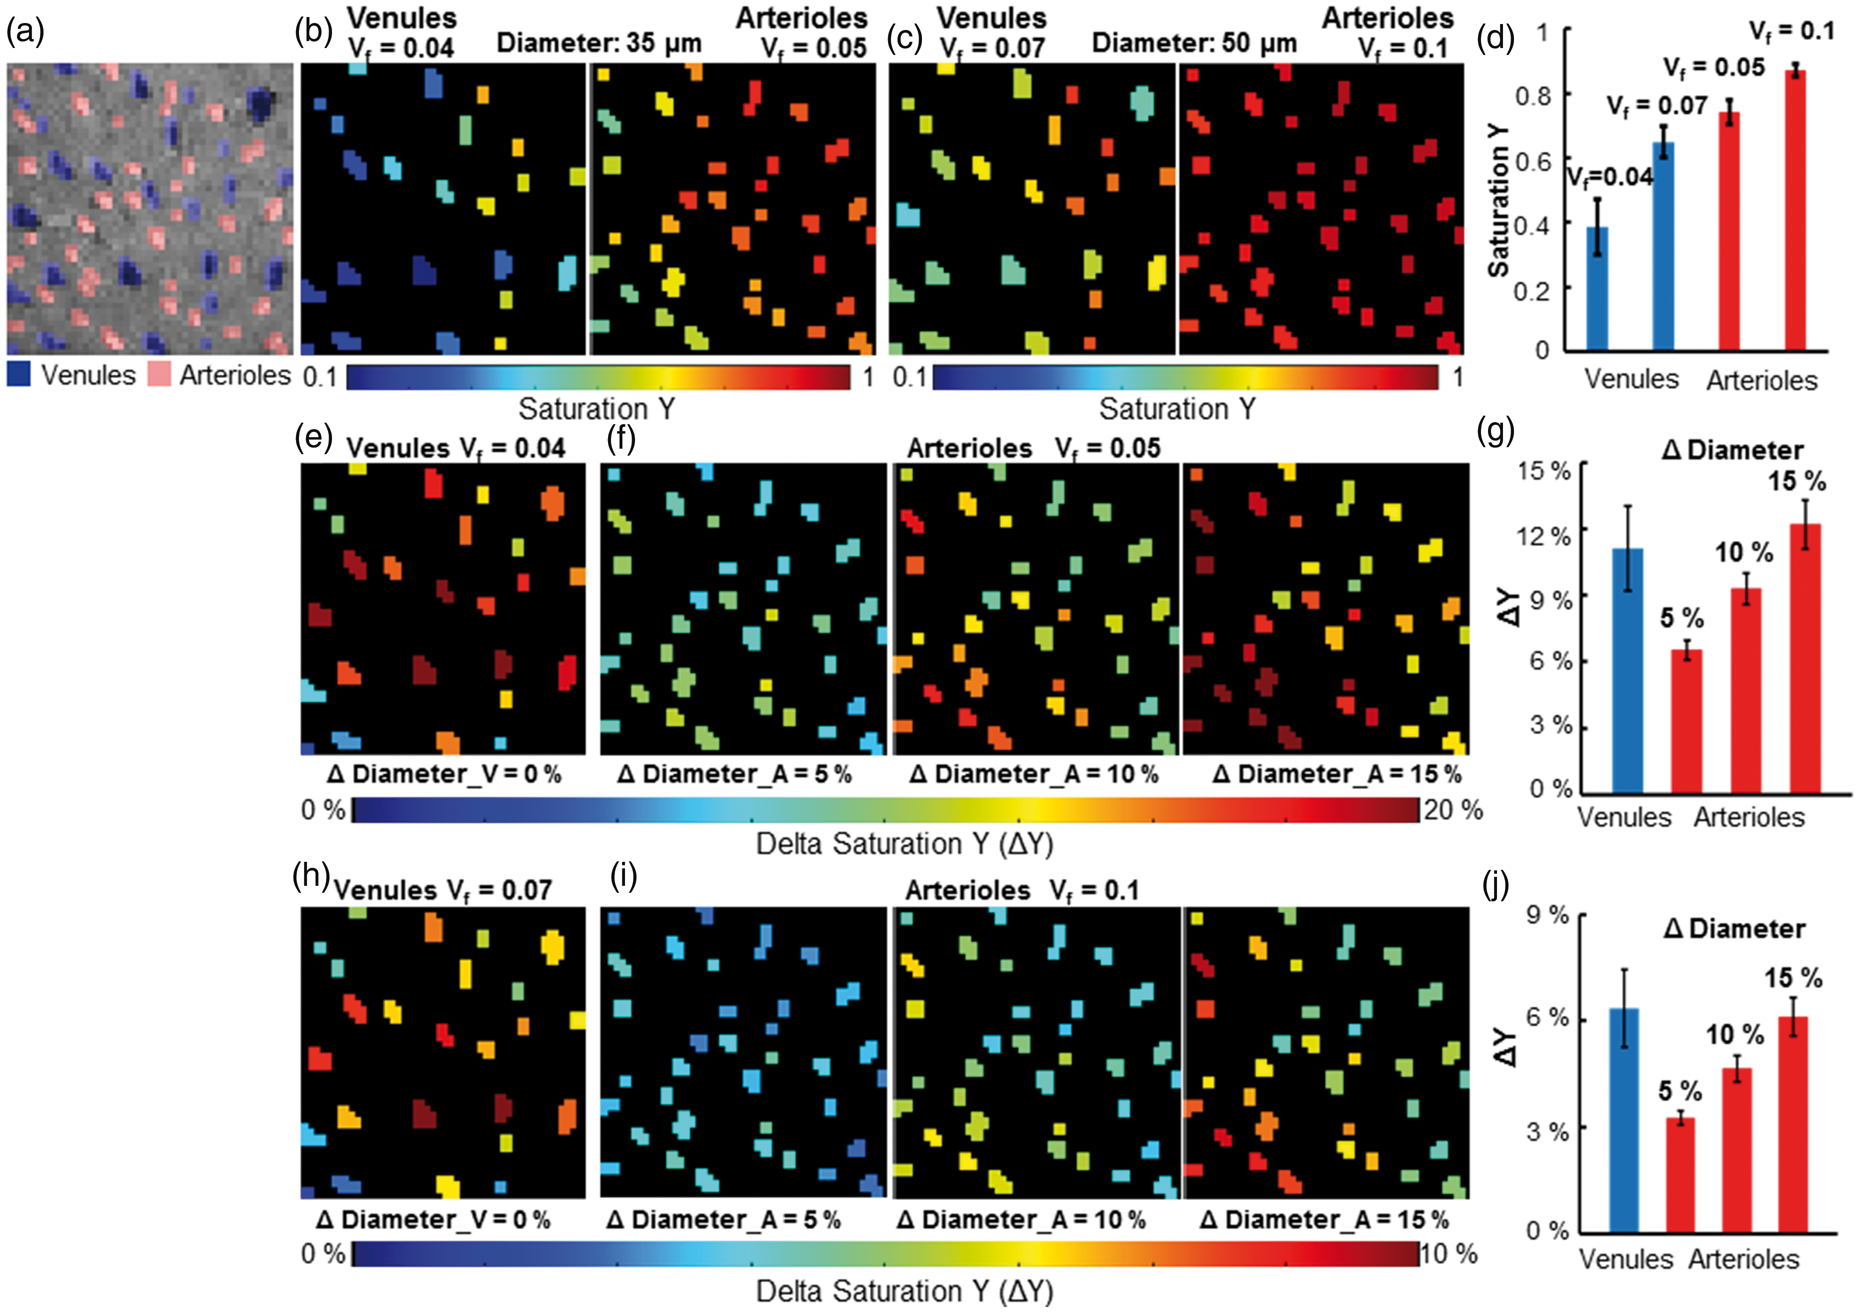
The estimated saturation Y maps and saturation Y changes (ΔY) maps of individual vessels. (a) The individual arterioles (red) and venules (blue) voxels were identified in the A-V map, (b) The saturation Y map of venules (the left panel, Vf = 0.04) and arterioles (the right panel, Vf = 0.05) when all venules and arterioles were assumed to have a diameter of 35 μm, (c) The saturation Y map of venules (the left panel, Vf = 0.07) and arterioles (the right panel, Vf = 0.1) when all venules and arterioles were assumed to have a diameter of 50 μm, (d) The mean Y saturation of venules and arterioles when the diameters of all vessels were assumed to be 35 μm (Y_V = 0.386 ± 0.086, Y_A = 0.741 ± 0.038, mean (95% CI)) or 50 μm (Y_V = 0.649 ± 0.049, Y_A = 0.871 ± 0.019, N_venules = 25, N_arterioles = 35, mean (95% CI)), (e) The saturation changes ΔY maps of individual venules when the diameter of venules was assumed to be 35 μm and not to increase after sensory stimulation, (f) The saturation changes ΔY maps of individual arterioles when the diameter of arterioles was assumed to be 35 μm and dilated by 5% (the left panel), 10% (the middle panel) and 15% (the right panel) after sensory stimulation, (g) The mean ΔY saturation of venules and arterioles when the diameter of vessels was assumed to be 35 μm (ΔY_V = 11.14 ± 1.91%, N_venules = 25; 5% diameter changes: ΔY_A5% = 6.53 ± 0.43%; 10% diameter changes: ΔY_A10% = 9.31 ± 0.71%; 15% diameter changes: ΔY_A15% = 12.22 ± 1.10%, N_arterioles = 35, mean (95% CI)), (h) The saturation changes ΔY maps of individual venules when the diameter of venules was assumed to be 50 μm and not to increase after sensory stimulation, (i) The saturation changes ΔY maps of individual arterioles when the diameter of arterioles was assumed to be 50 μm and dilate by 5% (the left panel), 10% (the middle panel) and 15% (the right panel) after sensory stimulation, (j) The mean saturation changes ΔY of venules and arterioles when the diameter of vessels was assumed to be 50 μm (ΔY_V = 6.36 ± 1.09%, N_venules = 25; 5% diameter changes: ΔY_A5% = 3.26 ± 0.20%; 10% diameter changes: ΔY_A10% = 4.65 ± 0.36%; 15% diameter changes: ΔY_A15% = 6.11 ± 0.54%, N_arterioles = 35, mean (95% CI)).
It is important to note that the blood volume fraction (Vf) was estimated based on the actual mean size of the arteriole and venule ROIs identified in the A-V map. Since the arteriole voxels were determined based on the T1-weighted inflow effect and the venule voxels were mapped based on the T2* extravascular effects, the inherent MR contrast difference led to much larger blood volume estimates for venules than arterioles. Thus, when we estimated the blood volume fraction (Vf), we needed to consider the variability issue of Vf estimates, in particular for venule voxels given the large T2*-weighted extravascular effects. When we assigned the different Vf values from venule voxels with varied sizes (top 20%: 50 µm, vs. the others: 35 µm), the baseline Y of 50 µm venules was 0.403 ± 0.098, which is slightly lower than that of the 35 µm venules (0.509 ± 0.088), and the ΔY of 50 µm venules was 11.4 ± 2.67%, which is higher than that of the 35 µm venules 8.71 ± 1.87% (mean (95% CI), Supplementary Figure 7, Supplementary Table 2). The MESV-fMRI method provides an fMRI-based vessel-specific oxygen saturation level (Y) dynamic mapping scheme for the deep layer cortical penetrating vessels.
Discussion
The MESV-fMRI method offers two unique features when mapping the fMRI signal from individual vessels in the brain. The first is the short acquisition window (1–2 ms), which significantly shortens the minimal TE and excludes additional T2* dephasing during echo acquisition. The other is the detection of the vessel-specific fMRI signal from multi-echoes with high spatiotemporal resolution. In this study, the fMRI signal was acquired at a sampling rate of 10 Hz over a field of view up to 9 × 6 mm of the rat cortex. Although only penetrating vessels (>30 µm) were identified by the A-V map,76,77 the vessel-specific fMRI signal could be directly mapped in the deep layer cortex up to 1–1.5 mm, which is beyond the penetration depth of conventional optical methodology. 34 MESV-fMRI further extended the single-vessel mapping scheme to acquire the fMRI signal at different TEs, showing different T1 or T2* weighting, as well as the T2*-based fMRI signal. Although the line-scanning scheme with elongated total imaging time made it less practical for human brain mapping, the vessel-specific fMRI signal acquired at the deep layer cortex provided high-resolution experimental MRI data to potentially complement the vessel-specific quantitative modeling of the fMRI signal.42,49,83–90
The MESV-fMRI method allows differentiation of the intravascular and extravascular weighting from vessel and surrounding tissue voxels at different TEs. Consistent with previous experimental and model prediction studies,42,91–93 the extravascular effect on venule voxels increased as a function of TE, which could be directly detected from peri-venule voxels (Figure 2(c)). Compared to the extravascular effect, the direct measurement of the intravascular effect was more challenging. The penetrating vessel size, characterized in the rat cortex by single-vessel fMRI or 2-PM imaging, ranges from 30 to 70 µm.34,77 Despite the high spatial resolution, the fMRI signal from designated single-vessel voxels contained a good portion of partial volume effects from surrounding non-vessel parenchyma. Thus, the peak fMRI signal detected from the venule voxels remained partially extravascular-driven. 22 However, for very short TEs, the intravascular effect from the venule blood could not be neglected even at the high magnetic field (14.1 T). Though the fMRI signal detected at short TEs might not be as specific as in the spin-echo scheme, which excludes the extravascular effect by the refocusing pulse,57,91,92,94 the intravascular effect contribution on the BOLD signal from venule voxels could be strong at the short TEs, in particular, at the 3 ms TE (Figure 2).
One novel application of MESV-fMRI is to detect fMRI signal changes from individual arterioles at different TEs. In contrast to the BOLD signal acquisition with EPI-fMRI, the direct CBV- and CBF-based signal was not detectable without a specific mapping sequence, e.g. arterial spin labeling95,96 or vascular space occupancy, 97 or injection with a contrast agent for CBV.5,98,99 The fMRI signal detected by MESV-fMRI at short TEs (e.g. 3 ms) is based on the T1-weighted signal from voxels covering parenchyma enriched with capillaries or small arterioles with oxygenated blood. The vessel-specific inflow signal led to a significantly higher fMRI signal from the arteriole voxels compared to the peri-arteriole voxels (Figure 2(e)). 100 This could be directly due to the increased cerebral blood flow, given the arteriole dilation upon stimulation. 96 Interestingly, at long TEs, we did not observe the CBV-induced decrease of the fMRI signal either from the arteriole or peri-arteriole voxels from the averaged time courses as suggested for fMRI predictive models. 93 Using the pO2-sensitive nanoprobe with 2-PM imaging, Gagnon et al. 42 detected oxygen levels of penetrating arterioles ranging from 70% to 95% at different vascular branches. As reported by Vazquez et al., 54 the arterial oxygen saturation levels from 50 µm arterioles can be increased upon sensory stimulation and directly contribute to the increased BOLD signal, which can potentially cancel out the CBV-induced reduction of the TE-dependent signal. It is also interesting to note that the hyperbaric oxygen treatment to increase the pO2 in the blood of the rat brain can potentially lead to T1 shortening,101,102 which may contribute to the fMRI signal changes at shorter TEs in arterioles. Also, at longer TEs, the extravascular BOLD effect from venules could influence the signal changes at arteriole and peri-arteriole ROIs due to partial volume effects.
Similar to previous multi-echo EPI studies,63,81,82 the T2*-based functional map showed a much higher CNR than the T2*-weighted functional maps acquired at each TE (Figure 3(d) and (e)). The temporal features of the vessel-specific hemodynamic signal can be better characterized to show an earlier onset time of the arteriole T2*-based fMRI signal (0.92 ± 0.19 s) than that of the venule T2*-based fMRI signal (1.14 ± 0.17 s). The T2*-based fMRI functional mapping represented a more significant vessel-specific onset time difference compared to previous single-vessel T2*-weighted fMRI studies, 34 which could be due to the higher CNR of the T2*-based fMRI signal. Also noteworthy is that the time-to-peak of the T2*-based fMRI signal from arterioles was significantly shorter than that from the venules. The T2*-based early arteriole fMRI signal onset and time-to-peak could result from the oxy/deoxy-hemoglobin ratio changes detected in arterioles,38,54,103 as well as from the blood flow and volume contribution at short TEs (Supplementary Figure 6). The onset time of the fMRI signal detected by MESV-fMRI is similar to previous studies, indicating that the BOLD signal increased as early as 1 s after stimulus onset in both the cat and human visual cortex.26,104 Meanwhile, Silva et al. used an M-sequence and showed faster BOLD-fMRI onset with a mean time-to-peak less than 2.5 s due to the short stimulation duration. 105 T2*-based MESV-fMRI could better differentiate the temporal features of the fMRI signal from arteriole and venule voxels than the T2*-weighted fMRI signal.22,34
MESV-fMRI-based T2* measurement from individual vessels penetrating the deep layer cortex demonstrates the possibility of directly modeling the hemodynamic signal contributing to the fMRI signal. We have performed the over-simplified estimation of the oxygenation saturation level (Y) and stimulation-induced changes (ΔY) from individual vessel voxels based on the assumed blood volume fraction (Vf) and its changes (ΔVf) during stimulation using the analytical model developed by Yablonskiy and Haacke. 72 As shown in the Supplementary Tables 1 and 2, although the estimated Y and ΔY showed similar dynamic ranges as previously reported in the anesthetized rat54,106 or mouse 107 brains, some large variations were detected when inappropriate Vf and ΔVf values were used. For example, the baseline Y of venules with Vf at 0.15 (the diameter at 70 µm, Supplementary Table 1) was above 0.8, which is even higher than some smaller arteriole voxels.
Several key issues will need to be considered to better interpret the vessel-specific Y and ΔY estimation for future hemodynamic model validation. First, we performed a semi-quantitative estimation of the oxygen saturation (Y) based on the model of Yablonskiy and Haacke 72 for a single vessel of a voxel. In contrast to the advanced quantitative BOLD (qBOLD) modeling,108–115 we oversimplified the resources of the magnetic inhomogeneity affecting the MR signal evolution for a given voxel. In particular, a more complicated model to incorporate the tissue and blood R2 contribution in combination with the macroscopic field inhomogeneity estimation108,116 will be implemented for oxygen saturation estimation in our future studies. Second, we will need to develop a spin-echo based MESV-fMRI method to quantify the vessel-specific T2 values, which can provide a more accurate T2ʹ estimation than what has been applied in this work based on the previous measurement in rats using the same scanner. 73 Thirdly, previous qBOLD modeling has estimated the blood volume fraction (Vf) by either examining the dephasing effects of the deoxy-Hb of the venous blood (venous Vf),109,117 or by applying the paramagnetic contrasts through the whole vessel network.118–120 The MR-based Vf measurements have been less accurate than the optical imaging studies.42,121 For MESV-fMRI, the estimation Y of the top 20% largest venules varied from 0.4 (the average diameter 50 µm, Vf = 0.05) to 0.69 (the average diameter 70 µm, Vf = 0.098) (Supplementary Figure 8). To improve the accuracy of the estimation of Vf of voxels for the major penetrating vessels, we will measure the vessel sizes with wide-field 2-PM imaging40,122,123 followed by single-vessel fMRI mapping. 33 We can apply the single-vessel CBV-weighted fMRI measurement33,34 to estimate the relative ΔVf values for individual vessels with neuronal activation or by hypercapnia as a physiological reference for calibrated fMRI measurements from the same animals. 49 MESV-fMRI can also be potentially implemented in animal studies for nanosensor-based pO2 measurement with 2-PM to validate the vessel-specific hemodynamic modeling to interpret the fMRI signal. 42 In addition, the model of Yablonskiy and Haacke 72 is based on the assumption of randomly oriented vessels. The significant impact of vessel orientations to gradient-echo fMRI has been reported by previous studies.42,121 For a given penetrating vessel, the susceptibility effect of the vessel on the field inhomogeneity depends on the specific angle to the B0 field. However, as shown in Figure 5, the estimated blood volume contribution to the vessel voxel ranges from 5 to 10%, which is only 2–2.5 times more than the averaged blood volume fraction (2–4%). There remains a large portion of the randomized microvascular contribution to the vessel voxels. For the future studies with the higher spatial resolution to increase the blood volume contribution from individual penetrating vessels to 25–50%, an orientation-specific delta R2* estimate should be assigned to different vessel voxels as suggested by previous studies.42,121
Finally, in contrast to EPI-fMRI with a conventional Cartesian or Spiral trajectory to cover the k-space, MESV-fMRI is less efficient and highly sensitive to motion artifacts. This is because the MESV-fMRI k-space was filled inconsecutively through the time series of the on/off block design. This line-scanning scheme leads to a great number of repetitions of the block-design-based fMRI signal acquisition. Therefore, real-time signal acquisition in MESV-fMRI differed from multi-echo EPI-fMRI, and hence MESV-fMRI may not be used for non-BOLD component correction in the resting-state fMRI study. 124 This implies that the MESV-fMRI method would be less practical for human brain mapping and awake animal fMRI. However, this method can be readily used for ventilated and head-fixed animals under anesthesia. Using compressed sensing125,126 and partial k-space imaging,127,128 the acquisition time can be shortened significantly to enable implementation of MESV-fMRI in human brain mapping. In addition, MESV-fMRI was less sensitive to field inhomogeneity and fluctuation. It is less dependent on gradient performance and has shorter readout times than EPI-fMRI. These features allow MESV-fMRI to acquire images with a much higher spatiotemporal resolution than EPI-fMRI to directly decipher distinct vascular contributions to the fMRI signal with different hemodynamic features. The unique advantage of this method is the characterization of the vessel-specific neurovascular signaling events in the normal and diseased states, e.g. stroke or vascular/neuronal dementia, of animal models.
Contact for resource sharing
Any underlying research material related to the paper can be accessed from the corresponding author upon reasonable request.
Supplemental Material
JCB886240 Supplemetal Material - Supplemental material for High spatiotemporal vessel-specific hemodynamic mapping with multi-echo single-vessel fMRI
Supplemental material, JCB886240 Supplemetal Material for High spatiotemporal vessel-specific hemodynamic mapping with multi-echo single-vessel fMRI by Yi He, Maosen Wang and Xin Yu in Journal of Cerebral Blood Flow & Metabolism
Footnotes
Funding
The author(s) disclosed receipt of the following financial support for the research, authorship, and/or publication of this article: This research was supported by funding from the NIH Brain Initiative funding (RF1NS113278-01), the S10 instrument grant (S10 RR023009-01) to MGH/HST Martinos center, DFG YU 215/3-1, and internal funding from the Max Planck Society. YH acknowledges support from the European Union’s Horizon 2020 research and innovation programme under the Marie Skłodowska-Curie Grant Agreement No. 843352, and the Lundbeck Foundation (R287-2018-479).
Acknowledgments
We would like to thank Dr. Pohmann R, Dr. Merkle H, and Buckenmaier K. for their technical support. We would like to thank Ms. Schulz H and Fischer S for their animal maintenance support. We would like to thank the AFNI team for their software support.
Declaration of conflicting interests
The author(s) declared no potential conflicts of interest with respect to the research, authorship, and/or publication of this article.
Authors’ contributions
XY designed the research. YH, XY, MW performed the animal experiments; YH, XY acquired and analyzed the data; XY, YH wrote the paper.
Supplementry material
Supplemental material for this article is available online.
References
Supplementary Material
Please find the following supplemental material available below.
For Open Access articles published under a Creative Commons License, all supplemental material carries the same license as the article it is associated with.
For non-Open Access articles published, all supplemental material carries a non-exclusive license, and permission requests for re-use of supplemental material or any part of supplemental material shall be sent directly to the copyright owner as specified in the copyright notice associated with the article.