
Abstract
Quantitative positron emission tomography (PET) brain studies often require that the input function be measured, typically via arterial cannulation. Image-derived input function (IDIF) is an elegant and attractive noninvasive alternative to arterial sampling. However, IDIF is also a very challenging technique associated with several problems that must be overcome before it can be successfully implemented in clinical practice. As a result, IDIF is rarely used as a tool to reduce invasiveness in patients. The aim of the present review was to identify the methodological problems that hinder widespread use of IDIF in PET brain studies. We conclude that IDIF can be successfully implemented only with a minority of PET tracers. Even in those cases, it only rarely translates into a less-invasive procedure for the patient. Finally, we discuss some possible alternative methods for obtaining less-invasive input function.
Introduction
Quantitative positron emission tomography (PET) brain studies often require that input function be measured. This is traditionally performed via the invasive procedure of arterial cannulation. Arterial cannulation is not that dangerous (Everett et al, 2009). For instance, > 3000 PET-related arterial cannulations have been performed at the National Institutes of Health; only two cases of minor local complications occurred, and both were readily resolved by the attending physician. Arterial cannulation is, however, a laborious procedure for the research personnel and often discourages patients and healthy volunteers from participating in clinical research.
Image-derived input function (IDIF) appears to be an elegant and attractive noninvasive alternative to arterial sampling that obviates the need for arterial cannulation, blood handling and analysis, and additional radiation exposure of the research personnel. Image-derived input function has been successfully validated using large blood pools, such as the heart (Choi et al, 1991), the aortic segments (van der Weerdt et al, 2001), and the femoral arteries (Ludemann et al, 2006). Given the large size of these vascular structures, partial volume effects can be easily corrected or even neglected (van der Weerdt et al, 2001). However, because in brain PET studies these large blood pools are not in the field of view, IDIF must rely on intracranial blood vessels. Carotid arteries, the most often used intracranial blood vessels, have an average diameter of about 5 mm (Krejza et al, 2006), and the spatial resolution of modern PET cameras is about 6 mm (Brix et al, 1997). This limited spatial resolution entails two highly linked partial volume effect artifacts: (1) a ‘spill-out’ effect (i.e., the activity contained within the carotid spreads over the surrounding tissue, so that the measured activity is lower than the actual activity) and (2) a ‘spill-in’ effect (i.e., the activity from surrounding tissues spills into the carotid, so that the measured activity is artificially increased). These two artifacts alter both the amplitude and the shape of the carotid signal. The former is responsible for an underestimation of the input function; the latter accounts for an artificial elevation of carotid activity and potentially changes the curve shape. To obtain a good estimate of the input function, both these effects should be corrected.
Using the carotid arteries as an example, computation of IDIF for brain PET studies requires three steps: (1) carotid identification, which can be achieved by using coregistered anatomic images or segmenting the carotids directly on the PET images; (2) the whole-blood time–activity curve estimation, which is achieved by correcting partial volume effects; and (3) the concentration of parent radioligand in plasma, separated from radiometabolites, must be estimated as a percentage of the previously determined concentration of total radioactivity in blood. This third step requires either a prior knowledge or
The aim of the present review was to identify the methodological challenges that hinder the widespread use of IDIF in PET brain studies. We conclude that IDIF can be successfully used only in selected situations. From the patient's perspective, it allows for less-invasive estimates of input function only for a minority of tracers. Finally, we discuss some other alternative methods for obtaining the input function in a less-invasive manner than serial blood sampling.
How Often is Image-derived Input Function Used in Positron Emission Tomography Brain Studies?
Over the last 15 years, a large number of studies aimed at validating IDIF methods using brain vessels have been published (Ahn et al, 2000; Asselin et al, 2004; Backes et al, 2009; Baudrexel et al, 2004; Bentourkia, 2005; Berradja et al, 2009; Bodvarsson et al, 2006; Carson et al, 2006; Chen et al, 1998, 2007, 1996; Croteau et al, 2010; Fadaili el et al, 2009; Fung et al, 2009; Guo et al, 2007; Kim et al, 2001; Liptrot et al, 2004; Litton, 1997; Maroy et al, 2011; Mourik et al, 2008a, Mourik et al, 2008b, 2009; Naganawa et al, 2005a,
b
; Nishizawa et al, 1998; Parker and Feng, 2005; Sanabria-Bohorquez et al, 2003; Sayre and Seo, 2009; Su et al, 2005; Trebossen et al, 1999; Verhaeghe et al, 2010; Wahl et al, 1999; Wang et al, 2009; Zanotti-Fregonara et al, 2007). These methods incorporated a variety of imaginative, and often clever, approaches. Nevertheless, these investigations did not prompt widespread adoption of IDIF and, indeed, the number of clinical research protocols using IDIF as a tool to reduce invasiveness in patients is very limited. Chen
In addition, several other examples of clinical research protocols using IDIF exist (Beer et al, 2007; Wang et al, 2010). In these studies, IDIF was simply the raw carotid time-activity curve obtained by placing ROIs (regions-of-interest) over the carotid arteries, without any correction for partial volume effect artifacts. Comparing to the total distribution volume (
Thus, despite a huge number of published studies exploring different IDIF methods and the obvious interest in avoiding arterial blood sampling, IDIF was actually used as a tool to reduce invasiveness only in very few PET procedures.
How Should Carotids be Segmented?
With the exception of algorithms that work without any prior anatomical assumption, such as blind source separation algorithms when they are used to derive directly the input function through the source signal mixing process (Bodvarsson et al, 2006; Naganawa et al, 2005a), the initial step in calculating IDIF is carotid segmentation, which is required for obtaining raw blood time-activity curves. Carotid segmentation has been performed by both taking advantage of coregistered magnetic resonance images (MRI) (Fung et al, 2009; Litton, 1997; Trebossen et al, 1999), and by placing carotid ROIs directly on PET images (Chen et al, 1998; Liptrot et al, 2004; Mourik et al, 2008a; Su et al, 2005).
In theory, MRI segmentation should be the reference method since it would allow a better identification of the overall carotid diameter over the entire length of the vessel. However, in practice, reliable MRI-based PET carotid segmentation is very difficult to achieve. Existing coregistration algorithms are based on brain structures above the location of the carotids. Therefore, an overall good brain coregistration can still potentially lead to inaccurate coregistrations of the carotid arteries (Fung et al, 2009). Moreover, the carotid is a small, elongated, and elastic object, which can be stretched, bent, and twisted depending on the position of the head relative to the rest of the body. As a result, a difference in head positioning between PET and MRI could engender alignment errors that cannot be corrected by simple rigid-body coregistration. Mourik et al (2008a) showed that use of MRI images coregistered to [11C]-flumazenil images often resulted in erroneous definition of the carotid arteries, which in turn led to IDIF estimation errors. Fung et al (2009) studied an MRI-based approach to segment carotids for PET and found that it was often necessary to independently coregister the left and right carotids using complex coregistration algorithms, given that the degree of carotid mismatch between the PET and MRI images within the same subject could be more pronounced for one carotid than for the contralateral one. The introduction of hybrid PET/MRI devices may eliminate this problem. Nevertheless, for the time being, carotid segmentation performed directly on PET images seems to be a better option, because it obviates the need to acquire an MRI and is not affected by coregistration errors described above. It is certainly true that segmentation on PET images may prove difficult due to the low signal-to-noise ratio in short-duration PET images (Fung et al, 2009). However, in our experience, carotid arteries are almost always easily recognizable on the early summed frames of a dynamic PET scan after a bolus injection of the tracer. Moreover, it can also be argued that if a tracer gives a carotid signal that is too weak and noisy to be clearly distinguishable by the human eye, such a signal would hardly be amenable to reliable quantification.
Positron emission tomography carotid artery segmentation techniques, some of which are based on the selection of a limited number of hot voxels inside the carotid (Croteau et al, 2010; Mourik et al, 2008a), can be either manual (Chen et al, 1998), or automatic working directly on dynamic PET data. Examples of these automatic algorithms are
Although segmentation of PET images avoids problems associated with the multimodality coregistration, estimating carotid anatomical parameters such as its volume would be less accurate. An accurate estimate of carotid volume is necessary if partial volume effect correction is to be performed by applying recovery coefficients calculated from the anatomy of the vessel. Below, we argue that precise estimates of the geometry and diameter of the carotids should not be an essential requirement for calculating IDIF. In fact, estimates conducted using recovery coefficients are prone to errors and scaling with one or more blood samples should be preferred.
Can Blood Sampling Really be Avoided?
An ideal IDIF method would completely eliminate the need for blood sampling. Although some methods do require at least one blood sample to scale the image input (Berradja et al, 2009; Chen et al, 1998; Guo et al, 2007; Naganawa et al, 2005a; Sanabria-Bohorquez et al, 2003), most recently published methods are completely blood free (Backes et al, 2009; Carson et al, 2006; Croteau et al, 2010; Mourik et al, 2008a).
One of the most commonly used and simplest approaches for noninvasive scaling is the use of empirically determined recovery coefficients, which are calculated when the volume of the vessel and the scanner characteristics are known (Carson et al, 2006; Croteau et al, 2010; Litton, 1997). Despite being simple to implement, this approach may not be very robust for the following reasons: (1) given the very small size of the carotids, even small inaccuracies in estimating carotid volume would create significant errors in estimating the recovery coefficient; (2) recovery coefficients are usually obtained from spherical or cylindrical phantoms (hence the carotid volume estimation being simplified to its diameter), which may not simulate the shape of the carotids very well; and (3) the uncorrected carotid time-activity curve is never a scaled-down curve with the same shape of the measured arterial input function. Lopresti et al (2005) compared [11C]-PIB carotid time-activity curves that were not corrected for partial volume effect to the measured arterial input function, and found that the two sets of curves had a very different shape. At the beginning of the scan (< 5 minutes), the carotid input function underestimated the arterial input function by as much as a factor of four, while at later times (> 5 minutes), mainly because of spill-in, the two curves tended to converge and the ratio was at about 2. These findings are consistent with our own experience.
Croteau et al (2010) derived recovery coefficients by measuring carotid diameter on the computed tomography scan of each subject. Although the results of kinetic modeling performed with the corrected IDIF were good, the method appeared to be very sensitive to errors of carotid diameter estimation. Underestimating the diameter of the carotid artery by just 1 mm would entail an error in the cerebral metabolic rate of [18F]-FDG of about 17%. Even larger errors were found when this method was applied to femoral arteries using [11C]-acetate; an under/overestimation of the artery size of 1 mm induced an under/overestimation of about 66% in the perfusion index (Croteau et al, 2010).
In the study by Carson et al (2006), individual recovery coefficients were obtained from MR images of carotids and then used to correct high-resolution research tomograph (HRRT) [15O]-H2O PET scans. Compared with the reference arterial input function, IDIF had a substantially higher peak (+ 29%). Furthermore, errors of 15% to 19% were found in the flow images obtained using autoradiographic quantification method with IDIF compared with the values with arterial sampling.
Using a camera with a larger axial field of view will have the carotid arteries positioned further away from the edge of the field-of-view and may allow imaging the carotids further down the neck, where the carotid diameter is larger and hence the quantification more reliable.
This inaccuracy due to the use of recovery coefficients can be reduced, but not eliminated, by using intracranial venous sinuses, which have a larger volume than carotid arteries (Asselin et al, 2004; Nishizawa et al, 1998; Schiepers et al, 2007b; Wahl et al, 1999). Schiepers et al (2007b) used a fixed recovery coefficient to scale factor analysis based input functions from transverse sinuses. However, the accuracy of this scaling was not tested against the gold standard of arterial input function. Nishizawa et al (1998) tried to obtain an IDIF from the confluence of venous sinuses for α-[11C]-methyltryptophan PET scans but could not find a fixed recovery and spillover coefficient; individual sinus curves thus had to be normalized using venous samples. A study by Asselin et al (2004) nicely describes the challenges and possible sources of error associated with noninvasive recovery of radioactivity concentration from the sagittal venous sinuses. The investigators noted that an accurate estimate of radioactivity concentration could be obtained only in a phantom composed of radioactive cylinders if the point spread function was accurately determined at the location of the cylinders, after careful selection of the smoothing filters. When the method was tested in humans, the results were less reliable (Asselin et al, 2004).
Moreover, the venous sinus provides the concentration of tracer in the vein, whereas we seek its concentration in the artery as the input function.
Some methods select a limited number of hot voxels (such as the voxel with maximal intensity) from inside the carotid, which are assumed to be free of partial volume effects (Mourik et al, 2008a; Parker and Feng, 2005; Su et al, 2005). These methods are attractive because they are very easy to implement, and because they do not rely on precise estimates of vessel diameter to calculate a recovery coefficient. However, it should be noted that these methods are validated
In summary, the extant evidence suggests that, given the small size of intracranial blood vessels, a robust partial volume effects correction is very difficult to achieve using only image processing approaches, even with high-resolution images (Zanotti-Fregonara et al, 2011a). In our opinion, scaling with blood samples is the most reliable option. Moreover, because uncorrected curves do not have the same shape as the measured arterial input function, it is also likely that more accurate results would be obtained by scaling with more than one blood sample together with the correction of the spill-in contamination from the surrounding tissue (Chen et al, 1998).
Three comparative studies, where different IDIF methods were directly compared on the same scans, suggest that IDIF methods that rely on blood samples provide a more accurate estimate of input function than blood-free methods (Chen et al, 2007; Zanotti-Fregonara et al, 2009a, 2011a). As explained in the following section, blood samples (and probably more than one) are also necessary for obtaining the concentration of unchanged parent in plasma.
The Issue of Metabolite and/or Plasma Versus Whole-blood Correction
With some notable exceptions such as [18F]-FDG, almost all tracers used in brain imaging produce variable amounts of radiometabolites. One important limitation of IDIF is that it cannot distinguish the parent compound from its radioactive metabolites and the plasma radioactivity to that of whole blood. Some IDIF methods for neuroreceptor tracers described in the literature estimated only the whole-blood curve from images, and the percentage of unchanged parent was obtained at each time point by correcting the image input using HPLC (high-performance liquid chromatography) analysis from arterial blood sampling (Mourik et al, 2008a, 2009), thus diminishing the practical utility of the method. In some other studies, the problem of individual metabolite correction was not taken into account (Litton, 1997; Naganawa et al, 2005b). Naganawa et al (2005b) calculated [11C]-MPDX whole-blood time-activity curve using independent component analysis and suggested that these curves could be used for absolute
Individual metabolite correction can occasionally be successfully integrated in the IDIF procedure, but some blood samples are necessary; thus, the only advantage of IDIF over arterial input function would be a reduced number of arterial blood samples. Using [11C]-flumazenil scans, Sanabria-Bohorquez et al (2003) showed that an IDIF calculated from carotid arteries could be used to reduce the number of necessary blood samples to five or six. These blood samples were used both to estimate the parent fraction in plasma and to scale the IDIF. A previous study with [11C](
One practical way to estimate the radiometabolites concentrations without arterial sampling would be to use some late venous blood samples, when the metabolite concentration is maximal and arteriovenous equilibrium has been reached. This approach must, however, be validated for each tracer, but it is not always feasible. For instance, even when the whole-blood concentration of [11C](
To completely avoid blood sampling, an average metabolite curve may be used. This type of metabolite correction is not always possible and must be validated for each tracer. An average metabolite curve may work well for some tracers, such as [11C]-raclopride (Lammertsma et al, 1996), 2[18F]F-A-85380 (Mitkovski et al, 2005), or [18F]-FLT (Backes et al, 2009). Occasional outliers should nevertheless be expected when using an average metabolite correction and its applicability in research protocols must be carefully evaluated. For [18F]-FLT, the difference in parent concentration between the population mean and the range values is often about 15% to 20% toward the end of the scan (Shields et al, 2005; Visvikis et al, 2004). Moreover, the average value obtained from a given population may not be transferable to a different population. For instance, [18F]-FLT is metabolized in the liver via glucuronidation (Visvikis et al, 2004), and any disease or therapeutic agent that affects hepatic function is likely to affect the input function to the brain by changing the amount of radiometabolites. Finally, the amount of metabolites may also differ among healthy subjects due to physiologic characteristics (e.g., gender) (Beierle et al, 1999; Henriksen et al, 2006).
The published literature and our personal experience suggest that an average metabolite curve cannot be used for most tracers. With the aim of avoiding individual metabolite correction, Ishiwata et al (1998) analyzed [11C]-flumazenil radiometabolites in 24 subjects. They found that when the mean fraction of unchanged [11C]-flumazenil at each time point was used instead of individually measured metabolite data for the arterial input function, an error of as much as 30% occurred in the [11C]-flumazenil
In addition to metabolites, the implicit assumption when using IDIF is that the difference between the plasma tracer concentration and the one in whole blood is negligible. This assumption may be true for [18F]-FDG (Gambhir et al, 1989) or [18F]-FLT (Visvikis et al, 2004), but not for many other tracers. For instance, blood cells have binding sites for some tracers such as those for the translocator protein (Kreisl et al, 2010) and for serotonin transporters (Ichise et al, 2003). Specific binding to cells can cause uneven distribution between cells and plasma, and some blood samples are therefore necessary to determine plasma concentration. Even in the case of [18F]-FDG, some blood samples must be taken to measure blood glucose levels, which are required for quantifying the cerebral metabolic rate of glucose (Wienhard, 2002).
Why Does a Method Work for One Tracer but not Another?
Methods that are validated and work well with a given tracer may not perform equally well when applied to a different one (Mourik et al, 2009; Zanotti-Fregonara et al, 2011a). For instance, using the IDIF method validated by Chen et al (1998) for [18F]-FDG, our laboratory obtained excellent results with [11C](R)-rolipram scans (Zanotti-Fregonara et al, 2011b), but equally accurate results could not be obtained with any other tracer of our database. Indeed, IDIF methods seem to be very tracer specific. At least two factors have a major role in the accuracy of IDIF: tracer kinetics, which affects the accuracy of the image-derived whole-blood estimate, and the amount of radiometabolites, which affect the final results of kinetic modeling.
In our experience, a good estimate of the whole-blood curve cannot be obtained for most tracers. Depending on their kinetics after a bolus injection, tracers may show a strong or weak carotid signal as well as uptake in the surrounding tissues (Figures 1A–1D). The whole-blood curve can be estimated well only if the tracer gives an adequate carotid to background ratio, and this is not the case for many tracers—including [18F]-FMPEP-d2, [11C]-MePPEP, [11C]-DASB, and [18F]-SP203—where a high early uptake in the surrounding tissues blurs the carotid signal. Even for those tracers where good estimates of the whole-blood curve can be achieved, the accuracy of kinetic modeling results may be influenced by the amount of radiometabolites. The importance of radiometabolites is underscored by this example of two radioligands: [11C](R)-rolipram, a tracer for brain phosphodiesterase 4, and [11C]-PBR28, a tracer for the translocator protein. These tracers have a very different metabolite profile: [11C](
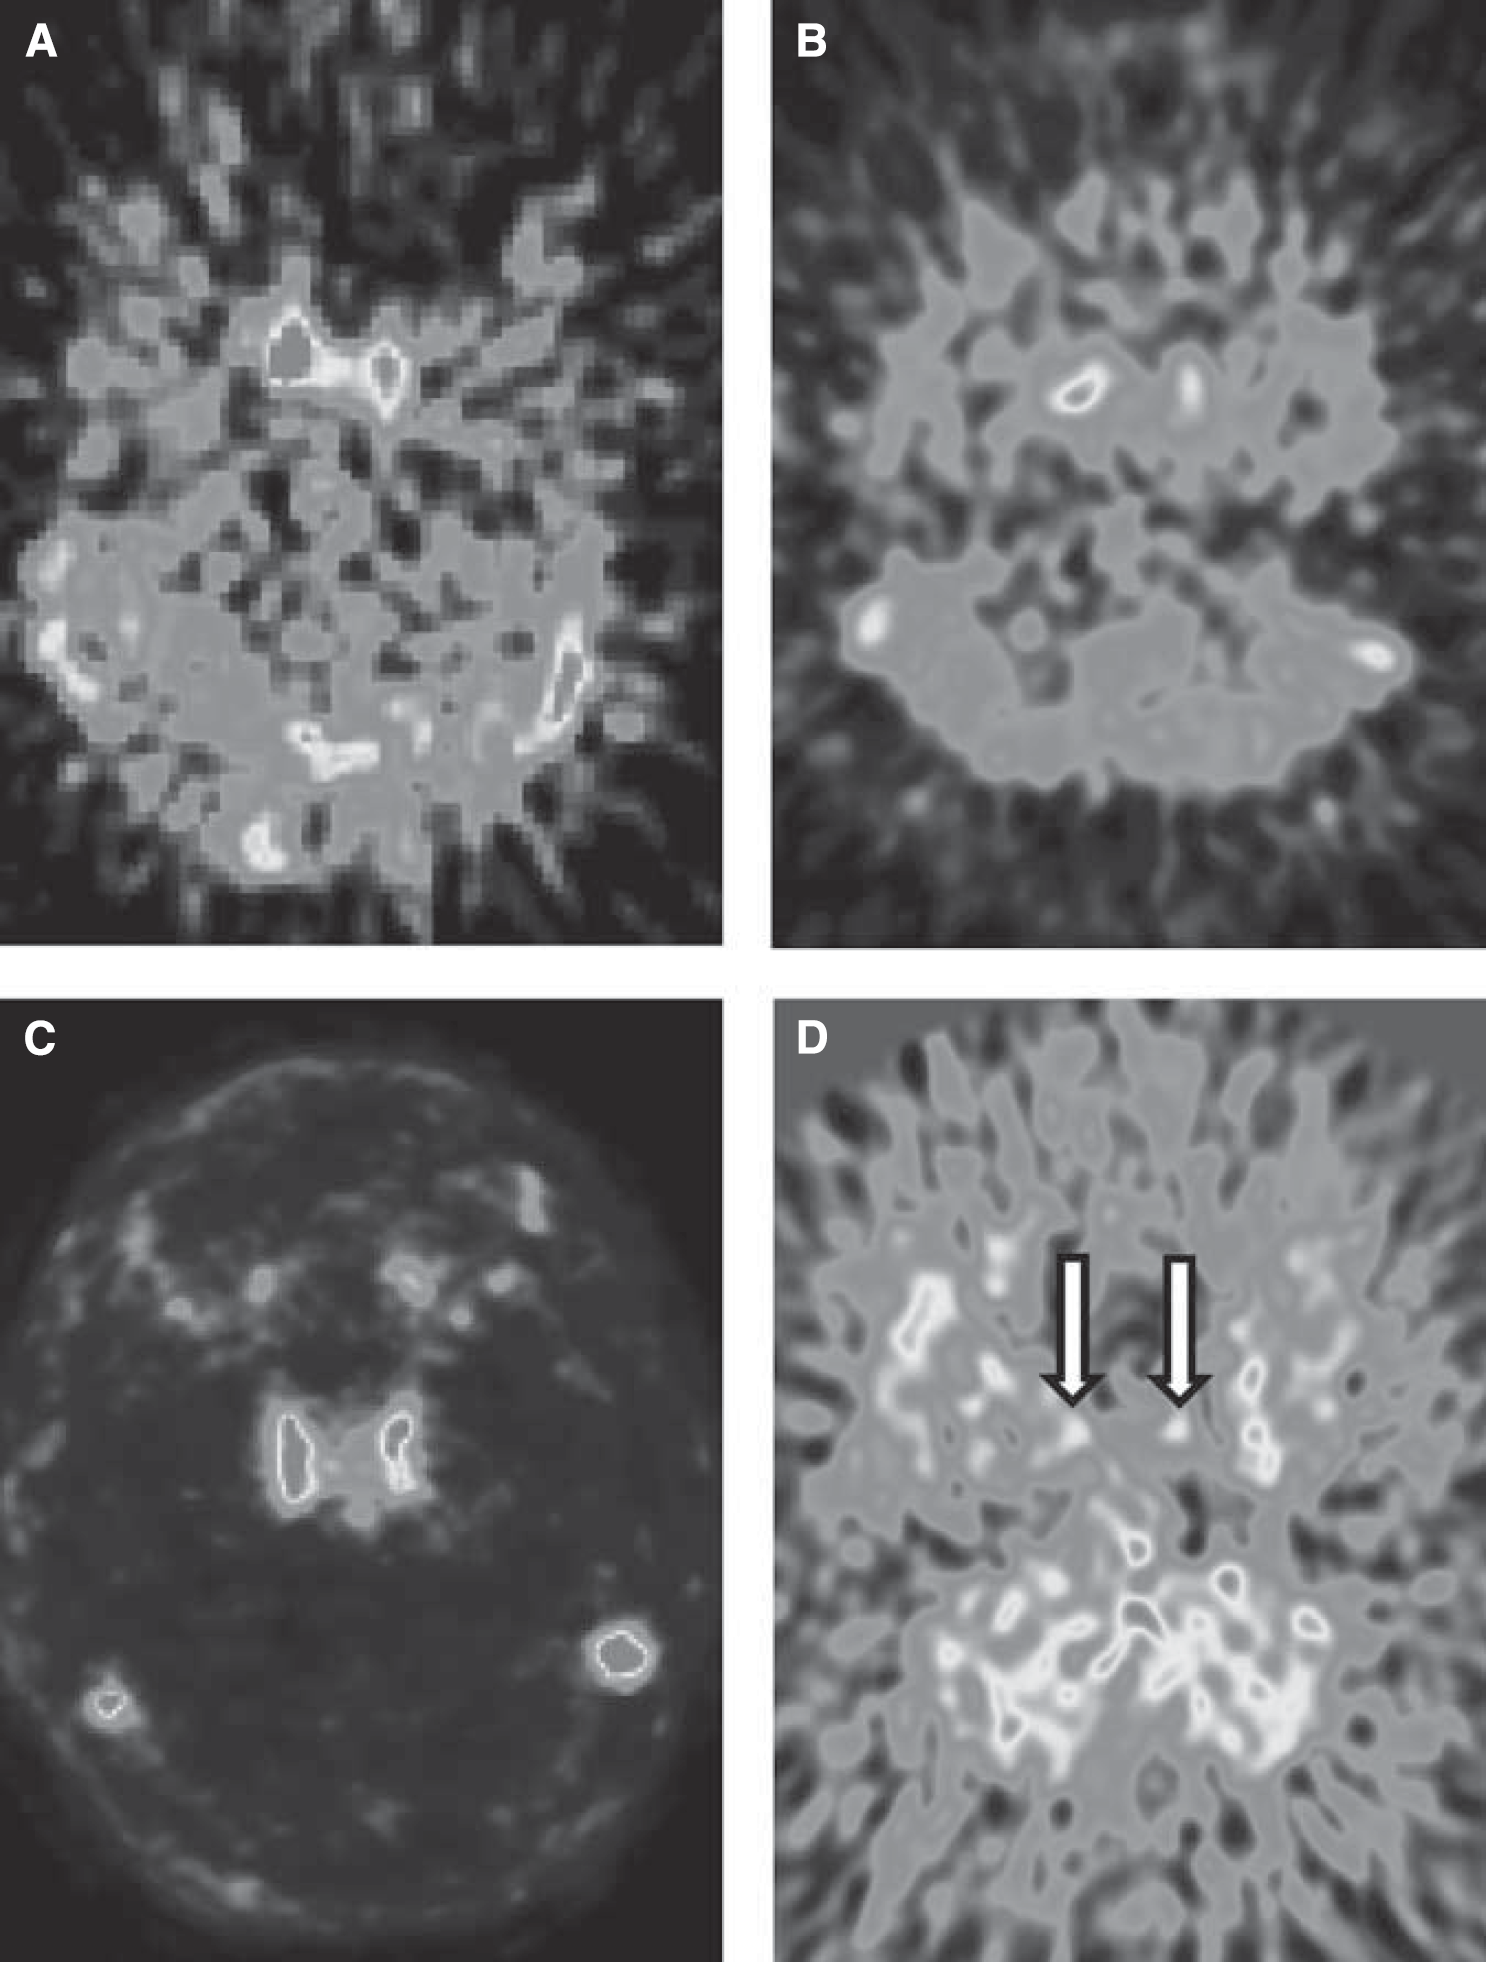
Early summed frames of [11C](
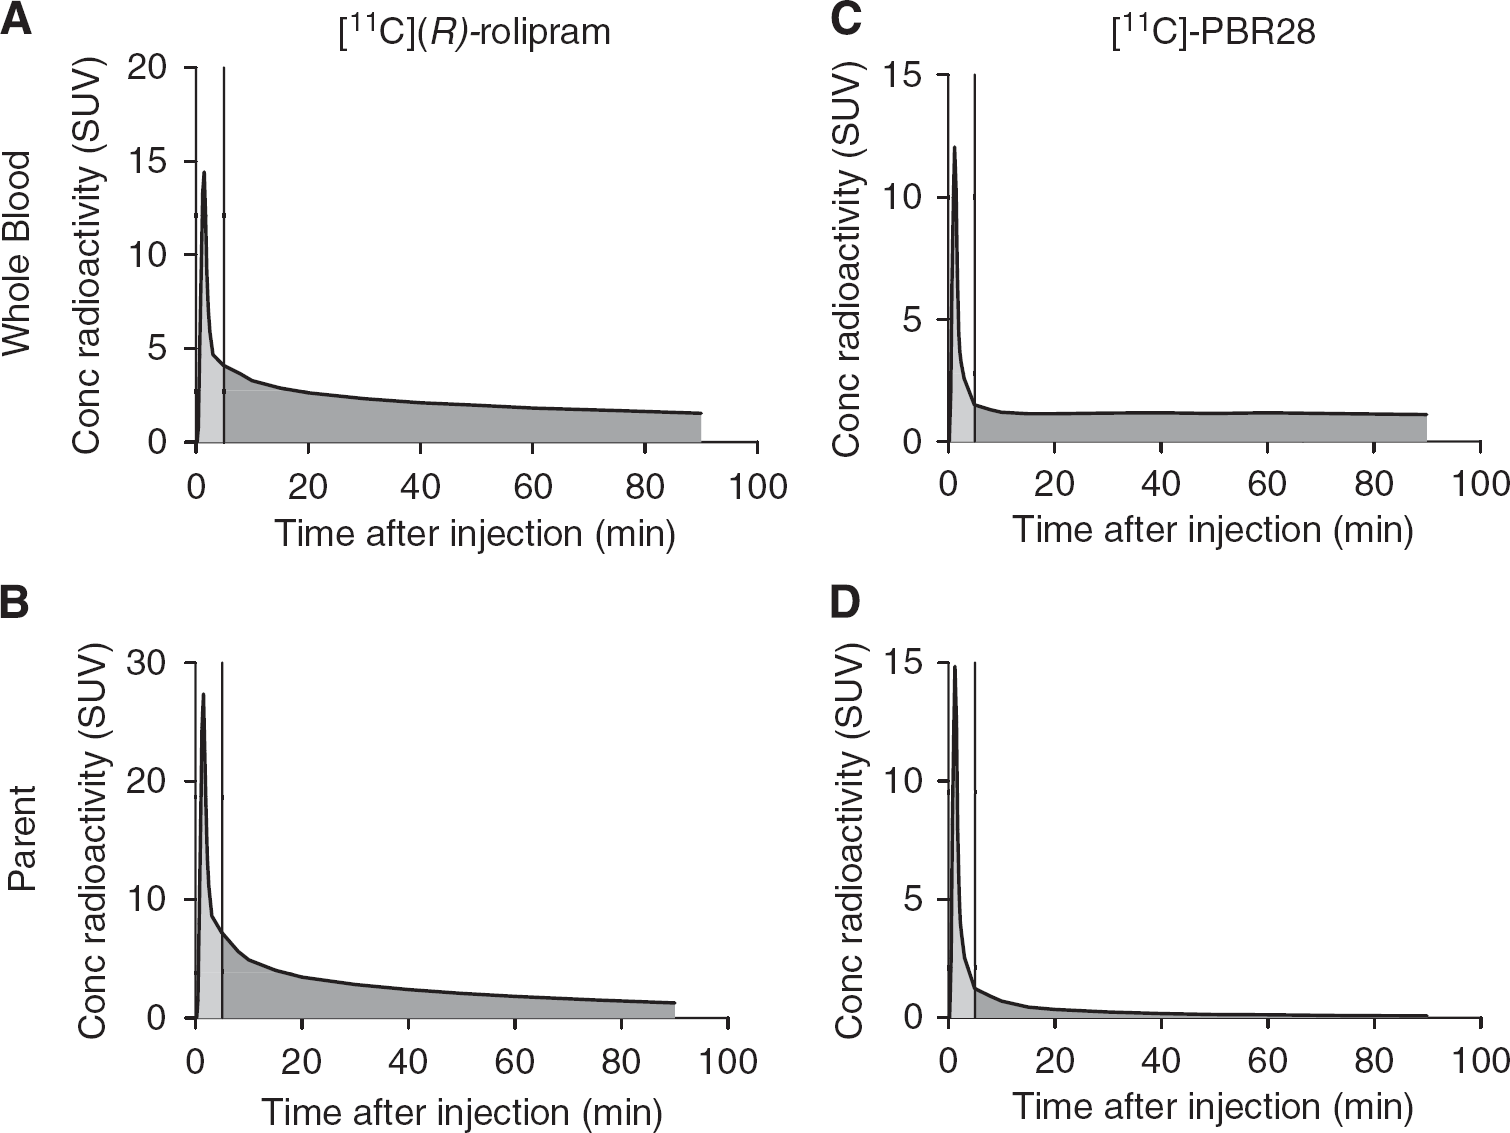
Representative blood time–activity curves obtained from arterial sampling for [11C](
It is not easy to directly measure the input function peaks using PET cameras. Even with a list-mode acquisition, the frame durations cannot be too short, or the noise would prevent a reliable quantification. In addition to the physical limitations intrinsic to the machine, it is also difficult to find a single analytical formulation capable of yielding a good model of tracer concentration for both the peak and the tail (Guo et al, 2007). To address this problem, Guo et al (2007) estimated the peak and tail of [18F]-FDG input function using two different approaches. The peak was modeled as a triangle whose three nodes were obtained from image-derived data from carotid arteries; the tail was estimated using a simultaneous estimation (SIME) approach associated with three blood samples. Sanabria-Bohorquez et al (2003) used a blood-calibrated IDIF to estimate the tail of [11C]-flumazenil input functions, while the peak was recovered by adding an exponential function to the scaled curve whose parameters were estimated from brain time–activity curves using SIME. These methods may perform well for tracers with a high metabolite fraction, in which peak estimation is crucial.
Which Kinetic Model Should be Used?
As described above, IDIF does not usually estimate the peak reliably. This prevents reliable estimation of some of the individual rate constants (
When using compartmental modeling, the compound parameters are derived by the individual rate constants. For example, the metabolic rate
In contrast, graphical approaches (Patlak, Logan) do not require that the shape of the early part of the input function be precisely estimated, as they mainly rely on the area under the curve. Therefore, these methods are more robust with regard to the usual IDIF errors. Using [18F]-FDG and the Patlak plot, Chen et al (1998) showed that underestimating the peak by about 20% would cause a < 0.1% variation of the estimated metabolic rates of glucose. Using [11C](
Taken together, the results suggest that graphical approaches should be used when compound parameters are the parameters of interest; if individual rate constants are needed, full arterial sampling would be a safer option.
Can Venous Blood Samples be Used Instead of Arterial Blood Samples?
As discussed above, IDIF requires that some blood samples be used to correct for partial volume effects, for radiometabolites, or for both. To avoid arterial cannulation, the only realistic solution would be substituting arterial samples with venous samples. However, as a rule, the arterial tracer kinetics is different from the venous one (Chiou, 1989; Greuter et al, 2011). Venous samples can be substituted for arterial samples only when taken during a transient equilibrium phase. Notably, the time when this equilibrium is reached differs for each tracer. For [18F]-FDG, arteriovenous equilibrium is reached about 10 to 15 minutes after injection, and this allows the use of venous samples to calculate IDIF (Chen et al, 1998). In contrast, equilibrium is reached only after 20 minutes for α-[11C]-methyl-tryptophan (Nishizawa et al, 1998), after 30 to 40 minutes for [11C](
What are the Alternatives?
As discussed above, many shortcomings prevent the widespread use of IDIF in clinical practice. Two methods, alternative to IDIF, are population-based input function (PBIF) and the simultaneous estimation of the input function (SIME). These two methods have the potential, with additional validation and after resolving some methodological issues, to achieve a less-invasive estimation of the input function for some tracers.
Population-based input function uses an appropriately scaled standard input function created by normalizing individual input functions from a population of subjects. For tracers with metabolites, PBIF refers to the serial concentrations over time of the parent radioligand separated from radiometabolites. Population-based input function has been validated mostly for [18F]-FDG, using arterial (Takikawa et al, 1993) or venous blood samples (Takagi et al, 2004) as scaling factors, or using noninvasive individual parameters such as body surface area (Shiozaki et al, 2000) or cerebellar [18F]-FDG activity (Bentourkia, 2006). Studies with other PET tracers are very rare (Beattie et al, 2010; Cook et al, 1999; Takikawa et al, 1994). Nevertheless, PBIF appears to have many practical advantages over IDIF, especially for brain studies where IDIF is more challenging to obtain. Specifically, PBIF does not depend on partial volume effects, scanner characteristics, quality of acquisition, or reconstruction algorithms; it is not operator-dependent; it is generally less time-consuming than IDIF because it does not involve image processing and provides a better estimate of the peak than most IDIF methods. The limitation most commonly attributed to PBIF is that the shape of input function determined in one group (e.g., healthy subjects) may not apply to another group (e.g., patients), because the disease state or its treatment may alter metabolism of the radioligand. We do not think, however, that this is a major problem because, when scaling is performed with blood samples, these samples largely account for the interindividual variability in tracer metabolism and the same PBIF may be applied across different populations of subjects (Zanotti-Fregonara et al, 2011c). In our opinion, the major limit of this technique is that, just like IDIF, the accuracy of PBIF depends on the metabolite fraction of the tracer. With PBIF, errors in the estimation of the peak are common. As a consequence, when PBIF is applied to [11C](
The SIME approach seeks to estimate input function parameters simultaneously with kinetic parameters from more than one brain regions and assuming the time–activity curves from these brain regions are different from each other. Recovering the input function common to all regions is accomplished by incorporating the input function parameters into the objective function to be optimized while modeling several ROI data sets simultaneously (Ogden et al, 2010). This method has been tested on simulated data (Feng et al, 1997; Riabkov and Di Bella, 2002; Wong et al, 2002) and in [18F]-FDG studies (Wong et al, 2001). Ogden et al (2010) recently applied the SIME approach to three neuroreceptor tracers [11C]-DASB, [11C]-BTA, and [11C]- WAY and demonstrated that it can be a valid alternative to full arterial sampling. Although this technique theoretically allows the estimation of a metabolite-corrected input function without blood samples, this requires further validation especially based on the statistical optimization theories and with realistic computer simulations. In practice, at least one blood sample must be collected to ensure identifiability and improve the parameter estimates (Jouvie et al, 2011; Ogden et al, 2010). Without sampling for the input function, it is not possible to uniquely estimate both the scaling factor for the input function and the parameter
Conclusion
Image-derived input function is an elegant technique for noninvasive estimation of the input function for PET neuroreceptor tracers. However, it is also a challenging technique that can be successfully implemented in clinical practice only for a small number of tracers. Moreover, the use of IDIF rarely translates into a less-invasive procedure for the patients, because arterial blood samples can rarely be avoided. While they still require some blood samples, PBIF and SIME may be valid alternative methods for some tracers.
Footnotes
Acknowledgements
The authors thank Victor W Pike and Sami S Zoghbi for contribution and expertise in radiopharmaceutics. Ioline Henter provided invaluable editorial assistance.
The authors declare no conflict of interest.