
Abstract
13C nuclear magnetic resonance (NMR) experiments have previously shown that glutamatergic neurotransmitter flux (Vcycle(Glu/Gln)) changes proportionately with neuronal glucose oxidation (CMRglc(ox)N) in the nonactivated cortex of anesthetized rats. Positron Emission Tomography measurements of glucose and oxygen uptake during sensory stimulation had shown that the incremental glucose utilization is greater than oxygen leading to the suggestion that the energy required for stimulated neuronal activity arises from nonoxidative glucose metabolism. In this study, the authors used spatially localized 1H-observed, 13C-edited NMR spectroscopy during an infusion of [1,6–13C2]glucose to assess the relationship between changes in Vcycle(Glu/Gln) and glucose utilization (CMRglc(ox)N and CMRglc(nonox)) during the intense cortical activity associated with bicuculline-induced seizures. Metabolic fluxes were determined by model-based analysis of the 13C-enrichment time courses of glutamate-C4 and glutamine-C4 (CMRglc(ox)N, Vcycle(Glu/Gln)) and lactate-C3 (CMRglc(nonox)). The exchange rate between α-ketoglutarate and glutamate was found to be significantly faster than TCA cycle flux both for control (41 μmol·g−1·min−1; 95% CI, 5 to 109 μmol·g−1·min−1) and during seizures (21 μmol·g−1·min−1; 95% CI, 4.4 to 51.8 μmol·g−1·min−1). During seizures, total glucose utilization (CMRglc(ox+nonox)) increased substantially (466% between 0 and 6 minutes; 277% between 6 and 55 minutes). Glucose oxidation (CMRglc(ox)N) also increased (214%; from 0.26 ± 0.02 to 0.57 ± 0.07 μmol·g−1·min−1) but to a lesser degree, resulting in a large increase in cortical lactate concentration. Vcycle(Glu/Gln) increased 233% (from 0.22 ± 0.04 to 0.52 ± 0.07 μmol·g−1·min−1), which was similar to the increase in glucose oxidation. The value of Vcycle(Glu/Gln) and CMRglc(ox)N obtained here lie on the line predicted in a previous study. These results indicate that neuronal glucose oxidation and not total glucose utilization is coupled to the glutamate/glutamine cycle during intense cortical activation.
Keywords
Nuclear magnetic resonance (NMR) spectroscopy with 13C isotopes has provided strong evidence for the coupling of the glutamate/glutamine cycle to glucose energetics in the cerebral cortex in vivo (Magistretti et al., 1999; Sibson et al., 1998. 1999). These studies have shown that the glutamate/glutamine cycle flux (Vcycle(Glu/Gln)) is comparable in magnitude to the neuronal cerebral metabolic rate of glucose oxidation (≈80% of CMRglc(ox)N) in the cortices of resting humans (Shen et al., 1999) and of anesthetized rats (Sibson et al., 1997, 1998, 2001). In anesthetized rats Vcycle(Glu/Gln) and CMRglc(ox)N change proportionately (≈1:1 ratio) over a substantial range of neuronal activity above isoelectricity (Sibson et al., 1998). The observed relationship is consistent with the calculations of the energetics of specific ion flows associated with glutamatergic neurotransmission (Attwell and Laughlin, 2001). The proportionality between Vcycle(Glu/Gln) and CMRglc(ox)N supports a proposed coupling mechanism (Magistretti et al., 1999; Pellerin and Magistretti, 1994), in which glucose uptake is stoichiometrically coupled to glutamate neurotransmitter cycling between neurons and astrocytes.
To date, quantitative measurements of Vcycle(Glu/Gln) as a function of CMRglc(ox)N have only been reported for the nonactivated cortex of the anesthetized rat (Sibson et al., 1998), although they are consistent with results in the resting human (Shen et al., 1999). It has been long known that the ratio of oxygen to glucose uptake (CMR
The present study investigated whether the observed proportionality between ΔVcycle(Glu/Gln) and ΔCMRglc(ox)N in the nonstimulated state holds during intense neuronal activation. We used spatially localized 1H-observed, 13C-edited (POCE) NMR spectroscopy (de Graaf et al., 2003) with an intravenous infusion of [1,6–13C2]glucose to determine Vcycle(Glu/Gln) and CMRglu(ox)N in the rat cortex during bicuculline-induced seizures. Metabolic fluxes were determined by fitting a two-compartment (neuron–astroglia) metabolic model to the time courses of the 13C-labeled metabolites (Mason et al., 2003). We found that the relationship between ΔVcycle(Glu/Gln) and ΔCMRglu(ox)N reported previously in the nonstimulated state also applies during intense neuronal activation. Our results show that oxidative rather than nonoxidative glycolysis is coupled to the glutamate/glutamine cycle during intense neuronal activation. Thus, changes in Vcycle(Glu/Gln) and CMRglc(ox)N during intense cortical activation follows the same relationship as reported previously in the nonactivated cortex, providing strong evidence for a singular coupling mechanism between these fluxes at the molecular level.
MATERIALS AND METHODS
Animal preparation
Animal experiments were performed in accordance with protocols approved by the Yale Animal Care and Use Committee. Wistar rats (160 to 180 g), fasted overnight, were anesthetized with 2% to 3% halothane in 30% O2 / 67% to 68% N2O, tracheotomized, and ventilated. The left femoral artery was cannulated for continuous monitoring of arterial blood pressure and intermittent sampling of blood for the measurement of glucose and gases. Both femoral veins were cannulated for the infusion of [1,6–13C2]glucose and administration of bicuculline or saline. Body temperature was maintained near 37°C using a heating pad connected to a temperature-regulated circulating water bath. A pair of carbon fiber EEG leads was positioned in the scalp for monitoring seizure activity using a Grass polygraph in bicuculline-treated animals. The output of the amplifier was digitized using an analog-to-digital converter interfaced to a personal computer and monitored using LabView (National Instruments, Austin, TX, U.S.A.). After surgery, halothane was reduced to 1% to sustain an adequate blood pressure.
Animals were placed in a small plastic cradle and a surface coil was placed on the scalp. A layer of Saran Wrap was placed between the coil and scalp. The cradle/probe was inserted into the magnet and field homogeneity was optimized. After the acquisition of baseline spectra, an intravenous infusion of [1,6-13C2]glucose (99 atom %; Cambridge Isotopes, Andover, MA, U.S.A.) was begun using a protocol described previously (Fitzpatrick et al., 1990). [1,6-13C2]Glucose was dissolved in water and administered as a bolus (48 mg in 0.27 mL in 15 seconds) followed by a manual stepped reduction in infusion rate every 30 seconds for the next 8 minutes, whereupon the rate was constant until the time of in situ brain freezing. This protocol raises plasma glucose rapidly (<1 minute) and maintains a nearly constant level and enrichment thereafter.
Before induction of seizures, animals were immobilized with D-tubocurarine chloride (initial dose of 0.25 mg/kg, intraperitoneally with supplements of 0.10 mg/kg every 40 minutes). Blood was withdrawn (1.5 mL) into heparinized saline 2 minutes after the beginning of the glucose infusion in order to limit the peak rise in arterial blood pressure during the seizures and re-infused as needed to maintain blood pressure. Seizures were induced by injection of bicuculline (1 mg/kg dissolved in water, intravenously) 4 minutes after beginning the 13C-glucose infusion. The glucose infusion preceded the injection of bicuculline by 4 minutes in order to prelabel the brain pools of extra cellular and intracellular glucose to minimize label dilution in pyruvate by rapid metabolism of the initially unlabeled glucose and glycogen to lactate. Additional bicuculline was administered, as needed, to maintain electrographic seizure activity. An equivalent volume of saline was injected at 4 minutes of [1,6–13C2]glucose infusion in control animals. The [1,6–13C2]glucose was infused for 55 minutes in rats receiving bicuculline and for approximately 85 minutes in rats receiving saline. A shorter experimental time was used for bicuculline-treated rats because steady state labeling was achieved more quickly than in control animals and the physiologic condition can deteriorate during extended status epilepticus seizures. In addition, control and bicuculline-treated rats were also infused with [1,6–13C2]glucose on the bench for selected time points to estimate the exchange rate (Vx) between α-ketoglutarate and glutamate. Arterial blood samples were taken periodically for the analysis of plasma glucose concentration and 13C percent enrichment. At the end of the experiment, the brain was frozen in situ in liquid nitrogen while mechanical ventilation was continued (Pontén et al., 1973).
In vivo nuclear magnetic resonance spectroscopy
In vivo experiments were performed on a 7 T horizontal bore Bruker magnet interfaced to a Bruker AVANCE spectrometer (Bruker Instruments, Billerica, MA, U.S.A.) equipped with a 12 cm diameter actively shielded gradient coil insert (190 mT/m in 200 μs). The operating frequencies for 1H and 13C were 300.30 and 75.5 MHz, respectively. POCE NMR spectra were acquired using a 13-mm-diameter 1H surface coil and two orthogonal 21-mm-diameter 13C coils driven in quadrature (de Graaf et al., 2003). The exact position of the spectroscopic volume-of-interest was determined by acquiring three orthogonal fast gradient-echo images of the brain (Haase et al., 1986). Automated adjustments of first and second order shims within a volume of 7 × 7 × 7 mm3 using the noniterative FASTMAP algorithm (Gruetter, 1993) resulted in water 1H line widths of 11 to 13 Hz. Three-dimensional localization was achieved with a combination of outer-volume suppression, image selective in vivo spectroscopy, and slice-selective signal excitation techniques. Water suppression was achieved using SWAMP (de Graaf and Nicolay, 1998) with adiabatic modulated pulses. POCE NMR spectra were obtained every 45 seconds from a localized volume of 7 × 4 × 7 mm3.
Processing of in vivo nuclear magnetic resonance data
Free induction decays were zero-filled to 8,192 data points, apodized (2.0 Hz Gaussian line broadening), Fourier transformed, and phase corrected. The POCE difference spectrum was obtained by subtracting the 13C-inverted spectrum (12C-13C) from the noninverted (12C + 13C) spectrum leaving only the 2 x 13C-coupled 1H resonances. Spectra were summed over 3-minute intervals to increase the signal-to-noise ratio. Resonance intensities were measured using the LCmodel algorithm (de Graaf et al., 2003; Provencher, 1993), which was used to determine the percent 13C enrichments and the concentration of metabolites.
Analysis of plasma glucose
Glucose concentration (Glucose Analyzer II, Beckman Instruments) and isotopic 13C enrichment were determined in the plasma from arterial blood samples obtained periodically during the 13C-glucose infusion. For NMR measurements, the plasma was mixed with D2O and large macromolecules were removed by passage of the samples through a centrifugal filter (10-kd cut off, Nanosep, Gelman Laboratory, MN, U.S.A.). The percentage 13C enrichment of plasma glucose C1α was determined from the fully relaxed 1H NMR spectrum obtained at 11.7 T AM-500 (Bruker AVANCE NMR spectrometer, Bruker Instruments). The enrichment of glucose C1α at 5.23 ppm was calculated by dividing the intensities of the two 13C satellites by the total (12C + 13C) intensity (Kalderon et al., 1989).
Preparation of cortical extracts and separation of amino acids
Metabolites were extracted from frozen frontoparietal cortical tissue (150 to 200 mg) as previously described (Patel et al., 2001). Briefly, the frozen tissue was pulverized with ice-cold 0.1 mol/L HCl in methanol (1:2 wt/vol) in a dry-ice/ethanol bath and transferred to a wet-ice bath. A known quantity of [2–13C]glycine (50 μL of 10 mmol/L solution) was added as an internal concentration reference to correct for losses during the extraction procedure. The tissue powder was homogenized with ice-cold ethanol (1:6 wt/vol; 60% ethanol: 40% deionized water) until no visible pieces remained. The homogenate was clarified by centrifugation (20,000g). The supernatant was lyophilized, and re-suspended in 500 μL of a phosphate-buffered (100 mmol/L, pH 7) deuterium oxide (Cambridge Isotopes) solution containing 0.5 mmol/L TSP (3-trimethylsilyl[2,2,3,3-D4]-propionate), which served as a chemical shift reference. After quantification of total amino acid levels in the tissue extracts using POCE NMR, amino acids were separated using AG 1-X8 anion exchange resin (200 to 400 mesh, 1.4 mL bed volume; Bio-Rad Laboratories, Hercules, CA, U.S.A.). Glutamine and GABA were eluted with de-ionized water and glutamate was eluted with 2 mol/L acetic acid (Patel et al., 2001). The pH of both fractions was reduced to approximately 3 before lyophilization to reduce the concentration of acetic acid. Both fractions were lyophilized, and resuspended in phosphate-buffered deuterium oxide containing 0.5 mmol/L TSP for further NMR analysis.
Nuclear magnetic resonance analysis of cortical extracts
Fully relaxed POCE NMR spectra of extracts were acquired at 11.7 T (Fitzpatrick et al., 1990) using a pulse sequence that incorporated adiabatic pulses for 1H and 13C excitation (de Graaf et al., 2003). The concentrations of metabolites were determined relative to known concentration of [2–13C]glycine added during tissue extraction as an internal reference. The isotopic 13C enrichments of C3 and C4 carbons of glutamate and glutamine were calculated from the ratio of the areas of these resonances in the POCE difference spectrum (13C only) and the nonedited spectrum (12C + 13C) of the separated glutamate and glutamine fractions.
Estimation of the exchange rate between α-ketoglutarate and glutamate
Isotope exchange between mitochondrial α-ketoglutarate and cytosolic glutamate is the major pathway for 13C labeling of brain glutamate during oxidative metabolism of 13C-labeled glucose. The rate of exchange (Vx) in relation to the TCA cycle flux (VTCA) affects the rate at which label appears at glutamate-C4 and C3 and can influence the apparent value of TCA cycle flux depending on the value of the ratio (Vx/VTCA) (Gruetter et al., 2001; Mason et al., 1992). We did not have sufficient spectral resolution in the current study for accurate quantification of glutamate and glutamine-C3 owing to extensive overlap (Fig. 3, 4). Therefore, the value of Vx was determined from an ex vivo 13C-labeling experiment whereby the carbon-13 atom enrichments were determined in tissue extracts after complete chromatographic separation of glutamate and glutamine. Cortical extracts were prepared from control and bicuculline-treated rats receiving an infusion of [1,6–13C]glucose for three different periods (control group: 7, 17, and 85 minutes; seizure group: 7, 17, and 55 minutes; for 7 and 17 minutes, n = 3 per time point). The last time point in each group (n = 6 each) represents the terminal point from the in vivo experiments. The ex vivo measured percent 13C enrichments, which consisted of glutamate-C4 and C3, glutamine-C4 and C3, and aspartate-C3, were normalized by the corresponding end-point plasma glucose-C1 as follows:

where FEnorm and FEaa are the normalized and measured percent 13C enrichments of the different carbon atom positions, and FEglc is the end-point plasma glucose-C1 % 13C enrichment. A two-compartment metabolic model (neuron and astroglia) depicted in Fig. 1 and Table 1 (Gruetter et al., 2001; Mason et al., 2003; Shen et al., 1999; Sibson et al., 2001) was fitted simultaneously to all the measured 13C-enrichment time courses. The input function was the mean blood glucose-C1 enrichment. Best fits of the model to the experimental data were determined using a simulated annealing algorithm (Press et al., 1992) with iteration of VTCAn, Vx, VGln, and VdilLac. The uncertainty in Vx and other parameter estimates was determined by Monte-Carlo simulation as described by Mason et al. (1995). Briefly, 100 simulated noisy data sets were created from the least squares fit by adding random noise with the same Gaussian distribution as observed in the original data. For Monte-Carlo simulations of the GluC4, GlnC3 and AspC3 data sets with either Vx = 41 and Vx = 1, the random noise standard deviations were 6.14, 8.61, 5.24 and 8.66, 6.29, 6.66 units of percent 13C enrichment, respectively. Each of the simulated data sets was analyzed using the same fitting procedure as performed with the original data and the 100 sets of fitted parameters recorded.
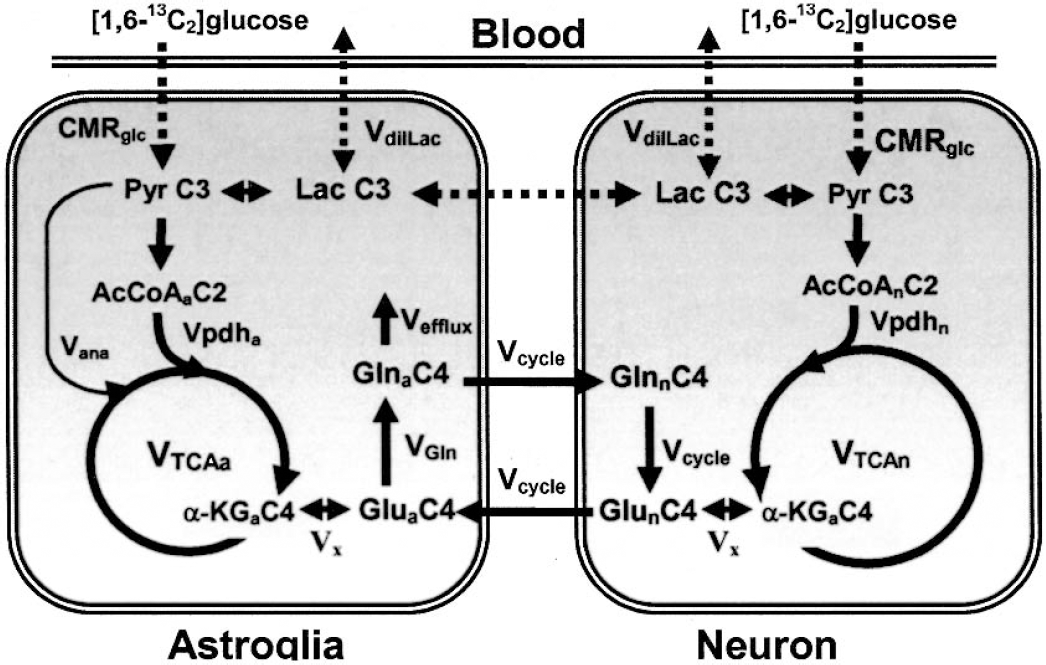
Schematic diagram of the major pathways of 13C isotopic labeling of cerebral metabolites from [1,6–13C2]glucose. The 13C-labeled glucose is metabolized in neurons and astroglia to lactate-C3 (Lac C3) / pyruvate-C3 (Pyr C3) by glycolysis and enters their respective TCA cycles through acetyl-CoA-C2 (AcCoA C2). AcCoA C2 labels α-ketoglutarate-C4 (α-KG C4) and, through fast enzyme-mediated exchange (Vx), glutamate-C4 (Glu C4). Glutamate released from glutamatergic neurons is transported into astroglia and converted to glutamine-C4 (Gln C4) by glutamine synthetase. Gln C4 is released from astroglia and transported back to neurons where hydrolysis to Glu C4 occurs by phosphate-activated glutaminase. Further metabolism of α-KG C4 (Glu-C4) in the TCA cycle labels C2 and C3 of Glu and Gln (not shown). AcCoA C2, acetylCoA-C2; Gln C4, glutamine-C4; Glu C4, glutamate-C4; α-KG C4, α-ketoglutarate-C4; Lac C3, lactate-C3; Pyr C3, pyruvate-C3; Vcycle, Vcycle(Glu/Gln); VTCAa, Astrocytic TCA cycle flux; VTCAn, neuronal TCA cycle flux.
Coupled differential equations used for the modeling of the 13C time courses
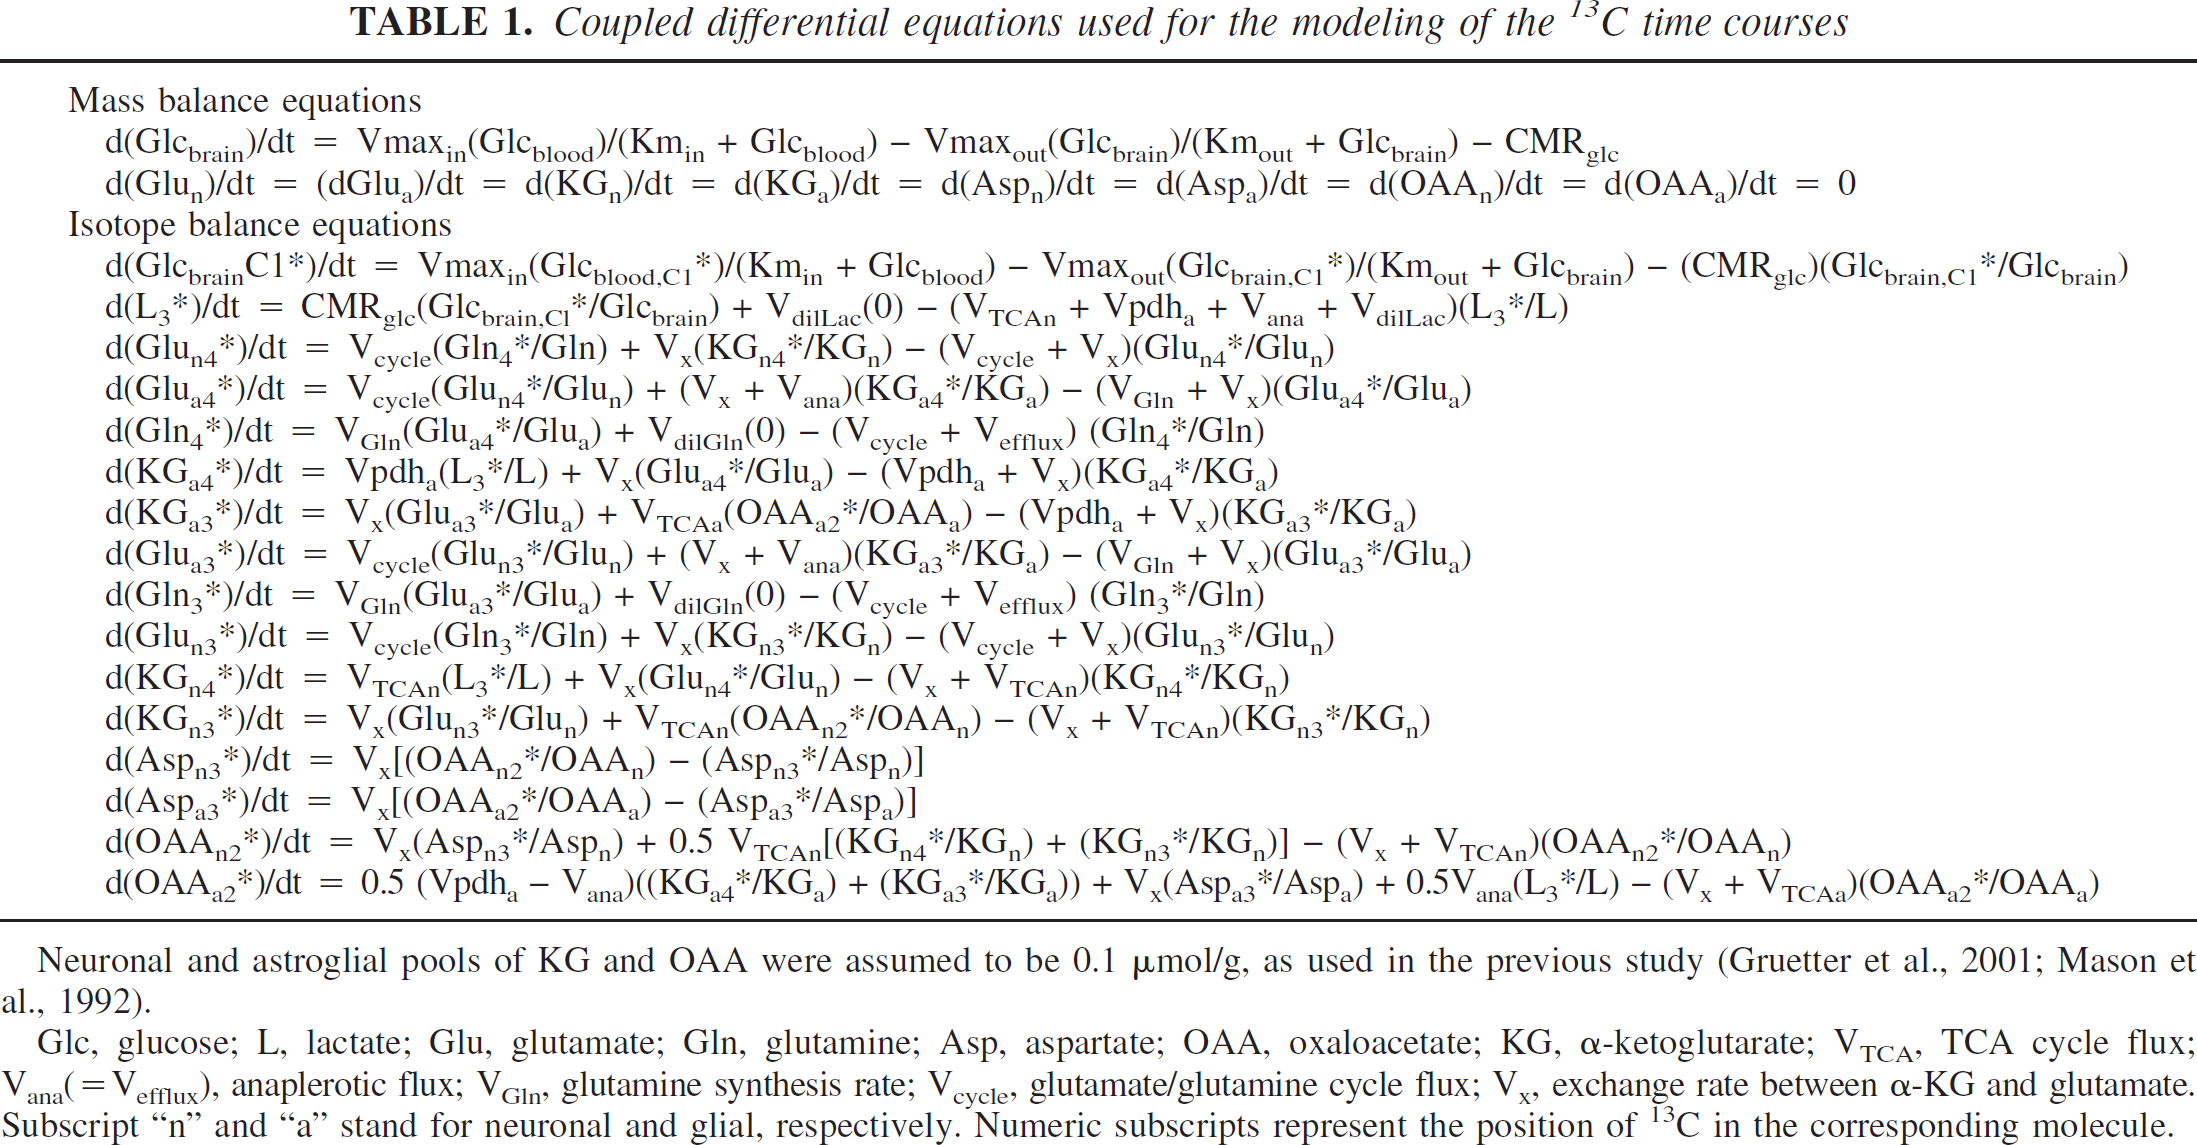
Neuronal and astroglial pools of KG and OAA were assumed to be 0.1 μmol/g, as used in the previous study (Gruetter et al., 2001; Mason et al., 1992).
Glc, glucose; L, lactate; Glu, glutamate; Gln, glutamine; Asp, aspartate; OAA, oxaloacetate; KG, α-ketoglutarate; VTCA, TCA cycle flux; Vana(= Vefflux), anaplerotic flux; VGln, glutamine synthesis rate; Vcycle, glutamate/glutamine cycle flux; Vx, exchange rate between α-KG and glutamate. Subscript “n” and “a” stand for neuronal and glial, respectively. Numeric subscripts represent the position of 13C in the corresponding molecule.
Determination of metabolic fluxes in vivo
The metabolic fluxes were determined by fitting a comprehensive two-compartment (neuron and astroglia) metabolic model to the in vivo time course of labeling of glutamate-C4 and glutamine-C4. The metabolic model is depicted schematically in Fig. 1 and essentially follows previous reports (Gruetter et al., 2001; Mason et al., 2003; Shen et al., 1999; Sibson et al., 2001). Mass and 13C isotope flows from [1,6–13C]glucose to the major amino acids (glutamate, glutamine, and aspartate) in neurons and astroglia were expressed as a series of coupled differential equations (Table 1) and solved using a Runge-Kutta algorithm (Burden et al., 1981). The analysis was implemented using the CWave software package (Mason et al., 2003). The measured resonance intensities in POCE spectra were normalized to the final spectrum and converted to percent 13C enrichment according to the following equation:
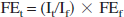
where It and If are the measured resonance intensities at time t and at the end of the experiment respectively, and FEf is the measured end-point percent enrichment in the cortical extract. Neuronal TCA cycle flux (VTCAn) and glutamine synthesis rate (VGln) was determined from the best fits of the model to individual data sets. The cerebral metabolic rate of neuronal glucose oxidation (CMRglc(ox)N) and glutamate/glutamine cycling flux (Vcycle(Glu/Gln)) were calculated from VTCAn and VGln, respectively.
Because of the change in lactate and glutamine levels during seizures, the 13C enrichment of glutamate-C4 and glutamine-C4 achieved in the 4 minutes before bicuculline administration (prelabeling period) was subtracted from the subsequent enrichments after seizure induction (t = 0). The concentration of total glutamine, which increased during the seizure, was fitted by the model. Glutamine was assigned to the astroglial compartment, whereas glutamate was divided between neurons (90%) and astroglia (10%). The anaplerotic flux (Vana) was assumed to be 20% of Vgln and astroglial TCA cycle flux (VTCAa) to be 15% of the total TCA cycle flux (Sibson et al., 2001) in cortex of both control and seizing animals. The increase in glycolytic flux (ΔCMRglycolysis) at the onset of seizures, which represents nonoxidized glucose utilization, was calculated from the initial rate of accumulation of lactate (1/2 x ΔL/At0→1min). During seizures the steady state rate of lactate efflux (Vefflux(Lac)) was estimated by the Michaelis-Menten relation,

where [L] is the concentration of lactate at steady state, and Tmax and Km are the kinetic parameters of lactate transport (0.75 μmol·g−1·min−1 and 2.5 mmol/L, respectively) (Pardridge, 1983). Total glucose utilization (CMRglc(tot)) during seizures was calculated as the sum of the oxidized and nonoxidized components according to the following relations:
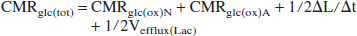
where CMRglc(ox)A = 1/2Vana + 1/2VTCAa. The value of Vefflux(Lac) was assumed to be negligible (≈0) in control animals and at seizure onset, and ΔL/Δt = 0 during seizures when lactate had reached a constant level.
Statistical analysis
The nonparametric Wilcoxon two-sample test was used to determine the significance of statistical differences between seizure and control groups for comparison between plasma glucose concentrations, isotopic 13C-enrichments, and the measured metabolic rates, CMRgcl(ox)N and Vcycle(Glu/Gln). The statistical analyses were carried out using SAS statistical software.
RESULTS
Effects of seizures on physiologic variables and the EEG
Mean arterial blood pressure increased form a baseline level of 85 to 95 mm Hg to 145 to 160 mm Hg after bicuculline treatment, and fell within approximately 5 minutes to 125 to 135 mm Hg. In both groups, blood gases were regulated within normal physiologic limits (Pa
Effects of bicuculline-induced seizures on systemic physiologic variables (P
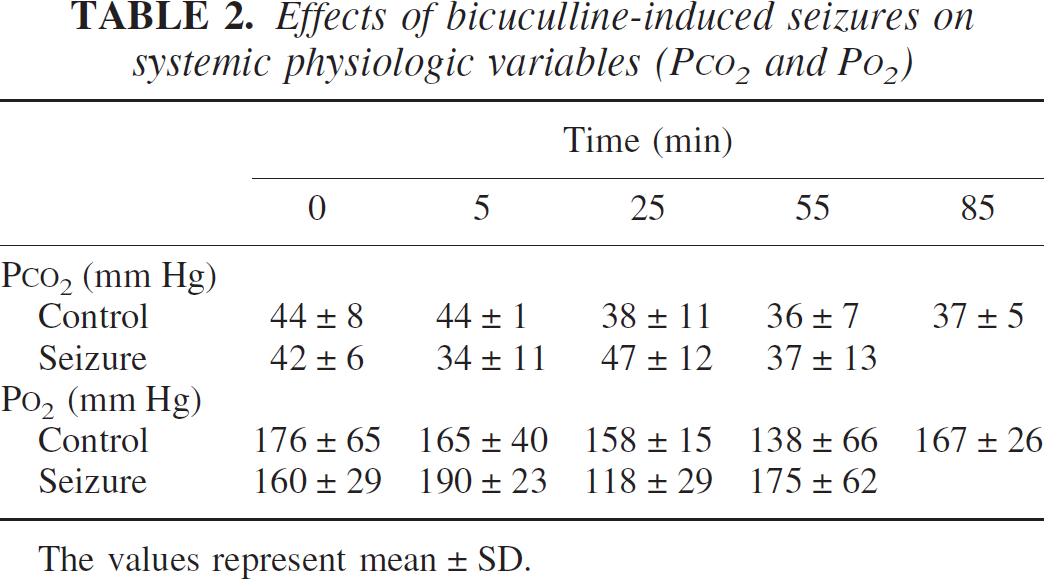
The values represent mean ± SD.
Cortical electrical activity as recorded by the EEG was increased within 15 seconds of bicuculline injection (Fig. 2A). A pattern of continuous, high-amplitude spiking was followed by periods of intermittent bursts and suppression. Additional doses of bicuculline were administered as needed (Fig. 2E) in order to maintain electrographic seizure activity during the 55 minutes of the 13C-labeling experiment.
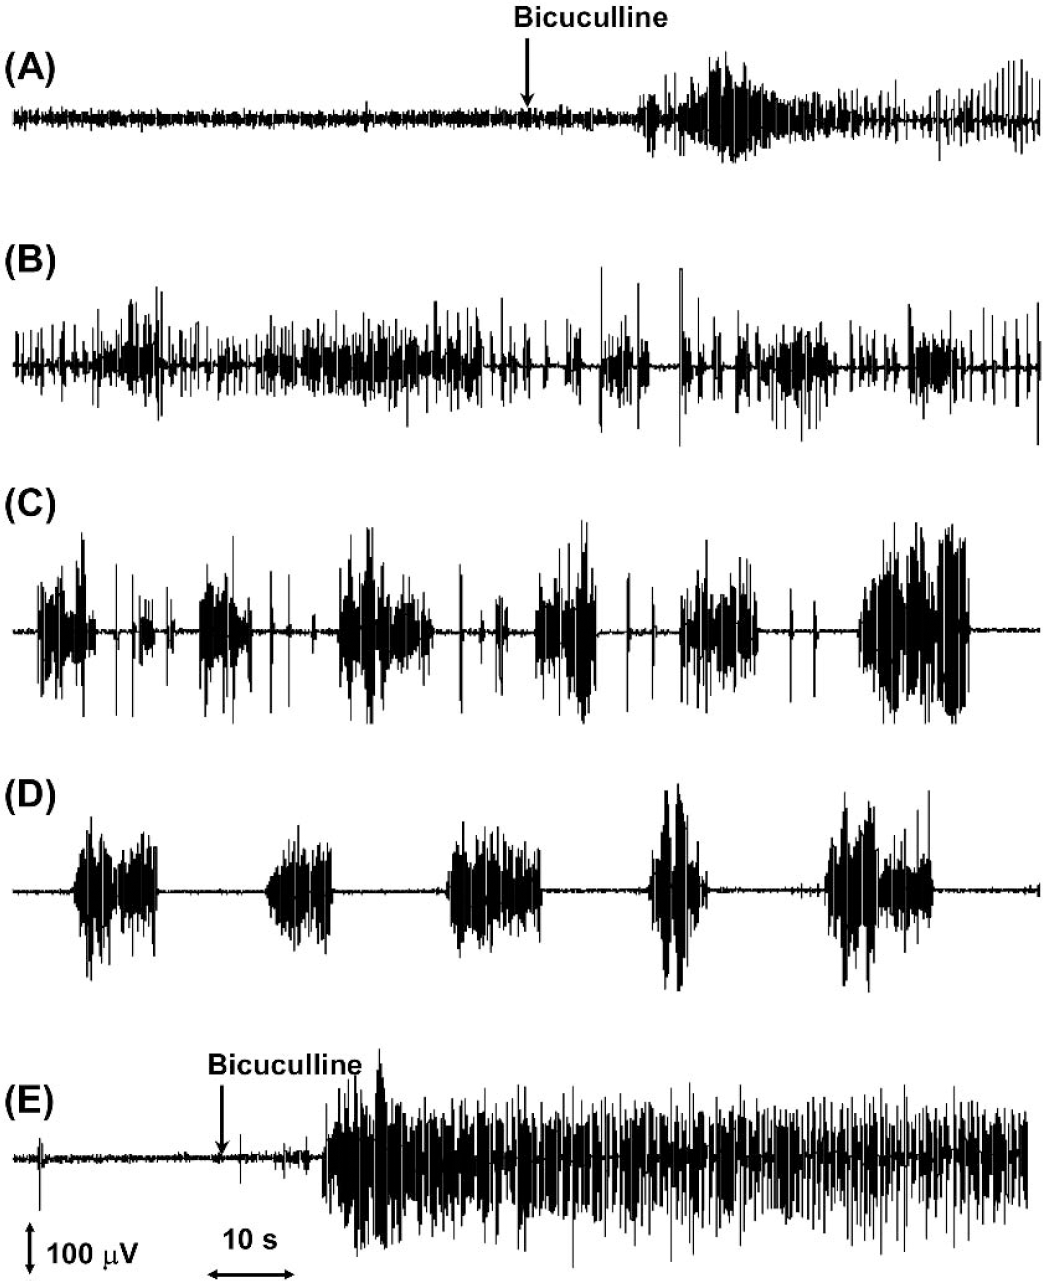
Effects of bicuculline treatment on the EEG. EEG signals were recorded from subcutaneous carbon fiber leads, amplified (Grass polygraph), digitized, and viewed on a personal computer. The depicted EEG traces were recorded (
Plasma glucose concentration and enrichment
The average basal levels of plasma glucose measured before the infusion of labeled glucose were similar (P = 0.36; Table 3) in the control (5.7 ± 1.2 mmol/L, mean ± SD) and bicuculline-treated (6.3 ± 1.3 mmol/L) groups. Infusion of the 13C-glucose led to a rapid increase in plasma glucose concentration to similar levels (P = 0.83) in both groups (control, 11.4 ± 1.4 mmol/L, n = 6; seizures, 11.2 ± 1.1 mmol/L, n = 6; averaged over the entire period of infusion), which remained nearly constant throughout the infusion (Table 3). The 13C isotopic enrichment of blood plasma glucose C1α increased from its natural abundance level of 1.1% to approximately 50% within the first minute of infusion in both groups and remained constant thereafter (Table 3). The final average enrichment of the seizure group (47% ± 1%, n = 6) was slightly less (P = 0.07) than nontreated controls (51% ± 3%, n = 6).
Stability of total plasma glucose concentration (mmol/L) and [1-13C]glucose percent 13C enrichment in control and bicuculline-treated rats
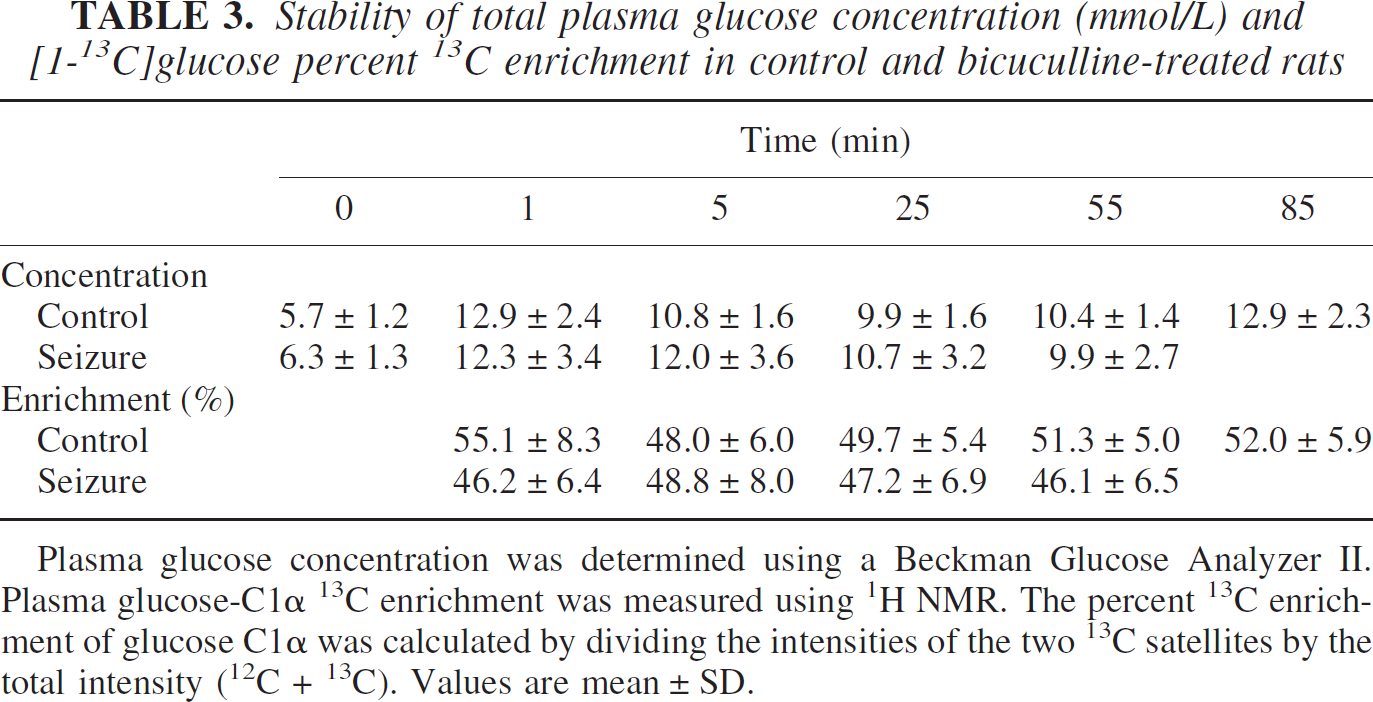
Plasma glucose concentration was determined using a Beckman Glucose Analyzer II. Plasma glucose-C1α 13C enrichment was measured using 1H NMR. The percent 13C enrichment of glucose C1α was calculated by dividing the intensities of the two 13C satellites by the total intensity (12C + 13C). Values are mean ± SD.
Effects of seizures on cortical metabolite concentrations
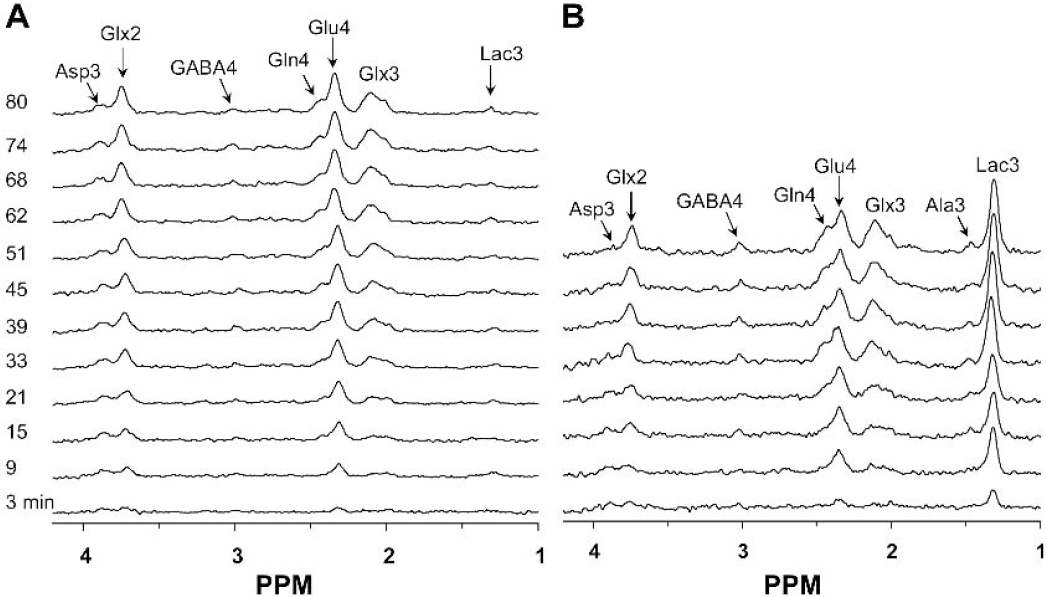
During seizures the intensities of the lactate, glutamine, and alanine resonances in 1H-NMR spectra increased significantly (Fig. 3). Quantitation of these resonances in cortical tissue extracts at 55 minutes of seizures (Table 4) revealed significant increases in lactate (303%), glutamine (29%), GABA (76%), alanine (159%), and succinate (80%) and a decrease in aspartate (–21%) compared with control animals. No significant change was observed in glutamate between the two groups. Similar changes in these metabolites during bicuculline induced-seizures were reported by Chapman et al. (1977), although the decrease in glutamate seen by those investigators was not detected in the present study. The increase in lactate and alanine is most likely related to increased production and accumulation of their common precursor, pyruvate (Chapman et al., 1977), due to the initially greater rate of glucose utilization over mitochondrial oxidation of pyruvate. Total amino acid levels increased (Table 4) by approximately 3.6 μmol/g, which was dominated by the increase in glutamine and GABA during the 55 minutes of seizures, consistent with an increase in anaplerotic flux (Siesjo 1978; Chapman et al., 1984) and the expected increase in blood and brain ammonia (Blennow et al., 1978; Chapman et al., 1977). An increase in GABA concentration has been reported previously during seizures (Chapman et al., 1977) possibly reflecting a response to heightened cortical excitability.
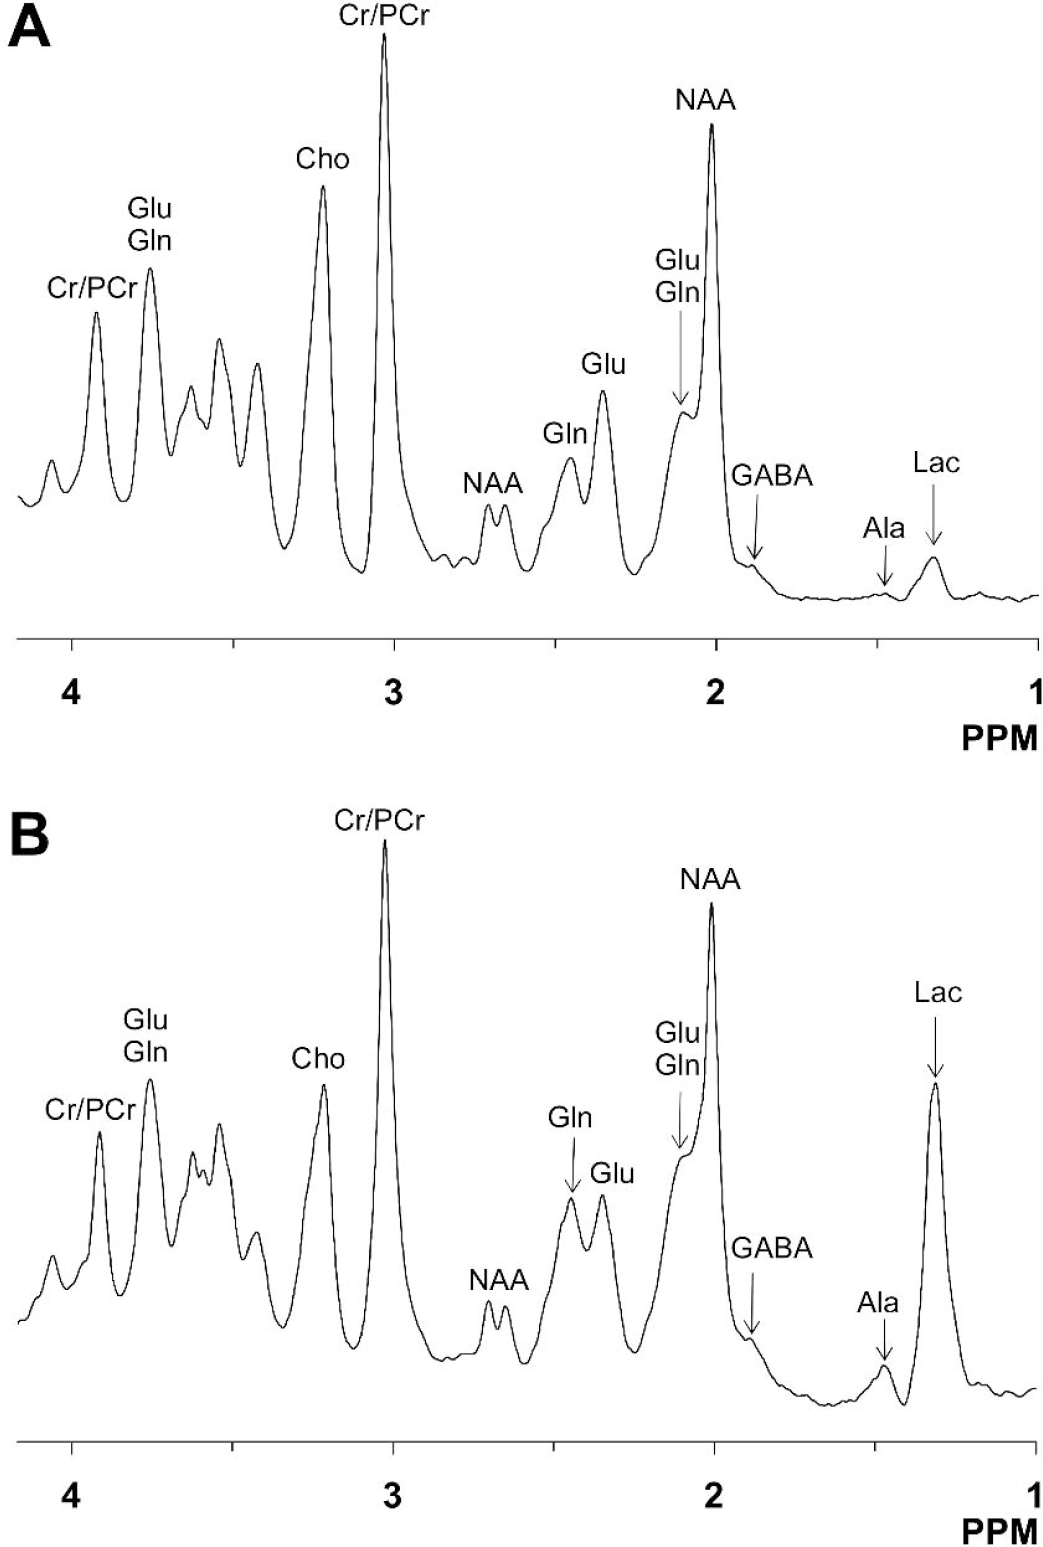
Representative in vivo NMR spectra obtained from control (
Concentrations (μmol/g) of cortical metabolites in control and bicuculline-treated rats
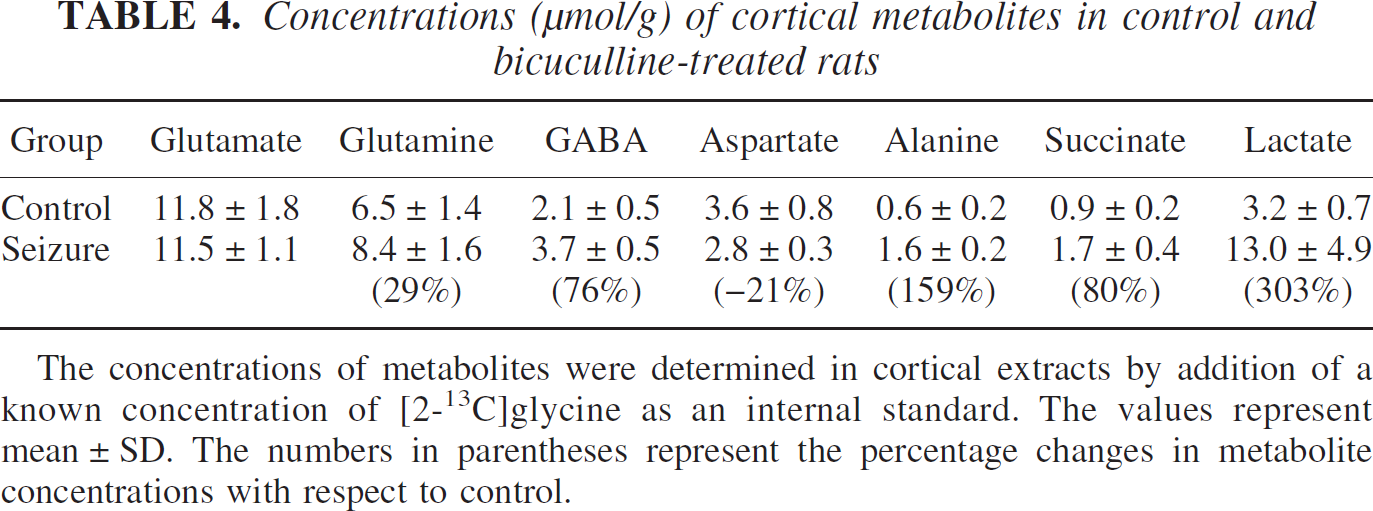
The concentrations of metabolites were determined in cortical extracts by addition of a known concentration of [2-13C]glycine as an internal standard. The values represent mean ± SD. The numbers in parentheses represent the percentage changes in metabolite concentrations with respect to control.
Percent 13C enrichment of cortical glutamate and glutamine in control and seizing rats after infusion of [1,6-13C2]glucose
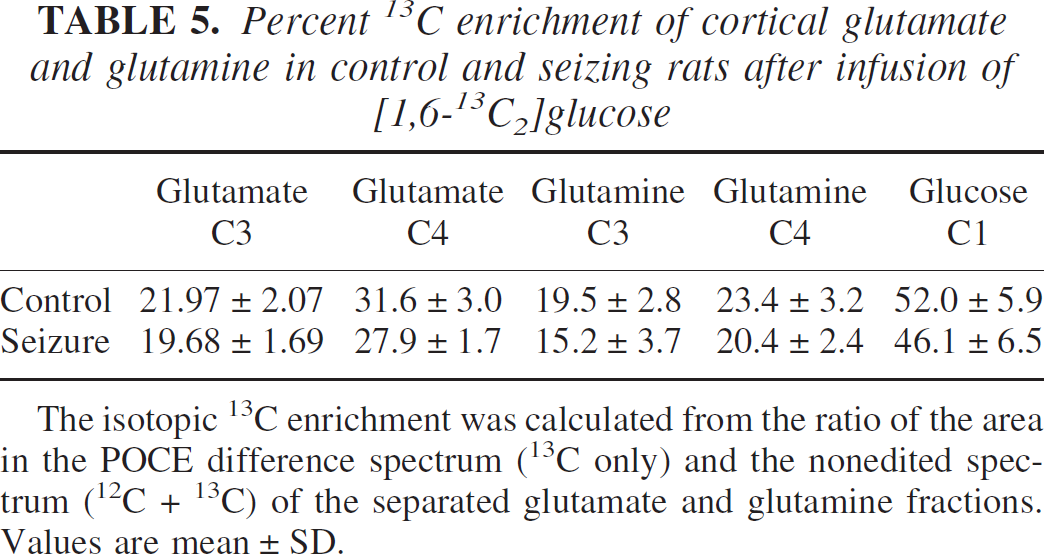
The isotopic 13C enrichment was calculated from the ratio of the area in the POCE difference spectrum (13C only) and the nonedited spectrum (12C + 13C) of the separated glutamate and glutamine fractions. Values are mean ± SD.
13C isotopic labeling of cortical metabolites in vivo
The in vivo time courses of 13C labeling of cortical metabolites in control and bicuculline-treated rats during infusion of [1,6–13C2]glucose are shown in Fig. 4. In both groups, prominent 13C isotopic labeling was detected in glutamate- and glutamine-C4 and unresolved carbon atoms, C2 and C3, with lesser intensities of aspartate-C3 and GABA-C4 (top traces in Fig. 4). In contrast to the control animals where cortical lactate levels were low, during seizures lactate-C3 (1.35 ppm) was detected in the first spectrum and the level remained elevated throughout the experiment (Figs. 4 and 6C). Glutamate-C4 (2.35 ppm) was detected within 6 minutes of the beginning of the [1,6–13C2]glucose infusion in both groups, whereas glutamine-C4 (2.46 ppm) lagged that of glutamate-C4 by 5 to 10 minutes. The C2 and C3 resonances of glutamate and glutamine increased throughout the infusion. In addition to these peaks, a smaller resonance from GABA-C4 was seen in both groups. However, the intensity of the 13C labeled GABA-C4 resonance was greater in seizing rats as compared to control.
Representative time courses of 13C-labeling of cortical metabolites in control (
Exchange rate between α-ketoglutarate and glutamate
The exchange flux between α-ketoglutarate and glutamate (Vx) was estimated from the 13C enrichment time courses of glutamate-C4 and C3 and aspartate-C3 in cortical extracts obtained ex vivo (Fig. 5A). The time courses were approximated by measurements of the enrichments at three different infusion times, two chosen to be early in the enrichment curve (7 and 17 minutes) and the third to be at or near isotopic steady state. The best fit of the two-compartment metabolic model to the enrichment data yielded an average value of 41 μmol·g−1·min−1 (95% CI, 5 to 109 μmol·g−1·min−1) and Vx/VTCAn = 79. An estimate of the interanimal variation of Vx by Monte-Carlo simulations yielded a broad non-Gaussian distribution skewed toward higher values of Vx (Fig. 5B). When the metabolic model was fitted to the experimental data by assuming a lower rate of exchange, Vx = 1 μmol·g−1·min−1, the fit was generally poor, with a value of overall least square SD of 14 compared with 7 for Vx = 43 and undershooting glutamate-C4 and overshooting aspartate-C3. The calculated minimum value of Vx was always found to be greater than VTCAn (Vx/VTCAn ≥ 5.4), although higher values could not be excluded because of the loss in sensitivity of the fit to higher values of Vx. The value of Vx was determined similarly during seizures (data not shown), which yielded a mean value of 21 μmol·g−1·min−1 (95% CI, 4.4 to 51.8 μmol·g−1·min−1) and Vx/VTCA of 37.
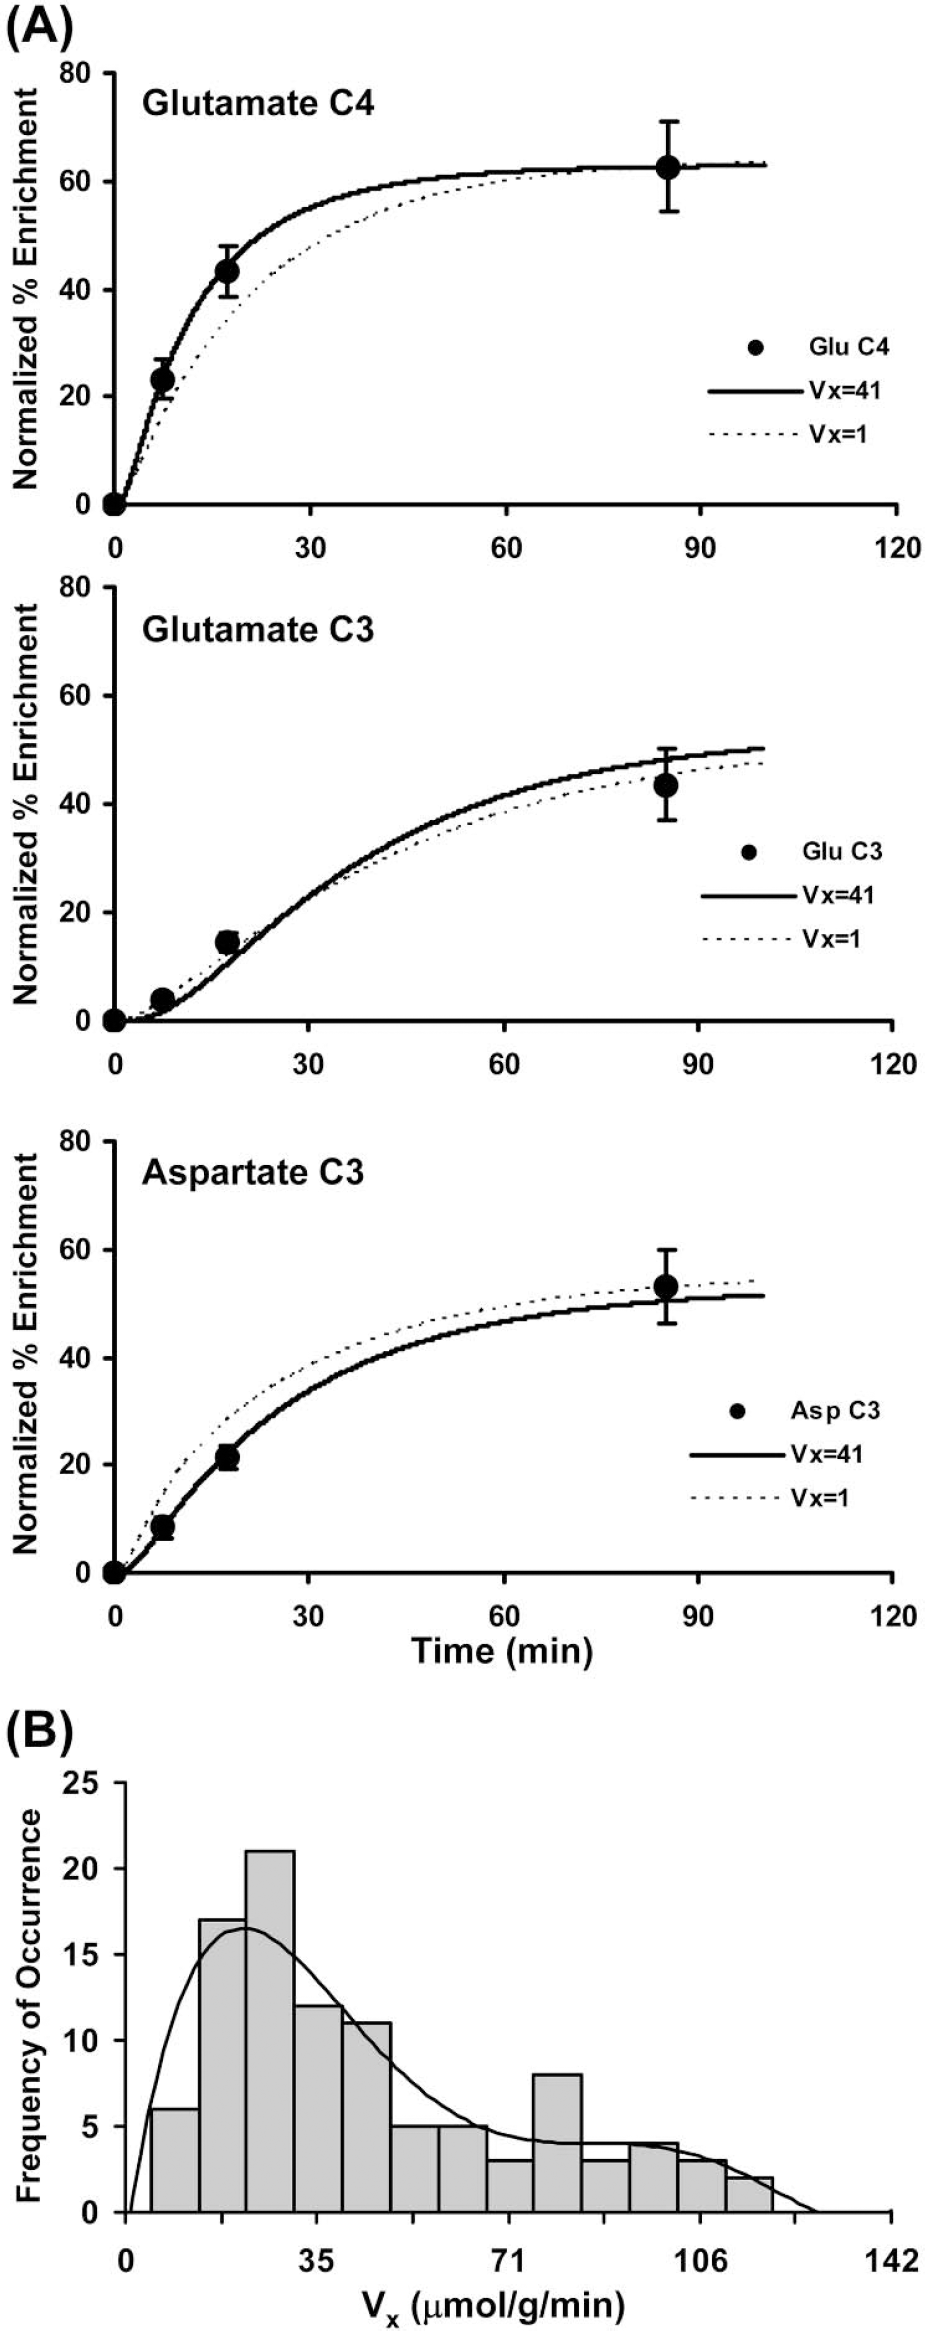
Calculation of the exchange rate (Vx) between α-ketoglutarate and glutamate using ex vivo measured 13C labeling time courses of amino acids. (
Glucose oxidation and glutamate/glutamine cycling during seizures
Seizures led to faster labeling of both glutamate and glutamine C4 from [1,6–13C2]glucose as compared to saline-treated controls (Fig. 6), consistent with an activity-dependent increase in glucose oxidation. A nearly proportional increase above the respective control values was observed between CMRglc(ox)N (214%, P = 0.005, seizures: 0.57 ± 0.07 versus 0.26 ± 0.03 μmol·g−1·min−1, control) and Vcycle(Glu/Gln) (233%, P = 0.005; seizures: 0.52 ± 0.07 versus 0.22 ± 0.04 μmol·g−1·min−1, control) during seizures (Table 6). CMRglc(ox)N was plotted against Vcycle(Glu/Gln) along with data reported from a previous study of the anesthetized, nonactivated rat cortex (Sibson et al., 1998) that were reanalyzed using the two-compartment model described in the present study (Fig. 7). As shown in Fig. 7, within the measurement error, the experimental data obtained in the present study lie on the line predicted from the earlier study. Thus, the linearity between Vcycle(Glu/Gln) and CMRglc(ox)N reported for graded anesthesia extends to intense activation, at least for seizures lasting 1 hour or less.
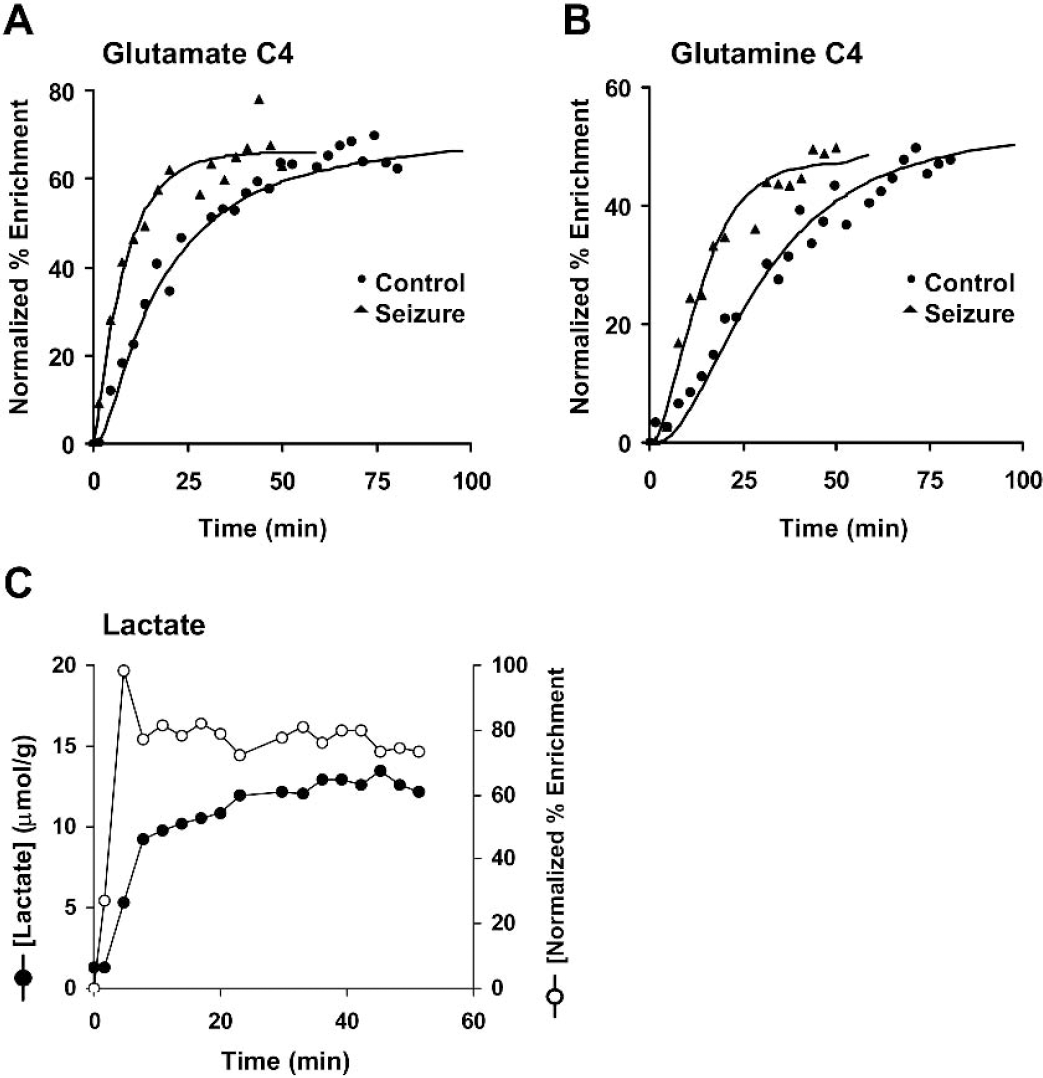
Typical in vivo time course of labeling of (
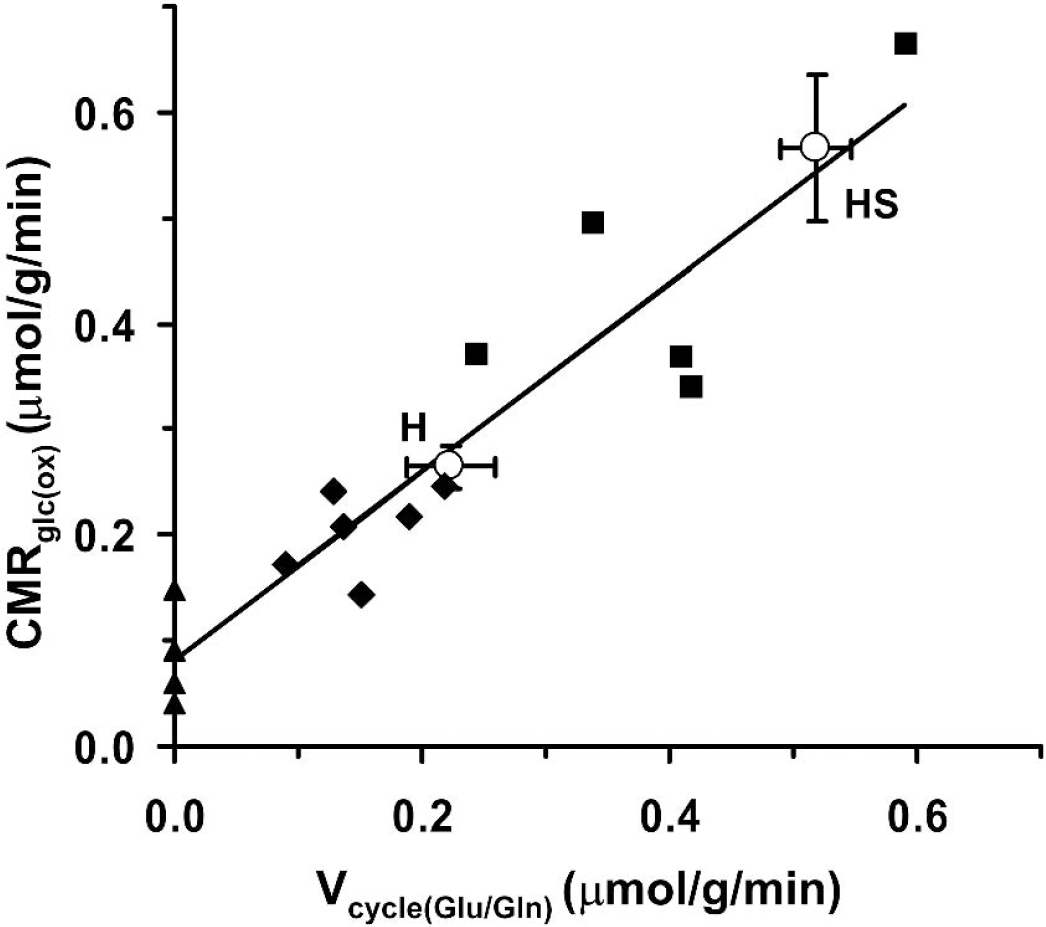
Correlation between the rate of neuronal glucose oxidation (CMRglc(ox)N) and glutamate neurotransmitter cycling (Vcycle(Glu/Gln)). The plot combines data from the present study (“O” circles) and the data reanalyzed from Sibson et al. (1998) (▴ = pentobarbital, ♦ = α-chloralose, ▀ = morphine). Line represents the linear regression analysis of Sibson et al. data with slope 0.89 (95% CI 0.67, 1.10) and y-intercept 0.08 (95% CI 0.03, 0.08). The data obtained from the current study (o) lie on the predicted line. H, halothane; HS, halothane plus seizures.
Effects of seizures on cerebral cortical metabolic fluxes (μmol·g·min−1)
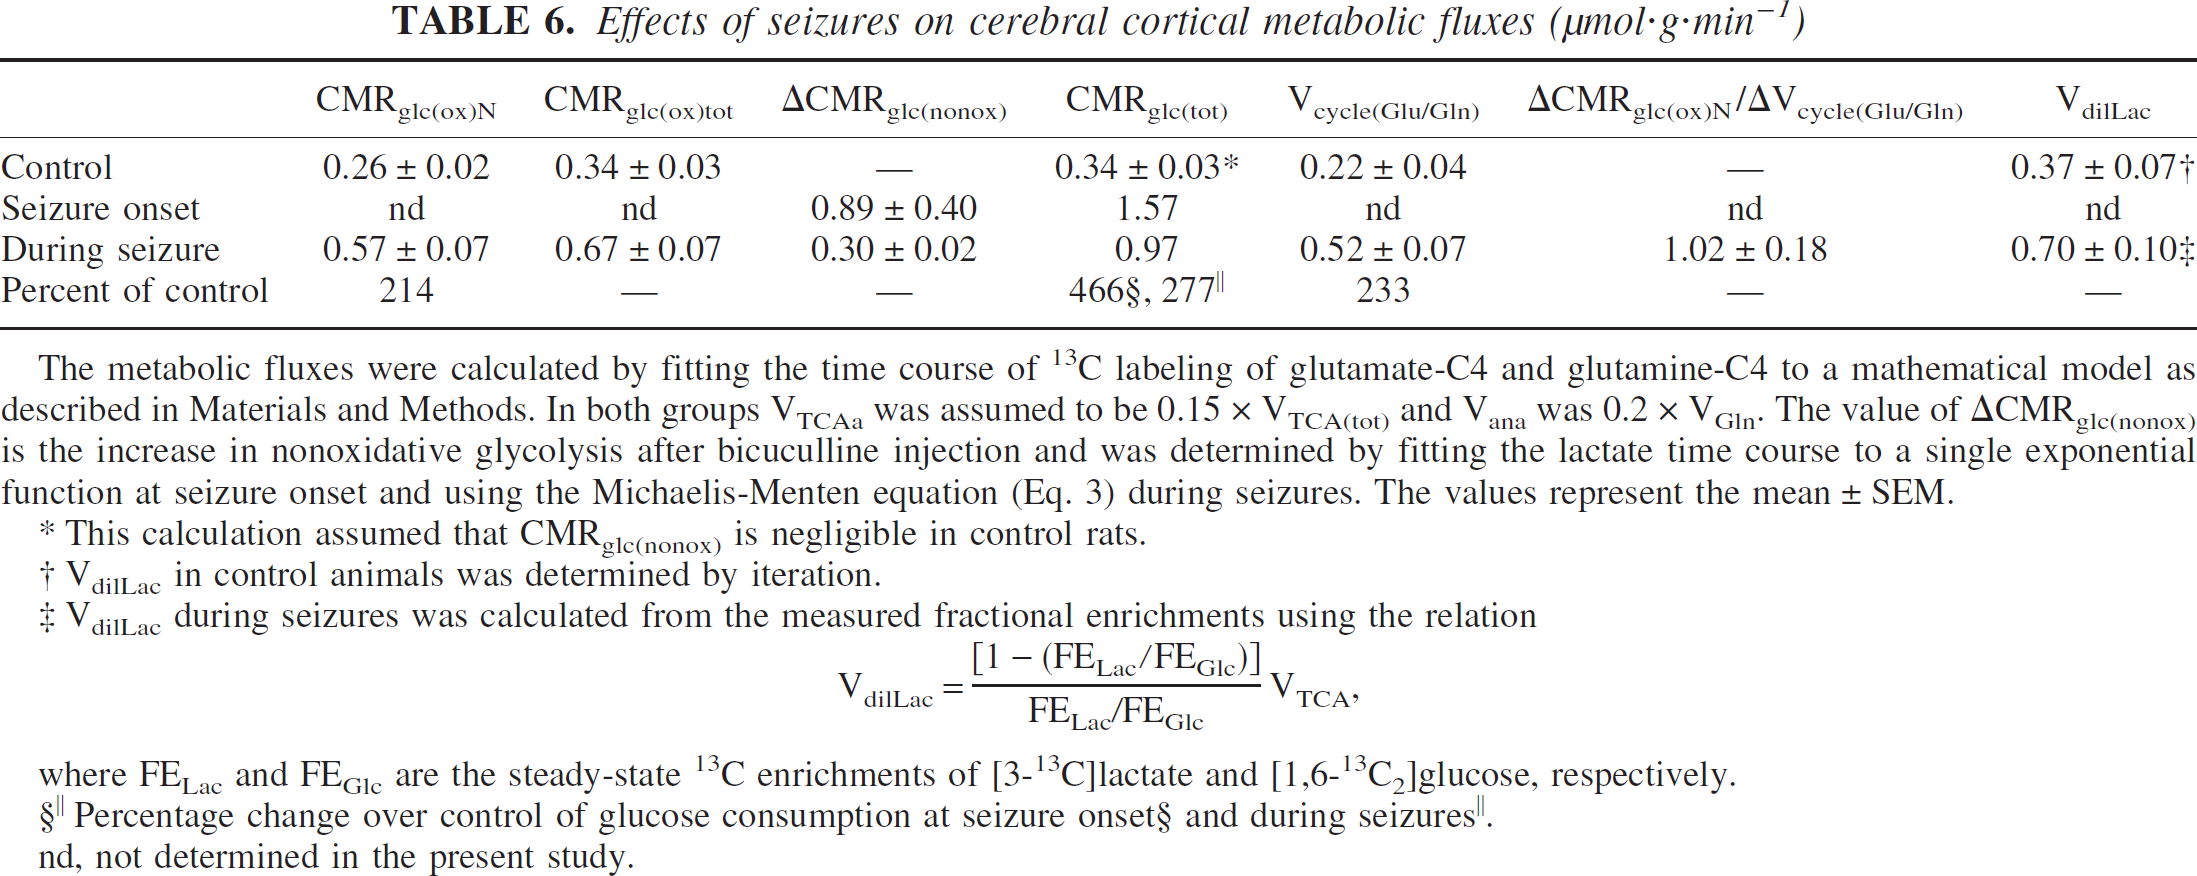
The metabolic fluxes were calculated by fitting the time course of 13C labeling of glutamate-C4 and glutamine-C4 to a mathematical model as described in Materials and Methods. In both groups VTCAa was assumed to be 0.15 x VTCA(tot) and Vana was 0.2 x VGln. The value of ΔCMRglc(nonox) is the increase in nonoxidative glycolysis after bicuculline injection and was determined by fitting the lactate time course to a single exponential function at seizure onset and using the Michaelis-Menten equation (Eq. 3) during seizures. The values represent the mean ± SEM.
This calculation assumed that CMRglc(nonox) is negligible in control rats.
VdilLac in control animals was determined by iteration.
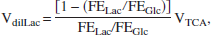
VdilLac during seizures was calculated from the measured fractional enrichments using the relation
Percentage change over control of glucose consumption at seizure onset§ and during seizures‖.
nd, not determined in the present study.
Total glucose utilization during seizures
Lactate levels increased rapidly in the cortex after bicuculline injection (Figs. 4B, 6C, and Table 4). The increase in lactate during the seizure represents the excess glucose (and astroglial glycogen), which is metabolized to pyruvate through the glycolytic pathway but not oxidized in the TCA cycle. The rate of total glucose utilization (CMRglc(tot)) attained its maximum value (1.57 μmol·g−1·min−1) at the seizure onset and decreased to 0.97 μmol·g−1·min−1 (62% of peak value) during the period when lactate levels had stabilized (Table 6). These values are somewhat lower than those reported in a previous study of bicuculline seizures in the rat cortex (Borgstrom et al., 1976), although the percentage changes were similar. Differences in absolute values between the two studies may reflect differences in depth of anesthesia or seizure intensity.
DISCUSSION
Although there is a broad consensus that glucose is the primary fuel for supporting brain function, there has been considerable debate on whether the energy required for neurotransmission is derived from glycolysis alone or the complete oxidation of glucose. Our previous findings of a near 1:1 proportionality between incremental changes in Vcycle(Glu/Gln) and CMRglc(ox)N in nonactivated cortex of anesthetized rats suggested that neuronal glucose oxidation supported the activity of glutamatergic neurons. Because these experiments were conducted on nonstimulated, anesthetized animals the question remained about the nature of the coupling at higher levels of activity. If the observed proportionality reflects a general molecular mechanism, coupling neuronal activity to energy metabolism, then it would be expected for transitions of cortical activity between any two states, independent of the absolute baseline values. The present finding that Vcycle(Glu/Gln) and CMRglc(ox)N increase proportionately during the intense neuronal activation of seizures supports this mechanism. The present data, combined with results from a previous study (Sibson et al., 1998), reveal a highly linear relationship between neuronal glucose oxidation and glutamatergic neurotransmitter cycling over a substantial range of neuronal activity (Fig. 7).
Relationship between glutamate/glutamine cycling and neuronal glucose oxidation
During seizures, changes in Vcycle(Glu/Gln) (233%) and CMRglc(ox)N (214%) were proportional. The ratio (ΔCMRglc(ox)N/ΔVcycle(Glu/Gln)) of 1.02 was within the 95% CI (0.67 to 1.06) obtained from the reanalysis of previously reported data for the anesthetized nonactivated rat cortex (Sibson et al., 1998).
Analysis of energy expenditure processes during excitatory signaling in rat cerebral cortex led Attwell and Laughlin (2001) to postulate that energy consumption should increase proportionately with the firing rate of glutamatergic pyramidal neurons. Bicuculline-induced seizures, which are characterized by intense bursts of neuronal activity, represent an extreme case of rapid pyramidal cell firing (Schiller, 2002; Siesjo, 1978). Recently Smith et al. (2002) reported that during somatosensory activation the changes measured in neuronal spiking frequency (Δν/ν) and oxygen consumption (ΔCMRglc(ox)N/CMRglc(ox)N) are proportional. Thus, the finding that ΔCMRglc(ox)N ≈ ΔVcycle(Glu/Gln), whether measured at states of lower neuronal activity or the heightened neuronal activity of seizures (present study), indicates that neuronal activity, neurotransmitter cycling flux, and oxidative glucose metabolism are coupled linearly over a substantial range of activity. The linkage to oxidative process during the electrographically defined periods of burst and suppression (Fig. 2) are not entirely clear, although it is likely that oxidative processes continue to replete energy stores during these apparently “silent” periods.
Influence of the α-ketoglutarate/glutamate exchange rate (Vx) on the measured fluxes
Isotopic labeling of cytosolic glutamate occurs principally through the decarboxylate exchangers present in the inner mitochondrial membrane (Griffin et al., 2000), although other pathways may exist (e.g., Kamzolova et al., 2000). As described by Mason et al. (1992), the α-ketoglutarate/glutamate exchange rate (Vx) reflects the rate of isotope movement between α-ketoglutarate and glutamate, which involves membrane carriers and/or transamination reactions. Accurate determination of VTCA requires knowledge of Vx. An estimate of Vx can be determined by simultaneously fitting the time courses of the relevant labeled species; i.e., glutamate (C4 and C3) and aspartate (C3). Only when Vx is not explicitly determined (and assumed to be some finite value) will there be uncertainty in the calculated value of VTCA; e.g., if it is assumed that Vx » VTCA but in fact Vx = VTCA, then the actual value of VTCA would be underestimated by at most 47% (Gruetter et al., 2001). Studies of the perfused heart and isolated heart mitochondria (Griffin et al., 2000; Kamzolova et al., 2000) indicate that the α-ketoglutarate/malate exchanger is the primary route of 13C labeling of the cytosolic glutamate pool and this exchanger is likely to be of similar importance in brain. We have shown in previous studies that Vx is several times faster than TCA cycle flux in the mature rat (Mason et al., 1992) and human cortex (Mason et al., 1995) but appears slower in the immature (postnatal day 10) rat cortex (Novotny et al., 2001). However, in all cases that we have reported, Vx/VTCA > 1. With Vx >VTCA, the majority of 13C label passes through the cytosolic glutamate pool en route through the TCA cycle. This interpretation is consistent with earlier findings using 14C-labeled isotopes (Balazs and Haslam, 1965; Haslam and Krebs, 1963) but is in contrast to more recent studies by Gruetter et al., who reported the fluxes to be equal or nearly so in rat brain (i.e., Vx /VTCA ≈ 1) (Choi et al., 2002; Henry et al., 2002) or even <1 in a preliminary report of the mouse brain (Nehiri et al., 2003). Under these conditions, glutamate becomes a less efficient isotope trap, reducing the apparent rate of C4 labeling while increasing C3 labeling. The calculated value of VTCA from glutamate-C4 becomes dependent on the relative value of Vx. Measurement of time courses of both glutamate-C3 and C4 and simultaneously fitting both carbon positions (C3 and C4) circumvents this issue.
In the present study, the overlap of glutamate and glutamine-C3 in the 1H spectrum precluded the assessment of Vx using the in vivo spectra. This fact, and the reported observations by Henry et al. (2002) that the determination of Vx is highly sensitive to relatively small errors in the glutamate-C3 labeling curves measured in vivo, led us to determine Vx using the 13C enrichments of glutamate-C4, C3 and aspartate-C3 measured in the cortical extract ex vivo (Fig. 5). Fitting the same two-compartment metabolic model to the ex vivo 13C-enrichment data gave a high value of Vx in the cortex of both control (41 μmol·g−1·min−1, 95% CI, 5 to 109 μmol·g−1·min−1) and bicuculline-treated rats (21 μmol·g−1·min−1, 95% CI, 4.4 to 51.8 μmol·g·−1·min−1, data not shown). In contrast to the good fit obtained for Vx » VTCA, a poor fit was obtained for glutamate-C4 and aspartate-C3 under the assumption that Vx ≈ VTCA (Fig 5, broken line). The difference in the calculated value of VTCA based on the best-fit value of Vx (45 μmol·g−1·min−1) was 8% less than that determined by allowing Vx equal to VTCA. Thus, under the conditions of this study the value of Vx, whether greater than or equal to VTCA, introduced only a small uncertainty in VTCA.
In studies of the perfused heart, the reported range of values for Vx (see Sherry et al., 1998) depend on substrate. Most information of the exchange process at the molecular level is derived from heart studies, which differ from brain in terms of substrate preference (e.g., fatty acids versus glucose) and relative importance of the malate-aspartate shuttle and the activities of its carriers. Studies directed specifically at brain mitochondria should help to resolve this issue.
Influence of non–steady-state behavior during seizures on the measured fluxes
A study of bicuculline seizures by Meldrum and Nilsson (1976) showed that cerebral oxygen consumption (CMR
Coupling between astroglial glutamate uptake and glucose utilization
An activity-based coupling mechanism that is consistent with the experimentally determined 1:1 proportionality between ΔVcycle(Glu/Gln) and ΔCMRglu(ox)N has been advanced by Magistretti et al. (1999). Neuronally released glutamate is cleared from synaptic regions mainly by uptake into surrounding astroglia by the Na+-dependent glutamate transporters, GLT1 and GLAST (Cholet et al., 2001; Rothstein et al., 1996). Glutamate uptake and cotransported sodium ions (glutamate:Na+ = 1:3) activate the Na+/K+-ATPase, which stimulates glycolysis producing two molecules of ATP (net) and lactate per molecule of glucose. Lactate released from astroglia would be transported to neurons and oxidized there. Because two molecules of ATP would be required to restore the Na+ gradient by Na+/K+-ATPase (3 Na+ : 1 ATP) and metabolize glutamate to glutamine by glutamine synthetase (glutamate→glutamine : 1 ATP) for each molecule of glutamate entering astroglia, in principle astroglial glycolysis could provide this energy. Although this mechanism provides an explanation for the experimentally observed flux proportionality, other possibilities exist. As discussed by Dienel and Hertz (2001), the oxidation of glucose or glutamate in astroglia would be more than sufficient to produce the small amount of ATP required to support the astroglial metabolic reactions in the glutamate/glutamine cycle. Although evidence that Na+/K+-ATPase uses glycolytic ATP over that produced by oxidation has been reported from studies of some cellular systems (Balaban and Bader, 1984; Jung et al., 2002; Proverbio and Hoffman, 1977), no direct evidence has been reported for such an interaction in the CNS.
Our results indicate that during seizures, neuronal glucose oxidation (CMRglc(ox)N) and not total glucose utilization (i.e., CMRglc(ox) + CMRglc(nonox)) is proportional to Vcycle(Glu/Gln) (Table 6). Under nonactivated conditions, glucose oxidation is >90% complete so that CMRglc(total) ≈ CMRglc(ox). In contrast during intense neuronal activation excess lactate production is observed such that total glucose utilization exceeds glucose oxidation in the early period of the seizures (Table 6). Shulman et al. (2001) have proposed that excess lactate production and the decreased oxygen-to-glucose ratio during intense activation could be explained by increased nonoxidative glucose consumption to support rapid neuronal firing. The increased fraction of glucose uptake above that supporting oxygen consumption (nonoxidative glycolysis) would be effluxed from the brain as lactate. The increased ATP required by astroglia for restoration of the Na+ gradient and conversion of glutamate to glutamine (2 ATP) due to the increased glutamate/glutamine cycling could be met by glucose shunting through glycogen or by increased glycolysis. Because the rate of neuronal oxidation for a specific glutamate release would be the same, independent of the path taken by glucose in the astroglia, the extra lactate/pyruvate would not be oxidized and thus would accumulate as lactate. The increased fraction of glucose consumed either glycolytically or shunted through glycogen (and thus the level of lactate observed) would depend on the intensity and frequency of neuronal firing. The increased nonoxidative contribution was proposed to satisfy the need for rapid ATP production so as to meet the power requirement of millisecond neuronal firing. Although evidence for increased astroglial glycogen turnover during brain activation has been reported (Swanson et al., 1992), nonoxidative glycolytic production of ATP could be supplied equally well by excess glycolysis, so the mechanism remains an open question. However these explanations indicate that the excess lactate produced by the nonoxidative pathway must be effluxed totally in order for oxidative glycolysis to be the universal mechanism.
Energetics of oxidative and nonoxidative glucose metabolism during seizures
The rapid rise of lactate during seizures is well described in the literature (Blennow and Siesjo, 1985; Blennow et al., 1978; Chapman et al., 1977; Folbergrova et al., 1981). Lactate rise resulting from nonoxidative glucose utilization was greatest immediately after seizure onset and declined after several minutes. In the present study excess lactate production (nonoxidative glycolysis), when expressed in glucose equivalents, contributed 57% (100 × 0.89 / 1.57) of CMRglc(tot) after seizure onset and declined to 31% (100 × 0.30 / 0.97) as lactate levels stabilized (Table 6). The calculated net contribution of ATP produced by glycolysis during seizures is small in comparison to that produced by mitochondrial oxidative phosphorylation (Table 7). In the absence of glycogen shunting glycolysis (CMRglc(ox)tot + CMRglc(nonox)) could account for a maximum of approximately 11% of ATP production at seizure onset while declining to 7% when glucose and oxygen consumption are balanced. However, if excess lactate reflects glycogen shunting of the metabolized glucose in the astroglia, then net glycolytic ATP production would be only approximately 6%, equivalent to the net ATP produced by glycolysis for the complete oxidation of glucose.
Contribution of ATP supplied by glycolysis (nonoxidative pathway) versus mitochondrial oxidative phosphorylation during seizures
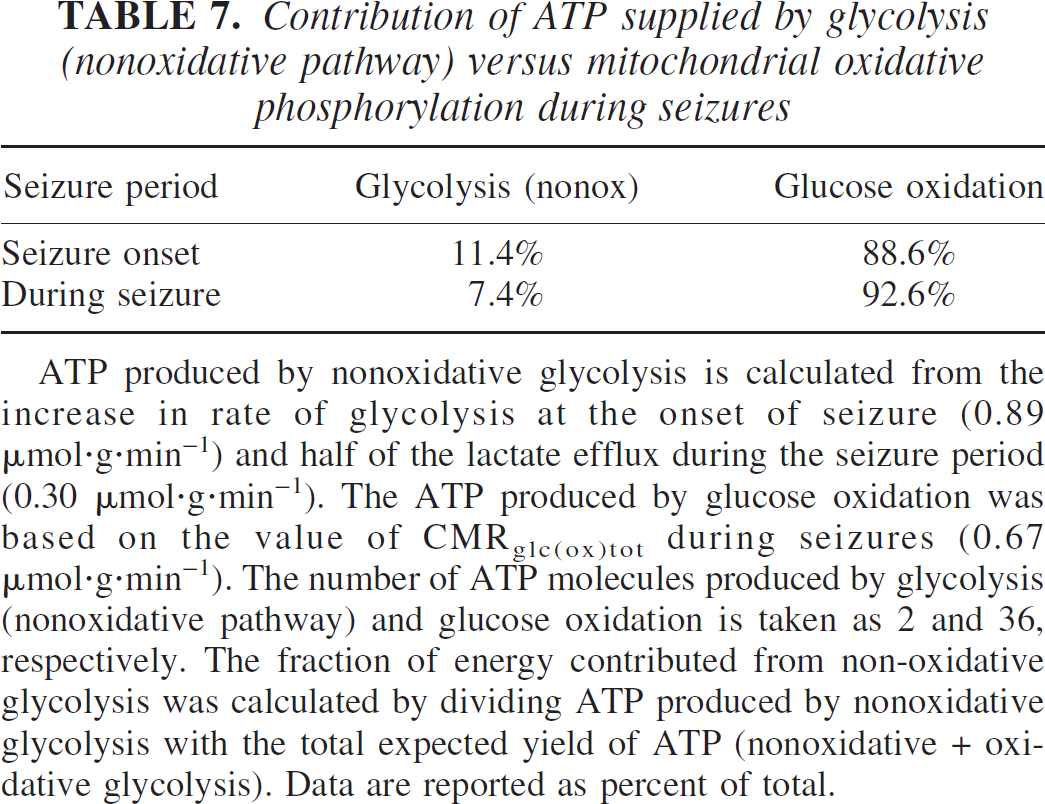
ATP produced by nonoxidative glycolysis is calculated from the increase in rate of glycolysis at the onset of seizure (0.89 μmol·g·min−1) and half of the lactate efflux during the seizure period (0.30 μmol·g·min−1). The ATP produced by glucose oxidation was based on the value of CMRglc(ox)tot during seizures (0.67 μmol·g·min−1). The number of ATP molecules produced by glycolysis (nonoxidative pathway) and glucose oxidation is taken as 2 and 36, respectively. The fraction of energy contributed from non-oxidative glycolysis was calculated by dividing ATP produced by nonoxidative glycolysis with the total expected yield of ATP (nonoxidative + oxidative glycolysis). Data are reported as percent of total.
A common interpretation of the lactate concentration is that it reflects the total amount of nonoxidative glucose consumption, either by glycolysis alone or by shunting through glycogen. This interpretation would be valid during the initial rise of lactate after a sudden increase in activity (at the onset of seizures in the present experiment) but not at steady state when the concentration of lactate levels off. Lactate is a substrate for the membrane-bound monocarboxylate transporter (Magistretti and Pellerin, 1996). When lactate levels off and the rate of pyruvate oxidation is constant, lactate efflux through the monocarboxylate transporter must balance excess (nonoxidized) glycolysis. Thus, the lactate concentration reflects this balanced condition serving to drive efflux through the monocarboxylate transporter until the rate of efflux balances its synthesis. The rate of lactate efflux from brain, as determined by the Michaelis-Menten constants for lactate transport and the lactate concentration, was related to excess glucose uptake in the rat and human brain (Shulman et al., 2001). Although more data are needed to evaluate this mechanism quantitatively, it appears likely that the excess glucose consumed during cortical stimulation provides the rapid energy needed to power the millisecond firing of neurons and is effluxed as lactate. This mechanism accounts for the excess of glucose uptake and supports the present observation of neuronal glucose oxidation being linear with glutamate neurotransmitter release over the measured range of brain activity.
Implications for functional activation studies
Functional magnetic resonance imaging measures the change in image intensity associated with increases in CBF and CMR
Footnotes
Acknowledgments:
The authors thank Ms. Bei Wang for the skillful preparation of the animals used in the study, Dr. Paul Maciejewski for the statistical analysis, and Terry Nixon, Peter Brown, and Scott McIntyre for technical support.