
Abstract
Functional transcranial Doppler (fTCD) has been used for the identification of cerebral hemispheric dominance in various cognitive tasks. In our study, we have used fTCD with the aim to compare blood flow patterns in the hemispheres not only during the task activation periods but also in the post-stimulus phase. Normal volunteers, 25 right and 25 left-handed, were included. Mean flow velocities (FVs) in the bilateral middle cerebral arteries were recorded during the performance of six cognitive tasks and during the intervals between tasks. The lateralization index (LI) was calculated separately for each test (LI1-6), on the basis of the percent change of blood FV from baseline. To estimate flow fluctuations, a novel index, the LI-variability, was also calculated using a formula constituted by the minimum and maximum mean values recorded at specific time intervals during the entire procedure. Laterization indices, LI-3 and LI-4, corresponding to word generation and reading aloud tasks, produced the highest degree of activation. A perfect agreement (Cohen's κ = 1.000, P < 0.001) was observed among LI-3, LI-4, and LI-V. The repetition of recordings gave excellent test—retest reliability in 10 randomly selected participants. Our results suggest that the hemisphere that is characterized as dominant by fTCD maintains a more stable flow pattern during the performance of successive cognitive tasks. Although it could not be considered as a clinically useful tool as yet, this observation introduces a novel parameter such as the stability of blood flow over time, which could potentially provide insight in the study of cerebral functions.
Introduction
Functional transcranial Doppler (fTCD) has been used to define hemispheric dominance for language, music, visuospatial tasks, and memory (Droste et al, 1989; Kelley et al, 1992; Markus and Boland, 1992; Hartje et al, 1994; Rihs et al, 1995; Knecht et al, 1996; Klingelhofer and Sander, 1996; Deppe et al, 1997; Schuepbach et al, 2005). In response to focal brain activation during specific tasks, changes of blood flow velocities (FVs) are observed in the large basal cerebral arteries. These changes can be recorded and correlate well with cerebral blood flow (CBF) changes in the corresponding areas. Thus, TCD can be used for the noninvasive monitoring of CBF under the condition that the vessel diameter remains constant during measurements and several studies have indicated that this condition is most probably fulfilled (Giller et al, 1993; Serrador et al, 2000). Therefore, it is generally accepted that the regional CBF modifications caused by physical stimulations are nearly proportional to velocity changes in the large basal cerebral arteries (Deppe et al, 2004).
In studies comparing fTCD with other functional methods, a highly significant correlation for the identification of cerebral lateralization was shown between fTCD and intracarotid amobarbital (Wada test) procedure (Knecht et al, 1998) or fTCD and functional MRI (fMRI) (Deppe et al, 2000). This strong correlation establishes the use of fTCD as a noninvasive and practical tool for the determination of language dominance and psychophysiologic research (Deppe et al, 2004; Duschek and Schandry, 2003). Functional transcranial Doppler can assess FV changes at a high temporal resolution, a capability that is the greatest asset of this method compared with other functional imaging techniques. By using special cognitive tasks and simultaneous recording of FV in selected intracranial arteries, fTCD allows continuous recording of FV changes as well as quantitative assessment of FV fluctuations. During performance of a cognitive task, an increase in the mean FV is observed in the selected arteries on both sides; the greatest FV increase, however, is observed on the side that is the dominant one for each specific task performed. A lateralization index (LI), which reflects the FV difference, can easily be calculated for every cognitive task.
All previous fTCD studies have reported results based on the percentage change of blood FV from baseline. In this study, we have focused on the fluctuations of FV during the entire duration of the examination and for this purpose we have created a novel LI, henceforth mentioned as LI-V (V = variability). We calculated this index based on the observation that FV values below the initial baseline can be recorded immediately after the end of activation (‘post-stimulus’ period), a phenomenon that has been called ‘undershooting reaction’ (Klingelhofer and Sander, 1996).
The aim of our study was to examine whether there are significant differences in the magnitude of cerebral blood FV changes between dominant and nondominant hemispheres, by objectively quantifying the blood FV fluctuations, including the ‘undershooting reaction’ in this setting.
Materials and methods
Subjects
We studied healthy adult volunteers, 21 to 44-years old, without any known risk factors for cerebrovascular disease or any underlying neurologic disorder – in particular, no history of perinatal asphyxia, head trauma, loss of consciousness, epileptic seizures, meningitis, encephalitis, or disturbed language development. All participants had completed postgraduate education; 38 were members of our medical staff, seven were school teachers, three lawyers, and two architects. An informed consent was obtained from each one of the participants and the study was approved by the institutional ethics committee. As part of the initial selection process, all volunteers were subjected to a clinical neurologic examination and to an extracranial vessel investigation using a color-coded duplex sonography. Abnormal findings on clinical exam or extracranial duplex testing, or the presence of any morbitidy led to the exclusion of the subject from the study. The Edinburgh Inventory (Old-field, 1971) was administered to all subjects, and those with a positive score (E index: 0 to 100, right-handed) were classified as Group A, whereas those with a negative score (E index: −100 to 0, left-handed) were classified as Group B. Within Group A, we defined a subgroup (Á1) composed of those demonstrating a strong right-hand dominance (E index: 90 to 100).
Cognitive Tasks
A series of standard neuropsychologic cognitive tasks were used for prescreening evaluation. The tasks were performed in the presence of a trained speech-language pathologist (HP) as well as a psychiatrist (AS). These tests were developed in the Neuropsychology Unit of the Department of Neurology (University Hospital of Zurich, Switzerland), and were adapted for use in the Greek language. The cognitive tasks used for the fTCD measurements are parts of acknowledged and validated tests, used regularly in the Neuropsychology Unit of the Neurology Department (Aristotle University of Thessaloniki), such as the Cambridge Cognitive Examination (CAMCOG), the Alzheimer's Disease Assessment Scale (ADAS), and the Aachen Aphasia Test (AAT), The choice of the specific tasks and their modifications were based on previous fTCD or fMRI studies (Rihs et al, 1999; Benson et al, 1999; Pujol et al, 1999; Binder et al, 1996). Custom-tailored software was developed accordingly and included four different tasks that specifically target language activation: (1) word comparison task (synonyms), (2) fluency task, (3) word generation task (word production from letter and word-verb generation task), and (4) reading aloud task. Two additional cognitive tasks (face-naming and short-term memory examination tasks) that do not specifically target language activation were employed to obtain comparative data and investigate the range of recorded values. Before the examination, each task was clearly explained to the participants. Tasks of a 60 secs duration each were successively presented in a high-resolution screen in a standard distance of 1 m in front of the examination seat, with an equal resting period in between. The duration of the entire examination was 11 mins.
Transcranial Doppler Studies
The task completion was performed in a dark, sound-insulated room, and a sitting position was elected. A Multidop T2® TCD device (DWL Elektronische Systeme, Sipplingen, Germany) with 2 MHz probes fixed on both temporal regions with a rubber ribbon was used. The technique used for probe adherence was easily reproducible and was performed in the same way for all individuals and for both sides alike. The FV of bilateral middle cerebral artery (MCA) were simultaneously recorded at 55 mm depth via the transtemporal ultrasound window. A sample volume of 5 mm was elected with a view to the best possible recording of MCA, thus avoiding ICA simultaneous recording. Recording of baseline values during a period without any activity was performed before task execution. Normal baseline FV values (Tegeler et al, 1996; Hennerici and Meairs, 2001) was a necessary precondition before proceeding to activation tasks. Before commencement of performing the tasks, there was a 5 mins trial recording to ensure the stability of the probes, followed by a 10-mins interval. The commencement of the test included initially the recording of baseline values. The mean blood FVs of the MCAs bilaterally were simultaneously recorded in real time and all data were stored in the hard drive of the TCD machine. A cue was used to mark the start and the end of each cognitive task.
Processing Analyses and Calculations of Lateralization Indices
Data were analyzed in the offline mode. On the basis of time measurements and the cues marking the start and end of each task, we defined the intervals corresponding to the performance of each task in the recorded diagram. We also determined the intervals of inactivity and the breaks between task presentations. The average mean FVs of the right (R) and left (L) MCA were automatically calculated by the machine software after the diagram of the specific time intervals was defined.
The LIs were calculated based on the difference between the percentage change of FV values from baseline in the two hemispheres (see Appendix A). The LI for each cognitive task was calculated separately and was given a different code. Thus, the LI for the word comparison task was coded as LI-1, for the fluency task as LI-2, for the word-verb generation task as LI-3, for the reading aloud task as LI-4, for the face naming task as LI-5, and finally for the short-term memory examination task as LI-6.
To better evaluate the fluctuations of blood FVs, we calculated the LI-V, based on the difference between the maximum and minimum average mean FV values recorded during the entire duration of the examination (Appendix A). The average value of the mean FV was calculated automatically by the software for each specific interval, including the periods of task completion and inactivity. Our own machine edition software was used instead of the specific average program as described by Deppe et al (1997) facilitating fast acquisition and detailed analysis of all data collected.
Reproducibility
By random sampling, we identified 10 participants from the entire study population who were subjected to the test twice. The recordings for all tasks were statistically analyzed to estimate the test—retest reliability.
Statistical Analysis
Statistical analysis of the data was performed using the Statistical Package for Social Sciences (SPSS Inc., version 11.0; Chicago, IL, USA). Categorical variables were expressed using frequencies (percentages) and continuous variables were expressed using their median (range). The Shapiro—Wilk test was used to correct nonnormal distribution of the LI values. The χ2-test was used to evaluate the relation between categorical variables. Non-parametric Spearman's (ρ) correlation coefficient was employed to assess the relation between continuous variables (i.e., the values of the indices), because none of them was normally distributed, while Cohen's kappa (κ) method was used to measure the agreement between the LI values (positive—negative). The results were considered to be statistically significant for values of P < 0.05.
For the assessment of the test—retest repeatability the Wilcoxon sign ranks test was first used to determine differences between the first and second measurements of each LI, to show that, on average, there is no significant difference between the first and second measurements, which indicates that there is no evidence of any bias in the results. It was followed by the calculation of the British Standards Institution (BSI) repeatability coefficient and the corresponding limits of agreement (= 2 s.d. and [
Results
Fifty volunteers were enrolled in the study. Eight were excluded because of nonsatisfactory recordings during the trial period (i.e., no full coherence for the duration of the procedure, failure of good probe adherence during the whole period). The remaining 42 participants included 20 men and 22 women; their mean age was 30.4 ± 4.9 years (range: 21 to 44 years). The Edinburgh Inventory score was positive in 25, who were classified into Group A, and negative in 17, assigned in Group B. In Group A, 14 subjects were identified as strongly right-handed and constituted subgroup A1. Between groups A and B there were no statistically significant differences with regards to age (29.5 ± 4.4 years versus 31.7 ± 4.7 years, P = 0.130) and baseline values of the mean FVs of the bilateral MCAs (P = 0.307 for Vmean in left MCAs; and P = 0.266 for Vmean in right MCAs).
The LIs of Group A (right-handed subjects, n = 25) were analyzed to determine whether they had positive or negative arithmetic values. The frequencies of positive values for each LI are shown in Table 1. The LI-V values were negative in the same subjects in whom the corresponding LI-3 and LI-4 were positive. Using Cohen's κ coefficient to measure the agreement among all indices, a perfect agreement (κ = 1.000, P < 0.001) among the LI-3, LI-4, and LI-V was observed (Table 1).
We then calculated the correlation between the arithmetic values of indices LI-1 to LI-6 and the values of LI-V and E Index of Group A subjects using the Spearman's ρ correlation coefficient. The LI-V showed significant negative correlation with LI-4 (ρ = 0.480, P = 0.015). These arithmetic correlations between each pair of LIs are shown in Table 2.
Group A: frequencies of positive values for each LI and Cohen' κ agreement
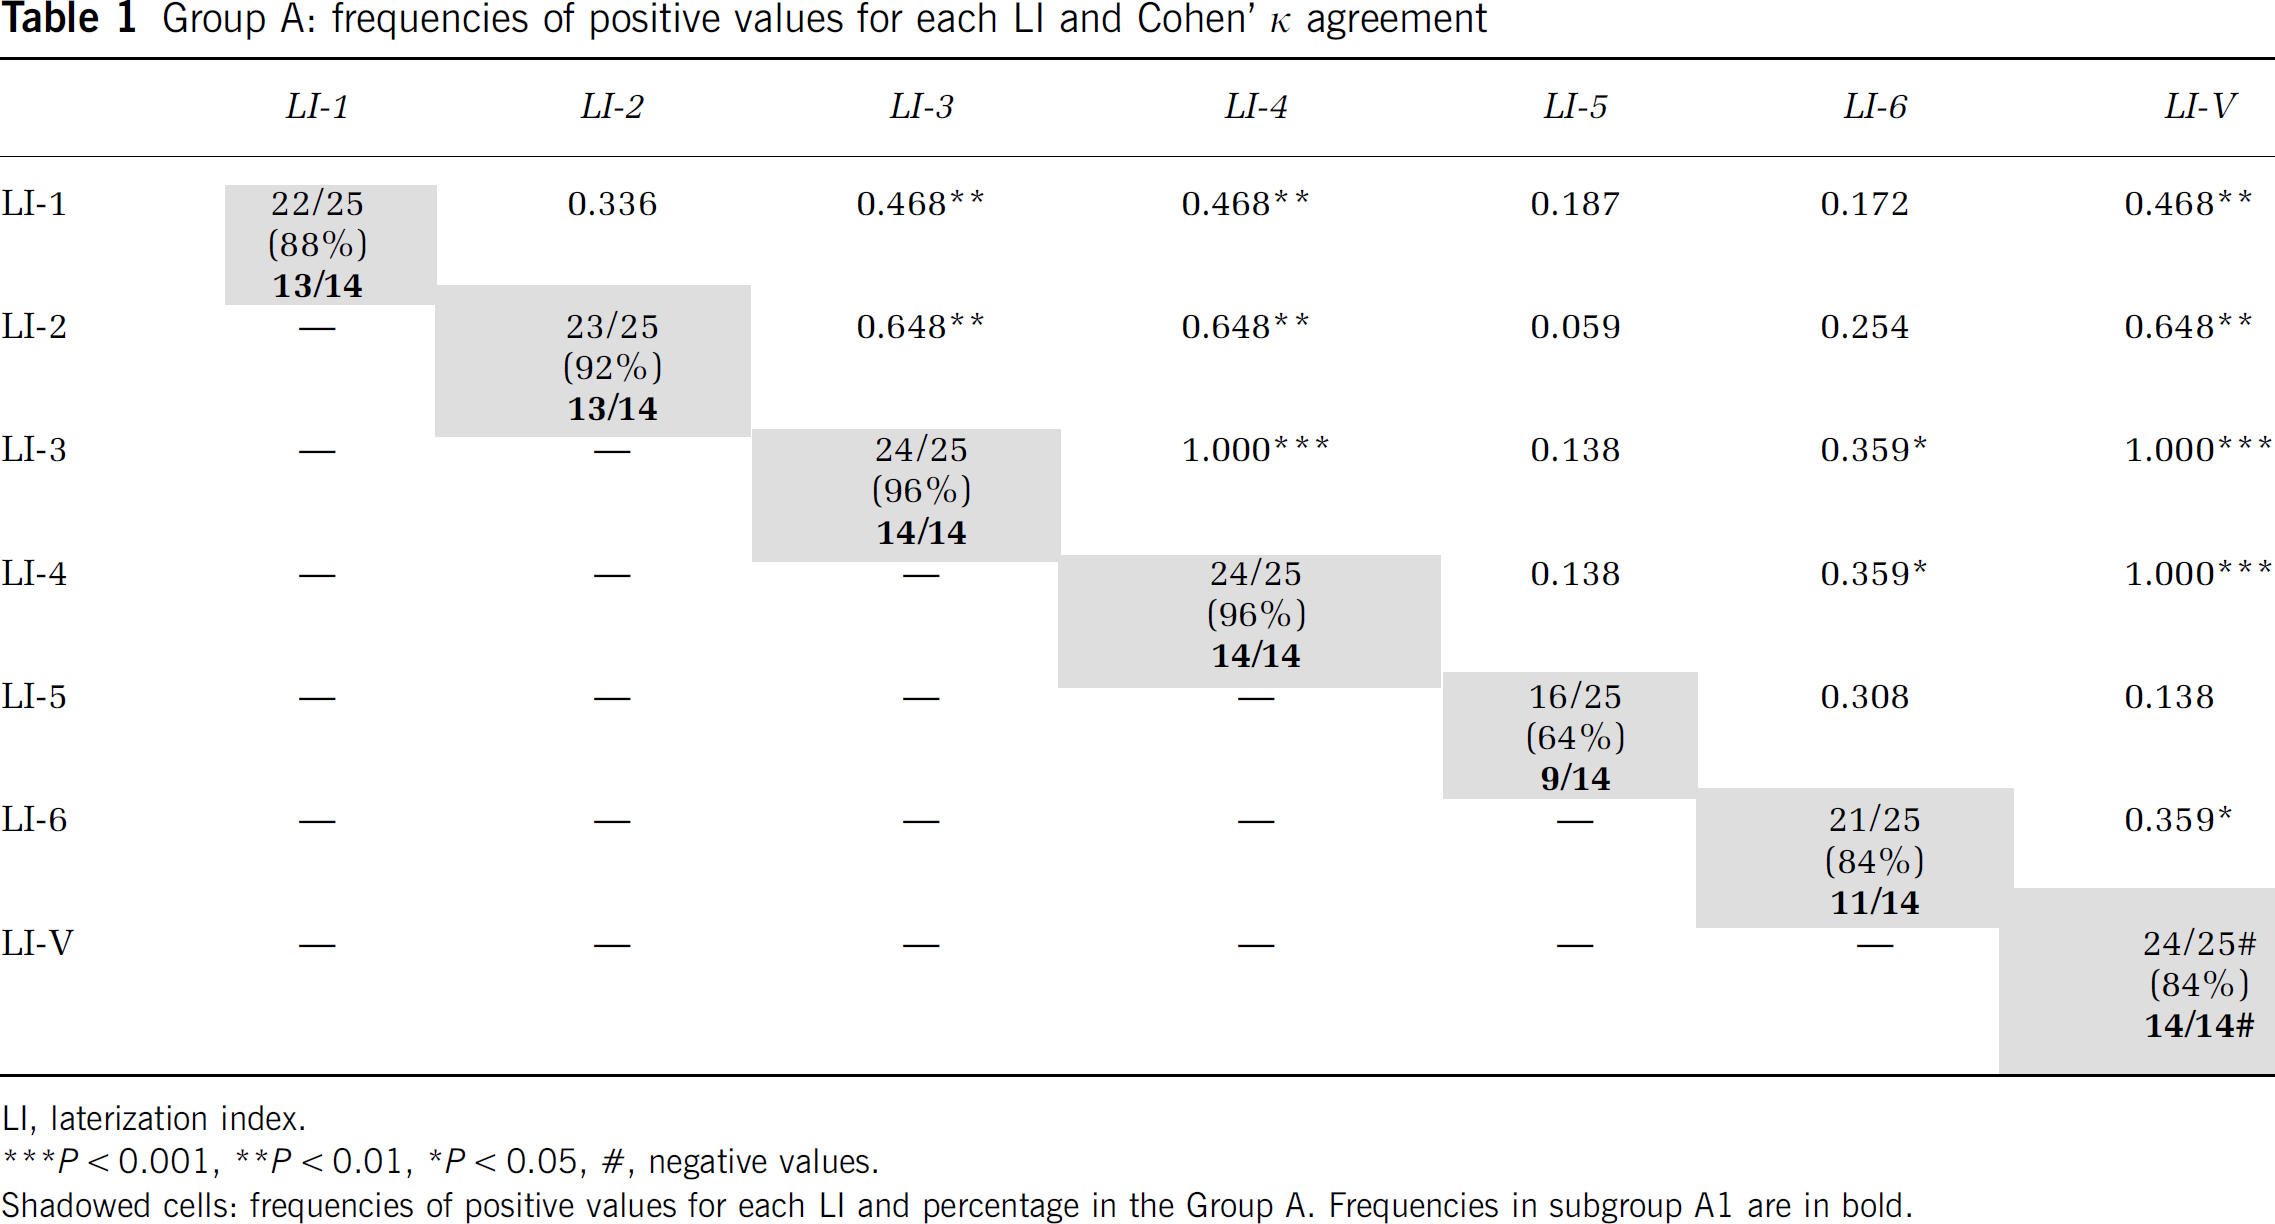
LI, laterization index.
P < 0.001,
P< 0.01,
P< 0.05,
negative values.
Shadowed cells: frequencies of positive values for each LI and percentage in the Group A. Frequencies in subgroup A1 are in bold.
Group A: Spearman's ρ index among the LIs
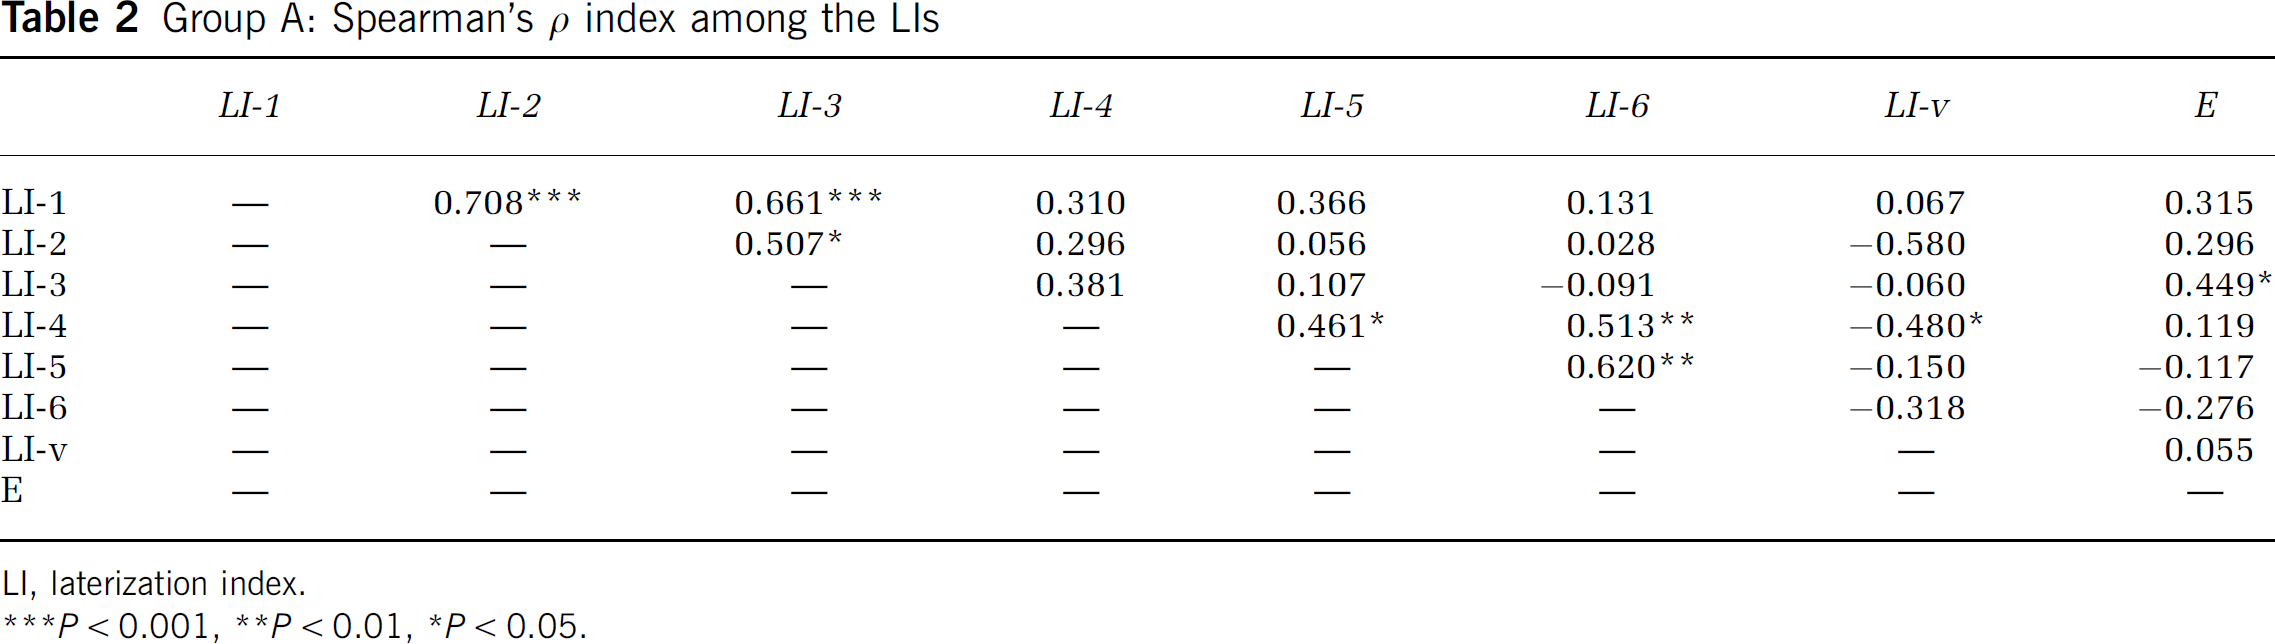
LI, laterization index.
P < 0.001,
P< 0.01,
P< 0.05.
The values of all indices were then analyzed further for only the participants of subgroup Ál(n = 14). The frequencies of positive values for LI-3 and LI-4 were 14 out of 14 examined (100%) and the values of LI-V were also negative in all 14 (100%). A perfect agreement (Cohen's κ = 1.000, P < 0.001) was observed among LI-3, LI-4, and LI-V (Table 1).
The LIs of Group B (left-handed subjects, n = 17) were also analyzed to determine whether they had positive or negative arithmetic values (Table 3). The values of LI-V were positive in the subjects who had the corresponding LI-3 and LI-4 values negative. A perfect agreement (Cohen's κ = 1.000, P < 0.001) was observed between LI-3, LI-4, and LI-V (Table 3).
Within Group B, the correlations between the indices were subsequently studied, based on their arithmetic values. Arithmetic correlations between each pair of the LIs are indicated in Table 4.
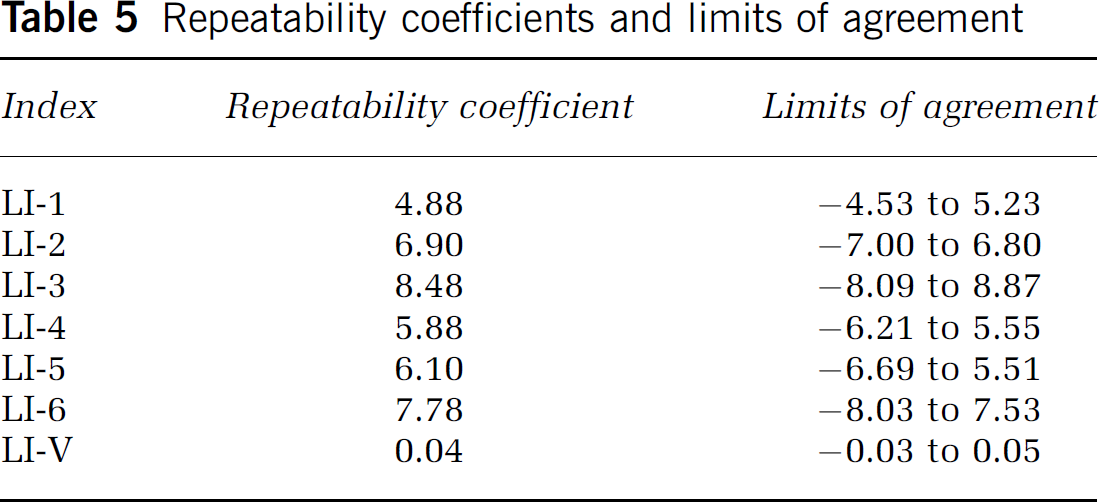
To test the reproducibility of the results, 10 randomly selected participants were asked to complete the entire task series twice. All LIs, LI-1(a) to LI-6(a), LI-1(b) to LI-6(b), LI-V(a), and LI-V(b) were calculated for each task series (measurements related to the completion of the first tasks series labeled as ‘a’, those related to the second completion labeled as ‘b’). Wilcoxon-sign ranks test showed that, on average, there was no significant difference between the first and second measurements (P > 0.05) in any of the above indices, including LI-V, which indicates that there is no evidence of any bias in the results. The BSI repeatability coefficient and limits of agreement, based on the first and second measurements of the LIs, were also calculated (Table 5). The differences between the values were randomly scattered around a mean of approximately 0%, and 90% to 100% of them were within the limits of agreement (Figure 1), findings that confirm the repeatability of the measurements.
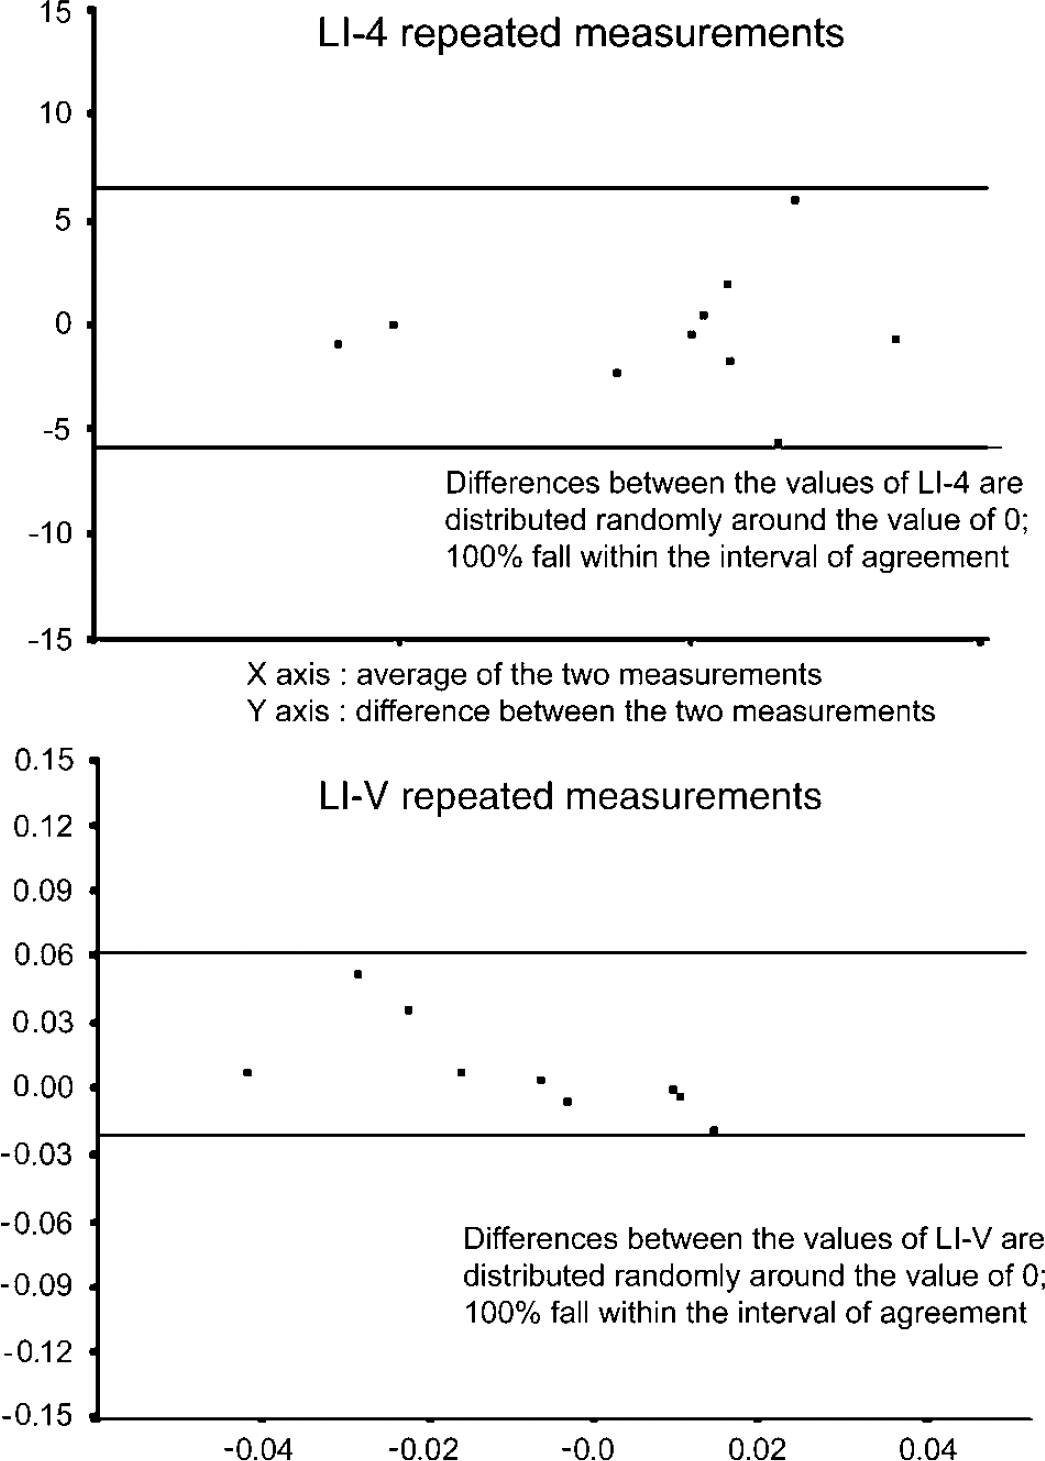
Test-rest repeatability. Bland-Altman diagram for LI-4 and LI-V indices, where the difference between the first and second measurements was plotted against their average for 10 participants who were subjected to the test twice. Repeatability was based on the percentage differences within the corresponding limits of agreement (two horizontal parallel lines). X axis, average of the two measurements. Y axis, difference between the two measurements.
Group B: frequencies of negative values for each LI & Cohen' κ agreement
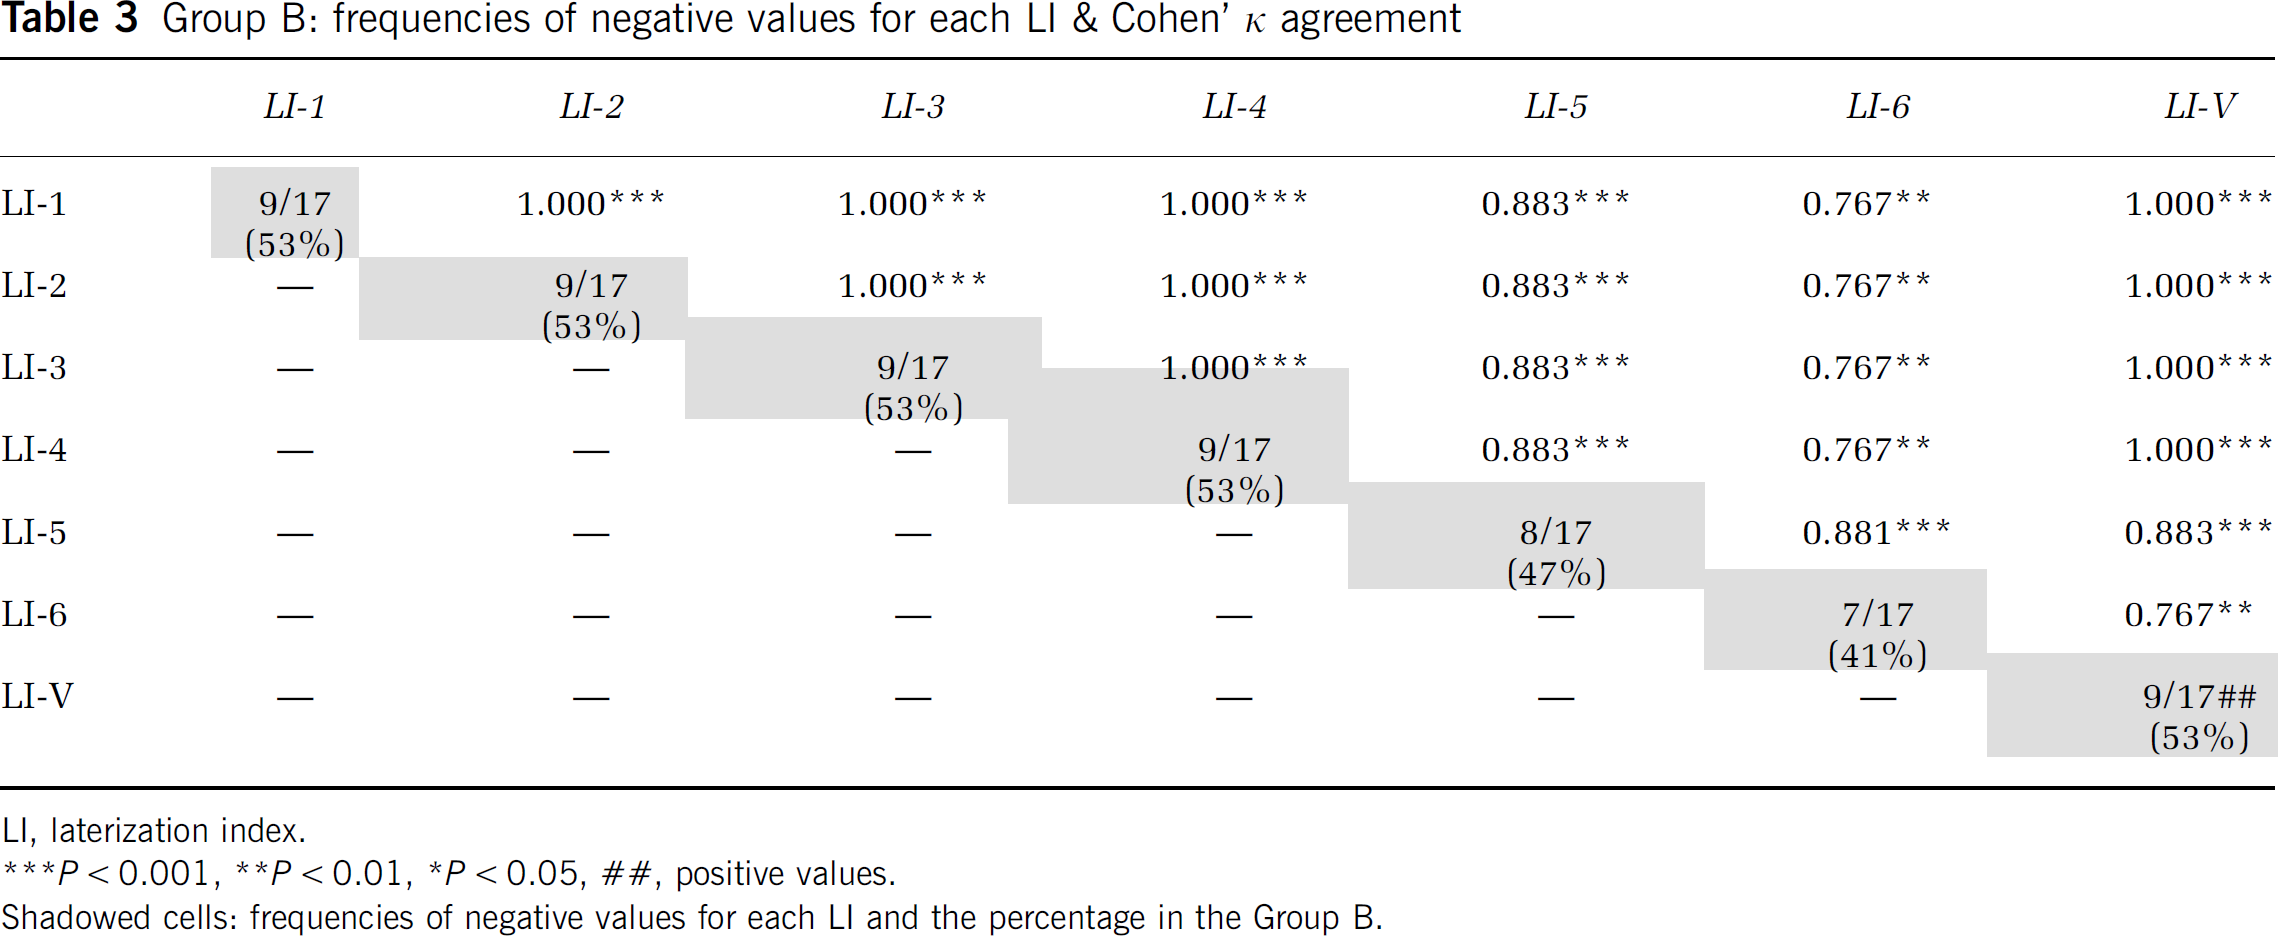
LI, laterization index.
P< 0.001,
P < 0.01
P < 0.05,
positive values.
Shadowed cells: frequencies of negative values for each LI and the percentage in the Group B.
Group B: Spearman's ρ index among the LIs
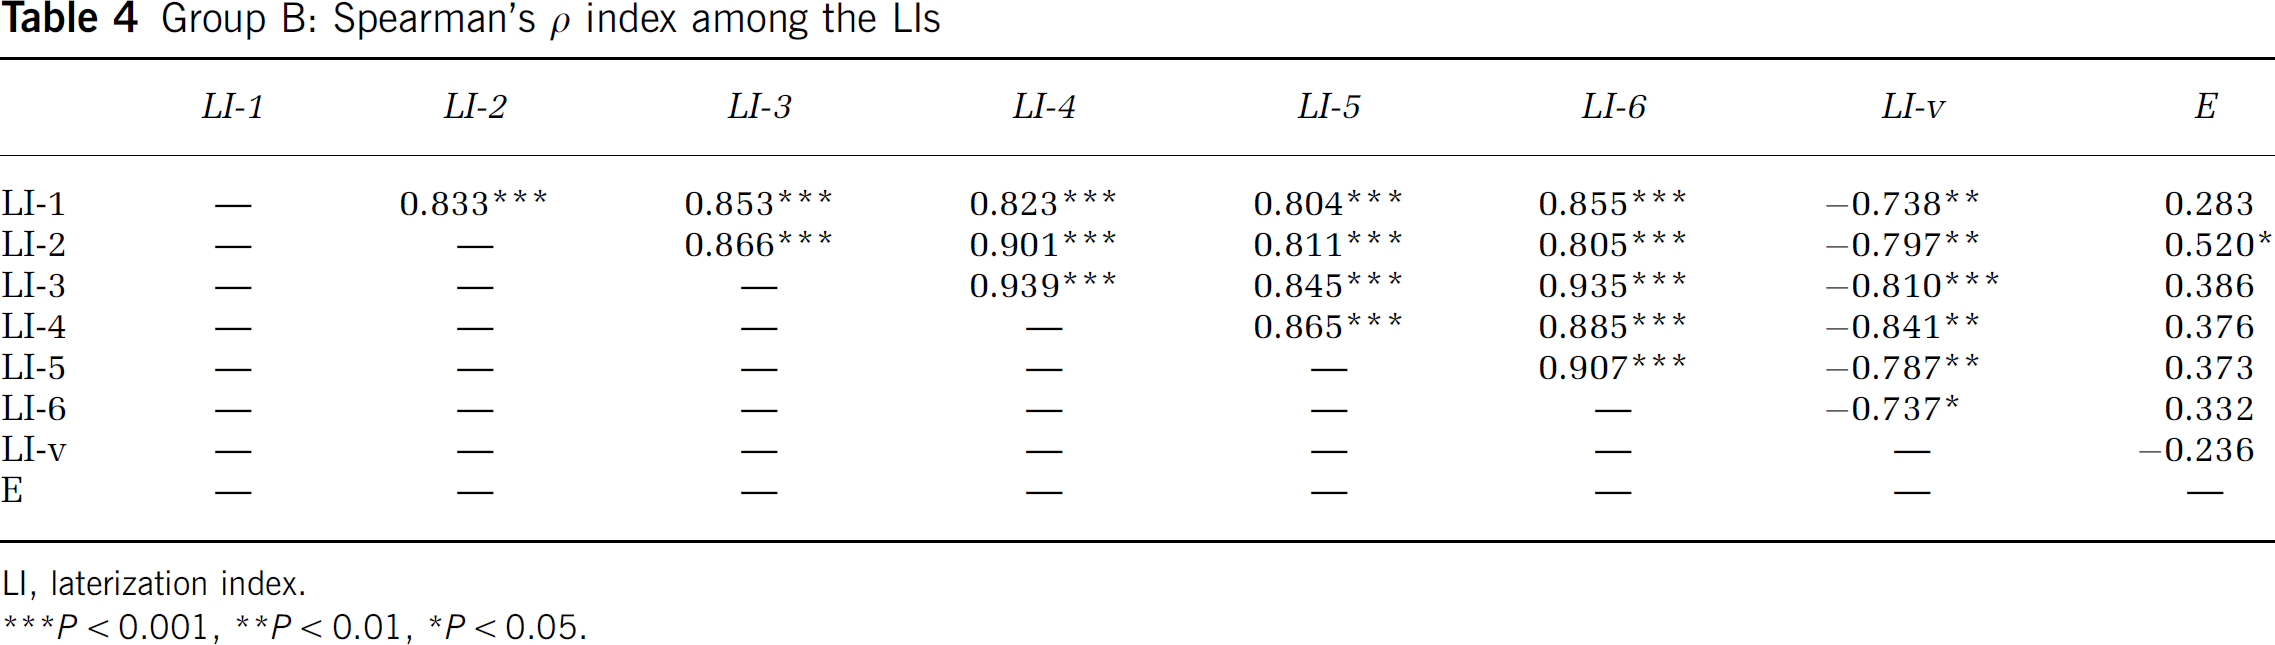
LI, laterization index.
P < 0.001,
P < 0.01,
P < 0.05.
Repeatability coefficients and limits of agreement
Discussion
In this study, we have used the method of fTCD, whose excellent temporal resolution enables realtime recording of blood flow fluctuations during and immediately post-task performance. Despite the greater increase of blood FVs in the dominant hemisphere during activation, consistent with previous fTCD studies (Droste et al, 1989; Kelley et al, 1992; Rihs et al, 1995; Knecht et al, 1996; Knecht et al, 1998; Deppe et al, 2004), considering the entire examination findings, the largest amplitude of FV fluctuations was demonstrated in the nondominant hemisphere, showing that the dominant hemisphere maintains a more narrow range of the fluctuations of blood flow velocity values compared with the nondominant one, during left hemispheric activation tasks.
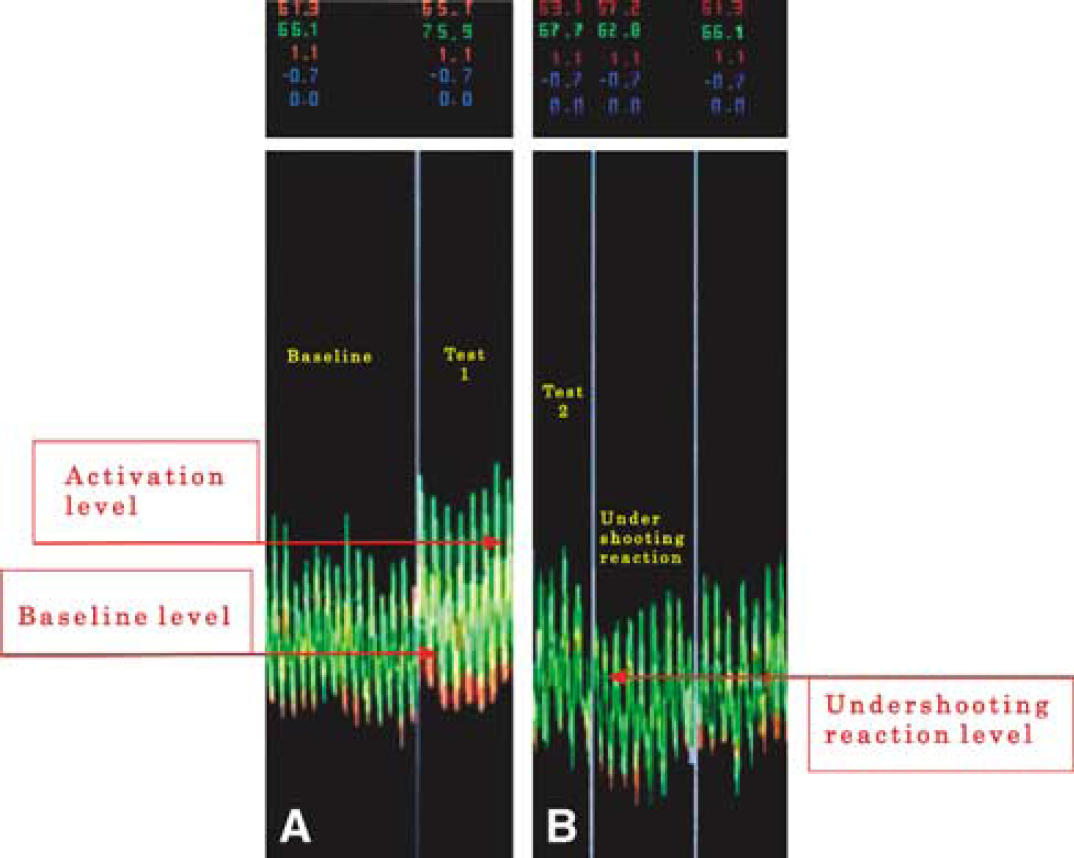
The explanation for this finding is that during the post-stimulus period and specifically in the immediate post-activation time, the blood FVs in the nondominant hemisphere reach nadir point values that are lower than the baseline ones and also lower than the corresponding values in the opposite hemisphere (Figure 2). This reaction, FVs values below the baseline immediately post-activation, has been described previously as ‘undershooting reaction’ (Klingelhofer and Sander, 1996). In our study, it was quantified by the LI-V and the findings suggest that the blood flow in the more activated hemisphere is more ‘stable’ than in the nonactivated one. The difference in blood FV stability on each side is demonstrated in Figure 3 in a simplified theoretical model, based on one subject's recordings. To our knowledge, this parameter has not been included in any of the previous studies that have mainly focused on the degree of activation as the percentage increase of baseline values.
(
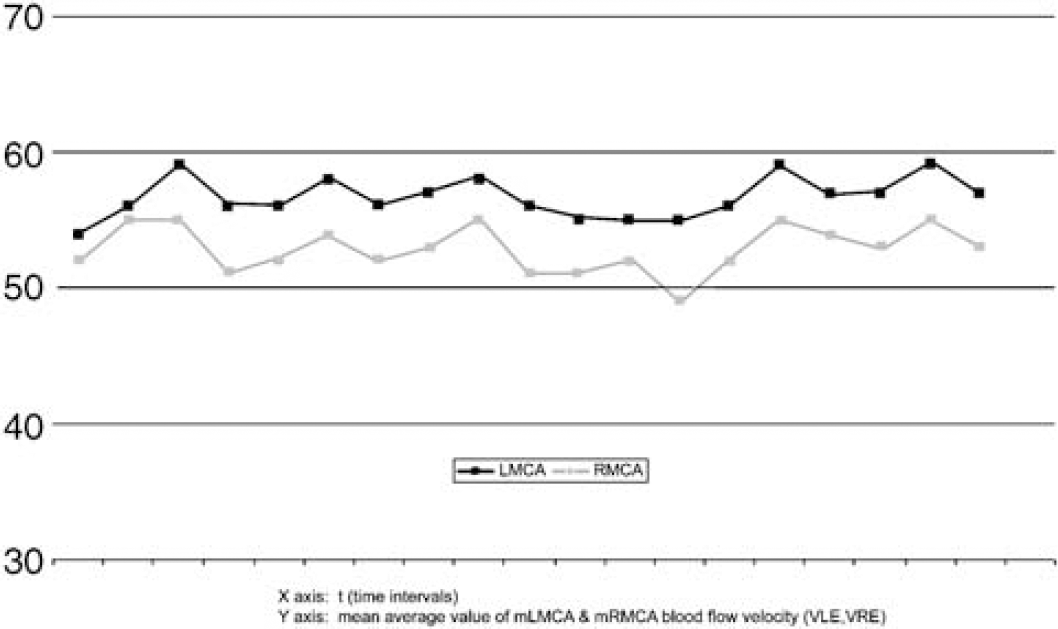
Recordings from participant 16 (right-handed). During task performance the percent FV increase is greater in LMCA. Taking into account the nonactive intervals, the fluctuation of the values is greater on the right side. The line corresponding to the LMCA seems straighter compared with the line of the RMCA. Between the two indicated vertical lines, a time interval, corresponding to the duration of a task performance, is defined.
In spite of many methodological deviations, most studies using functional methods are in agreement that verb production tasks, word production tasks from letters, and, to a lesser extent, word reading tasks show the strongest correlation with language dominance (Deppe et al, 1998; Pujol et al, 1999; Lehericy et al, 2000) and this is in keeping with our results that have revealed that LI-3 and LI-4, which correspond to word generation and reading aloud tasks, respectively, have produced the highest degree of activation. According to our findings, the LI based on the variability of values (LI-V) shows an excellent negative correlation with those indices. For instance, whenever the values of LIs in Group A (right-handed subjects) were arithmetically positive, LI-V values were negative. Positive LIs values during activation tasks (LI-1 to LI-6) imply greater percentage increase of the blood FV in the left hemisphere during the respective task and indicate left hemisphere dominance. Thus, negative LI-V values reveal left hemisphere dominance whereas the positive ones indicate a right hemisphere dominance.
LI-V showed also statistically significant negative linear correlation with LI-4, in the right-handed Group A. Within the same group, there was significant correlation between the LI-3 and the Edinburgh index. Previous studies also showed linear correlation of the LI values with the Edinburgh index (Knecht et al, 2000), whereas others did not (Szaflarski et al, 2002). These correlations therefore could not be considered useful.
A key finding in our study was that the strongly right-handed individuals, who were expected to have left hemispheric dominance for language, word generation, and the reading aloud tasks, consistently produced a greater increase in FVs in the left hemisphere during activation but for the whole duration of the test the variability was greater in the right one. It is also remarkable that similar results were observed in nine out of 17 left-handed participants, for whom the method indicated right hemispheric dominance for language, that is a more stable flow in the right hemisphere and more fluctuations in the left one.
In our study, specific for the nondominant hemispheric tasks were omitted particularly because the terms dominant and nondominant concern language specificity while their use would examine different functions. Moreover, those tests, by being specific for the nondominant hemisphere, make it in fact ‘dominant’ for the function tested. In fTCD and fMRI studies, results are based on ‘activation’ (i.e., increase of blood flow velocity for fTCD and activated pixels for fMRI) and therefore most previous studies have mainly used widely accepted language specific tasks (Benson et al, 1999; Knecht et al, 1998; Lehericy et al, 2000). The study of FV fluctuations during the performance of successive specific for the nondominant hemisphere tasks could be an interesting avenue of future exploration.
A significant limitation of functional imaging methods is the poor reproducibility of the results after repeated measurements. The repetition of recordings in our study have shown excellent test—retest reliability as there were no significant differences in LI values between the first and second measurements for any of the subjects. It is also of interest to note that even though the LI-V, depends on a number of variables that could have a wide range of values, it demonstrated an excellent repeatability in our study. Previously, Knecht et al (1998) reported good repeatability of a word production task in successive fTCD measurements, and good test—retest reliability was also reported in a fMRI study (Pujol et al, 1999). In contrast, unreliable test—retest repeatability of the results has been reported as one of the disadvantages of the Wada procedure (Grote et al, 1999; Meador and Loring, 1999; Bassel and Bradley, 2002).
In conclusion, a novel LI, LI-V, based on the fluctuations of FVs during performance of dominant hemisphere activation tasks, carries excellent test—retest reliability and a precise correlation with the greater activation indices. The dominant hemisphere can be identified with fTCD by its more ‘active’ but also more ‘stable’ flow pattern. Comparison of fTCD findings with those of other functional imaging methods would be very valuable. Our findings could have implications in the clinical arena when definition of the dominant hemisphere needs to be made with certainty, and possibly in clinical research in language development and aphasia recovery.
Footnotes
Acknowledgements
We thank Professor P Brugger, University Hospital of Zurich, Switzerland, for valuable input regarding neuropsychological batteries. Dr Panayiotis Mitsias was supported by NIH/NINDS grant PO1 NS 23393.