
Abstract
We investigated if dynamic cerebral pressure–flow relationships in lowlanders are altered at high altitude (HA), differ in HA natives and after return to sea level (SL). Lowlanders were tested at SL (n=16), arrival to 5,050 m, after 2-week acclimatization (with and without end-tidal PO2 normalization), and upon SL return. High-altitude natives (n=16) were tested at 5,050 m. Testing sessions involved resting spontaneous and driven (squat–stand maneuvers at very low (VLF, 0.05 Hz) and low (LF, 0.10 Hz) frequencies) measures to maximize blood pressure (BP) variability and improve assessment of the pressure–flow relationship using transfer function analysis (TFA). Blood flow velocity was assessed in the middle (MCAv) and posterior (PCAv) cerebral arteries. Spontaneous VLF and LF phases were reduced and coherence was elevated with acclimatization to HA (P<0.05), indicating impaired pressure–flow coupling. However, when BP was driven, both the frequency- and time-domain metrics were unaltered and comparable with HA natives. Acute mountain sickness was unrelated to TFA metrics. In conclusion, the driven cerebral pressure–flow relationship (in both frequency and time domains) is unaltered at 5,050 m in lowlanders and HA natives. Our findings indicate that spontaneous changes in TFA metrics do not necessarily reflect physiologically important alterations in the capacity of the brain to regulate BP.
Keywords
INTRODUCTION
The dynamic relationship between blood pressure (BP) and cerebral blood flow has been shown to function as a high-pass filter, where higher frequency oscillations (>0.20 Hz) in perfusion pressure are passed along unimpeded whereas slower frequency oscillations (<0.20 Hz) are dampened by the cerebral arterioles.1, 2, 3 One common method to assess this pressure–flow relationship is through the use of transfer function analysis (TFA). 1 Using this approach, a number of studies have reported that the dynamic cerebral pressure–flow relationship is impaired in conditions of hypobaric hypoxia, and may4, 5 or may not6, 7, 8 be an important underlying mechanism in the pathophysiology of acute mountain sickness (AMS). A limitation in the majority of these studies, however, is that this impaired relationship upon initial exposure9, 10 or after acclimatization11, 12 has been inferred from TFA under spontaneous conditions (as reported by decreases in phase (i.e. the time lag) or increases in gain (i.e. the signal amplitude)). An alternative interpretation to the reported impairment in the dynamic cerebral pressure–flow relationship at high altitude (HA) is that these observations are influenced by poor BP variability, a limitation of using TFA under spontaneous conditions.13, 14 Induced nonpharmacological elevations in BP variability can be utilized to mitigate this limitation and improve the reliability and interpretation of the TFA metrics. 14
In contrast to lowlanders at HA, we know of only two studies that have examined the cerebral pressure–flow relationship in natives to HA.15, 16 In their first study, Jansen et al. 15 assessed the pressure–flow relationship during steady-state hypertensive changes in BP (i.e. 0 Hz), induced by pharmacological (i.e. phenylephrine) intervention. Findings showed that HA Sherpa, and most lowlanders arriving to HA, had impaired cerebral pressure–flow responses at 4,243 m, as reflected in a more pressure-passive response to acute hypertension compared with a sea-level (SL) group in their cross-sectional study. 15 In their follow-up study, 16 it was reported that Sherpa who resided below 4,000 m had an intact pressure–flow response; however, in those residing above 4,000 m, the chronic exposure to hypoxia led to more pressure-passive responses, indicative of impaired cerebral autoregulation. 16 In addition, the impairment in steady-state (i.e. static) cerebral autoregulation in this Sherpa group was improved after exposure to supplemental oxygen, a finding the authors speculated resulted from the vasoconstrictive effect of hyperoxia (FIO2=1.0) on the cerebral vessels, either directly or via the measured reduction in end-tidal PCO2 (PETCO2). 16
To date, however, there has not been a comprehensive examination of the dynamic pressure–flow relationship (using TFA) under spontaneous and driven conditions upon initial arrival and after acclimatization within the same subject population, or comparisons made with HA natives (e.g., Sherpa). As mentioned, Jansen et al 15 has applied supplemental oxygen (100%) to Sherpa, whereas another study has applied supplemental O2 (100%) to lowlanders after initial arrival to HA. 9 Such hyperoxia, however, is known to have a direct vasoconstrictive influence on the cerebrovasculature, 17 and it is unknown how normalizing end-tidal PO2 (PETO2) in partially acclimatized lowlanders affects the cerebral pressure–flow response. Vascular remodeling could theoretically occur at HA (over the course of ∼1 week or more) due to changes in the capillary density and blood volume, which result in angiogenesis (as reviewed in Xu and Lamenna 18 ). While this remodeling is occurring, there is a period of uncompensated hypoxia, which could influence the cerebral pressure–flow relationship. 18 Answering these questions would provide insight into whether observed changes in pressure–flow relationships are caused simply by the hypoxia5, 9, 10, 11, 12, 15, 16 or some additional influence of possible vascular remodeling 18 associated with HA exposure. We therefore attempted to address the following main questions: (1) Is the dynamic cerebral pressure–flow relationship impaired at HA (5,050 m) during spontaneous and nonpharmacological-induced elevations in BP variability?; (2) Are the changes in the pressure–flow relationship upon initial arrival to 5,050 m related to symptoms of AMS? and (3) Are there intrinsic differences in the pressure–flow relationship between HA natives and lowlanders partially acclimatized to 5,050 m?
We hypothesized that: (1) The dynamic cerebral pressure–flow relationship will be impaired at HA upon initial arrival and after acclimatization, as assessed using spontaneous TFA measures; however, when BP variability is maximized via repeated squat–stand maneuvers, the pressure–flow relationship will remain intact; (2) As highlighted in well-controlled chamber studies,7, 8, 19 there will be no correlation between changes in the pressure–flow relationship upon initial arrival to 5,050 m with symptoms of AMS; (3) HA natives will have intrinsic differences in pressure–flow coupling compared with acclimatized lowlanders at 5,050 m.
MATERIALS AND METHODS
Ethical Approval
The study complied with the standards set by the clinical ethical review board of the University of British Columbia and was also approved by the Nepal Health Medical Research Council. All volunteers provided written informed consent.
Participants
Thirty-two healthy subjects (16 lowlanders, 16 Sherpa: Table 1) were recruited for this study. None had a history of cardiorespiratory or cerebrovascular disease and none were taking any form of medication upon enrollment into the study. All subjects abstained from exercise, caffeine, and alcoholic beverages for a period of 12-hours before the testing. Each subject underwent a familiarization of the laboratory and testing protocols before the initiation of the protocols.
Participant characteristics
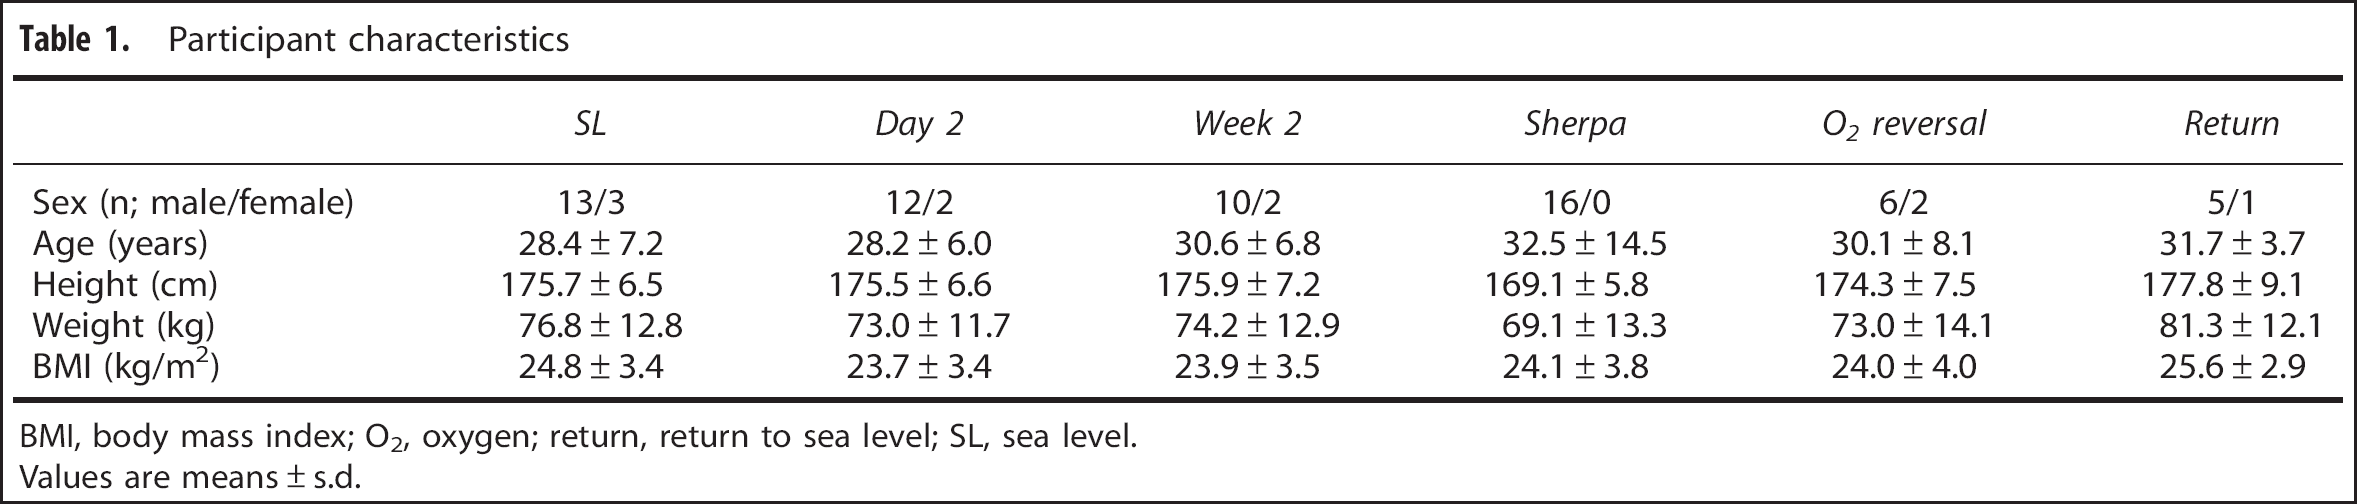
BMI, body mass index; O2, oxygen; return, return to sea level; SL, sea level.
Values are means±s.d.
Experimental Design and Ascent Protocol
After a full familiarization of the experimental protocols (summarized below), the lowlanders performed experimental trials at SL (350 m, Kelowna, British Columbia, Canada; barometric pressure 715±15 mm Hg) and while residing at HA (5,050 m; the Ev-K2-CNR Pyramid Laboratory, Khumbu Valley, Nepal; barometric pressure 413±4 mm Hg). The SL trials (n=16) were completed 2 months before departure for Kathmandu and a subset of the group (n=6) were retested 2 weeks after returning from HA. Participants spent 7 days in Kathmandu (∼1,400 m) acclimatizing before flying to Lukla (2,840 m) and trekking to the Ev-K2-CNR Pyramid Laboratory (5,050 m) over a 9-day period (rest days: Namche Bazaar, 3,440 m; Pengbouche, 3,995 m; Pheriche, 4,240 m). The HA trials were completed upon initial arrival to HA (day 2: n=14) and after an acclimatization period of 2 weeks (week 2: n=12), with a subset of this group also performing the trials with oxygen normalization where end-tidal PO2 was returned to SL values (n=8; 38% O2, 0.04% CO2, 61.96% N2 for 10 minutes before baseline measures). The Sherpa performed one experimental trial consisting of spontaneous baseline measures and both squat–stand protocols (without supplemental oxygen) at HA (n=16). All Sherpa were born, raised and resided between 3,500 to 4,300 m. None had spent any time at elevations lower than 2,500 m in the last 6 months. See Figure 1 for a schematic of the experimental testing conditions.
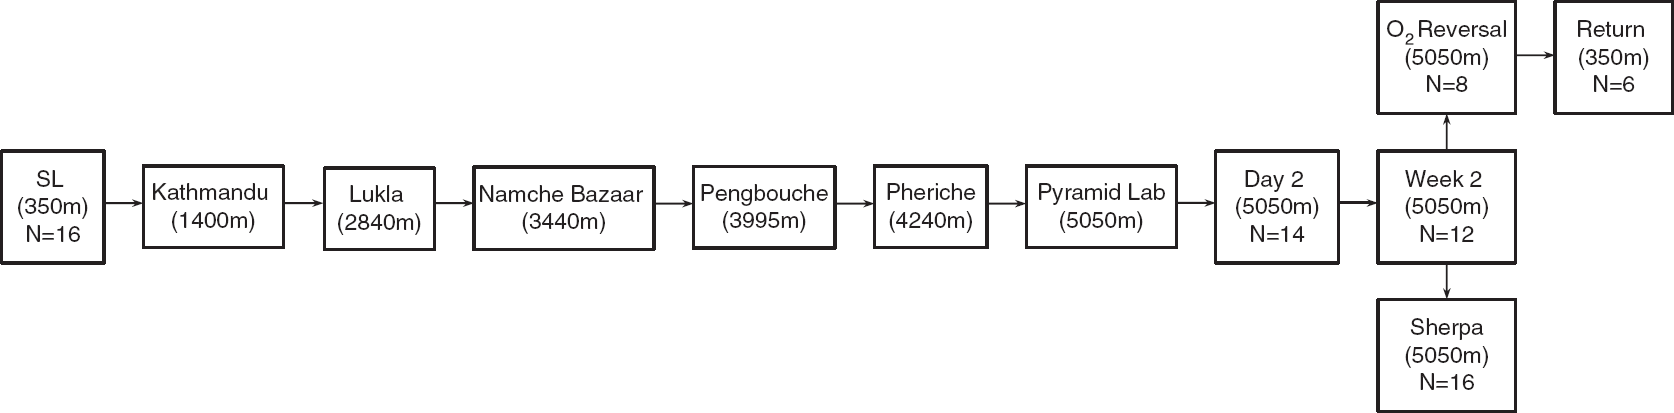
Schematic of the ascent protocol: the sea-level (SL) trials were completed 2 months before departure for Kathmandu. Lowlanders spent 7 days acclimatizing before flying to Lukla and trekking to the Ev-K2-CNR Pyramid Laboratory over a 9-day period (rest days: Namche Bazaar: 3440 m; Pengbouche: 3995 m; Pheriche: 4,240 m). Day 2 trials were conducted on the second day after arrival to the Pyramid Lab. After successful acclimatization to high altitude, the follow-up tests in the lowlanders (week 2, O2 reversal) and Sherpa were performed. Two weeks after returning to SL, a subset of the lowlanders were retested.
Upon arrival to the lab (either SL or 5,050 m), subjects underwent a familiarization of the experimental procedures and then performed the protocol. At least 5 minutes of resting spontaneous baseline data were recorded in a seated position. These data were used for the spectral analysis of spontaneous oscillations in BP and CBF velocity in the anterior (via the middle cerebral artery, MCAv) and posterior (via the posterior cerebral artery, PCAv) cerebral circulatory regions. In order to increase the BP variability, subjects performed repeated squat–stand maneuvers. 2 During the maneuvers, subjects mimicked the experimenter to ensure all subjects performed the maneuvers at a similar depth to induce BP fluctuations. The subjects were randomly selected to perform maneuvers at 0.05 Hz (10 second squat–10-second stand—driving BP in the VLF range) or 0.10 Hz (5-second squat–5-second stand—driving BP in the LF range) first for 5 minutes each before performing the other frequency. A minimum 3-minute rest period was permitted to return to baseline levels in between trials. These data were used for the spectral analysis of driven oscillations in BP and both the MCAv and PCAv. During all trials, the end-tidal gases were monitored to ensure that normal breathing occurred and Valsalva-like maneuvers were avoided.
This study was part of a larger research expedition conducted in April–May in 2012; as such participants took part in a number of studies conducted during the 3 weeks at the Ev-K2-CNR Pyramid Laboratory. The recovery time between the various testing sessions was managed to prevent any potentially confounding results (e.g. >48 hours between all drug and/or exercise intervention studies). Additionally, during the first 8 days of the trek to the Pyramid Lab, SL participants were given low-dose acetazolamide (125 mg) twice a day as an AMS prophylactic. 20 Treatment of acetazolamide was discontinued on day 8 of the trek to allow sufficient time (e.g. >48 hours) for the drug to clear participants' system before the first data collection session, as the half-life of acetazolamide is reported to be ∼10 hours 21 and this low-dose is typically 90% to 100% passed through the system within 24 hours of administration. 22 This was done to minimize potential impacts of AMS on cerebrovascular, cardiovascular, and ventilatory responses, 23 but not to result in AMS severity great enough to prevent participants taking part in testing or require medical intervention (e.g. oxygen, dexamethasone injection).
Instrumentation
A three-lead electrocardiogram was used for the measurement of the R-R interval. Beat-by-beat BP was measured using finger photoplethysmography (Finometer; Finapres Medical Systems, Amsterdam, The Netherlands) and confirmed with manual BP measurements. This method has been shown to reliably assess the dynamic changes in beat-to-beat BP that correlate well with intraarterial recordings and can be used to quantify the dynamic pressure–flow relationship of cerebral circulation.24, 25
Flow velocity in the middle cerebral artery and PCAv was obtained via a 2-MHz Doppler probe (Spencer Technologies, Seattle, WA, USA). The MCA and PCA were identified and optimized according to their signal depth, wave form, and velocities,26, 27 before securing the probes in place with a headband (Spencer Technologies, Seattle, WA, USA). To assist day-to-day repeatability of the MCA and PCA, the insonation depth and settings for each individual were replicated upon subsequent trials. An index of cerebrovascular resistance (CVR) was calculated for both measures from mean BP/mean MCAv or PCAv. End-tidal PCO2 was monitored using an online gas analyzer (ML206; AD Instruments, Colorado Springs, CO, USA) and was calibrated with a known gas concentration before testing each subject. All data were recorded and stored for subsequent analysis using commercially available software (LabChart version 7.1; AD Instruments, Colorado Springs, CO, USA).
Individual symptom scores of AMS were determined using the Environmental Symptoms Questionnaire Cerebral Symptoms (ESQ-C) 28 and Lake Louise 29 scoring protocols. Subjects deemed to be AMS+ were determined from a Lake Louise score of 3 in the presence of a headache and/or an ESQ-C score 0.7. 30
Data Processing
All data were sampled simultaneously at 1,000 Hz via an analog-to-digital converter (Powerlab 16/30 ML880; AD Instruments). Real time beat-to-beat mean values of BP and MCA or PCA velocity were determined from each R-R interval. All data were processed and analyzed with custom designed software in LabView 11 (National Instruments, Austin, TX, USA).
Power Spectrum and Transfer Function Analysis
Beat-to-beat BP and MCAv or PCAv signals were spline interpolated and re-sampled at 4 Hz for spectral and TFA based on the Welch algorithm. Each 5-minute recording was first subdivided into five successive windows, which overlapped by 50%. Data within each window were linearly detrended and passed through a Hanning window before fast Fourier transform analysis. For TFA, the cross-spectrum between BP and MCAv or PCAv was determined and divided by the MAP auto spectrum to derive the TFA coherence, gain, and phase.
Spontaneous BP and MCAv/PCAv power spectrum density, and the mean value of TFA coherence, gain, and phase were calculated in the very low (VLF, 0.02 to 0.07 Hz: 50 to 14.3-second cycles) and low (LF, 0.07 to 0.20 Hz: 14.3 to 5-second cycles), frequency ranges where cerebral autoregulation (CA) is thought to be operant.1, 3 The TFA coherence, gain, and phase of the driven BP oscillations were sampled at the driven frequency (0.05 or 0.10 Hz). As per our previous study, 10 to ensure that the phase and gain measures were robust for subsequent analysis, we only included the individual within-subject phase and gain data points associated with coherence values above 0.50. Mean values presented in Table 3 for coherence include all data points, whereas mean values for phase and gain include only those that met the coherence criteria.
Overall, phase and gain measures were weighted in accordance to their coherence values to achieve the most accurate measures for statistical analysis. 31 Values with lower coherence were given less weight in the final group averages to control for the unreliability of these measures. 31 The statistical weighting of the results did not affect the statistical significance of the outcomes (e.g. nonweighted LF phase pre–post t-test, P=0.56; weighted LF Phase pre–post t-test, P=0.69). According to previous applications of this methodology, an intact pressure–flow relationship would be associated with reductions in gain, 1 and increases in phase. 32 Conversely, the absence of an intact pressure–flow response would manifest as increases in gain, with reductions in phase.
Statistical Analysis
Statistical analyses were performed using PASW version 18.0 for Windows (PASW, Chicago, IL, USA). The effects of trial (SL, day 2, week 2) on MCAv, PCAv, BP, PETCO2, PETO2, SaO2, CVR, and TFA coherence, gain and phase measures were assessed using a one-way with a post hoc Tukey comparison for group effects. An independent sample t-test was performed between the lowlanders at week 2 and Sherpa data for MCAv, PCAv, BP, PETCO2, PETO2, SaO2, CVR, and TFA coherence, gain and phase measures. Finally, a paired sample t-test was performed between the week 2 and O2 normalization, and the SL and return data on MCAv, PCAv, BP, PETCO2, PETO2, SaO2, CVR, and TFA coherence, gain and phase measures. The paired sample t-test was performed on the subsets of individuals (n=6) that were involved in both sets of testing (i.e. only those subjects that were present for both the pre- and post-HA tests were part of the paired t-test). Data are presented as mean±s.d., and statistical significance was set at P<0.05.
RESULTS
All 16 subjects completed the full experimental protocol at SL; however, because of illness and time constraints, only 14 and 12 subjects completed the protocol upon initial arrival to HA and after acclimatization, respectively. A subset of the acclimatized subjects performed the O2 normalization (n=8) and the return to SL protocols (n=6; Figure 1). All 16 Sherpa subjects completed their experimental protocol. Estimates of MCA diameter and flow were made in 10 lowlanders after acclimatization and in six Sherpa. Age and body mass index characteristics were similar between subject groups (Table 1).
Influence of Squat–Stand Maneuvers
During the spontaneous measures, the BP power was 2.55 to 13.70 mm Hg2, (Table 3) which was increased to 12,310 to 31,271 mm Hg2 (Table 4) during the driven protocol, representing a >2,000-fold increase in BP variability. The TFA coherence values also increased from 0.48 to 0.81 a.u. (spontaneous data: Table 3) to >0.97 a.u. (squat–stand data: Table 4).
Initial Arrival (Day 2)
Upon initial arrival to HA (5,050 m), PETO2 and PETCO2 were reduced by 47 mm Hg and 10 mm Hg, respectively, and there was a 17% reduction in arterial O2 saturation (P<0.001). There were no changes in mean BP, MCAv, or CVR in the MCA. In contrast, there was a 21% reduction in PCAv (P<0.01), coinciding with a 35% increase in CVR (P<0.01) in the posterior circulation (Table 2).
Hemodynamic and cerebrovascular responses during spontaneous baseline
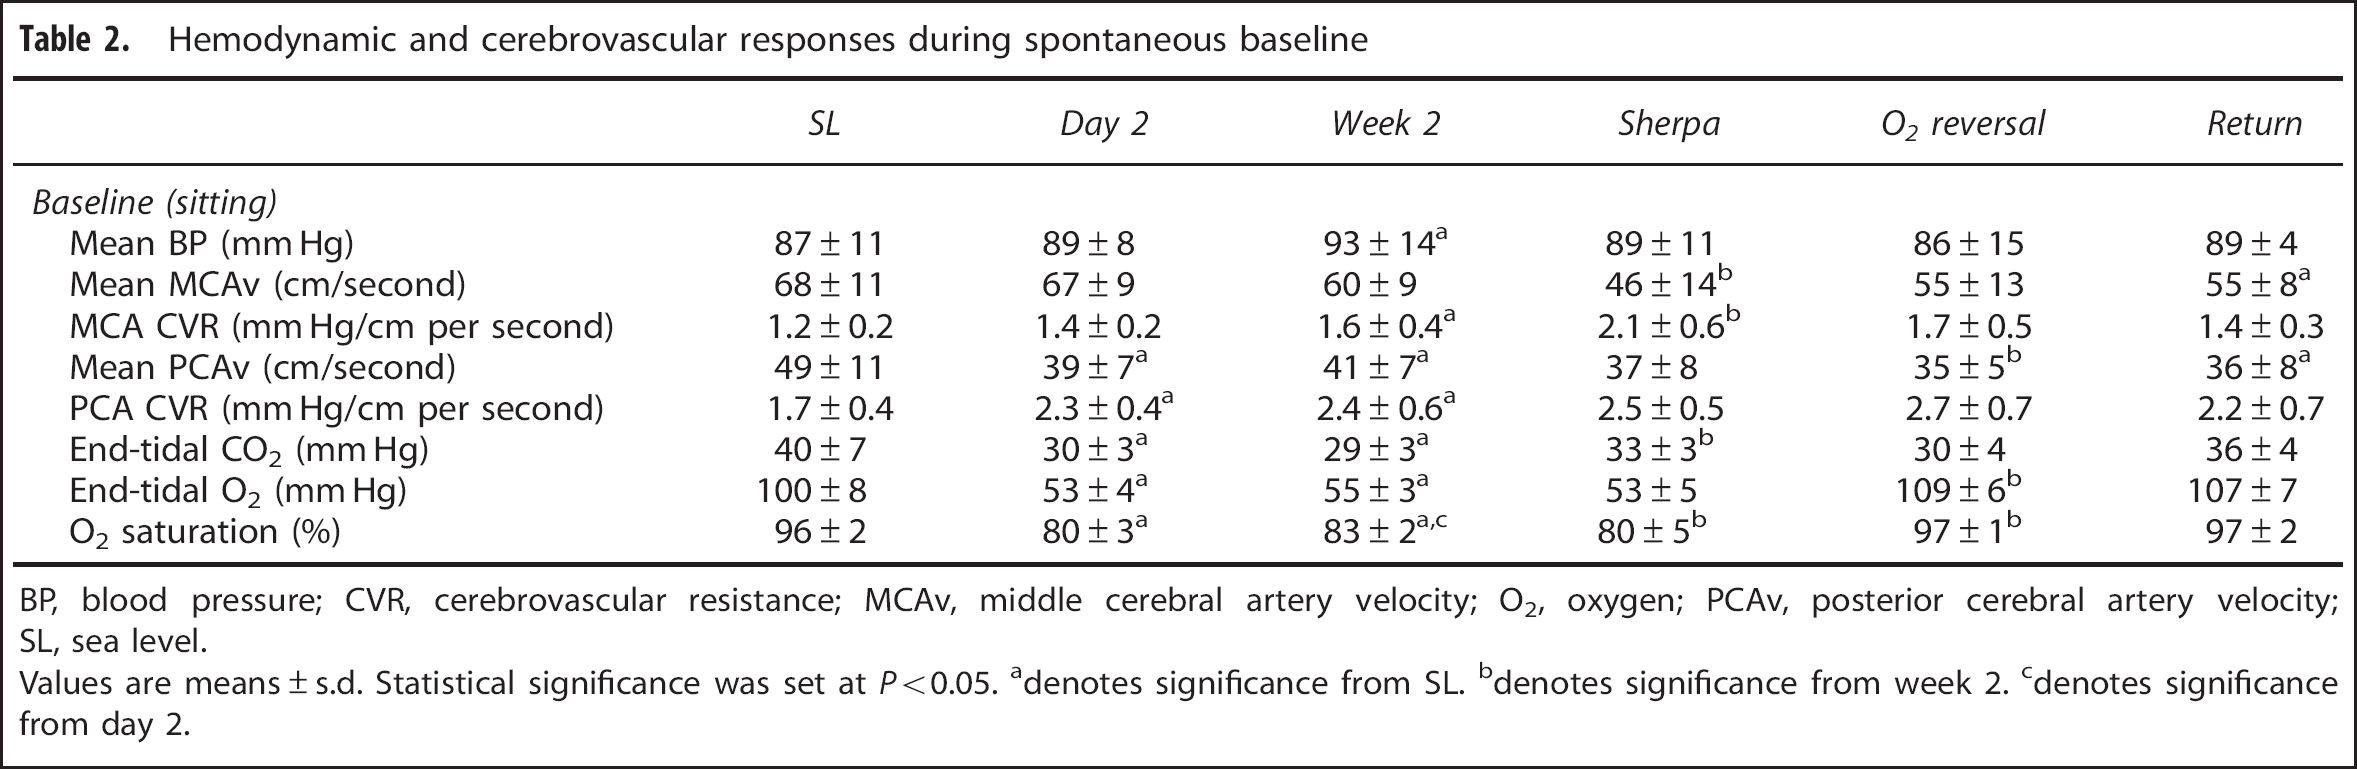
BP, blood pressure; CVR, cerebrovascular resistance; MCAv, middle cerebral artery velocity; O2, oxygen; PCAv, posterior cerebral artery velocity; SL, sea level.
Values are means±s.d. Statistical significance was set at P<0.05.
denotes significance from SL.
denotes significance from week 2.
denotes significance from day 2.
Compared with SL values, there were no statistically significant differences in the power spectrum of BP, MCAv, or PCAv with initial exposure to HA under either spontaneous (Table 3) or driven (Table 4) protocols. Transfer function analysis revealed no statistical differences between SL and day 2 for either spontaneous or the driven values for each of coherence, phase, and gain within the MCA at both SL and day 2. Although, as expected, main effects between conditions were present (Tables 3 and 4). Within the posterior cerebral circulation, LF gain was reduced by an average of 38% during spontaneous breathing (P<0.01) and by 24% during the 0.10 Hz stand–squats (P=0.057). All other day 2 TFA indices were not statistically different from SL values within the PCA (Tables 3 and 4; Figures 2 and 3). Taken together, these TFA metrics are indicative of an intact high-pass filter model for the MCA circulation upon initial arrival to HA. Within the PCA circulation, there appears to be a decrease in the amplitude modulation in the spontaneous LF gain metric (i.e. an ‘improved’ relationship), which is less evident with the increased BP variability associated with the driven protocol.
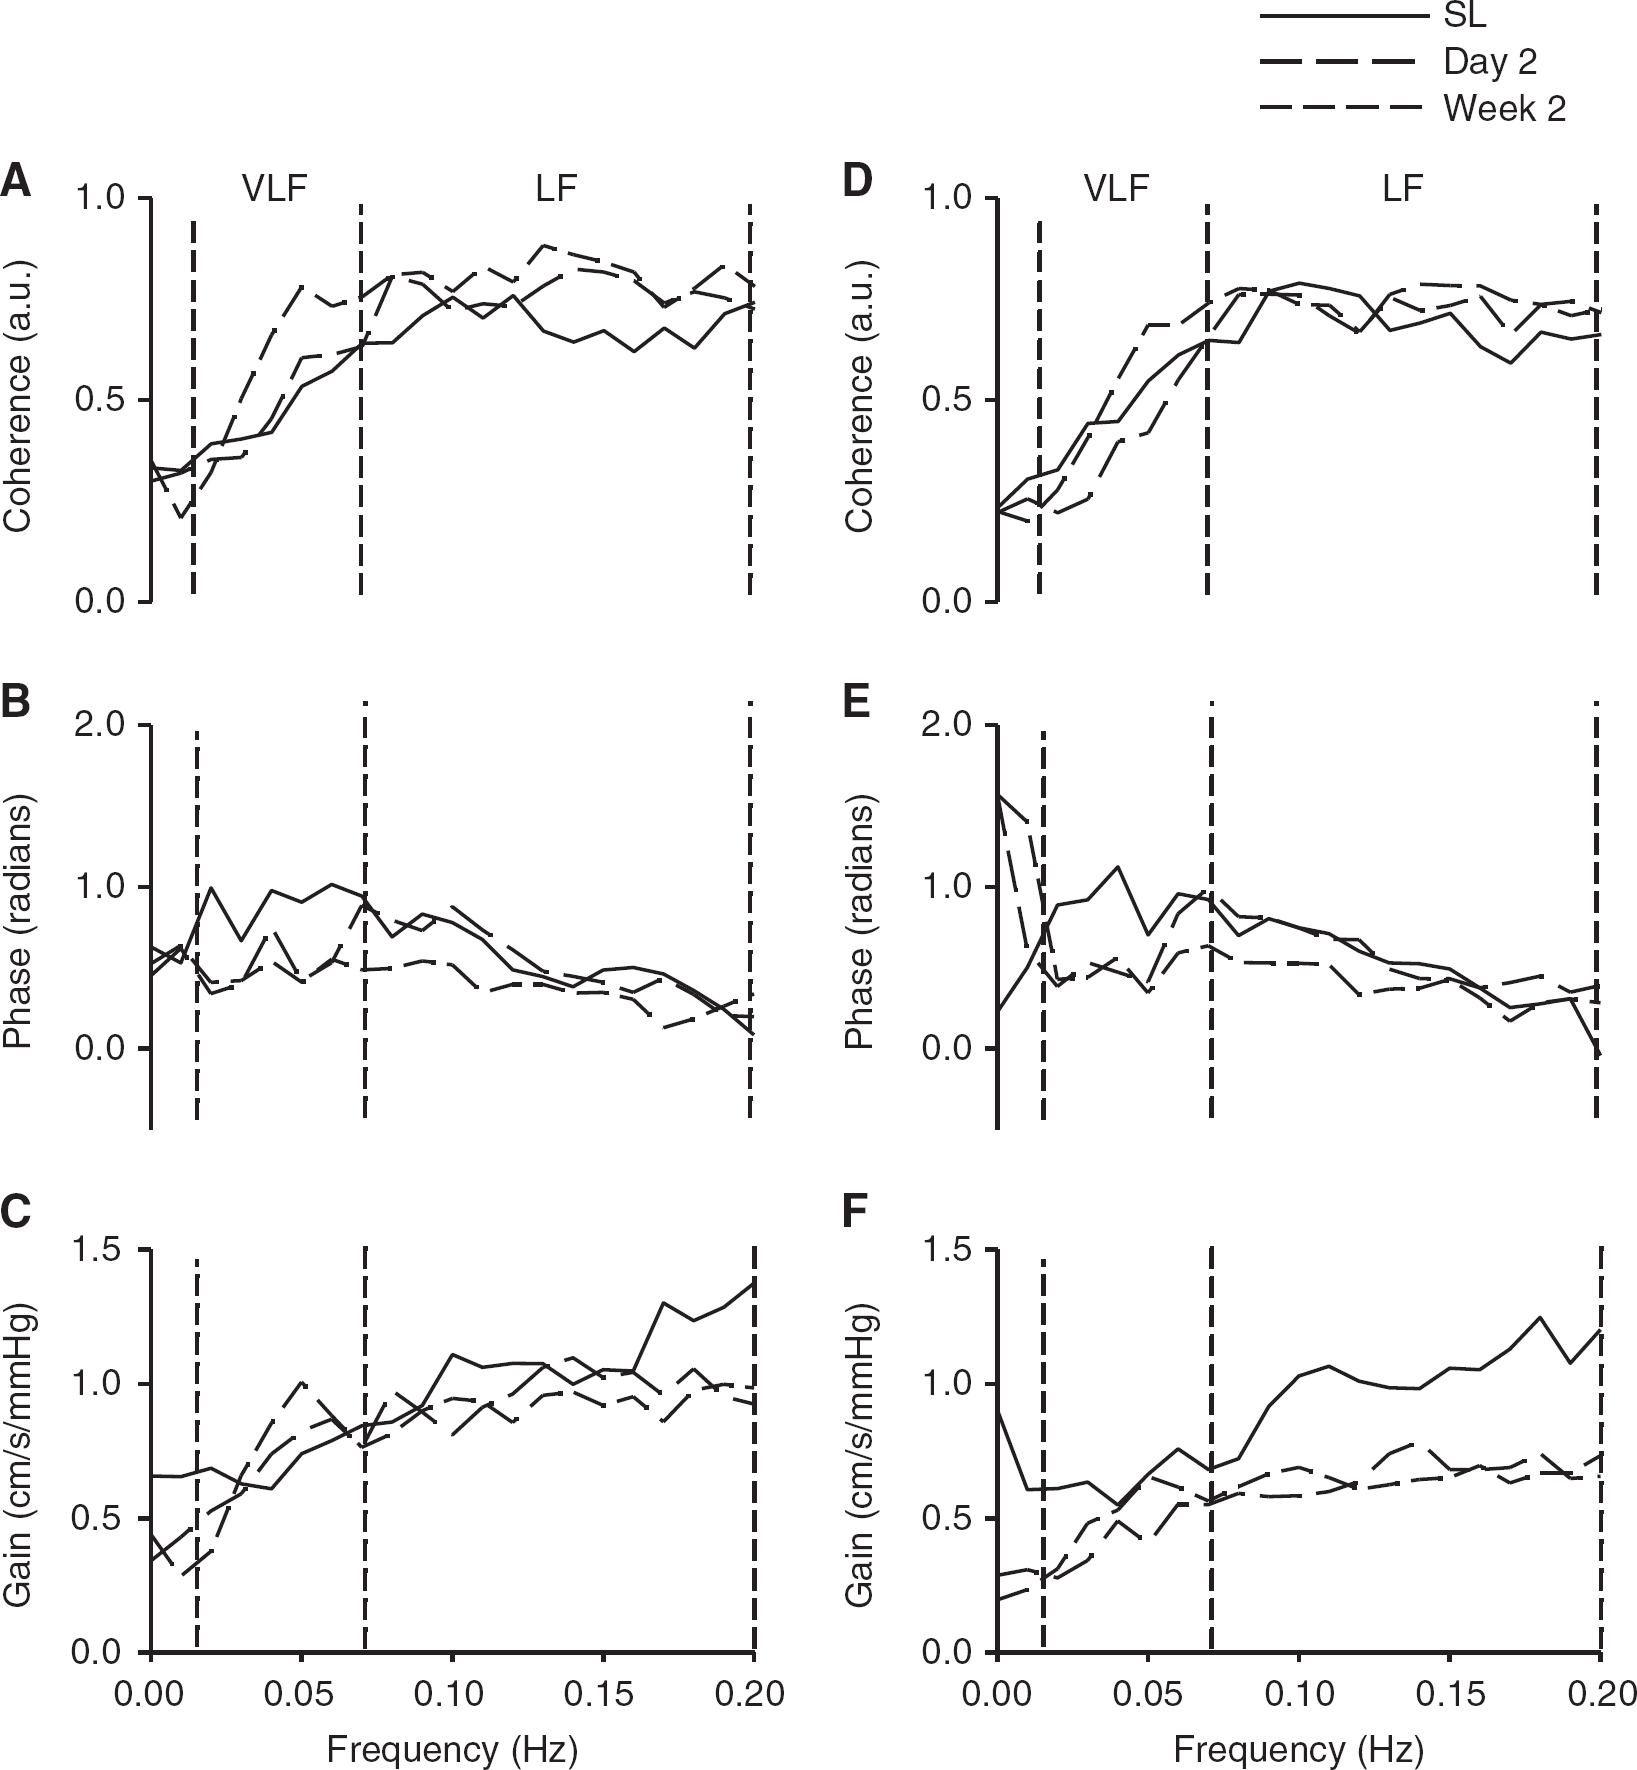
Transfer function analysis of the cerebral pressure–flow relationship during spontaneous oscillations in blood pressure and cerebral blood flow velocities at SL (solid), upon arrival (day 2, long dash) and after partial acclimatization to 5,050 m (week 2, short dash). Data are presented as group means for coherence, phase and gain within the middle cerebral artery (
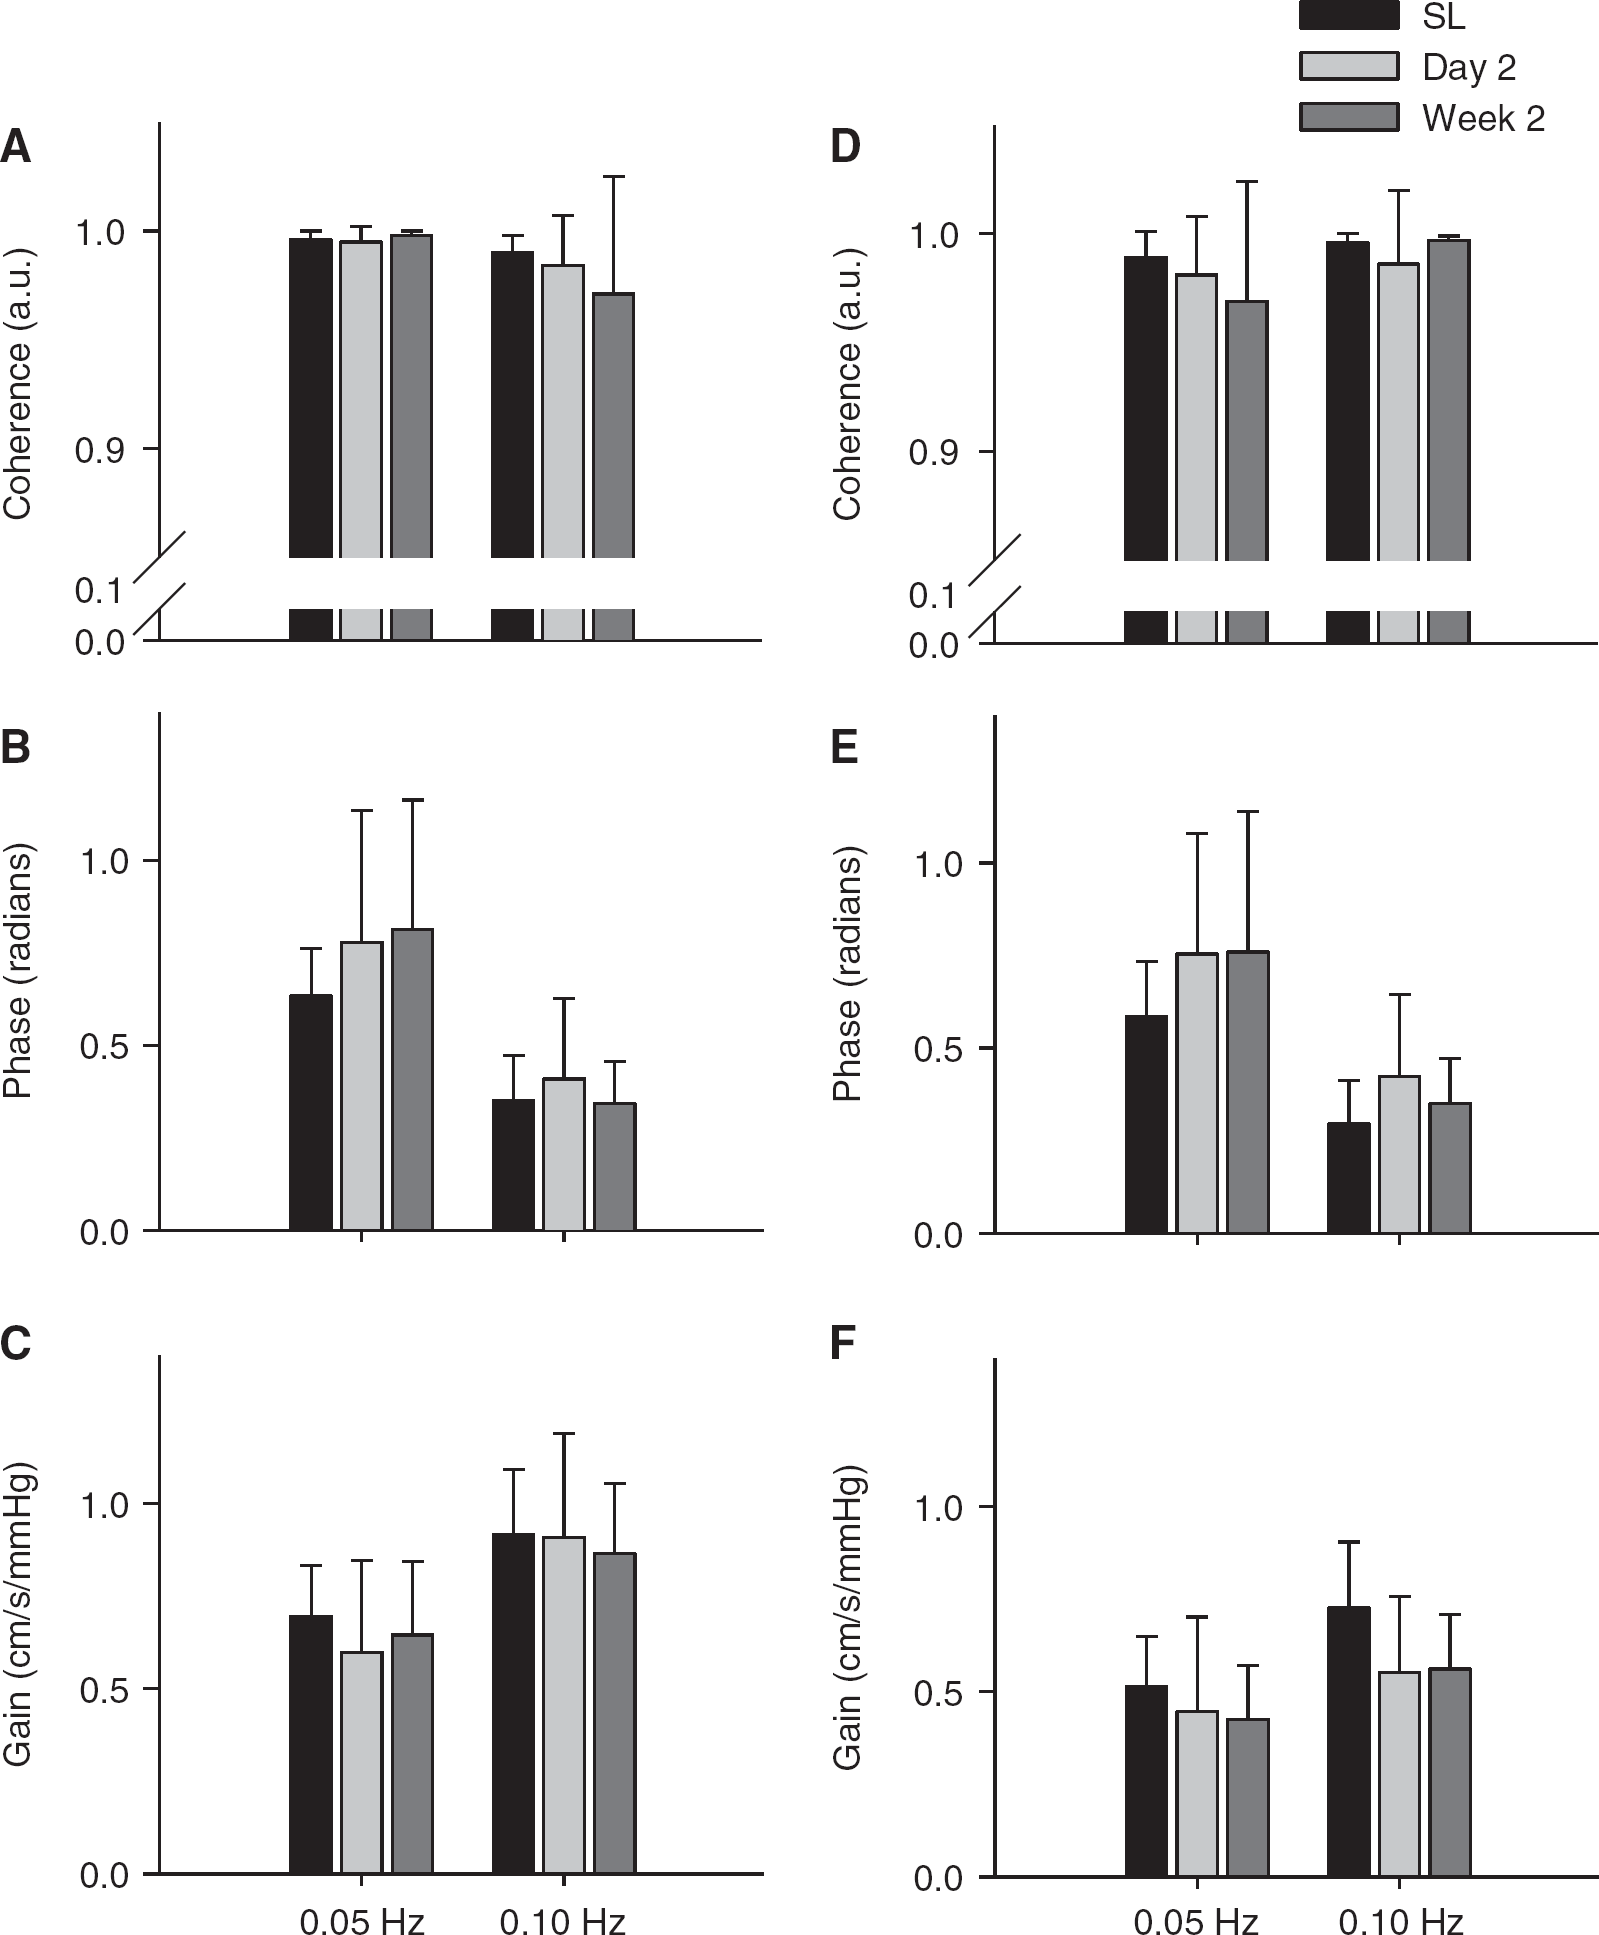
Transfer function analysis of the cerebral pressure–flow relationship during driven oscillations in blood pressure and cerebral blood flow velocities at sea level (SL black), upon arrival (day 2, light gray) and after partial acclimatization to 5,050 m (week 2, dark gray). Data are presented as group means±s.d. for coherence, phase and gain within the middle cerebral artery (
Transfer function analysis of spontaneous seated data between BP and MCAv and PCAv
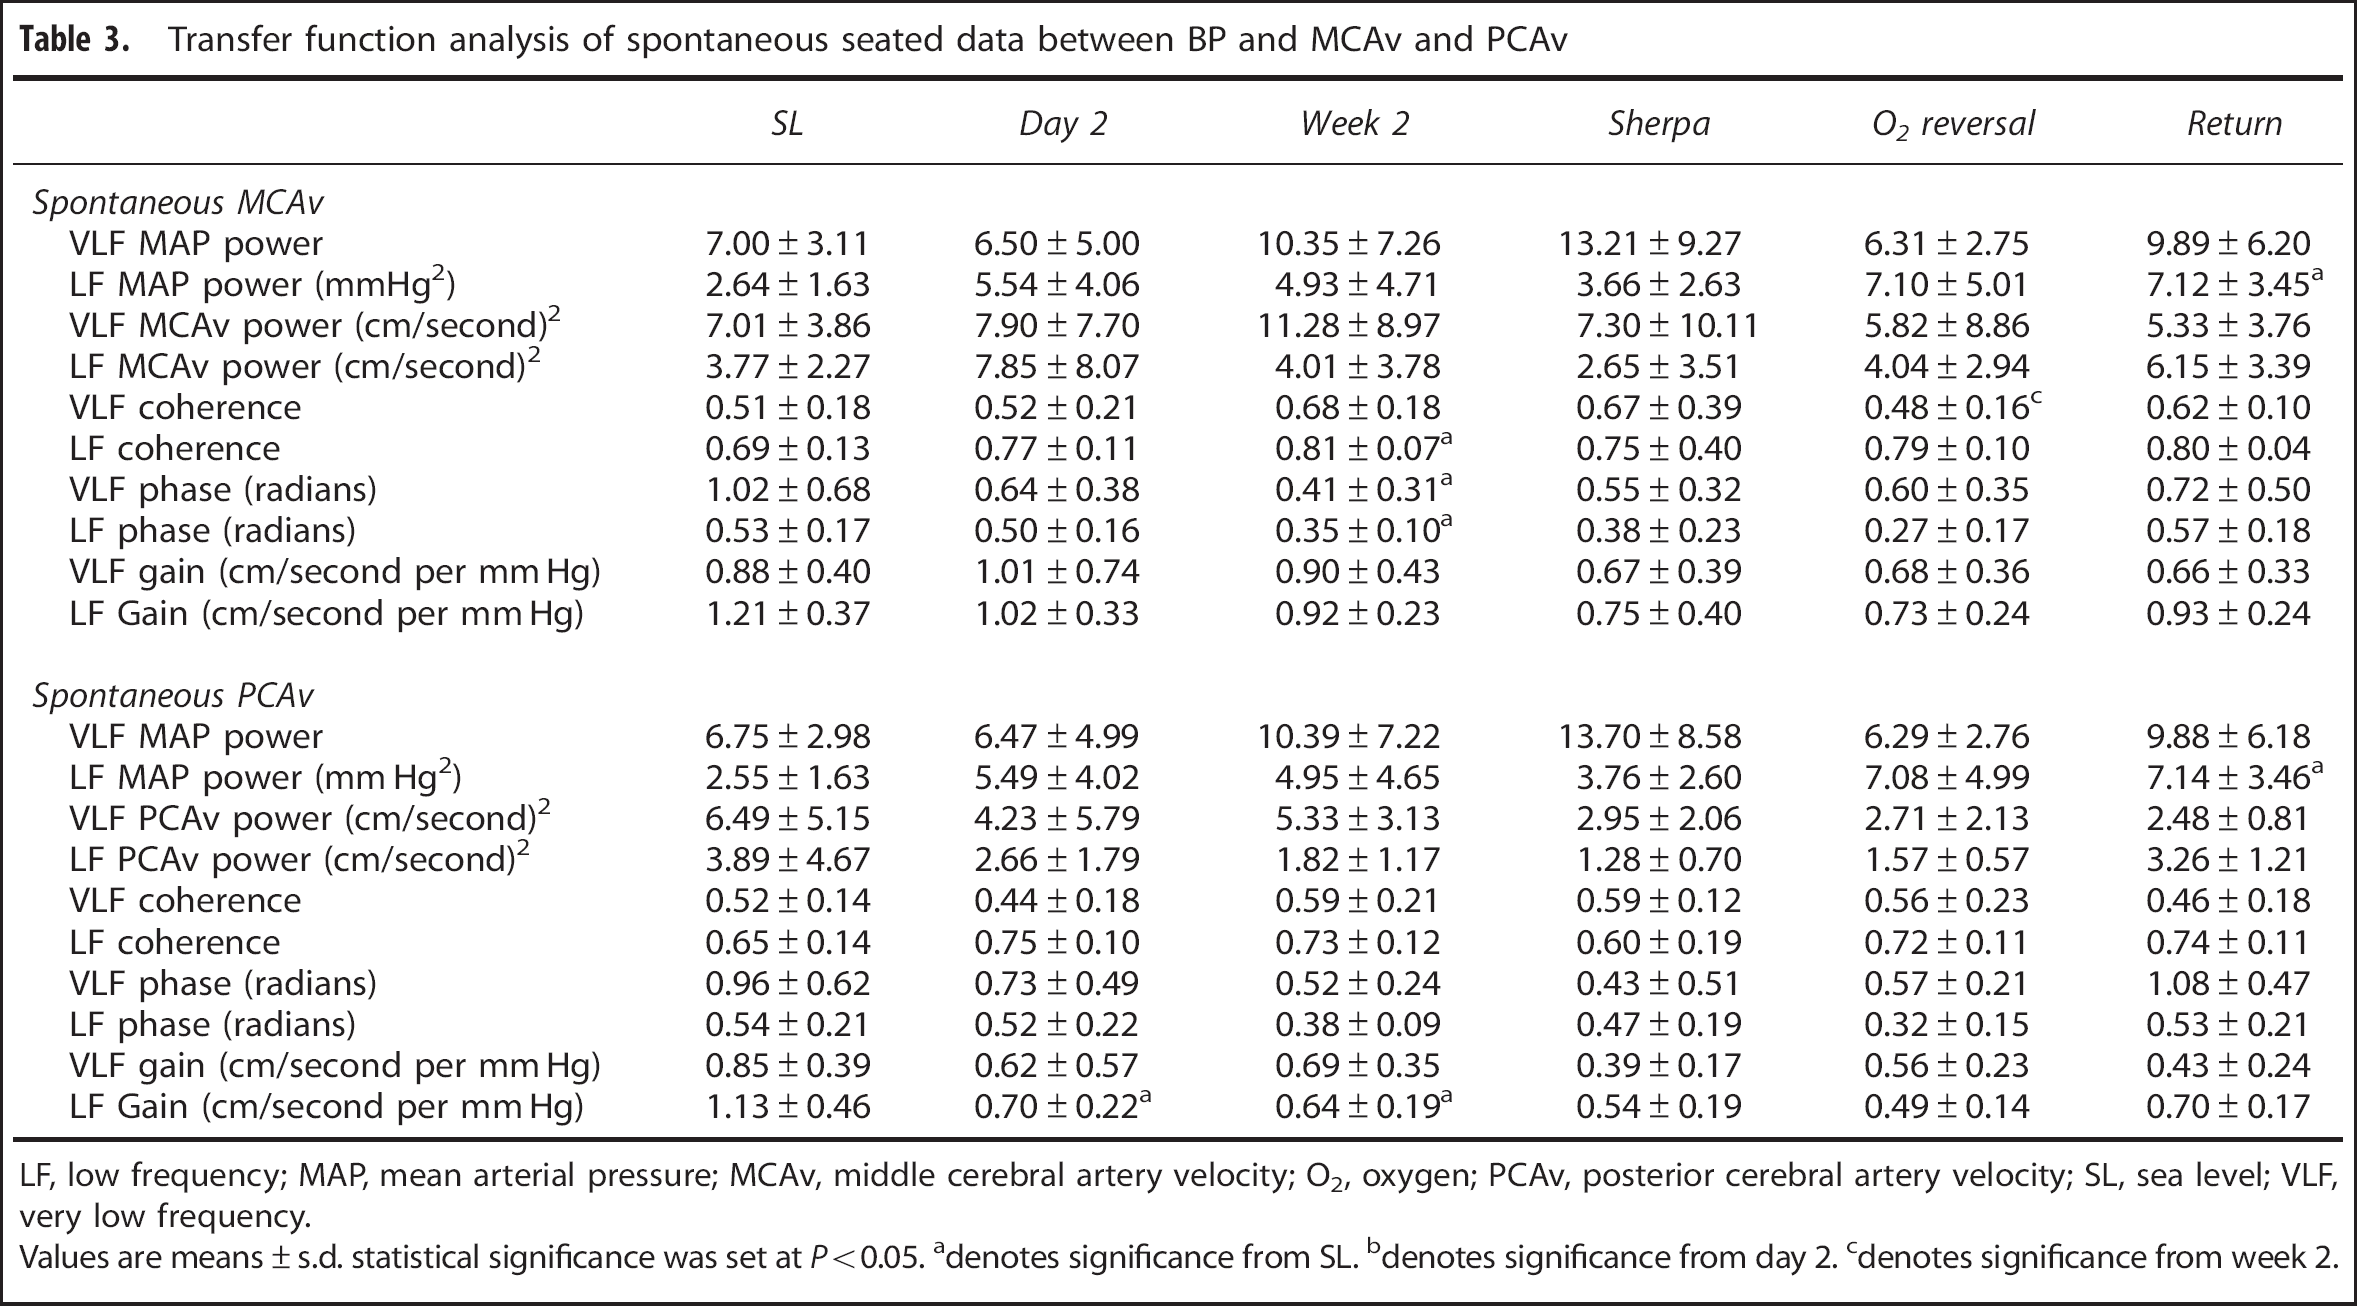
LF, low frequency; MAP, mean arterial pressure; MCAv, middle cerebral artery velocity; O2, oxygen; PCAv, posterior cerebral artery velocity; SL, sea level; VLF, very low frequency.
Values are means±s.d. statistical significance was set at P<0.05.
denotes significance from SL.
denotes significance from day 2.
denotes significance from week 2.
Transfer function analysis of driven data between BP and MCAv or PCAv
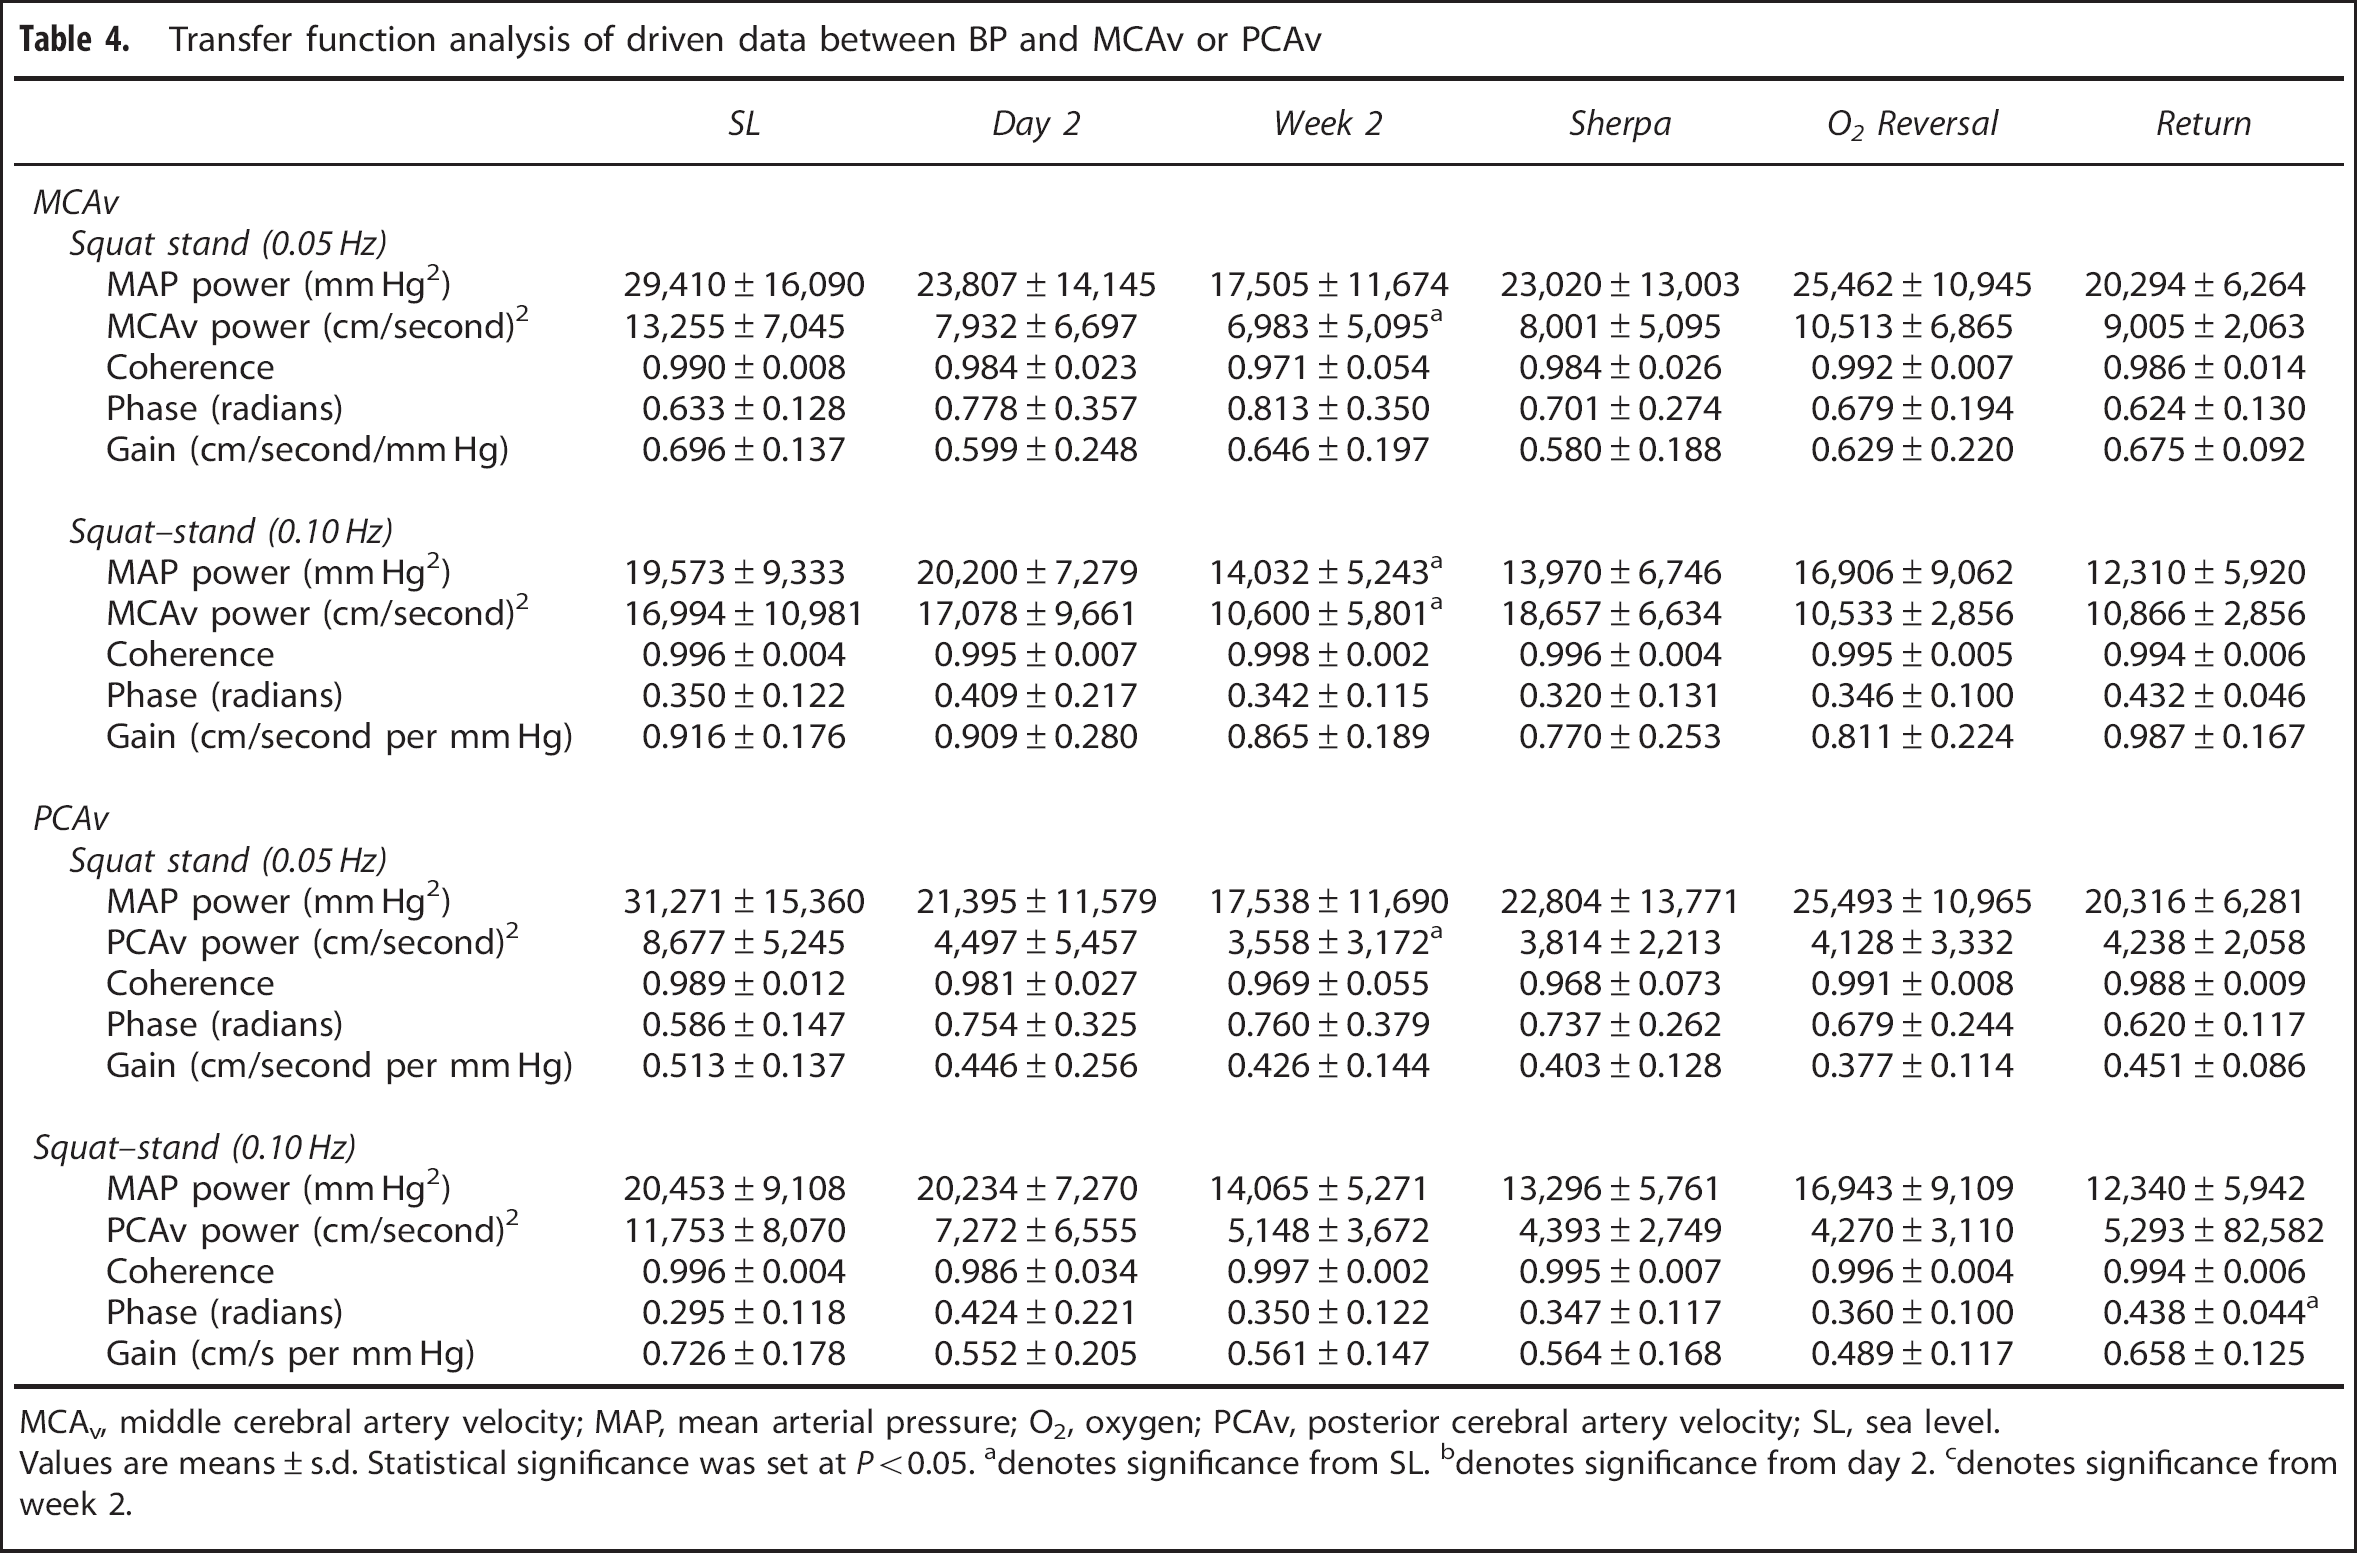
MCAv, middle cerebral artery velocity; MAP, mean arterial pressure; O2, oxygen; PCAv, posterior cerebral artery velocity; SL, sea level.
Values are means±s.d. Statistical significance was set at P<0.05.
denotes significance from SL.
denotes significance from day 2.
denotes significance from week 2.
Although seven subjects were AMS+ upon initial arrival to HA, there were no evident correlations between the ESQ-C (0.20±0.19) or Lake Louise (3.2±1.6) AMS scores with either TFA metric (phase: R 2 <0.04; gain: R 2 <0.02) on day 2 at 5,050 m. There were also no statistical differences in any TFA metric between those with and those without AMS symptomatology.
Influence of 2 Weeks of Acclimatization (Week 2)
After 2 weeks of acclimatization to 5,050 m, all subjects were free of AMS symptoms, and there was a 4% increase in the O2 saturation levels to ∼83% (P<0.001). The MCAv trended to being reduced (P=0.064) compared with SL values, and CVR was increased (by 33%; P<0.01). At the end of week 2, the PCAv and related CVR were unchanged from day 2 and were significantly altered compared with SL (P<0.01;Table 2).
Under spontaneous conditions, there were no statistical differences in the power spectrum of either: BP, MCAv, or PCAv after 2 weeks at HA compared with either the initial exposure or SL values (Table 3). Under driven conditions, MCAv and PCAv power spectrums were reduced to ∼50% of the SL values (P<0.05). Transfer function analysis of the spontaneous data revealed the MCA to have reduced phase measures in both the VLF and LF ranges (P<0.05). In contrast, the PCA had a 43% reduction in the LF gain during spontaneous baseline (P<0.01) as compared with SL values. These measures indicate that there appears to be an altered high-pass filter under spontaneous conditions within both the MCA and PCA after partial acclimatization to HA. With the increase in BP variability associated with the squat–stands, the PCA gain index for 0.10 Hz was trending to being reduced as compared with SL (−23%, P=0.061; Table 4). The remaining TFA metrics under driven conditions were all comparable to both SL and day 2 values (Table 4), which is indicative of an intact high-pass filter model within the cerebral circulatory system.
Comparison with High-Altitude Natives
The HA natives had a 22% lower MCAv and correspondingly higher MCA CVR (P<0.01) compared with the partially acclimatized lowlanders (week 2), while PCAv was comparable between the two groups (Table 2). The Sherpa had higher PETCO2 levels (33 versus 29 mm Hg, P<0.01) and lower O2 saturation levels (80% versus 83%, P<0.05) than the lowlanders. All other hemodynamic and cerebrovascular measures were comparable (Table 2). Under spontaneous and driven conditions there were no statistically significant differences between the Sherpa and the acclimatized lowlanders for any of the TFA metrics (Tables 3 and 4).
Effects of O 2 Normalization (n=8)
With the normalization of PETO2, PETCO2 increased by 3 mm Hg (P<0.05), the O2 saturation levels returned to SL values (97±1%) and PCAv reduced by 15% (P<0.05). All other hemodynamic and cerebrovascular measures were comparable (Table 2). Under spontaneous conditions, VLF coherence in the MCAv was reduced by 30% (P<0.05;Table 3). All other TFA metrics were not statistically different with normalization of PETO2 during either spontaneous or driven conditions (Tables 3 and 4).
Returning to Sea Level (n=6)
Two weeks after returning to SL, MCAv and PCAv were ∼14% lower than pre-HA values (P<0.05). All other hemodynamic and cardiovascular measures had returned to their pre-HA levels (Table 2). Under spontaneous conditions, although there was twofold increase in the arterial BP LF power spectrum (3.4 to 7.1 mm Hg2, P<0.05), all other spontaneous TFA metrics were not statistically different to initial SL measures (Table 3). During the induced elevations in BP variability, there was a 40% increase in 0.10 Hz phase in the posterior cerebral circulation (P<0.05), whereas all other TFA metrics were statistically unaltered from their initial SL values (Tables 3 and 4).
DISCUSSION
The key findings from this study were: (1) spontaneous VLF and LF phases were progressively reduced and coherence was elevated over time at HA compared with SL, indicating impaired cerebral pressure–flow coupling for the anterior cerebral circulation. However, when BP variability was increased in these frequency ranges via squat–stand maneuvers, such changes were not present in either the frequency or time domain; (2) the severity of AMS was unrelated to any changes in the pressure–flow relationship upon initial arrival to 5,050 m; (3) there appears to be no intrinsic differences in the cerebral pressure–flow relationship between HA natives and partially acclimatised lowlanders at 5,050 m; (4) with normalization of PETO2, the cerebral pressure–flow relationship at 5,050 m was unchanged in partially acclimatized lowlanders; and (5) although there was an ∼14% reduction in MCAv and PCAv present after returning to SL for 2 weeks compared with preexpedition SL values, the cerebral pressure–flow relationship was generally unaltered. Collectively, our findings indicate that HA is likely to lead to some alterations in the spontaneous cerebral pressure–flow relationship in humans residing at 5,050 m, although would seem not to be linked to AMS symptomatology. However, this observation is dependent on the method of assessment, and may subtly differ between the anterior and posterior cerebral circulation. When BP variability is increased via a squat–stand intervention, the cerebral pressure–flow relationship (in both frequency and time domains) is unaltered at HA (5,050 m) in lowlanders and HA natives. Because of this observation, we conclude that changes detected via the spontaneous TFA assessment of the pressure–flow relationship may not necessarily reflect a physiologically important alteration in the capacity of the brain to regulate BP. Before these main findings are discussed in the context of previous literature, relative methodological considerations that underpin these findings are considered.
Methodological Considerations
As there is no agreed-upon gold standard for the assessment of CA, 3 we have chosen not to evaluate the mechanisms behind the influence of HA on CA per se; rather, we have focused purely on the relationship that exists between BP and CBF. To quantify this pressure–flow relationship, we utilized TFA, which defines the linear statistical relationship (coherence) between the input (BP) and the output (MCAv or PCAv). Despite the widespread use of TFA to assess ‘dynamic’ autoregulation, it is important to note that the process of CA is not likely a purely linear system between BP and CBF. Other factors such as cerebrovascular compliance, cerebral blood volume, intracranial pressure, and venous outflow acting as a Starling resistor are likely to also contribute to this form of CBF control. We utilized the squat–stand maneuvers to increase the BP variability and thus improve the mathematical interpretability and reliability 2 of the TFA phase and gain metrics. The downside to performing these maneuvers is that by linearizing the pressure–flow response mechanism (coherence values for the driven data in this study were >0.97 a.u.), we may have ‘overwhelmed’ the autoregulatory mechanisms within the cerebrovasculature, which is a key reason for our discussion focusing on the cerebral pressure–flow relationship instead of CA per se. Nevertheless, we view such BP challenges as more physiologic and realistic of daily activities (e.g. postural changes, coughing, exercise, defecation, etc) than spontaneous measures alone. Moreover, in support of a maintained cerebrovascular capacity, even when we quantify the influence of the squat–stand maneuvers in the time domain (e.g. % changes in BP versus % changes in CBF over time) our conclusions persist (see Supplementary Information—Time-Domain Analysis).
Although we did not measure CBF directly at all time points, we utilized transcranial Doppler ultrasound to provide an index of CBF that enables us to use the relative changes in MCAv or PCAv to directly represent relative changes in the CBF within these arteries (as reviewed in Willie et al. 27 ). Further, given the known limitations of this technique and the possibility of dilation in the MCA,33, 34 we did not place emphasis on absolute MCAv/PCAv values but only the relative changes. Importantly, the high temporal resolution provided by the transcranial Doppler ultrasound makes it an ideal tool to study the pressure–flow relationship. Nevertheless, to complement this measure and quantify potential changes in MCA diameter and CBF, we also employed the novel approach of transcranial color-coded Duplex 34 in a sub-group of our lowlanders and Sherpa. We found no evidence of between-group differences in MCA diameter or flow (see Supplementary Information transcranial color-coded Duplex Analysis).
Dynamic Cerebral Pressure–Flow Relationships at High Altitude
Only five studies have assessed the dynamic cerebral pressure–flow relationship in lowlanders at HA.5, 9, 10, 11, 12 These investigations were conducted at a range of elevations (4,559 to 5,400 m) and generally in small samples of subjects. Out of these five, three studies assessed the dynamic cerebral pressure–flow relationship at one time point after arrival (between 1 to 10 days) to HA.5, 9, 10 Upon initial arrival to HA, Van Osta et al. 5 reported that there was an altered cerebral autoregulatory response, as measured using the autoregulatory index, in proportion to the severity of AMS in an individual. However, consistent with our initial arrival findings (<20 hours), they did not note any overall subject differences for the BP or MCAv at HA from SL. 5 We have previously reported an increase in VLF gain (36%) and a decrease in VLF phase (29%) upon initial arrival to HA (1 to 2 days), 9 and saw similar changes in a follow-up study after ∼1 week at 5,050 m 10 (VLF gain increased 71% and VLF phase decreased 67% compared with SL). Interestingly, we did not observe any changes in the LF gain or LF phase metrics in either study.9, 10 These findings seem to be contradictive to our current findings, as the VLF data is indicative of a general impairment in the pressure–flow response, whereas the LF data demonstrate an intact response. More likely, these findings highlight that there is a frequency-dependant response, where by the slower oscillations (VLF: >14 seconds per oscillation) are more affected by the initial arrival to HA than are the LF oscillations. The mechanism(s) underlying these frequency differences are unknown (see: Methodological Considerations).
Only one study, to our knowledge, has assessed the dynamic cerebral pressure–flow relationship after partial (more than 1-month) acclimatization. 11 That study did not report any data upon initial arrival to HA. Although some of the data from that acclimatization study was published in an earlier preliminary report, 11 a more recent analysis 12 revealed that after a 1-month acclimatization period, there was an increase in the VLF gain metric 11 and a decrease in VLF phase. 12 Their combined findings from both reports indicate that there is an altered pressure–flow response that is frequency dependant after partial acclimatization to HA. In the recent analysis, 12 those researchers attempted to use deep breathing at 0.05 Hz to improve BP variability and hence, TFA mathematical reliability; however, the deep breathing failed to affect either the VLF coherence (0.71±0.04 spontaneous versus 0.76±0.04 a.u. paced breathing) or the VLF gain (1.48±0.30 spontaneous versus 1.36±0.16 cm/second per mm Hg paced breathing). Therefore, it seems that their deep breathing intervention did not adequately increase the BP variability. Further, this deep breathing intervention resulted in approximately an 8 to 10-fold increase in the BP power spectrum, 12 whereas the squat–stand maneuvers used in our current study induced a >2,000-fold increase in the BP power spectrum (Tables 3 and 4), which were comparable to the increases shown in another SL study. 2
Our study, inclusive of both spontaneous and driven BP changes in a larger sample size, did not support the general ‘impairment’ in VLF pressure–flow relationships in the initial arrival data. However, our driven data did confirm the intact LF response upon initial arrival in the MCA and PCA phase and gain metrics (Table 4). In the partial acclimatization data, our spontaneous data findings do support the reduced VLF phase 12 in the MCA, yet the reduction in VLF phase in the PCA did not reach statistical significance (P=0.108; Table 3). In contrast to Iwasaki et al., 12 our driven data did show an improvement in the VLF (+45%) and LF (+23%) coherence and, in the context of the increased BP variability, indicate that the pressure–flow relationship is maintained in the MCA (Table 4). Of note, however, is the altered pressure–flow response in the posterior circulation; as evidenced by LF gain measures in both the spontaneous (Table 3) and driven (Table 4) data. Consistent with a greater sensitivity of the posterior region of the brain to acute severe hypoxia, 35 this finding raises the possibility of subtle regional differences in pressure–flow regulation upon prolonged exposure to HA. However, it should be noted that changes in TFA gain are likely the least robust metric in the assessment of the pressure–flow relationship during changes in arterial blood gases. 3
To summarize, our findings indicated that HA is likely to lead to some alterations in the spontaneous cerebral pressure–flow relationship in humans residing at 5,050 m, although would seem not to be linked to AMS symptomatology. Moreover, these findings are not universal as the driven data reveal that the cerebral pressure–flow response is indeed intact when there is an increase in the BP variability as induced by squat–stands. Because of these observations, we conclude that the differences in spontaneous TFA observed do not necessarily reflect physiologically important alterations in the capacity of the brain to regulate BP.
Pressure–Flow Relationships and Acute Mountain Sickness
A loss of CA has been reported to be an important underlying mechanism in the pathophysiology of AMS (as reviewed in Bailey et al 6 ). However, a correlative relationship between changes in dynamic cerebral pressure–flow regulation and severity of AMS4, 5 is not a universal finding.7, 8 Our study is the first to examine the relationship between AMS and the dynamic cerebral pressure–flow relationship in the field rather than based on predictions from sea-level variability in CA.4, 7, 8, 19 Our findings are consistent with well-controlled chamber studies7, 8 and demonstrate that alterations in the cerebral pressure–flow relationship do not appear to have a pivotal role in the development of AMS. We do acknowledge, however, that these findings are only in the context of the current study and relate to the mild-to-moderate symptoms of AMS that we observed upon initial arrival to 5,050 m after prior prophylactic use of acetazolamide during a graded ascent to 5,050 m.
Comparison with High-Altitude Natives
An early study by Lahiri and Milledge 36 demonstrated that Sherpa ventilated less than acclimatized lowlanders and had a hypoxic ventilatory response that was one-third that of acclimatized lowlanders. Our findings of higher PETCO2 levels and lower PETO2 and SaO2 levels in the Sherpa are consistent with these findings (Table 2). Although the elevated PETCO2 and reduced PETO2 would tend to increase CBF, 35 the slightly higher elevations in hematocrit in the HA natives 37 probably offset the vasodilatory influence of these changes in blood gases. Our finding of a comparable ‘intact’ pressure–flow response in Sherpa and partially acclimatized lowlanders at 5,050 m is seemingly in contrast to a previous report. 15 The conflicting outcomes between our findings and those of Jansen et al. 15 may be a result of the differences in elevation (5,050 m versus 4,243 m), acclimatization (14 versus 5 to 7 days) and method to assess the cerebral pressure–flow response (TFA versus % change of MCAv with phenylephrine injection).
The 22% lower MCAv in the HA natives compared with lowlanders in the present study is also different than this previous report, 15 where comparable MCAv was reported (Sherpa: 61±11; lowlanders: 63±12 cm/second). Early studies have established that natives with chronic mountain sickness and related polycythemia have reductions in CBF compared with chronic mountain sickness-free natives and lowlanders (e.g. ref. 38). However, in our study, the HA natives were free of chronic mountain sickness and polycythemia, which may help explain their comparable MCA diameter and flow at HA. Our finding of a lower MCAv is also inconsistent with the maintained MCA diameter and flow in Sherpa when compared with the acclimatized lowlanders. Interestingly, the PCAv in the current study was comparable between groups (Table 2) and consistent with this latter finding. Although small elevations in hematocrit in the HA natives may explain their reduced MCAv, it would not explain the discrepancy between a maintained MCA flow and PCAv unless there were some regional differences. We cannot explain these differences on the basis of our current data.
Normalization of End-Tidal PO2 at 5,050 m
Two studies to date have utilized the application of hyperoxia (FiO2=1.0) at HA to reverse the ‘impairment’ of the cerebral pressure–flow response.9, 16 In both Sherpa 16 and newly arrived lowlanders, 9 supplemental oxygen (FiO2=1.0) has been found to alleviate some of the altered cerebral pressure–flow responses which has been reported. In contrast to the previous studies, we applied hyperoxia (38% O2, 0.04% CO2, and 61.96% N2) that was sufficient to return PETO2 and SaO2 back to typical SL values. With this approach, we revealed comparable phase and gain metrics in both the spontaneous and driven data for the normalization of PETO2 as compared with the partially acclimatized subjects (Tables 3 and 4). Our findings indicate that supplemental O2, despite elevations in PETCO2 due to hypoventilation, neither augments nor impairs the cerebral pressure–flow response at HA.
Influence of High-Altitude Exposure on Middle Cerebral Artery Velocity and Posterior Cerebral Artery Velocity and Pressure–Flow Coupling Upon Return to Sea Level
Two weeks after returning to SL, we observed that all hemodynamic and cardiovascular measures returned to their previous HA levels except for the absolute values of MCAv and PCAv (down 14% in both; P<0.05; Table 2). Recent reports have shown that CBF (as assessed using arterial spin labeling magnetic resonacen imaging) is elevated 6 hours after return to SL from 4,350 m 39 and within 8 hours of returning from 3,800 m. 40 The time course of recovery of CBF and cerebral metabolic rate for oxygen after return from HA is not known and warrants future investigation. Nevertheless, the decreased MCAv and PCAv upon return did not alter the dynamic cerebral pressure–flow response, as indicated by the comparable findings in TFA metrics between pre- and post-HA.
CONCLUSION
We conclude that under spontaneous conditions, there appears to be ‘alterations' in the cerebral pressure–flow relationship after partial acclimatization that is not alleviated by the normalization of PETO2. However, when the BP variability is increased via squat–stand maneuvers, there appears to be little evidence of altered cerebral pressure–flow relationships (as evident in both the frequency and time domain) at HA in lowlanders either upon initial arrival or after partial acclimatization or in native populations with generations of exposure to HA. We interpret our findings to indicate that the spontaneous changes in TFA metrics do not necessarily reflect physiologically important alterations in the capacity of the brain to regulate BP.
Footnotes
The authors declare no conflict of interest.
ACKNOWLEDGMENTS
The authors are grateful to the other members of the UBC International Research Expedition to Mt. Everest for invaluable help with logistical planning and implementation of this research study. The authors would like to specifically thank Dr Jim Cotter and Dr Keith Burgess for their insight into the preparation of the manuscript. Nima Sherpa was one of our guides who helped with communication between the Sherpa subjects and JDS and also assisted with the data collection.
References
Supplementary Material
Please find the following supplemental material available below.
For Open Access articles published under a Creative Commons License, all supplemental material carries the same license as the article it is associated with.
For non-Open Access articles published, all supplemental material carries a non-exclusive license, and permission requests for re-use of supplemental material or any part of supplemental material shall be sent directly to the copyright owner as specified in the copyright notice associated with the article.