
Abstract
Cerebral autoregulation (CA) describes the mechanism responsible for maintaining cerebral blood flow (CBF) relatively constant, despite changes in mean arterial blood pressure (ABP). This paper introduces a novel method for assessing CA using magnetic resonance imaging (MRI). Images are rapidly and repeatedly acquired using a gradient-echo echo-planar imaging pulse sequence for a period of 4minutes, during which a transient decrease in ABP is induced by rapid release of bilateral thigh cuffs. The method was validated by comparing the observed MRI signal intensity change with the CBF velocity change in the middle cerebral arteries, as measured by transcranial Doppler (TCD) ultrasound, using a standardized thigh cuff maneuver in both cases. Cross-correlation analysis of the response profiles from the left and right hemispheres showed a greater consistency for MRI measures than for TCD, both for interhemisphere comparisons and for repeated measures. The new MRI method may provide opportunities for assessing regional autoregulatory changes following acute stroke, and in other conditions in which poor autoregulation is implicated.
Introduction
Cerebral autoregulation (CA) describes the mechanism responsible for maintaining cerebral blood flow (CBF) relatively constant, despite changes in mean arterial blood pressure (ABP) (Lassen, 1959). Following the introduction of Transcranial Doppler (TCD) ultrasonography (Aaslid et al, 1982), the classical ‘static’ approach to the estimation of CA in humans has been replaced by dynamic techniques aiming to quantify the transient response of CBF to rapid changes in mean ABP (Aaslid et al, 1989; Tiecks et al, 1995). Relatively fast changes in mean ABP can be induced by a number of different maneuvers, such as the Valsalva maneuver, hand-grip, cold stress test, or changes in posture (Panerai et al, 2001; van Beek et al, 2008).
Of particular interest is the sudden release of inflated thigh cuffs, the original approach proposed by Aaslid et al (1989), which also led to the concept of the autoregulatory index (ARI). Assuming that the sudden decrease in mean ABP induced by the thigh cuff release approximates an ideal negative step change, the ARI is obtained by fitting 1 of 10 possible CBF velocity (CBFV) template response curves, each corresponding to an ARI value ranging from 0 (absence of autoregulation) to 9 (best observed autoregulation). Subsequent work has shown that ARI values can also be extracted by modeling the dynamic relationship between mean ABP and CBFV resulting from spontaneous fluctuations in these variables (Panerai, 1998). Clinical applications of the thigh cuff technique have included patients with stroke, orthostatic hypotension, carotid artery disease, and head injury, as well as studies of the effects of anesthetic agents on CA (Panerai, 2008).
Despite the demonstration that TCD-derived ARI and other dynamic CA parameters are sensitive to pathophysiological changes in CA, a major limitation of the technique is its poor spatial resolution. Different arteries can be insonated, but most clinical studies have performed measurements in the middle cerebral arteries (MCAs), thus being limited to the detection of hemispherical differences. Greater spatial discrimination in CA assessments would be highly desirable in many clinical conditions, such as the evaluation of focal ischemia and the surrounding tissue in stroke patients, as well as regional differences in traumatic brain injury. A number of different imaging techniques could be considered for this task, but magnetic resonance imaging (MRI) stands out, given its availability, and the body of knowledge that has accumulated from functional studies, as well as its ability to grade tissue damage using a combination of diffusion-weighted MRI (DW-MRI) and perfusion studies using contrast agents (Kidwell et al, 2000). The potential of MRI to improve the spatial discrimination of dynamic CA parameters might already have been realized, if it were not for one major limitation: the difficulty of obtaining beat-to-beat values of mean ABP inside the magnet. To overcome this major stumbling block, we have investigated the feasibility of performing MRI measurements that are sensitive to changes in cerebral perfusion during thigh cuff maneuvers, in an attempt to identify regional differences in CA. In this initial validation study, we have compared MCA CBFV responses to the maneuver recorded with TCD with changes detected using MRI in brain regions that cover the perfusion territory of the MCAs, in a group of healthy volunteers.
Materials and methods
Subjects and Measurements
A total of 10 subjects (7 men) of mean age 59 ± 15 years (range 31 to 75) were recruited from departmental volunteers and responses to advertisements placed in local health clubs. Subjects were excluded if they had a history of cardiovascular disease, migraine, epilepsy, or other chronic neurologic disorders, or if they had contraindications to MRI scanning. The study was approved by the Leicestershire, Northamptonshire and Rutland Research Ethics Committee (REC 09/H0403/25).
On arrival at the clinical laboratory, subjects were familiarized with the study protocol and informed consent obtained. Demographic details, a medical history, and prelab behavior (time from last caffeine intake, cigarette, and alcohol dose) were recorded.
Clinical Protocol
The clinical protocol consisted of two parts: TCD and MRI measurements. Magnetic resonance imaging scans always followed TCD, with a median time interval between them of 2hours (range 0.5:8 hours). Details of the two procedures are given below.
Transcranial Doppler Ultrasonography
Initial assessments were performed in the dedicated cardiovascular research laboratory, which was at a controlled temperature (20°C to 24°C) and free from distraction. Subjects were asked to adopt a supine position, with arms resting by their sides, and pillows were used for head support. Casual blood pressure (BP) was measured at the upper arm using a validated cuff device (Omron Healthcare Co. Ltd, Veghel, The Netherlands). Blood pressure was measured noninvasively using finger arterial volume clamping (Ohmeda 2300; Finapres, Louisville, CO, USA), with a BP cuff applied to the middle phalanx of the middle finger of the opposite hand to which the Omron was attached. Cuff sizes were selected to suit each individual, to obtain a stable BP measurement. A three-lead surface electrocardiogram was recorded continuously. End-tidal CO2 (EtCO2) was monitored using a capnograph (Capnocheck Plus, Kent, UK) attached to nasal cannulae (Salter Labs, Arvin, CA, USA).
Transcranial Doppler ultrasonography (Viasys Companion III; Viasys Healthcare, San Diego, CA, USA) was used to measure blood flow velocity in the left and right MCAs simultaneously, as a surrogate for CBF. Two transducers operating at 2MHz were positioned on the temporal bone, and the MCAs were identified by adjusting the positions of the transducers to yield the maximum reflected signal at a depth of 45 to 60mm. The transducers were then secured in position using a head frame.
Each subject rested for a stabilization period of 15 minutes, after which a peripheral BP measurement was taken using the Omron. Recordings of ABP, electrocardiogram traces, EtCO2, and CBFV, were made in each subject before, during, and after a step drop in BP. The servo-adjust function of the plethysmograph was turned off at the beginning of each recording, and the signal was calibrated for each measurement. Digitized signals of all parameters were stored through a physiologic data acquisition system (PHYSIDAS, Leicester, UK) for offline analysis.
The thigh cuff technique was used to induce the step drop in ABP. Large thigh cuffs (Hokanson model C22, Bellevue, WA, USA) were placed one on each thigh ~10cm above the knee, and inflated 20mmHg (or more) above the peak systolic ABP in all cases. An adapted bicycle pump was used for cuff inflation. The occlusion was maintained for 3 minutes. A transient BP drop was then induced by fast simultaneous pressure release in both cuffs using a rapid cuff deflator (Hokanson model RD2).
Each participant underwent an initial baseline recording of 5minutes, after which three repeats of the ABP step-drop measurement were performed, each one including a 3-minute period of cuff inflation and 2-minute postdeflation; all parameters were recorded during the 5minutes. The recordings for each subject were carried out in a single session, during which the volunteer remained supine.
Magnetic Resonance Imaging
All MRI measurements were performed using a 1.5-T clinical MRI scanner (Symphony; Siemens Medical, Erlangen, Germany) using a standard birdcage head coil for signal reception.
After arrival at the MRI suite and being seated for a period of 10 minutes, peripheral BP measurements were taken using an Omron, as a guide for thigh cuff inflation pressures. Subjects then lay supine on the scanner couch and the cuffs wrapped around each thigh (using the same protocol as described above for TCD measurements). A lightweight foam collar was used to support the head and neck, and a custom-made foot rest was clamped to the couch to provide additional support during the cuff deflation maneuver. This is a wooden plate that projects upwards from the couch and is adjustable to provide a firm base against which the subjects could brace their feet at a comfortable ankle flexion angle.
After a localizer scan, standard dual-echo fast spin-echo and spin-echo echo-planar imaging DW sequences were performed so that any existing pathology could be identified. The sequence parameters for the dual-echo scan were: TR (repetition time) = 2,930 milliseconds; TE (echo time) = 1,586 milliseconds; echo train length = 5; matrix = 256 × 256; in-plane resolution = 0.9 × 0.9 mm2. For the DW sequence, the parameters were: TR = 4,100 milliseconds; TE = 112 milliseconds; matrix = 128 × 128; in-plane resolution = 1.796 × 1.796 mm2 interpolated to 0.898 × 0.898 mm2. Diffusion weighting was applied in three orthogonal directions, with a b-factor of 1,000 seconds/mm2; an image without diffusion weighting was also collected. For both sequences, 21 axial slices were acquired, with a slice thickness of 5 mm and a 2-mm gap between slices, covering the whole of the cerebrum. Slices were positioned parallel to a line that joined the most anterio-inferior and posterio-inferior margins of the corpus callosum as viewed on a sagittal localizer, correcting for any head tilt by also viewing in the coronal plane.
The thigh cuffs were then inflated and the main image series was begun as soon as the cuffs were up to pressure. This consisted of rapid serial acquisition using a gradient-echo echo-planar imaging sequence (TR= 1,000 milliseconds; TE = 40 milliseconds; flip angle = 40° matrix = 64 × 64; in-plane resolution = 3.45 × 3.45 mm2; slice thickness = 5 mm; gap between slices = 4 mm). A minimum temporal resolution of 1 second is important to agree with a large body of literature on dynamic CA based on a frequency bandwidth of 0.5 Hz (Aaslid et al, 1989; Panerai, 1998, 2008; van Beek et al, 2008). Overall, 12 slices were positioned as for the dual-echo and DW scans, but there was less coverage of the cerebrum because of the smaller number of slices acquired. A total of 240 multislice image sets were acquired over 4 minutes; 3 minutes into the series, the cuffs were rapidly deflated as for the TCD. After the scan was completed, the cuffs were reinflated and the procedure was repeated twice more, as for the TCD protocol. The recordings for each subject were carried out in a single session, during which the volunteer remained supine without being removed from the scanner.
Data Analysis
Data acquired through the PHYSIDAS were edited using application-specific software designed by the Medical Physics Group of the Department of Cardiovascular Sciences at the University of Leicester. The ABP signal was calibrated for each measurement. Traces for the left and right CBFVs were visually inspected and passed through a filter that replaces the midsample of typically five or seven samples, with the median value of all samples in the sliding window (‘median filter‘). This filter is particularly suited for removing small spikes in CBFV signals. The right and left CBFV, ABP, electrocardiogram, and EtCO2 were then low-pass filtered (Butterworth, 20Hz cutoff). Finally, the data for each parameter were passed through a parameter extraction program, producing beat-to-beat data suitable for further analysis. The left and right CBFV values were resampled to a fixed sample point interval of 1/ 12th second.
Magnetic resonance imaging data were analyzed using an in-house software package designed specifically for processing MRI scans. After transfer from the MRI scanner, the dynamic images were composed into 4-dimensional sets (3 spatial dimensions and 240 time points), which allowed visual inspection of movement by the subject by playing them in a movie loop. None of the sets of images showed significant amounts of motion during the 4-minute dynamic scans with the thigh cuff maneuver.
Analysis of the MRI data focused on the four central slices, corresponding to the main anatomic areas perfused by the MCA. On each of the four slices, the brain was outlined using a semiautomated edge detection algorithm (Cader et al, 2006). Each brain region of interest was then divided manually into left and right halves of the brain to produce a total of eight regions of interest. The change in signal intensity over the 240-second time series was then extracted for each of the eight regions of interest. During each 1-second repetition, the 12 image slices were acquired sequentially; a correction was therefore made for the slight acquisition time difference between different slices by linear interpolation and resampling of the signal intensity time courses. An average of the signal intensity for the four slices, weighted by the area of the region of interest in each slice, was then calculated, giving a mean intensity time course for the left and right sides of the brain. Figure 1 shows a segmentation of the brain in the four slices for one subject, together with a portion of the time—intensity curve for just the right side of the brain in the four slices separately. The time—intensity curve for a small region in the gray matter is also shown.
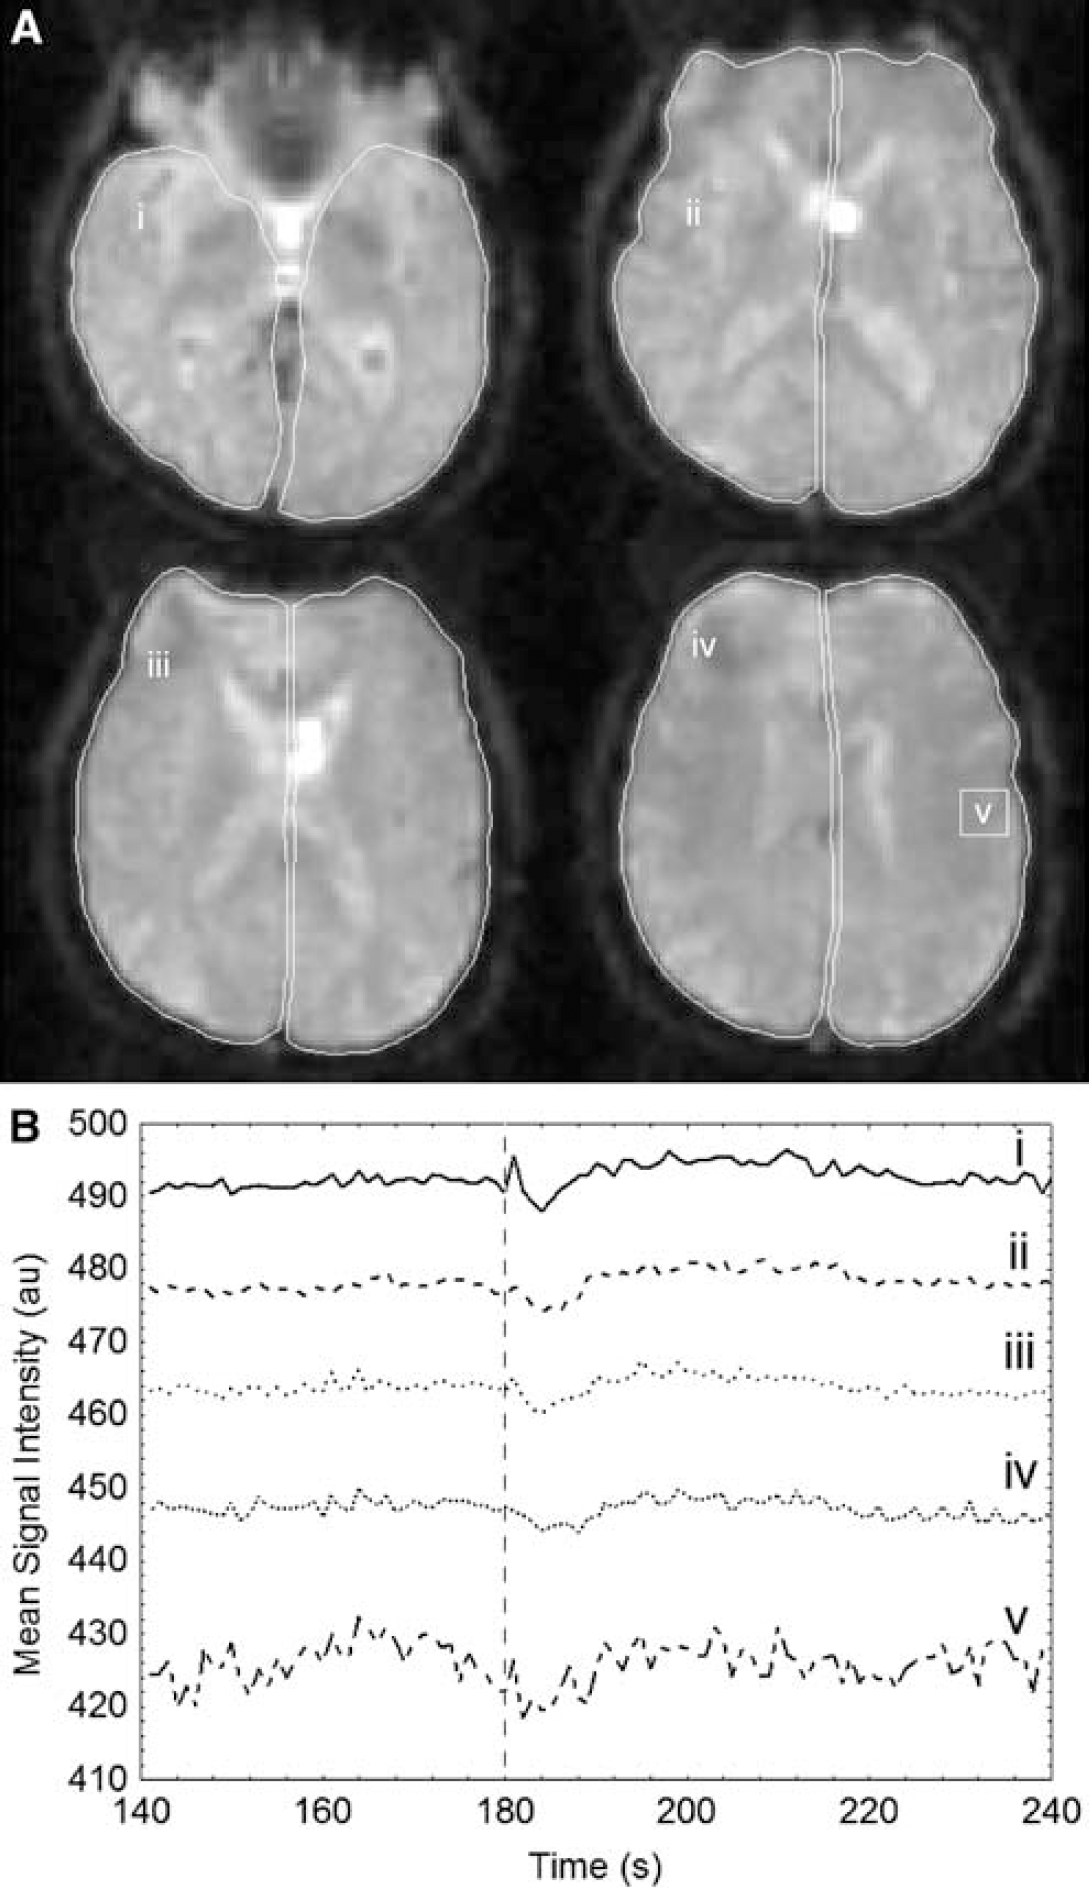
Temporal responses of parameters to the maneuver. (
Statistical Analysis
Descriptive statistical analyses (mean, s.d., and range) were applied to baseline characteristics (ABP, heart rate, EtCO2) and population demographics (age, height, weight, body mass index). A preset window from the release of the cuff to 30 seconds postdeflation was used to cross-correlate each parameter response (TCD and MRI). For the cross-correlation function curve, a peak value (Pxc) was extracted and used in subsequent analyses. The coefficient of variation (CoV) was calculated for the Pxc over three repeated measurements, as an indicator of intrasubject variation, as well as the mean and s.d. over the population. We also calculated Pxc mean and s.d. for the population. To estimate similarities within and between modalities, Pxc data sets (TCD versus TCD, MRI versus MRI, and TCD versus MRI), were first transformed using a z-trans-formation, followed by a repeated-measures ANOVA (analysis of variance) and post hoc Scheffé's test. All statistical analyses were performed using Statistica version 8 software (StatSoft Inc., Okhlahoma, USA).
Results
A total of 10 subjects were recruited, but 1 subject withdrew from the study because of intolerance to the thigh cuff maneuver. The 9 subjects studied had mean ± s.d. age 59 ± 15 (range 31 to 75) years. All subjects were nonsmokers and consumed neither caffeine nor alcohol for at least 2 hours before participating in the study. Baseline characteristics of the population are presented as mean ± s.d., and included height (174 ± 9 cm), weight (78 ± 11 kg), body mass index (25 ± 5 kg/m2), heart rate (61 ± 7 beats/min), peripheral systolic BP (138 ± 32 mmHg), diastolic BP (87 ± 15mmHg), and EtCO2(31 ± 11 mm Hg). Examination of the dual-echo and DW-MRI scans showed no abnormalities in any of the subjects that were not commensurate with normal aging.
During the TCD protocol, all subjects showed a distinct decrease in mean ABP in response to the sudden release of the inflated thigh cuffs. Careful visual inspection of individual recordings led to rejection of four TCD and three MRI recordings owing to an insufficient decrease in the response profile of the ABP for TCD measurements and signal intensity for MRI. In each modality, two of these recordings were rejected from a single subject. As a result, the calculations of intrasubject CoV could only be performed in eight subjects for the intra-TCD and intra-MRI cross-correlation estimates (Table 1). For the accepted TCD recordings, the mean BP decrease was 19% ± 11% of baseline values, ranging from 9.3% to 59.2%. The corresponding decrease in CBFV was 24% ± 7% of baseline values, ranging from 4.5% to 64.8%.
Distribution of peak cross-correlation values (Pxc) and coefficients of variation (CoV) over the population
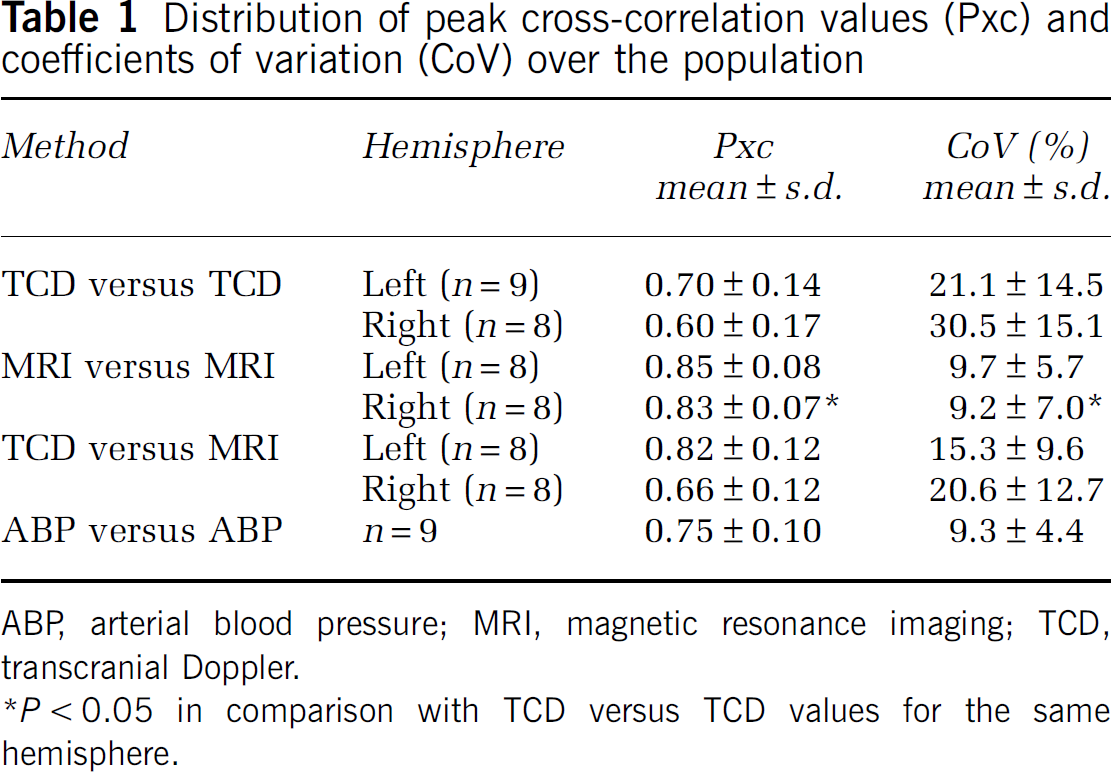
ABP, arterial blood pressure; MRI, magnetic resonance imaging; TCD, transcranial Doppler.
P < 0.05 in comparison with TCD versus TCD values for the same hemisphere.
Typical recordings of ABP, CBFV, and MRI signal intensity are presented in Figure 2, showing the simultaneous decrease following cuff release and the early return to baseline values of CBFV when compared with the time course of the ABP signal. The MRI signal intensity had a temporal pattern similar to the CBFV response. The corresponding population-averaged curves for the same variables (Figure 3) indicated a consistent temporal pattern for all subjects and a relatively uniform longitudinal variability.
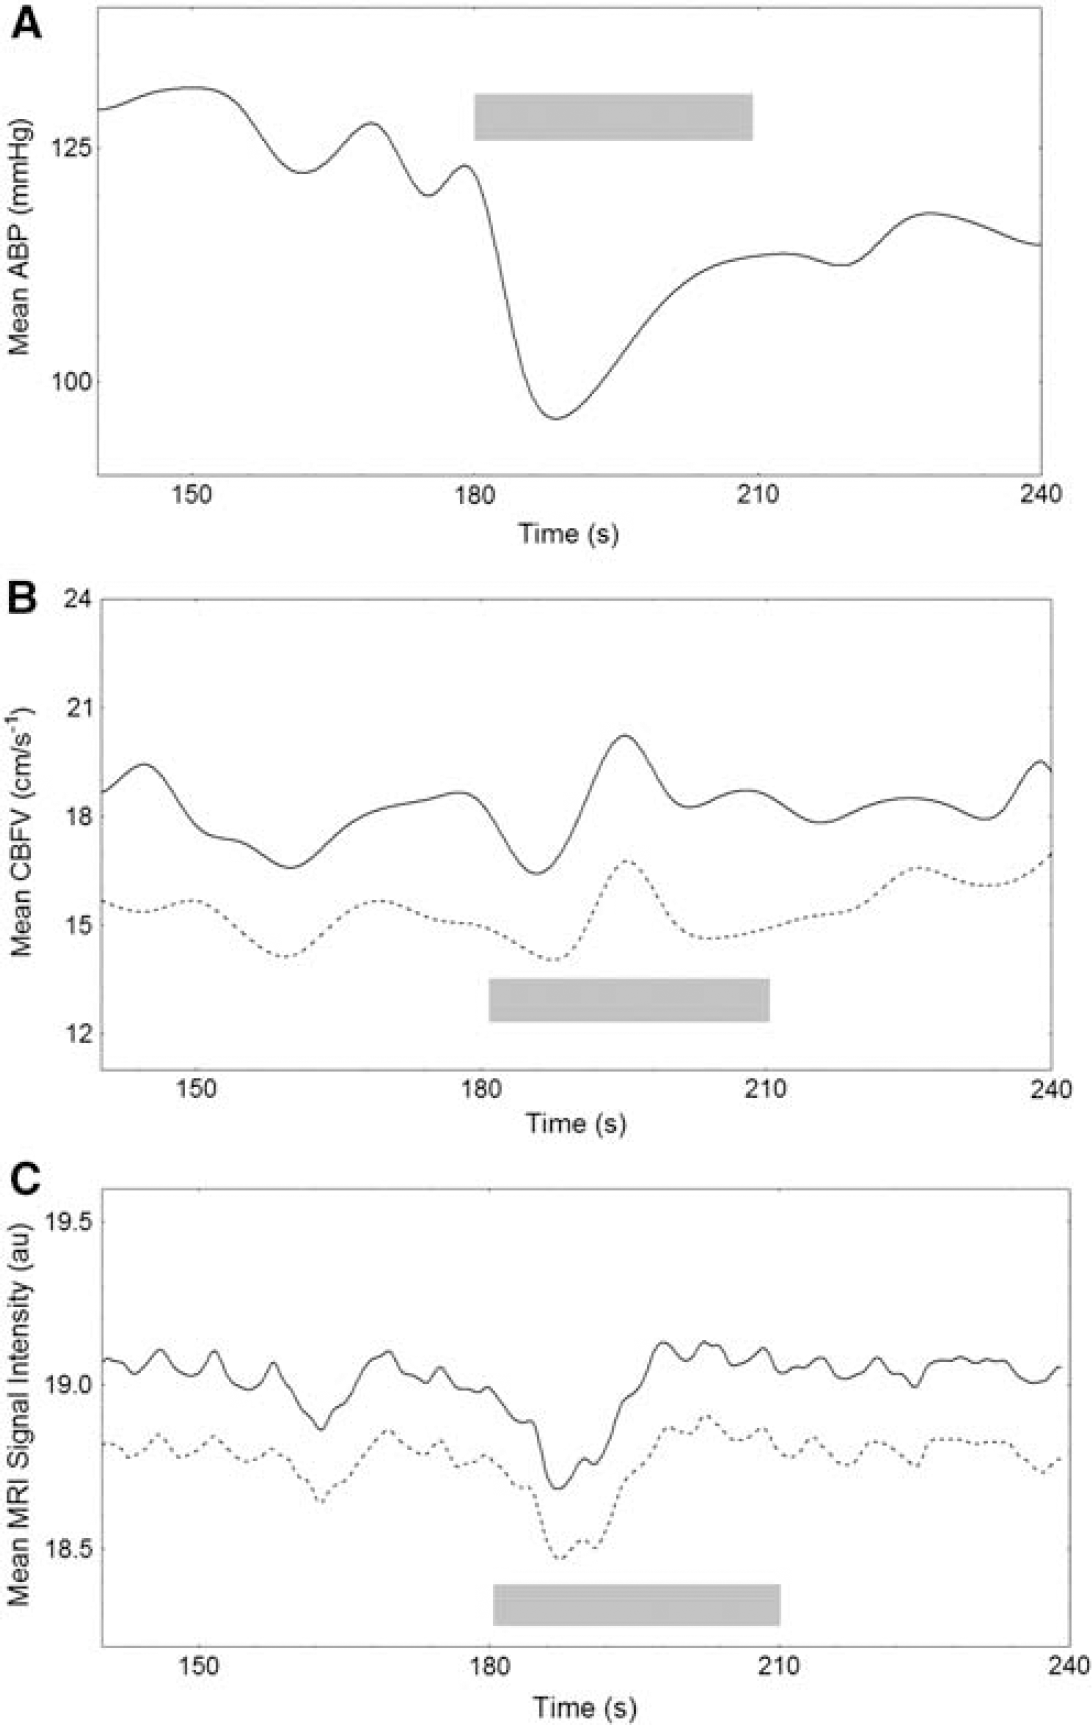
Temporal responses of parameters to the maneuver. Comparison of temporal responses obtained from (
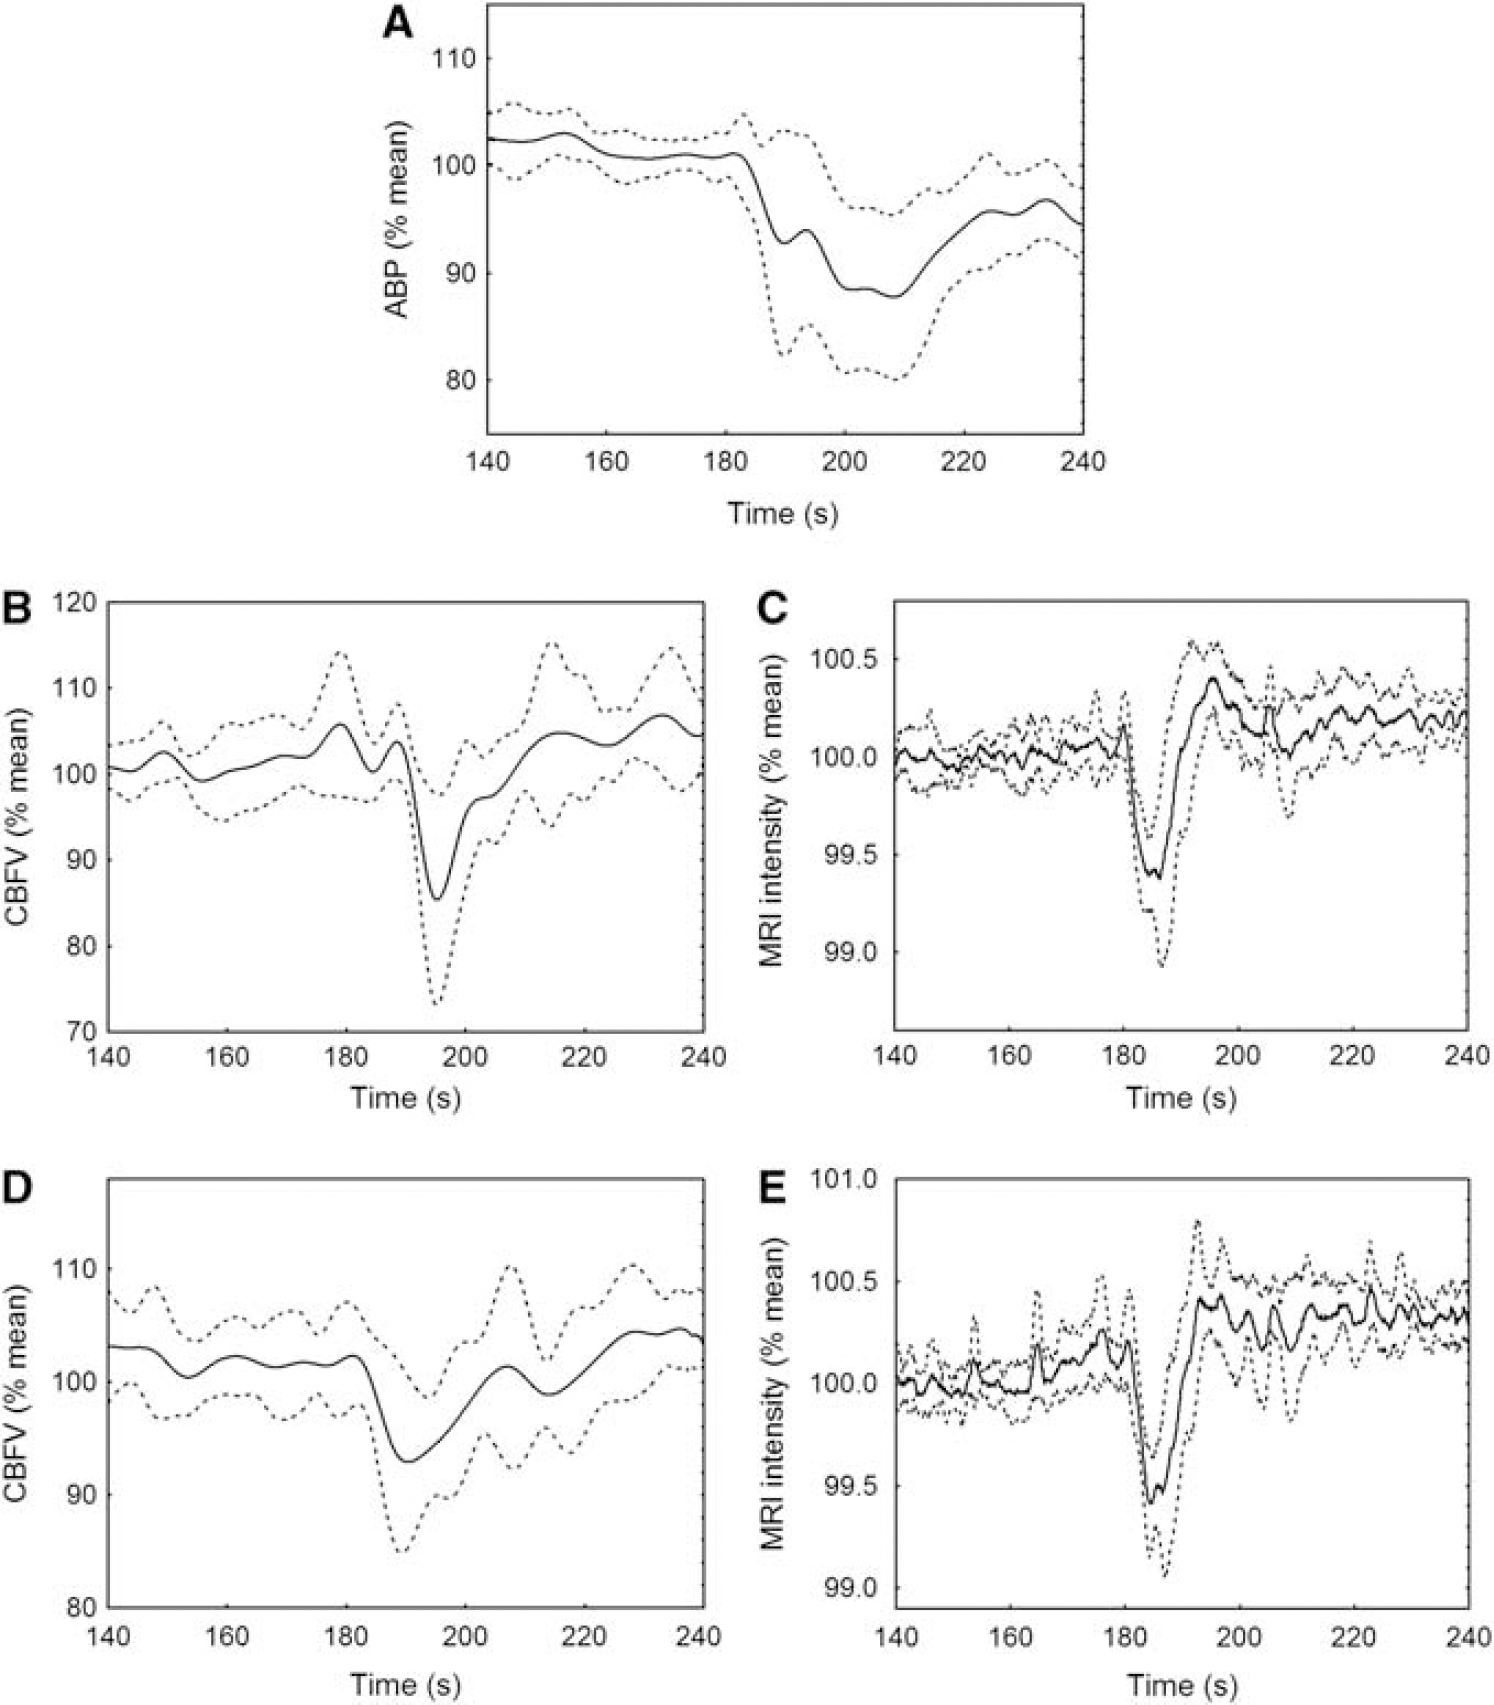
Temporal responses of parameters to the maneuver. Population mean (solid line) ± 1 s.d. (dashed line) temporal responses for (
An example of the cross-correlation function for the three types of cross-correlation performed is shown in Figure 4. A clear peak was identified in all 240 cross-correlations, with time delays consistent with the synchronization of the CBFVand MRI signal intensities described above. Mean ± s.d. peak cross-correlation values (Table 1) suggest more consistent results for the intra-MRI cross-correlations than for the intra-TCD cross-correlations, although statistical significance was only achieved for the right hemisphere (ANOVA P = 0.015, post hoc Scheffé's P = 0.023). The intermodality cross-correlations (TCD versus MRI) fell between the two intramethod values (Table 1). The intra-MRI cross-correlations also showed better intrasubject reproducibility, as reflected by the smaller CoV (Table 1). Similar to the peak cross-correlation values, significant differences were only obtained for the right hemisphere (ANOVA P = 0.022, post hoc Scheffé's P = 0.022). The mean Pxc values for ABP versus ABP were approximately the same as those for the TCD versus TCD case (Table 1), but its CoV was considerably less and similar to what was observed for the MRI versus MRI cross-correlations.
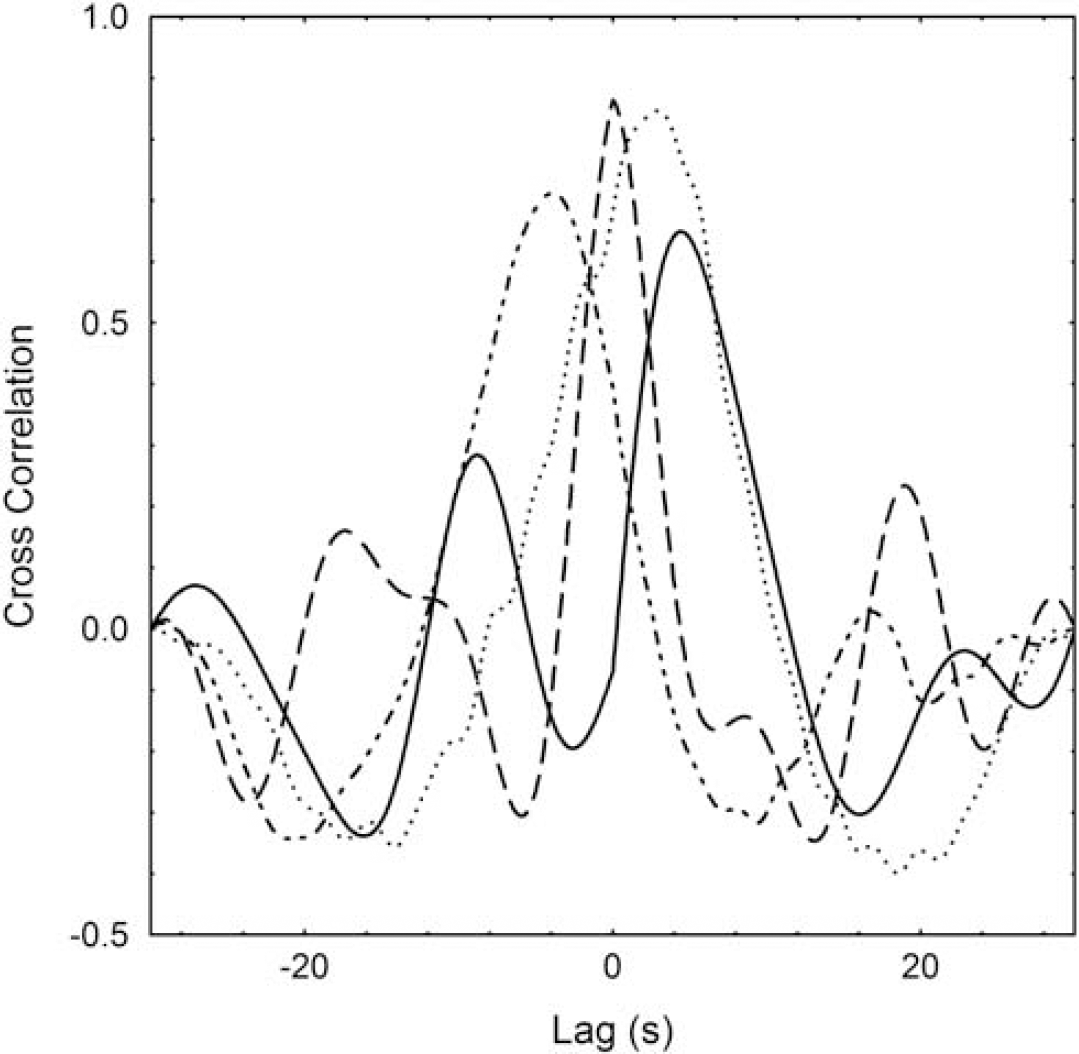
Representative cross-correlation function for a 30-second window of ABP versus ABP (solid line), TCD versus TCD (dashed line), MRI versus MRI (dotted line), and TCD versus MRI (dash-dotted line) for a 45-year-old male subject. ABP, arterial blood pressure; MRI, magnetic resonance imaging; TCD, transcranial Doppler.
Further evidence of the superior consistency of MRI intensity changes following thigh cuff release was provided by the interhemispherical comparison shown in Figure 5. Although TCD cross-correlation peak values showed considerable scatter, indicating poor correlation between estimates for each hemisphere, there was a clear correlation between the intra-MRI cross-correlation values, and a noticeable cluster for values above 0.70 (Figure 5).
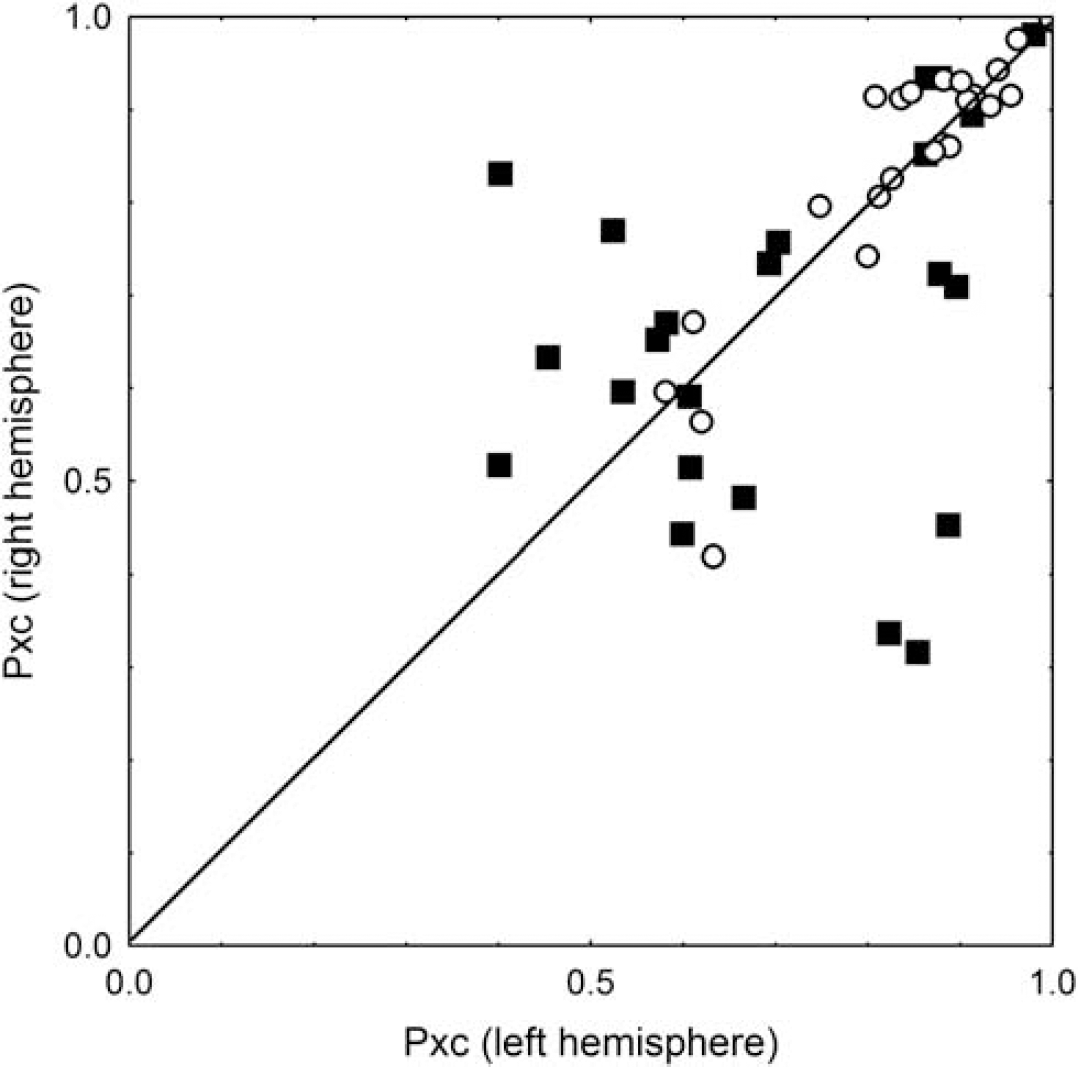
Distribution of cross-correlation values in the two separate hemispheres, for TCD and MRI techniques. The peak cross-correlation value (Pxc) for individual measurements for the left hemisphere is plotted against Pxc for the right hemisphere. As each measurement was performed up to three times, there are up to three points for each subject per modality. Filled squares are for TCD and circles are for MRI. MRI, magnetic resonance imaging; TCD, transcranial Doppler.
Discussion
This study showed the feasibility of performing thigh cuff maneuvers in healthy subjects in an MRI scanner. Contrary to what might have been expected, movement artifact was not a major limitation, and once subjects had the experience of undergoing thigh cuff maneuvers during TCD laboratory tests, the MR environment did not contribute to any subjects withdrawing from the study. As Aaslid et al (1989) introduced the thigh cuff maneuver as a tool to assess dynamic CA, a large number of studies have shown that in healthy subjects, CBF (or CBFV) drops rapidly with the sudden deflation of the cuffs, and then returns to baseline values faster than the mean BP (Aaslid et al, 1989; Mahony et al, 2000; Tiecks et al, 1995). Conversely, when dynamic CA is impaired, the return of CBFV to baseline is much slower, often following the mean BP signal closely (Dawson et al, 2000; Tiecks et al, 1995). The temporal patterns of CBFV that we obtained (Figures 2 and 3) are in excellent agreement with those reported by many other centers. What has not been reported previously, though, is the temporal pattern of changes obtained by MRI following a thigh cuff maneuver. As quantified by the cross-correlation analysis we performed, the temporal profile of MRI signal intensity had a remarkable similarity to TCD profiles. Moreover, contrary to our expectations, thigh cuff responses obtained by MRI showed significantly greater reliability than those recorded with TCD.
We are not aware of previous studies using the cross-correlation function to quantify the similarity of CBF-related responses for different thigh cuff maneuvers. The 30-second data window adopted for computation of the cross-correlation function contained 360 sample values, leading to 95% confidence limits (2/ √n) of 0.1054. Thus, even the lowest value of peak cross-correlation observed (Pxc =0.30, Figure 5) was highly significant. The much higher mean values obtained for the three separate groups considered in Table 1, reinforce the significance of our findings. The superior values obtained with MRI are possibly owing to its ability to extract information from a very large number of pixels, whereas the TCD relies on the abilities of the operator to reliably insonate a single vessel (the MCA) through the temporal bone window. Although the intrasubject peak cross-correlations between TCD and MRI were numerically higher than the TCD versus TCD values (Table 1), the differences were not statistically significant. Nevertheless, this is a remarkable result considering that the TCD and MRI measurements were performed during different sessions. The important interpretation and conclusion one can derive from this finding is that MRI-estimated changes in cerebral perfusion following thigh cuff deflation are at least as reliable as the classical TCD technique that has been regarded as the standard method for assessing dynamic CA. Together with the elevated values of Pxc and reduced CoV of ABP versus ABP cross-correlations (Table 1), this conclusion suggests that the (unobserved) time course of ABP changes induced by the thigh cuff maneuver in the MRI scanner are likely to be very similar to what was recorded during TCD sessions.
Figure 5 shows that MRI gives more consistent measures than does TCD when comparing the two hemispheres. However, this is not surprising because the TCD method relies on accurate insonation of the two MCAs individually, and each is subject to errors caused by misalignment of the transducer, as well as by differences in the anatomic orientation of the MCA between the left and right sides. However, MRI data for the left and right sides are acquired simultaneously, and alignment of the scan planes is relatively straightforward and reproducible (Rovaris et al, 1998), which should improve the reliability of serial follow-up measurements over extended periods of time. The long-term reproducibility of the method would need to be assessed in future studies.
The pulse sequence we used for acquisition of MRI data was a gradient-echo echo-planar imaging sequence of the type that is commonly used for functional MRI. In functional MRI, an increase in neural activity in a particular region of the cerebral cortex results in a local increase in oxyhemoglobin in the blood, and in a closer match between the magnetic susceptibilities of the blood and the surrounding tissue. In addition, there is an increase in blood volume in the venules during activation (Buxton et al, 1998). In a gradient-echo sequence, both of these cause an increase in signal intensity. The response we observed as a result of thigh cuff deflation was a decrease in signal intensity, of the order of 1% of the baseline signal amplitude, and an overshoot of similar or slightly lower magnitude over a period of B10 seconds. Although the signal intensity in a gradient-echo echo-planar imaging sequence is considered to be only weakly directly influenced by the blood volume flow rate through the capillaries (Gao et al, 1996), a local decrease in flow would lead to increased oxygen extraction and thereby increased deoxyhemoglobin concentration. A reduction in the blood oxygen level-dependent signal was observed by Kalisch et al (2001) on decreasing BP caused by withdrawing blood in anesthetized rats. The reduction was considered to be caused by a dilation of the venules as an autoregulatory response, with a consequent increase in deoxyhemoglobin volume. In a group of elderly subjects, near-infrared spectroscopy has been used to estimate oxyhemoglobin and deoxyhemoglobin concentrations in the frontal cortex during a postural change from lying supine to standing upright, which induces a BP challenge (Mehagnoul-Schipper et al, 2000). They observed a reduction in total blood volume, brought about by a reduction in oxyhemoglobin concentration, with little increase in deoxyhemoglobin, although this volume change was not seen in younger subjects. Whether the signal reduction we observed is caused by increased oxygen extraction with a commensurate increase in the volume of the venous compartment, or by a transient decrease in the arteriole volume, it is possible that our measured signal decrease is a valid surrogate for decreases in perfusion at the capillary level, which mirror the decreases in volume flow rate through the MCA that are seen with Doppler ultrasound.
Magnetic resonance imaging methods can be used to measure directly blood flow velocities and volume flow rates in the major arteries and veins, using phase-contrast angiography, as a direct analog of the TCD method. de Boorder et al (2004) measured the volume flow rate in the left and right internal carotid arteries, the basilar artery, the superior sagittal sinus, and the sinus rectus, with a temporal resolution of 4.3 seconds in response to a breath-hold challenge. However, this technique does not allow a regional evaluation of the autoregulatory response at the capillary level, to which we believe our method is sensitive. Tissue perfusion can also be measured using MRI arterial spin labeling methods. In quantitative studies, data are normally acquired over a period of several minutes (Talagala et al, 2004), making it unsuitable for assessing autoregulation. Using continuous arterial spin labeling and higher-field-strength scanners (3 T), a much higher temporal resolution has been achieved, of the order of 4 to 5 seconds, in a method that is sensitive to changes in perfusion, rather than providing absolute perfusion values (Wu et al, 2009). However, achieving the highest temporal resolution with continuous arterial spin labeling requires specialist additional hardware to transmit the blood labeling radiofrequency pulses to the neck, unlike our method, which was performed using a standard clinical 1.5-T MRI scanner.
As the signal change we observed with MRI was small, we might have expected the images to be sensitive to subject motion, particularly during cuff deflation; however, this was not seen in our data. It remains to be seen whether this will be the case for more challenging subject populations, such as those who have recently had a stroke. The problem was at least in part mitigated by the use of a neck collar and a foot support against which subjects could brace themselves, to prevent unwanted changes in position or angulation of the head. Potentially, the time series of images can be realigned in a postprocessing step, as is routinely performed with functional MRI experiments (Jenkinson et al, 2002). In general, the better the spatial resolution, the more straightforward and reliable this realignment will be. Our data have limited resolution, particularly in the slice direction (7 mm), which was governed by our need to acquire images with a high temporal resolution (1 second). Improvements in scanner magnetic field gradient hardware, and the use of parallel imaging should lead to improvements in spatial resolution without compromising time resolution (Fellner et al, 2009), particularly if higher field magnets are adopted.
Although good-quality measurements were obtained in most subjects, this study has some limitations. The main advantages and limitations of the thigh cuff maneuver we used have been described previously (Mahony et al, 2000; Panerai et al, 1998, 2001; Tiecks et al, 1995), but despite these, the technique is still widely undertaken on patients (Panerai, 2008). A typical problem was that the inflation of thigh cuffs up to 20mm Hg above systolic ABP, before rapid deflation, causes pain, although this caused only one subject to withdraw from our study.
As previously stated, TCD cannot provide an absolute measurement of CBF, and can only be considered as a measure of CBFV if the MCA cross-sectional area remains constant (Aaslid et al, 1989). There are other well-recognized limitations to this method, including failure to locate an acoustic window, which led to the exclusion of four TCD recordings in our study.
Of all techniques proposed for dynamic CA assessment (Panerai, 1998), the thigh cuff maneuver is possibly the least sensitive to the need to have a precise description of the BP time course. The main reason is that the fast return of CBFV to baseline, while BP remains low, allows quantification of its rate of return, which is directly related to the efficiency of dynamic CA (Aaslid et al, 1989). Nevertheless, this assumption remains to be shown in patient populations. Unfortunately, BP stimulus could not be measured in the MRI scanner, because of a lack of MRI-compatible BP measurement devices. However, the cross-correlation analysis (Table 1) shows that ABP has the smallest CoV for serial measurements. This means that once a significant CBF drop is observed with TCD or MRI, ABP will show a time course with high reproducibility. In other words, if the CBFV pattern recorded with TCD and the MRI intensity pattern following the release of thigh cuffs are highly correlated, it is not unreasonable to assume that the ABP temporal pattern in the MRI machine was very similar to that recorded during the TCD examination. Despite this expectation, it remains to be shown that quantifying the rate of return of the MRI intensity during recovery from the BP drop will lead to a reliable index of dynamic CA with good correlation with the ARI. This demonstration is beyond the scope of this paper and will be reported elsewhere.
This initial validation study has clearly shown the equivalence of global (hemispheral) measures of CBF using TCD and MRI methodologies. Furthermore, it suggests that interhemispheral cross-correlation functions are higher, as are cross-correlations for repeated measurements, with MRI, in keeping with previously highlighted methodological issues with TCD. Future work will concentrate on exploiting the higher spatial resolution of MRI, for which the data we acquired were 3.45 × 3.45 × 7mm3. Magnetic resonance imaging is ideally placed to assess CBF in disease states such as acute stroke, in which interhemispheral and regional changes may be expected, and indeed MRI is increasingly becoming the preferred modality for informing acute management in stroke and TIA. Cerebral autoregulation is a homeostatic mechanism that protects the brain against fluctuations in ABP, and impairment of dynamic CA has previously reported following acute stroke (Dawson et al, 2000; Immink et al, 2005). Importantly, the effects of stroke on dynamic CA may be further influenced by stroke subtype. For example, Immink et al (2005) studied dynamic CA following acute ischemic MCA stroke and acute lacunar stroke, and found impairment of dynamic CA only in the affected hemisphere in MCA stroke, but global impairment following lacunar stroke. Sudden uncompensated BP changes following acute stroke may have important consequences for BP-dependent CBF, in which increased CBF may promote hemorrhagic transformation and cerebral edema, and reduced CBF may affect viability of the ischemic penumbra. The ability to perform focal measurements, offered by the novel MRI technique described in this study, has enormous potential to shed light on the dynamics of the penumbral and nonpenumbral zones and on the characteristics of tissue damage in different stroke subtypes. This may have important implications for prognosis, and may also inform the management of common postacute stroke complications, including hypertension and reperfusion injury (e.g., following thrombolysis and urgent carotid revascularization procedures).
In conclusion, we have shown that the profiles of response to BP falls induced by thigh cuff release are similar when assessed by MRI and TCD. Indeed, values obtained by MRI may be more reliable. This provides exciting opportunities for the noninvasive assessment of regional autoregulatory changes following acute stroke, and to inform the management of common acute stroke complications associated with poor prognosis.
Footnotes
The authors declare no conflict of interest.