
Abstract
Corticotropin-releasing hormone receptor type 1 (CRH-R1)-deficient mice display reduced anxiety-like behavior, a chronic corticosterone deficit, and an impaired neuroendocrine stress response caused by disruption of the hypothalamic–pituitary–adrenocortical (HPA) axis. The molecular substrates and pathways of CRH/CRH-R1-dependent signaling mechanisms underlying the behavioral phenotype as well as the consequences of lifelong glucocorticoid deficit remain largely obscure. To dissect involved neuronal circuitries, we performed comparative expression profiling of brains of CRH-R1 mutant and wild-type mice using our custom made MPIP (Max Planck Institute of Psychiatry) 17k cDNA microarray. Microarray analysis yielded 107 genes showing altered expression levels when comparing CRH-R1 knockout mice with wild-type littermates. A significant proportion of differentially expressed genes was related to control of HPA and hypothalamic–pituitary–thyroid (HPT) axes reflecting not only the disturbance of the HPA axis in CRH-R1 mutant mice but also the interplay of both neuroendocrine systems. The spatial analysis of regulated genes revealed a prevalence for genes expressed in the cerebral microvasculature. This phenotype was confirmed by the successful cross-validation of regulated genes in CRH overexpressing mice. Analysis of the cerebral vasculature of CRH-R1 mutant and CRH overexpressing mice revealed alterations of functional rather than structural properties. A direct role of the CRH/CRH-R1 system was supported by demonstrating Crhr1 expression in the adult murine cerebral vasculature. In conclusion, these data suggest a novel, previously unknown role of the CRH/CRH-R1 system in modulating neurovascular gene expression and function.
Introduction
The neuropeptide corticotropin-releasing hormone (CRH) plays a central role in integrating the neuroendocrine, autonomic, and behavioral responses to stress. To coordinate these tasks, CRH displays a dual capacity acting not only as a secretagogue within the line of the hypothalamic–pituitary–adrenocortical (HPA) axis but also as a neurotransmitter modulating synaptic neurotransmission in the central nervous system (Deussing and Wurst, 2005).
Clinical studies, supported by pharmacologic and genetic animal models, have demonstrated a prominent role of CRH in mood and anxiety disorders (Holsboer, 1999; Groenink et al, 2003). Hypersecretion of CRH from the paraventricular nucleus of the hypothalamus accounting for HPA axis hyperactivity as well as elevated CRH levels detectable in the cerebrospinal fluid are prominent findings in patients with major depression (Nemeroff et al, 1984).
As another hypothalamic–pituitary–end organ axis, the hypothalamic–pituitary–thyroid (HPT) axis has been implicated in affective disorders (Musselman and Nemeroff, 1996). The HPA axis has a direct impact on the HPT axis by inhibiting its function via CRH and glucocorticoids (Tsigos and Chrousos, 2002).
Besides their crucial role in regulating the neuroendocrine and behavioral stress responses, CRH and its receptors (CRH-Rs) affect peripheral cardiovascular function. Central administration of CRH elevates blood pressure and heart rate, whereas peripheral administration of CRH results in vasodilatation and decreased blood pressure (Parkes et al, 2001). Thyroid hormones as the end-effectors of the HPT axis also have a pronounced effect on the cardiovascular system, for example, hyperthyroidism results in increased cardiac output, heart rate, pulse and blood pressure, and decreased vascular peripheral resistance (Vargas et al, 2006).
In the last decade, numerous constitutive and conditional mouse mutants have been generated to dissect the pathways implicated in HPA system regulation and CRH-related circuitries involved in anxiety- and stress-related behavior in vivo (Muller and Holsboer, 2006). Nevertheless, the molecular mechanisms behind CRH neurocircuitry regulation and its respective impact on aberrant behavior are yet not fully understood. Corticotropin-releasing hormone receptors are G protein-coupled heptahelical transmembrane receptors, which can couple to multiple G-proteins, and thereby are linked to a variety of intracellular signaling pathways (Reul and Holsboer, 2002). Recently, in vivo experiments demonstrated the involvement of mitogen-activated protein kinase signaling pathways that specifically mediate the behavioral adaptation to stress in response to CRH in distinct brain areas (Refojo et al, 2005).
The combination of microarray technology and existing mouse mutants relevant to the CRH/CRH-R system has already proven as a powerful approach to identify entirely new genes involved in adaptive processes evoked by an imbalance of the CRH/CRH-R system as recently demonstrated by Peeters et al (2004).
Here we report on the comparative analysis of cerebral gene expression profiles of CRH-R type 1 (CRH-Rl) wild-type and knockout mice. We were able to identify alterations in the expression of genes related to the control of HPA and HPT axes. Additionally, the spatial analysis of candidate genes revealed a previously unknown role of the CRH-/CRH-R1 system in control of cerebrovascular gene expression.
Materials and methods
Mice
Corticotropin-releasing hormone receptor type 1 knockout (KO) mice have been described previously (Timpl et al, 1998). Male CRH-R1-deficient mice and wild-type littermates were obtained from heterozygous breedings. Mice were genotyped by polymerase chain reaction (PCR) using primers: R1-GT1, 5′-TCA-CCT-AAG-TCC-AGC-TGA-GGA-3′; R1-GT2, 5′-GTG-CTG-TCC-ATC-TGA-CGA-GA-3′; R1-GT3B, 5′-GGG-GCC-CTG-GTA-GAT-GTA-GT-3′. Standard PCR conditions result in a 697 bp wild-type and a 496 bp mutant PCR product. Mice overexpressing CRH under the control of the metallothionein promotor have been described previously and were kindly provided by Stenzel-Poore et al (1992). Corticotropin-releasing hormone transgenic mice and wild-type littermates were obtained from breeding of hemizygous males with wild-type C57BL/6J females. Mice were backcrossed for N = 18 generations. Transgenic animals were visually distinguished from their wild-type littermates by their severe Cushing-like phenotype.
RNA Extraction
Mice (10 weeks old) were killed by cervical dislocation at 10 am. Brains were carefully removed and immediately transferred into an appropriate volume (1 mL/100 mg) of TRIzol reagent (Invitrogen, Karlsruhe, Germany). Tissue was thoroughly homogenized using an Ultra-Turrax grinder (IKA-Labortechnik, Staufen, Germany) and subsequently total RNA was prepared according to the manufacturer's recommendations. Quality of total RNA was visually inspected by denaturing agarose gel electrophoresis.
Quantitative Northern Blot Analysis
Five micrograms of total brain RNA were separated in a 1% formaldehyde agarose gel, transferred to Porablot NY Plus membrane (Macherey & Nagel, Düren, Germany) and hybridized with respective [α-32P]dCTP-labeled (Mega-prime labeling kit, Amersham, Piscataway, USA) cDNA probes. Filters were washed at high stringency as described. Membranes were stripped by boiling in 0.1% SDS for 10 mins and rehybridized with a 540-bp cDNA fragment of murine β-actin. Expression levels were quantified using a FUJIX BAS-3000 Phosphoimager (Fuji, Japan) and TINA 2.09 software (Raytest, Straubenhardt, Germany). The expression levels were normalized by the signal intensity of murine β-actin expression.
Microarray Construction
The MPIP 17k cDNA microarray contained 18856 PCR products derived from different mouse cDNA libraries (sources: Research Genetics, RZPD Deutsches Ressourcenzentrum für Genomforschung, proprietary clones) representing 12037 different unigene clusters (unigene build #144). The spotting buffer contained 3 × SSC (standard sodium citrate) and 1.5 mol/L betaine. The PCR products were spotted on gamma-amino-propylsilane-coated slides (GAPS II, Corning, NY, USA) using a Chipwriter Pro spotting robot (Biorad, München, Germany) and 48 SMP3 stealth pins (TeleChem, Sunnyvale, CA, USA). After spotting, the arrays were heated to 80°C for 10 secs and crosslinked using a UV Stratalinker 2400 at 200 mJ (Stratagene, Cedar Creek, TX, USA). For blocking, arrays were submerged in a mixture of 1.25 g succinic anhydride/250 mL 1,2-dichloroethane/3.1 mL 1-methylimidazole for 1 h at room temperature. Subsequently, arrays were washed in 250 ml fresh dichloroethane, denatured in boiling ultrapure water for 2 mins, rinsed in 95% ethanol, and finally dried by centrifugation for 1 min at 1500 r.p.m. Arrays were stored in a dark, dry box at room temperature until usage.
Microarray Hybridization
We performed a dual color microarray experiment with a direct comparison of directly labeled, total RNA pools including three technical replicates and dye-swap. Briefly, 100 μg of total RNA from each animal were subjected to a labeling reaction using oligo (dT) Primer (Amersham, Piscataway, NJ, USA), Cy3-coupled dUTPs and Cy5-coupled dUTPs (Amersham), and SuperScriptII reverse transcriptase (Invitrogen). After purification of labeling reaction using Bio-6-columns (Biorad) and YM-30 columns (Millipore), 100 μg of Cy3- and Cy5-labeled total RNA from wild-type and knockout mice was combined with hybridization buffer, denatured at 95°C for 3 mins, and hybridized to each of the three technical replicates, resulting in a total of six microarrays. The hybridization buffer contained 50% formamide, 50 mmol/L sodium phosphate buffer (pH 7.0), 5 × Denhard's solution (Sigma, Taufkirchen, Germany), 6× SSC, 0.5% SDS, 0.4 mg/mL murine COT1-DNA (Invitrogen), and 5 μg poly(dA) (Amersham). Hybridization was performed in hybridization chambers submerged in a waterbath at 42°C for 16 h. The arrays were washed for 15 mins in 2 × SSC/0.2% SDS at 60°C, in 0.5 × SSC for 15 mins at 60°C, rinsed in 0.2 × SSC for 1 min at room temperature, shaken vigorously in 0.05 × SSC at room temperature, and finally dried with Servisol Air Spray (Roth, Karlsruhe, Germany). All slides were scanned immediately after drying.
Microarray Analysis
Scanning was performed using a ScanArray 4000 laser scanner and ScanArray 3.1 Software (Perkin Elmer, Boston, MA, USA) with a fixed photomultiplier tube gain of 80%, and 98% (Cy3) or 70% (Cy5) laser power. Quantification was performed using QuantArray software 2.1.0.0 (Perkin Elmer Rodgau-Jügesheim, Germany) and the fixed circle-analysis method. Data were imported in a PSQL relational database for further analysis. Raw data were normalized according to the procedure outlined in Yang et al (2002) and subjected to a t-test for significantly differential expression. The obtained P-values were corrected for multiple testing using Benjamini-Hochberg's false discovery rate procedure (Hochberg and Benjamini, 1990). Because we anticipated strong dilutive effects by the whole-brain approach, a low threshold was chosen for selection of candidate genes: | Z-score | ≥ 1.837 and | fold regulation | ≥ 1.1. Additionally, a raw signal intensity ≥1000 was set as threshold ensuring the practicability of independent confirmation by Northern blot or in situ hybridization.
Quantitative In Situ Hybridization
Mice (10 weeks old) were killed by an overdose of isoflurane. Brains were carefully removed and immediately shock frozen on dry ice. Frozen brains were cut on a cryostat in 20-μm-thick sections. Cryostat sections of wild-type and knockout brains were mounted side by side on SuperFrost Plus slides (Menzel GmbH, Braunschweig, Germany). This procedure allowed for parallel in situ hybridization of wild-type and knockout sections under absolutely identical conditions assuring meaningful quantification and comparison of hybridization signals. All sections were processed for in situ hybridization according to a modified version of the procedure described by Dagerlind et al (1992). Specific riboprobes were generated by PCR from respective cDNA clones, which were spotted on the MPIP 17k array. Polymerase chain reaction products were amplified with primers: T3 5′-GCT-AAA-ATT-AAC-CCT-CAC-TAA-AGG-GAA-TAA-GC-3′; T7 5′-CGA-ATT-TAA-TAC-GAC-TCA-CTA-TAG-GGA-ATT-TG-3′ universally applicable for pT7T3D-PAC derived plasmids. The following riboprobes were generated: Rgs5 gene (length ∼1000 bp, GenBank Accession No. AI847151), Sparc (length ∼1000 bp, GenBank Accession No. AI840232), Sepp1 (length ∼1700 bp, GenBank Accession No. AI838693), Pmp22 (length ∼1000 bp, GenBank Accession No. AI852430), Vim (length ∼ 685 bp, GenBank Accession No. AI845820), Col1a2 (length ∼1400 bp, GenBank Accession No. AI838652). Antisense and sense cRNA probes were transcribed from 200 ng of respective PCR product and directly used as a template for the synthesis of radiolabeled transcripts by in vitro transcription with 35S-UTP using T7 and T3 RNA polymerase, respectively. After 20 mins of DNase I (Roche, Penzberg, Germany) treatment, the probes were purified by the RNeasy Clean up protocol (Qiagen, Hilden, Germany) and measured in a scintillation counter. For hybridization, sections were pretreated and prehybridized as described previously (Dagerlind et al, 1992). Subsequently, they were hybridized overnight with a probe concentration of 7× 10⁶ c.p.m./mL at 57°C and washed at 65°C in 0.1 × SSC and 0.1 mmol/L dithiothreitol. The hybridized slides were dipped in autoradiographic emulsion (type NTB2; Eastman Kodak, Rochester, NY, USA), developed after 3 to 6 weeks, and counterstained with cresyl violet.
Alkaline Phosphatase Cytochemistry
Alkaline phosphatase (AP) is a marker for arteries, arterioles, and capillaries, and distinguishes afferent from efferent blood vessels in the brain. Alkaline phosphatase activity was assessed on 20 μm cryosections, which were mounted side by side on SuperFrost Plus slides (prepared as described above for in situ hybridization). Staining was performed for 10 mins at room temperature using either nitro blue tetrazolium chloride/5-bromo-4-chloro-3-indolyl phosphate (NBT/BCIP, Roche, Penzberg, Germany) or Vector Red (Vector Laboratories, Burlingame, CA, USA) as an AP substrate. Enzymatic reaction was stopped by washing in phosphate-buffered saline followed by embedding in ProTaq MountFluor (Quartett Immunodiagnostics, Berlin, Germany).
Endogenous AP activity of cerebral blood vessels was visualized in intact brains as follows. Mice were killed by an overdose of isoflurane and transcardially perfused as follows: 30 secs 50 U/μL heparin-NaCl 0.9%, 3 mins 4% cold paraformaldehyde and finally with 7.5 ml NBT/BCIP per animal. Brains were immediately removed and transferred into 4% paraformaldehyde. Photographs were taken using a Leica MZ APO binocular.
Immunofluorescence
Immunofluorescence detection of collagen type IV (COLIV) was perfomed on 20 μm cryostat sections, stored at −20°C until used. Sections were warmed for 5 mins at room temperature (RT; incubations were performed at RT unless indicated otherwise), fixed 5 mins in 4% paraformaldehyde, washed 3 × 5 mins in 0.01% Tween/PBS (PBST), blocked 60 mins in 2% BSA (Sigma)/PBST, and washed 3 × 5 mins in 0.01% PBST. The goat anti-type IV collagen antibody (Southern Biotech, Galveston, TX, USA) was diluted 1:200 in 0.01% PBST and incubated overnight at 4°C. Sections were washed 3×5 mins in PBS and incubated for 60 mins with the donkey anti-goat, biotinylated antibody (Jackson ImmunoResearch, Cambridgeshire, UK), diluted 1:100. Subsequently, sections were washed 3×5 mins in PBS and detection was performed incubating for 60 mins with Texas Red Streptavidin (Vector Lab, Burningham, Canada) diluted 1:50 in PBS. Finally, sections were washed 3 × 5 mins in PBS and mounted in ProTaq MountFluor (Quartett Immunodiagnostics, Berlin, Germany). Photographs were taken using a Zeiss axioplan2 microscope.
Preparation of Cerebral Microvessels
Murine brain microvessels were prepared from fresh brain tissue removed within minutes from 10-week-old mice killed by cervical dislocation. The brain was cleared from meninges and large surface vessels and then minced with a scalpel into approximately 1 mm segments. Tissue was homogenized in ice-cold Dulbecco's modified Eagle's medium-nutrient mixture F-12 (DMEM F-12; Invitrogen) and centrifuged at 228g for 5 mins. After removal of the supernatant, the pellet was resuspended in 15 ml of 18% (wt/vol) dextran solution and centrifuged at 12,000g for 10 mins. The supernatant was removed and the pellet was resuspended in 5 ml of Ca2+ Mg2+ -free Hank balanced salt solution (Invitrogen). The suspension was passed through a 70 μm nylon mesh filter (BD Biosciences, Bedford, MA, USA) and the filter was washed three times with HBBS. Microvessels retained on the filter were dislodged by inverting the filter and rinsing in 1 mL TRIzol per brain. Total RNA from cerebral microvessels was prepared using the TRIzol reagent (Invitrogen, Karlsruhe, Germany) as described for total brain RNA.
RT-PCR Analysis
Expression of Crh, Crhr1, and Crhr2 in cerebral microvessels was analyzed by RT-PCR. First-strand cDNA synthesis from 1 μg total microvascular RNA and 1 μg total brain RNA was performed with SuperScript™ II reverse transcriptase (Invitrogen), according to the manufacturer's protocol using an oligo (dT) primer. The following intron-spanning primers were used for gene-specific PCRs: Crh: forward 5′-CAC-CTA-CCA-AGG-GAG-GAG-AA-3′, reverse 5′-GTT-GCT-GTG-AGC-TTG-CTG-AG-3′ (amplifying nucleotides 143 to 711 of mouse Crh cDNA, GenBank Accession No. NM 205769, 35 cycles); Crhr1: forward 5′-GCC-GCC-TAC-AAC-TAC-TTC-CA-3′, reverse 5′-CAG-AAA-ACA-ATA-GAA-CAC-AGA-CAC-G-3′ (amplifying nucleotides 768 to 1289 of mouse Crhr1 cDNA, GenBank Accession No. NM 007762, 35 cycles); Crhr2: forward 5′-ATG-TTT-GTG-GAG-GGC-TGC-TA-3′, reverse 5′-GTC-TGC-TTG-ATG-CTG-TGG-AA-3′ (amplifying nucleotides 792 to 1411 of mouse Crhr2 cDNA, GenBank Accession No. NM 009953, 35 cycles); Glut1: forward 5′-CAT-CTT-CGA-GAA-GGC-AGG-TG-3′, reverse 5′-CCT-CGG-GTG-TCT-TGT-CAC-TT-3 (amplifying nucleotides 1067 to 1680 of mouse Glut1 cDNA, GenBank Accession No. BC 055340, 25 cycles); Rgs5: forward 5′-GGG-AAT-TCT-CCT-CCA-GAA-GC-3′, reverse 5′-AAA-TTC-AGA-GCG-CAC-AAA-GC-3′ (amplifying nucleotides 147 to 603 of mouse Rgs5 cDNA, GenBank Accession No. NM 009063, 30 cycles); Actb: forward 5′-ATC-GTG-CGT-GAC-ATC-AAA-GA-3′, reverse 5′-ACA-TCT-GCT-GGA-AGG-TGG-AC-3′ (amplifying nucleotides 702 to 1146 of mouse Actb cDNA, GenBank Accession No. NM 007393, 25 cycles); Nrgn: forward 5′-GAC-TAG-GCC-AGA-GCT-GAA-CG-3′, reverse 5′-TGA-AAA-CCT-CCT-CCC-CTC-TT-3′ (amplifying nucleotides 492 to 1,053 of mouse Nrgn cDNA, GenBank Accession No. NM 022029, 25 cycles); microtuble-associated protein 2 (Map2): forward 5′-GGT-CTC-CAG-GGA-TGA-AGT-GA-3′, reverse 5′-GTG-TGG-AGG-TGC-CAC-TTT-TT-3′ (amplifying nucleotides 5122 to 5540 of mouse Map2 cDNA, GenBank Accession No. XM 901540, 25 cycles); Gfap: forward 5′-GCC-ACC-AGT-AAC-ATG-CAA-GA-3′, reverse 5′-CCT-TCT-GAC-ACG-GAT-TTG-GT-3′ (amplifying nucleotides 741 to 1210 of mouse Gfap cDNA, GenBank Accession No. NM 010277, 25 cycles). Polymerase chain reaction products were analyzed by agarose gel electrophoresis together with a DNA marker (Smart Ladder, Eurogentec, Brussels, Belgium).
Data Analysis
Autoradiographs of in situ hybridizations or photographs of AP (NBT/BCIP) stained sections were digitized and relative levels of mRNA or AP staining were determined by computer-assisted optical densitometry (ImageJ, http://rsb.info.nih.gov/ij/). For in situ hybridizations, routinely three different exposure times were applied to assure that the signals to be quantified were in the linear range. The mean of five to eight measurements was taken from each animal (only three measurements for the paraventricular nucleus (PVN)). Data are presented as fold regulation relative to wild-type measurements. In case of AP staining, the mean of 12 measurements per animal was calculated. Data are presented as mean AP staining intensities ± s.e.m. Data analyses were performed on GraphPad Prism 4 (GraphPad Software Inc., San Diego, CA, USA) using a two-tailed t-test. P < 0.05 was taken as significant.
Results
Differential Gene Expression in Corticotropin-releasing Hormone Receptor Type 1 Wild-Type and Knockout Mice
To elucidate molecular mechanisms and neuronal networks underlying the behavioral phenotype, we performed expression profiling utilizing our custom-made MPIP-17k cDNA microarray. Total RNA samples, harvested from the brains of five CRH-R1 wild-type and knockout animals at 2 months of age, were pooled genotype-wise. Cy3 and Cy5-labeled RNA pools were hybridized simultaneously to six MPIP-17k arrays including dye-swap. Primary data processing yielded 13,395 analyzable spots. Three thousand nine hundred and twenty-one spots were regulated ±1.1-fold and among them 129 spots displayed a |Z-score| ≥ 1.837 (Supplementary Figure 1). Hundred and eleven spots exhibited a mean expression of ≥1000 representing 107 individual, differentially expressed genes (Table 1). Of these genes, 53 were upregulated and 54 genes were downregulated. Differences in expression levels ranged from +1.7 to −1.5-fold with the majority (78%) of candidate genes showing only weak regulation levels of +1.2 to −1.2-fold. With 48 candidates, almost half of the regulated genes are unknown genes represented by expressed sequence tags or RIKEN clones. Categorization of known candidate genes according to available Gene Ontology (Ashburner et al, 2000) annotations revealed three major functional classes: genes related to signal transduction mechanisms (33%), metabolism (17%), and control of cellular organization (14%; Table 1). Distributed within these classes, we found numerous candidate genes directly connected to the endocrine systems of the HPA and the HPT axis as anticipated from CRH-R1 knockout mice. Genes related to the HPA axis include the nuclear receptor subfamily 3, group C, member 1 (Nr3c1, + 1.2-fold), the hydroxysteroid 11-beta dehydrogenase 1 (Hsd11b1, + 1.3-fold), the FK506-binding protein 4 (Fkbp4, + 1.1-fold), calreticulin (Calr, + 1.2-fold) as well as the telomerase-binding protein p23 (p23, + 1.1-fold). We identified the thyroid hormone receptor alpha (Thra, −1.1-fold), the thyroid hormone receptor interactor 12 (Trip12, −1.2-fold), the type II iodothyronine deiodinase (Dio2, +1.5-fold), transthyretin (Ttr, −1.1/−1.2-fold), and prostaglandin D2 synthase (Ptgds, −1.3/−1.4-fold) as regulated candidate genes related to the HPT axis (Supplementary Figure 2).
Genes up- or downregulated in CRH-R1 knockout mice
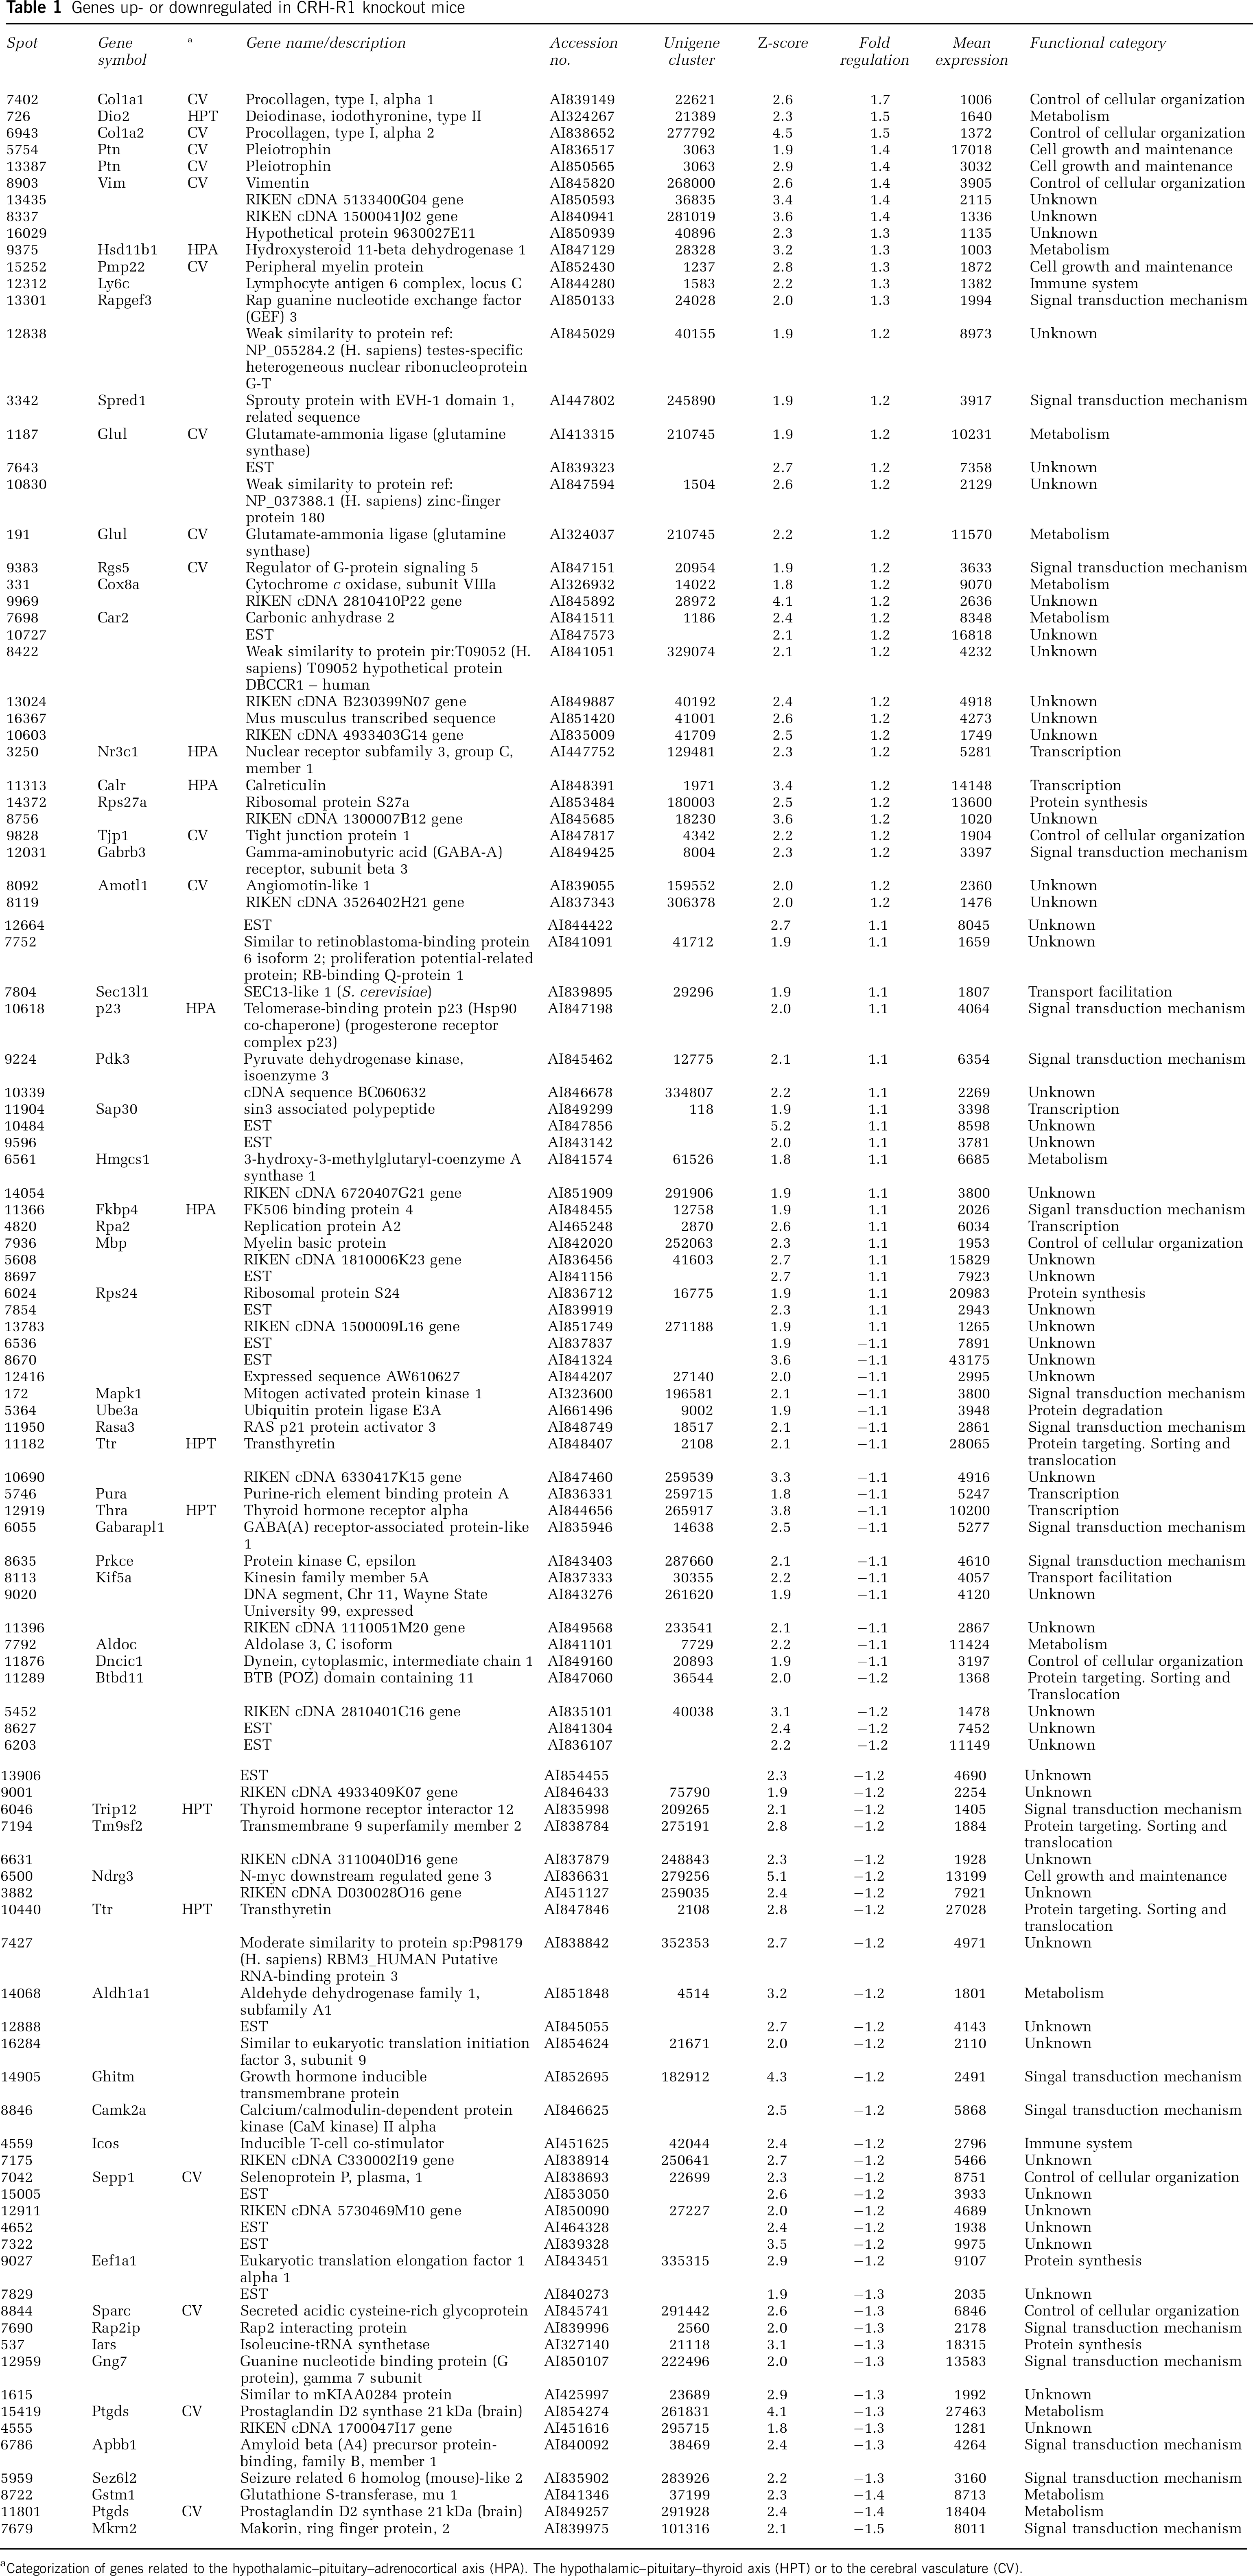
Categorization of genes related to the hypothalamic–pituitary–adrenocortical axis (HPA). The hypothalamic–pituitary–thyroid axis (HPT) or to the cerebral vasculature (CV).
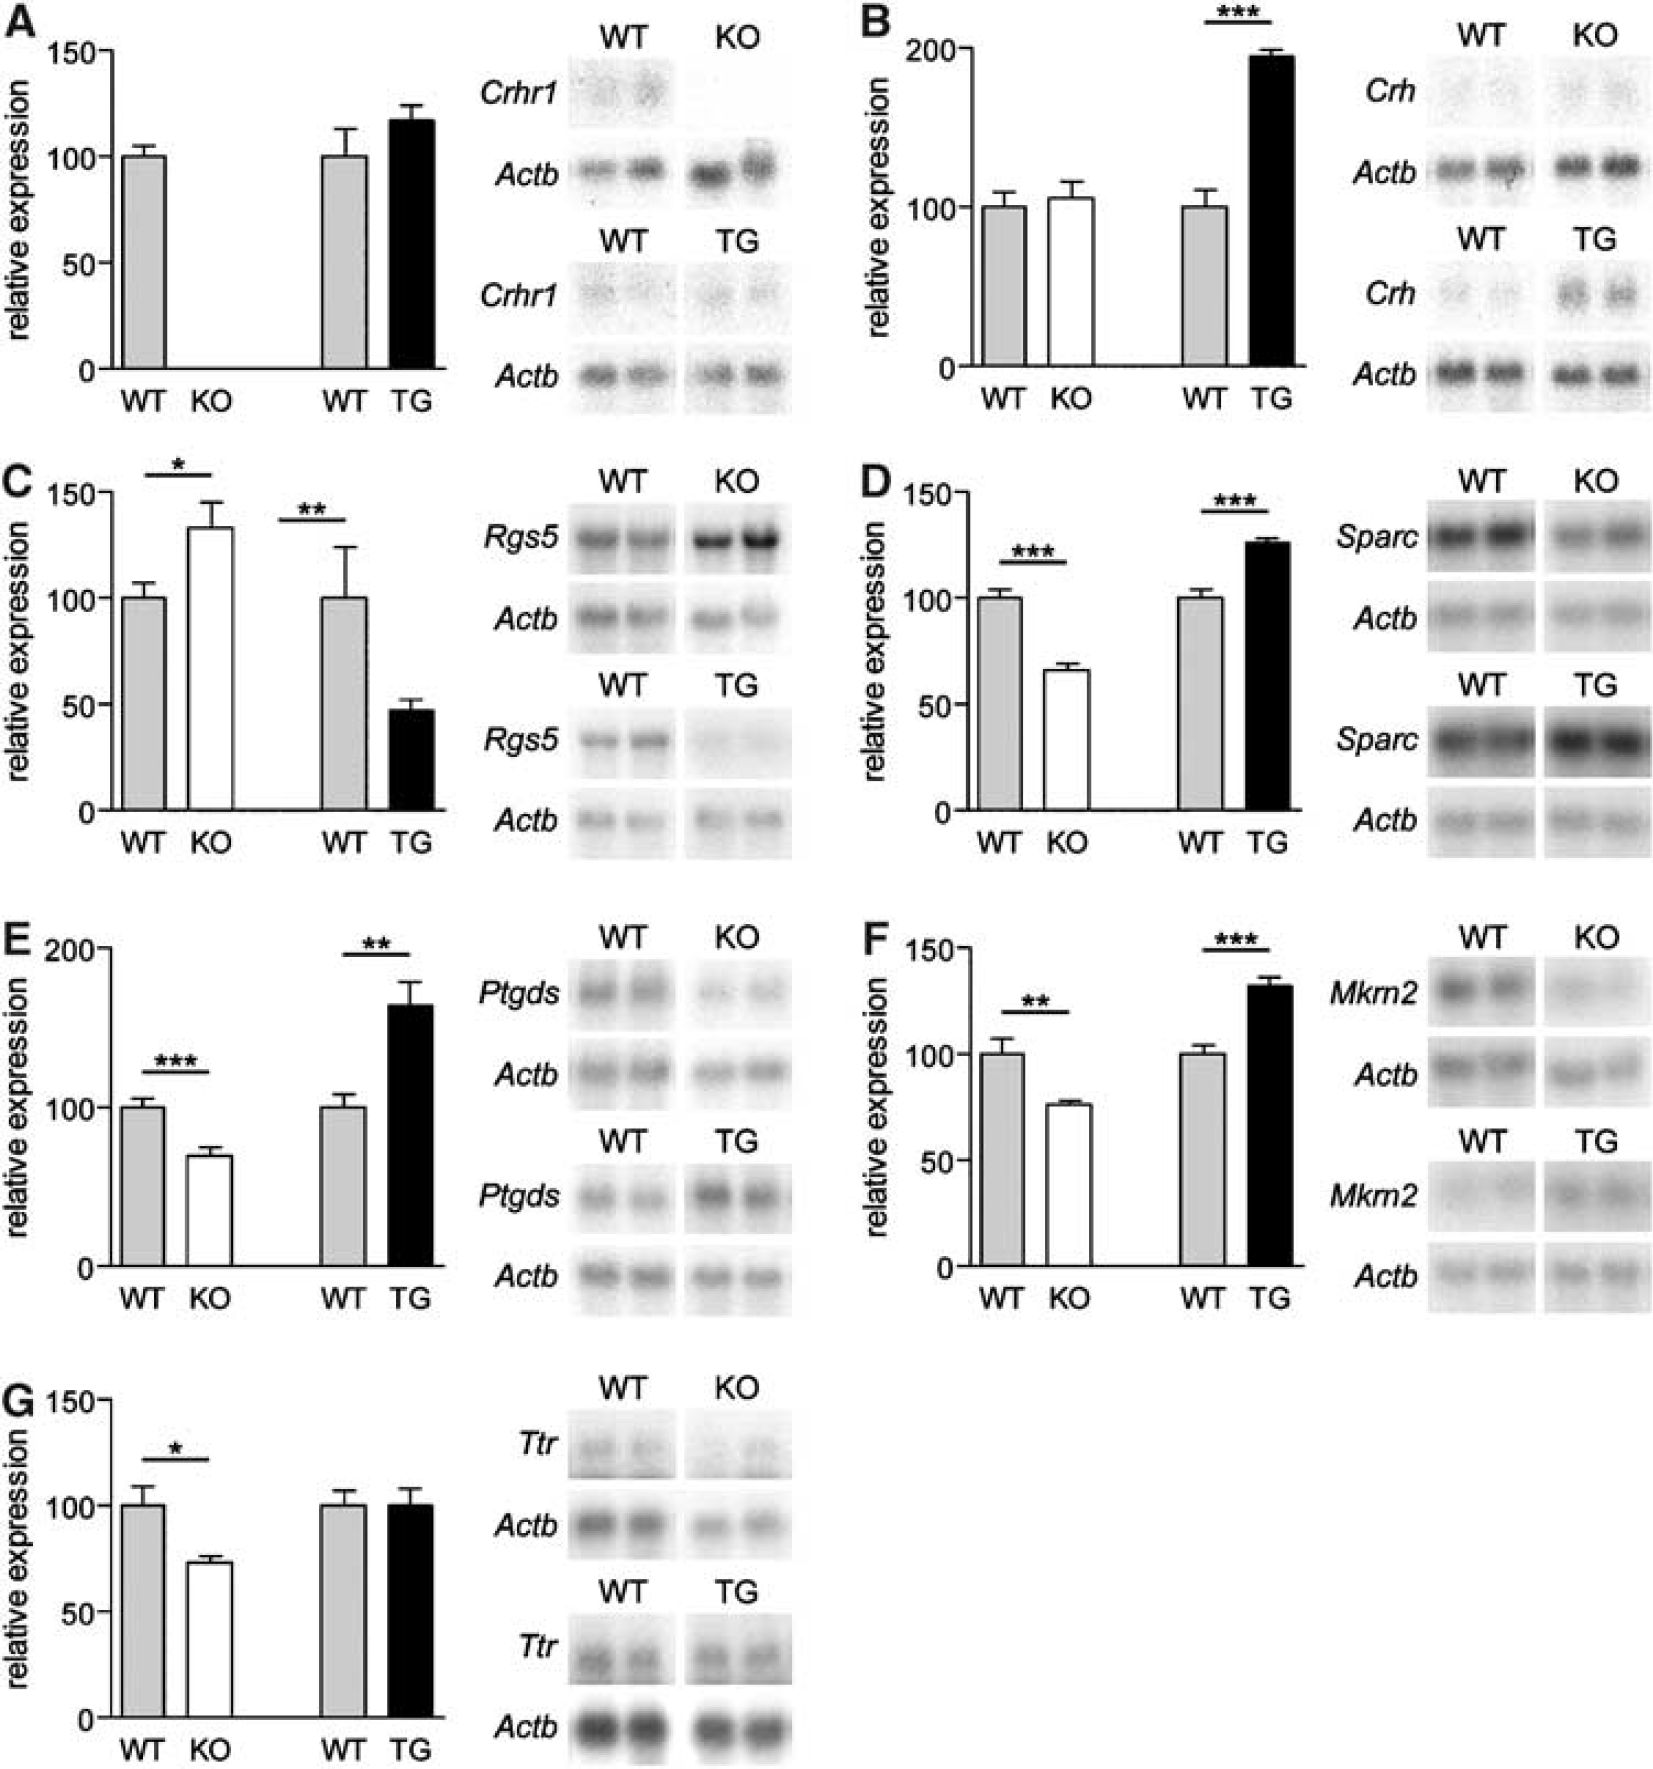
Confirmation of differential expression of selected candidate genes by Northern blot analysis. Validation was performed in CRH-R1 knockout animals and cross-confirmed in CRH-tg animals by comparison with respective wild-type littermates. For quantification, total RNA from the entire brain and scanning densitometry was applied. Relative expression levels were calculated by normalization to β-actin signal intensities. Results are presented as mean±s.e.m. of seven animals per genotype. Additionally, representative Northern blots are presented for two animals per genotype including β-actin hybridization results. (
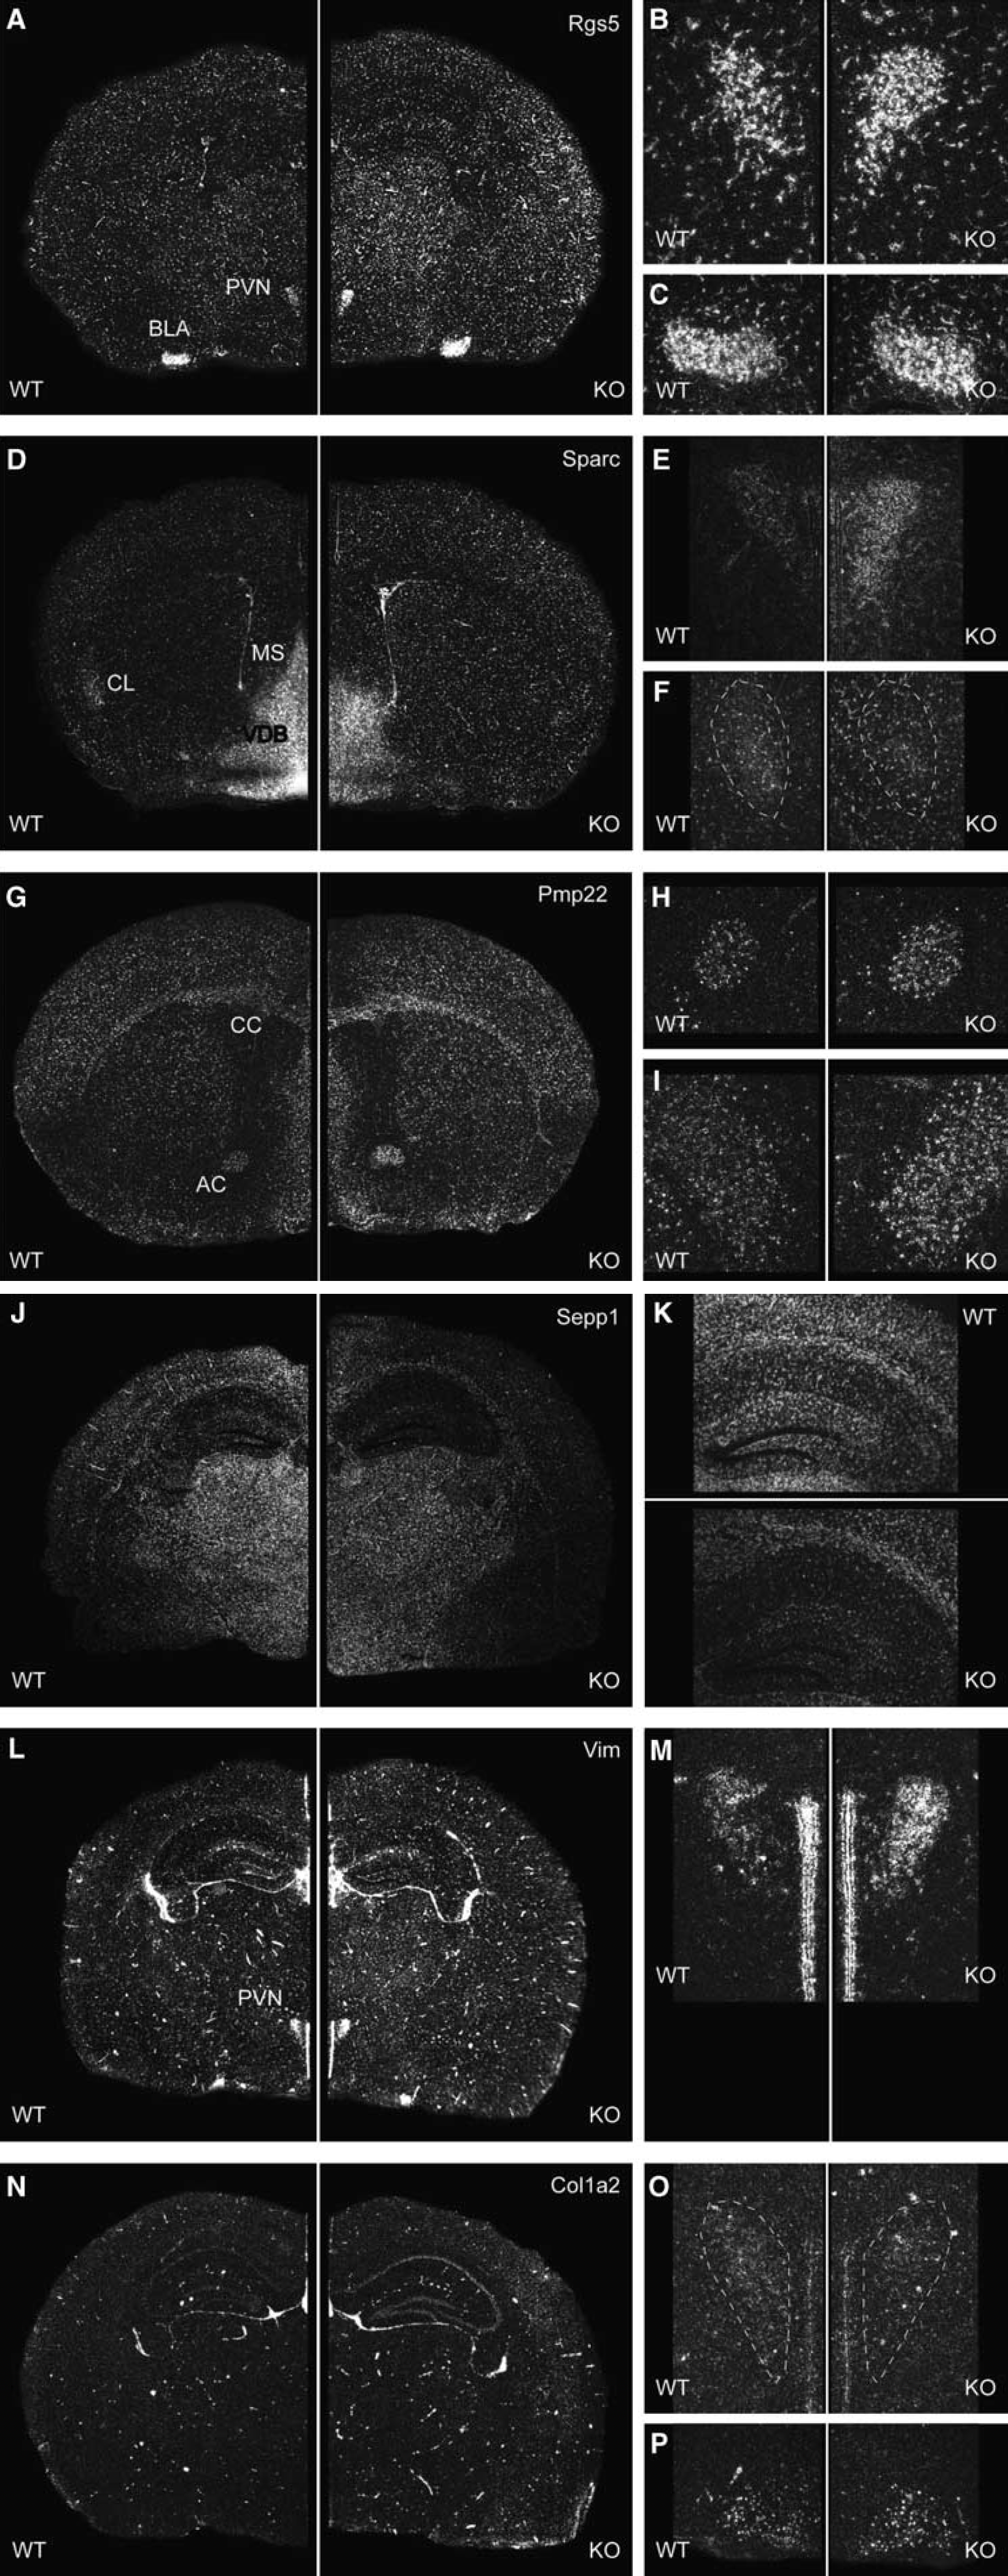
Spatial distribution of selected candidate genes in the adult mouse brain demonstrated by in situ hybridization using radiolabeled riboprobes. Each riboprobe was hybridized to sections of 3–5 brains per genotype covering the entire brain from rostral to caudal. Sections of wild-type and CRH-R1 knockout mice were placed side by side on the same slide. Depicted are representative dark field photomicrographs of the coronal sections of Rgs5 (
Validation of Microarray Data by Quantitative Northern Blot Analysis
To independently confirm the obtained expression profiling data, we performed quantitative Northern blot analysis. The quantification was accomplished with total RNA from the entire brain of CRH-R1 wild-type and knockout littermates (n = 7). For confirmation, genes were chosen that reflected not only the complete bandwidth of differential expression but also the broad spectrum of mean expression levels of identified candidate genes (compare Table 1). Hybridization data were quantified by normalization to β-actin. As an internal control, we demonstrated the absence of Crhr1 expression in the mutant mice. The expression levels of candidate genes analyzed showed a perfect correlation to the mean expression levels obtained from the microarray experiment (data not shown) and confirmed the differential expression of candidate genes (Figure 1). The following regulation levels were detected reflecting the differential expression identified by microarray analysis (microarray results are given in parentheses): regulator of G-protein signaling 5 (Rgs5; Figure 1C) + 1.3-fold (+1.2-fold), secreted protein acidic and rich in cysteine (Sparc; Figure 1D) −1.5-fold (−1.3-fold), Ptgds −1.5-fold (−1.3/−1.4-fold; Figure 1E), makorin 2 (Mkrn2; Figure 1F) −1.3-fold (−1.5-fold), Ttr −1.4-fold (−1.2 fold; Figure 1G). Confirmation of expression and regulation levels established quantitative Northern blot analysis as a valid method for evaluation of microarray data obtained from the MPIP-17k array (Figure 1).
Genes Differentially Regulated in Corticotropin-releasing Hormone Receptor Type 1 Knockout Mice are Inversely Regulated in CRH Overexpressing Mice
Mice ubiquitously overexpressing CRH (CRH-tg) display an opposed phenotype compared with CRH-R1 knockout mice. For CRH-tg mice, an increased anxiety-related behavior and HPA axis hyperactivity with the consequence of a Cushing's syndrome-like phenotype has been reported (Stenzel-Poore et al, 1992; van Gaalen et al, 2002). Thus, we intended to cross-validate candidate genes in CRH-tg mice. For confirmation, Northern blot analysis of total RNA from the entire brain of CRH-tg and respective wild-type littermates (n = 7) was performed. Hybridization with a Crh-specific probe demonstrated a 1.95-fold upregulation of Crh in the entire brain of CRH-tg mice (Figure 1B) whereas expression of Crhr1 was not altered (Figure 1A). Rgs5 (−2.1-fold; Figure 1C), Sparc (+ 1.3-fold; Figure 1D), Ptgds (+ 1.6-fold; Figure 1E), and Mkrn2 (+ 1.3-fold; Figure 1F) were significantly regulated in CRH-tg mice. The identified regulation was in the opposite direction compared with CRH-R1 knockout mice while the degree of induction or repression of gene expression was in a similar range as observed in CRH-R1 knockout mice. Only Ttr was not significantly regulated in CRH-tg mice (Figure 1G). The diametrical regulation of candidate genes in CRH-tg mice supports a direct influence of the CRH/CRH-R1 system on the expression of these genes identified by expression profiling in CRH-R1 knockout mice.
Spatial Analysis of Differentially Expressed Genes by In Situ Hybridization
To determine the spatial distribution pattern of candidate genes and to identify those expression domains in the brain causative for the identified changes in gene expression, we performed in situ hybridization using riboprobes for selected candidates: Rgs5, Sparc, Ptgds (data not shown), Mkrn2 (data not shown), Ttr (data not shown), peripheral myelin protein 22 (Pmp22), selenoprotein P plasma 1 (Sepp1), vimentin (Vim), and collagen type I alpha 2 (Col1a2). Rgs5 expression was evenly distributed throughout the brain (Figure 2A). Additionally, high levels of expression were detected in the PVN of the hypothalamus (Figure 2B) and in the basolateral amygdala (Figure 2C). Parallel hybridization of cryosections from wild-type and CRH-R1 mutant brains revealed an overall stronger expression of Rgs5 in CRH-R1 knockout mice (+1.21-fold, P = 0.002; two-tailed t-test; Figure 2A). A similar increase in Rgs5 expression was observed in the PVN(+1.27-fold, P < 0.001) whereas expression levels in the basolateral amygdala were not altered (Figures 2B and 2C). Sparc was broadly expressed in the entire brain with highest expression levels in the basal forebrain including septal nuclei, thalamus, hypothalamus, and amygdala as well as throughout the mid- and hindbrain. A significant decrease in expression was observed in septal nuclei located at the ventral midline like in the medial septum (−1.53-fold, P = 0.001) or the nuclei of the vertical and horizontal limb diagonal band (Figure 2D). In the PVN of CRH-R1 mutant mice, the expression of Sparc was increased (Figure 2E) whereas the claustrum was identified as a region of diminished Sparc expression in CRH-R1 mutant mice (−1.14-fold, P = 0.017; Figure 2F). As already detected for Rgs5, the overall hybridization signal in regions of moderate expression like in the caudate putamen or in the cortex was stronger in CRH-R1 knockout mice as compared with wild-type littermates (+1.21-fold, P = 0.001; Figure 2D). The expression of Pmp22 in the mouse CNS has not been studied in detail, but a recent publication report on the expression of Pmp22 at the developing blood–nerve and blood–brain barriers (Roux et al, 2004). We found Pmp22 expressed at high levels throughout the brain (Figure 2G). In knockout mice, Pmp22 expression was clearly increased compared with wild-type littermates (+1.17-fold, P < 0.001) with strongest differences in the expression observed in the corpus callosum (+1.24-fold, P < 0.001) and in the anterior commissure (+1.16-fold, P < 0.001; Figures 2H and 2I). In situ hybridization with a specific riboprobe for Sepp1 demonstrated its ubiquitous expression in the adult murine CNS. Quantification by parallel in situ hybridization analysis confirmed the decreased expression of Sepp1 throughout the brain of CRH-R1 knockout mice compared with wild-type littermates (−1.16-fold, P < 0.001; Figure 2J). As for Sparc, the difference in expression was most obvious in the regions of moderate expression like in the hippocampus (Figure 2K). Strong expression of the intermediate filament protein Vim was detected in a scattered pattern throughout the brain, reflecting the cerebral vascular network with blood vessels ranging in diameter from capillaries to arteries and veins. The expression of Vim was markedly increased in CRH-R1 knockout mice compared with wild-type animals (+1.32-fold; P < 0.001; Figure 2L). Additionally, Vim expression was detected in the PVN where its expression was also found to be increased in mutant animals (+1.28-fold, P < 0.001; Figure 2M). A comparable but more restricted vascular expression pattern was detected with a specific riboprobe for Col1a2. Col1a2 was predominantly detected in blood vessels of larger diameter, with CRH-R1 knockout mice showing an increased number of Col1a2 positive blood vessels (+1.10-fold, P = 0.032; Figure 2N). Moreover, we identified a previously unrecognized weak expression of Col1a2 in the PVN (Figure 2O) and in the ventromedial hypothalamus (Figure 2P). The expression of Col1a2 in the PVN was downregulated in CRH-R1 knockout mice whereas no difference was observed in the ventromedial hypothalamus.
All genes analyzed by in situ hybridization presented a moderate to high expression and were rather ubiquitously dispersed all over the brain. The majority of identified differences in gene expression reflected global changes in expression levels. Nevertheless, some candidate genes exhibited genotype-dependent alterations in gene expression that were restricted to specific nuclei and in some cases even showed an opposite regulation compared with observed global changes.
Alterations in Gene Expression in Corticotropin-releasing Hormone Receptor Type 1 Mutant Mice are Predominantly Associated with the Cerebral Vasculature
The majority of genes analyzed by in situ hybridization exhibited global changes in activity reflecting their ubiquitous expression throughout the adult murine brain (Figure 2). A detailed analysis of the spatial distribution pattern of in situ hybridization signals within the brain parenchyma confined the expression not only of Vim and Col1a2 but also of Rgs5, Sparc, and Sepp1 to the neurovascular network (Figures 3D–H). As an example, we demonstrated the microvascular localization of Rgs5. Cells expressing Rgs5 were detected in close vicinity of or attached to arterioles and capillaries as visualized by vector red staining of endogenous AP activity, which is exclusively present in cerebral vascular endothelial cells (Figures 3A–C). Rgs5 and Sparc were clearly upregulated in the cerebral vasculature of CRH-R1 knockout mice as observed for Vim and Col1a2 (Figures 3D, 3E, 3G, and 3H) whereas the expression of Sepp1 was decreased in brain capillaries of mutant animals (Figure 3F). Besides Rgs5, Sparc, Sepp1, Vim, Col1a2, and Pmp22 further genes known to be expressed in cell types associated with the cerebral vasculature were identified among candidate genes obtained by expression profiling: procollagen type I alpha 1 (Col1a1), glutamate-ammonia ligase (Glul), tight junction protein 1 (Tjp1), angiomotin-like 1 (Amotl1), and pleiotrophin (Ptn). In summary, analysis of the spatial expression pattern of candidate genes underscores a predominant effect of the CRH-R1-deficiency on the regulation of genes associated with the cerebral vasculature.
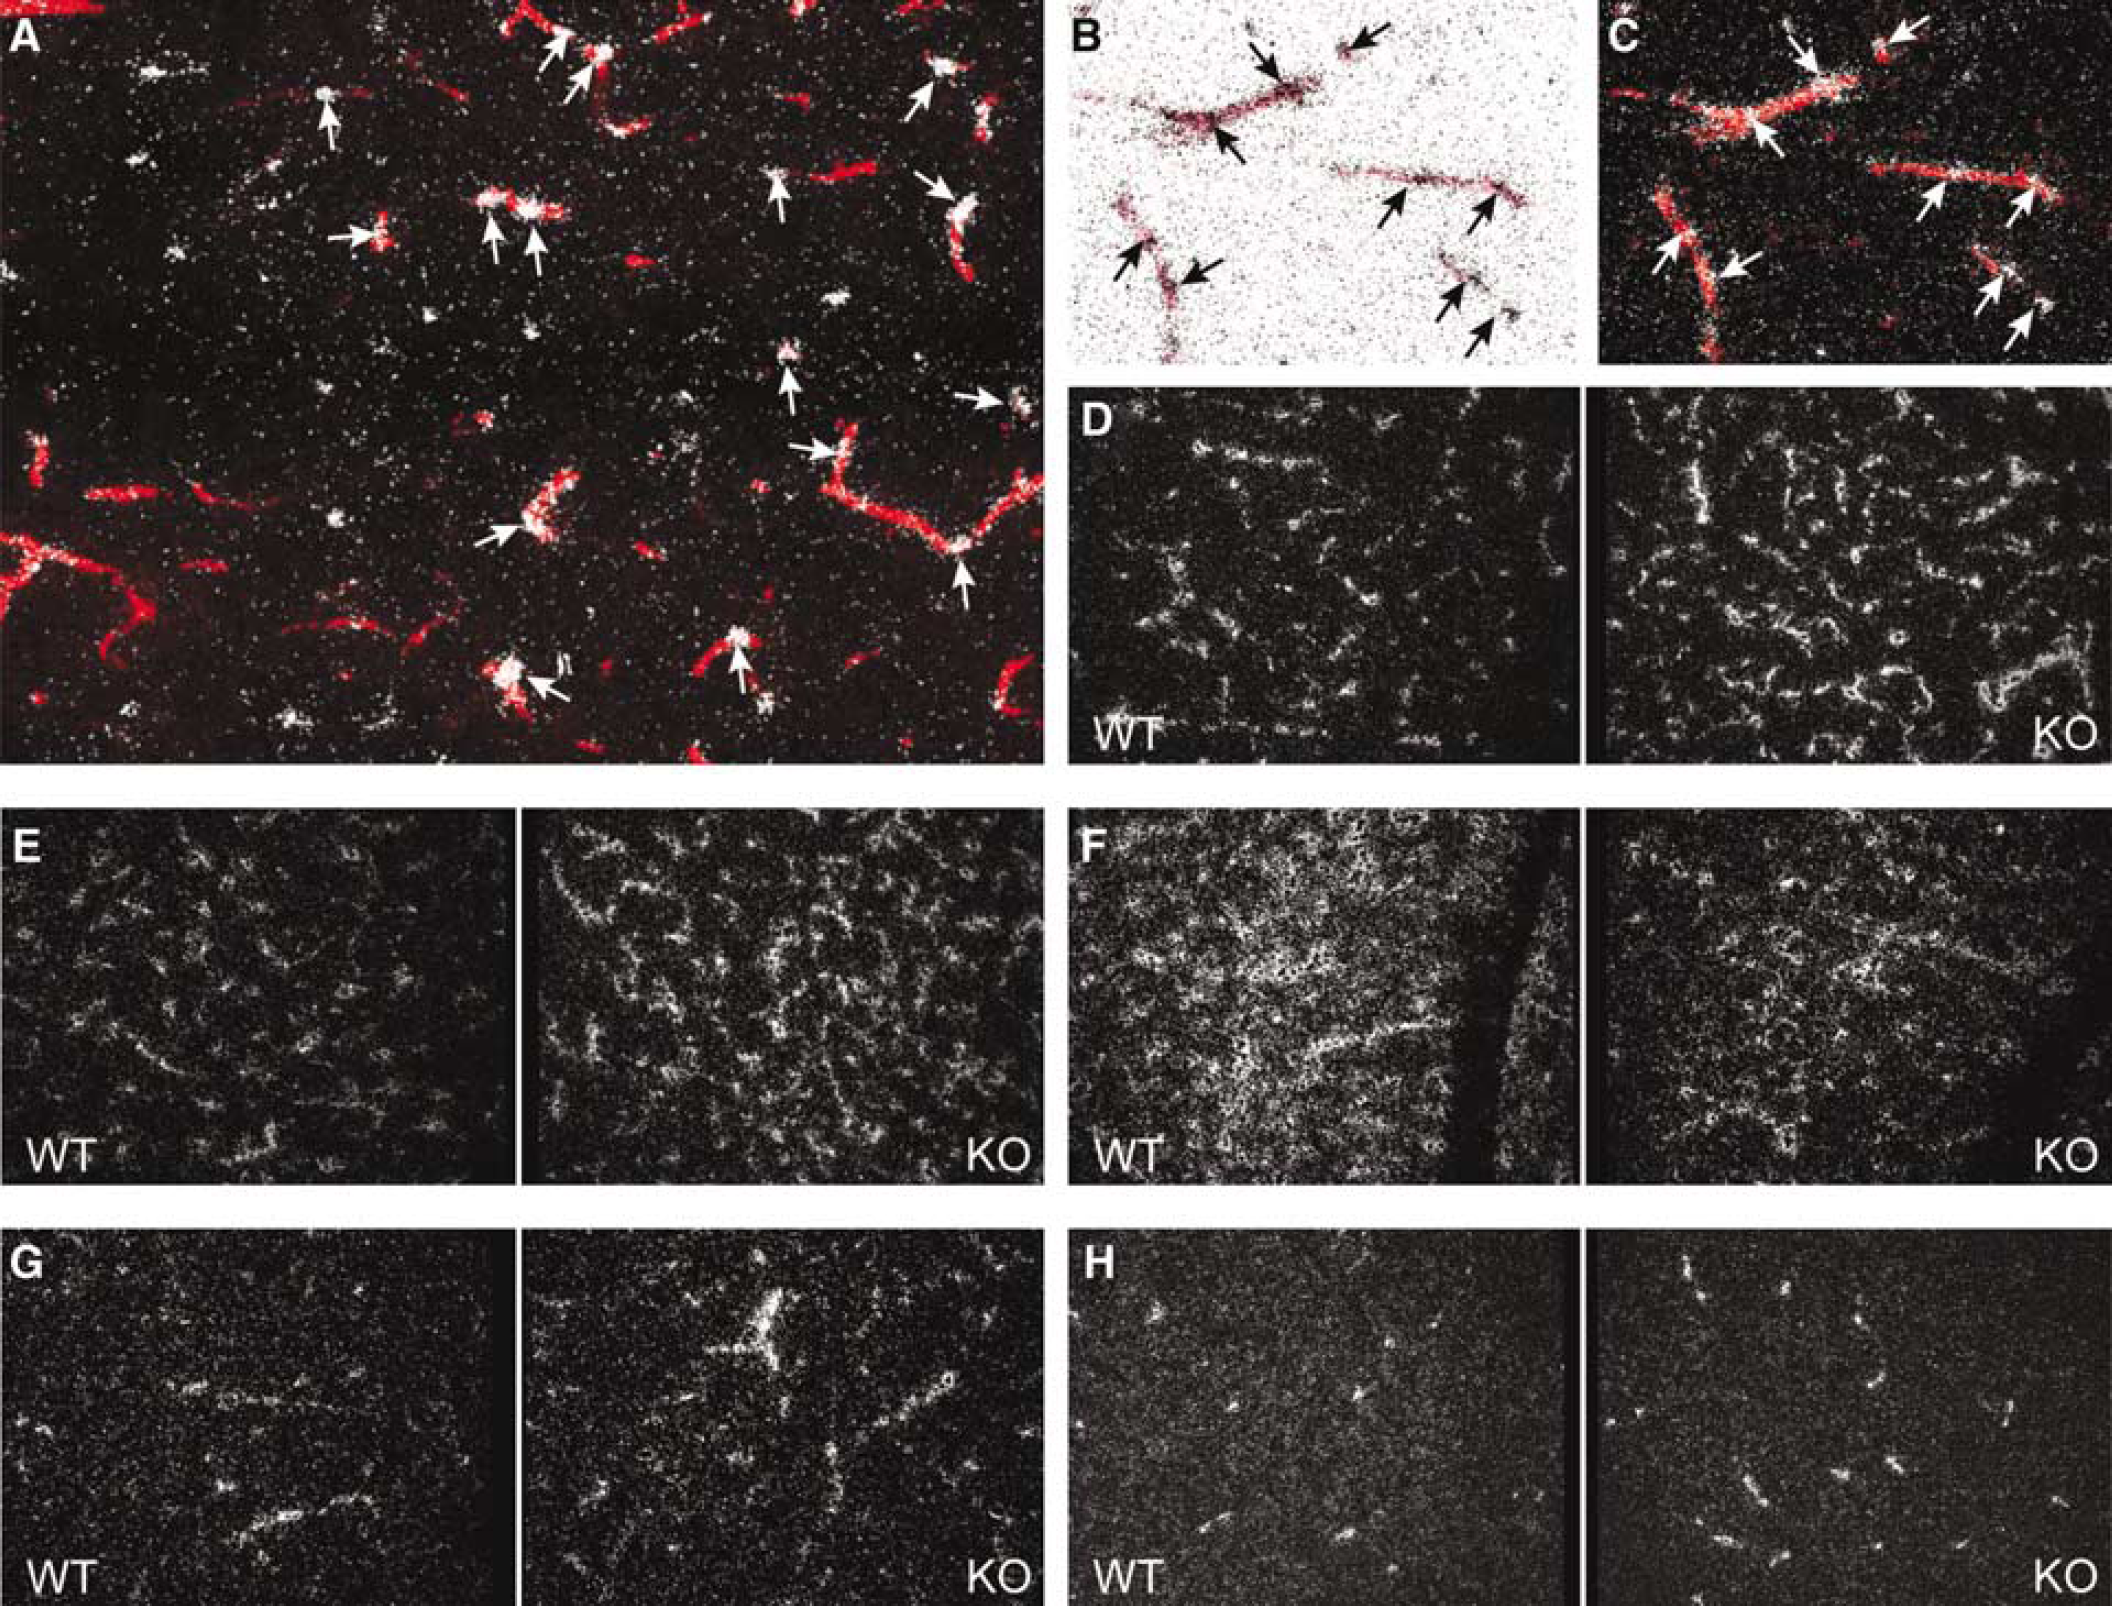
Genes regulated in CRH-R1 knockout mice are differentially expressed within the cerebral vasculature. (
Opposite Regulation of Candidate Genes in Corticotropin-releasing Hormone Overexpressing Mice Confirmed the Changes in Gene Expression Associated with the Cerebral Vasculature
We have demonstrated that genes differentially expressed in CRH-R1 knockout mice were conversely regulated in CRH-tg mice. Therefore, we also examined the expression of genes associated with the cerebral vasculature identified in CRH-R1 knockout mice in the brain of CRH-tg mice (Figure 4). In situ hybridization for Rgs5, Sparc, Sepp1, Vim, and Col1a2 on cryosections of CRH-tg and wild-type control mice confirmed the expression patterns previously observed in CRH-R1 knockout and wild-type mice (Figures 4A–J). While the differences in gene expression restricted to specific brain nuclei were not observed in CRH-tg mice, for example, the expression of Sparc in the claustrum was not altered (Figure 4C), the vascular localization and genotype-dependent differential expression was confirmed for all genes analyzed. As observed in the Northern blot analysis, genes upregulated in CRH-R1 mice (Rgs5, Sparc; Vim, Col1a2) were found to be downregulated (Rgs5: −1.57-fold, P < 0.001, Figure 4B; Sparc: Figure 4D; Vim: −1.13-fold, P = 0.023, Figure 4H; and Col1a2: −1.07-fold, P = 0.051, Figure 4J) in the cerebral vasculature of CRH-tg mice and vice versa (Sepp: +1.51-fold, P = 0.052; Figure 4F).
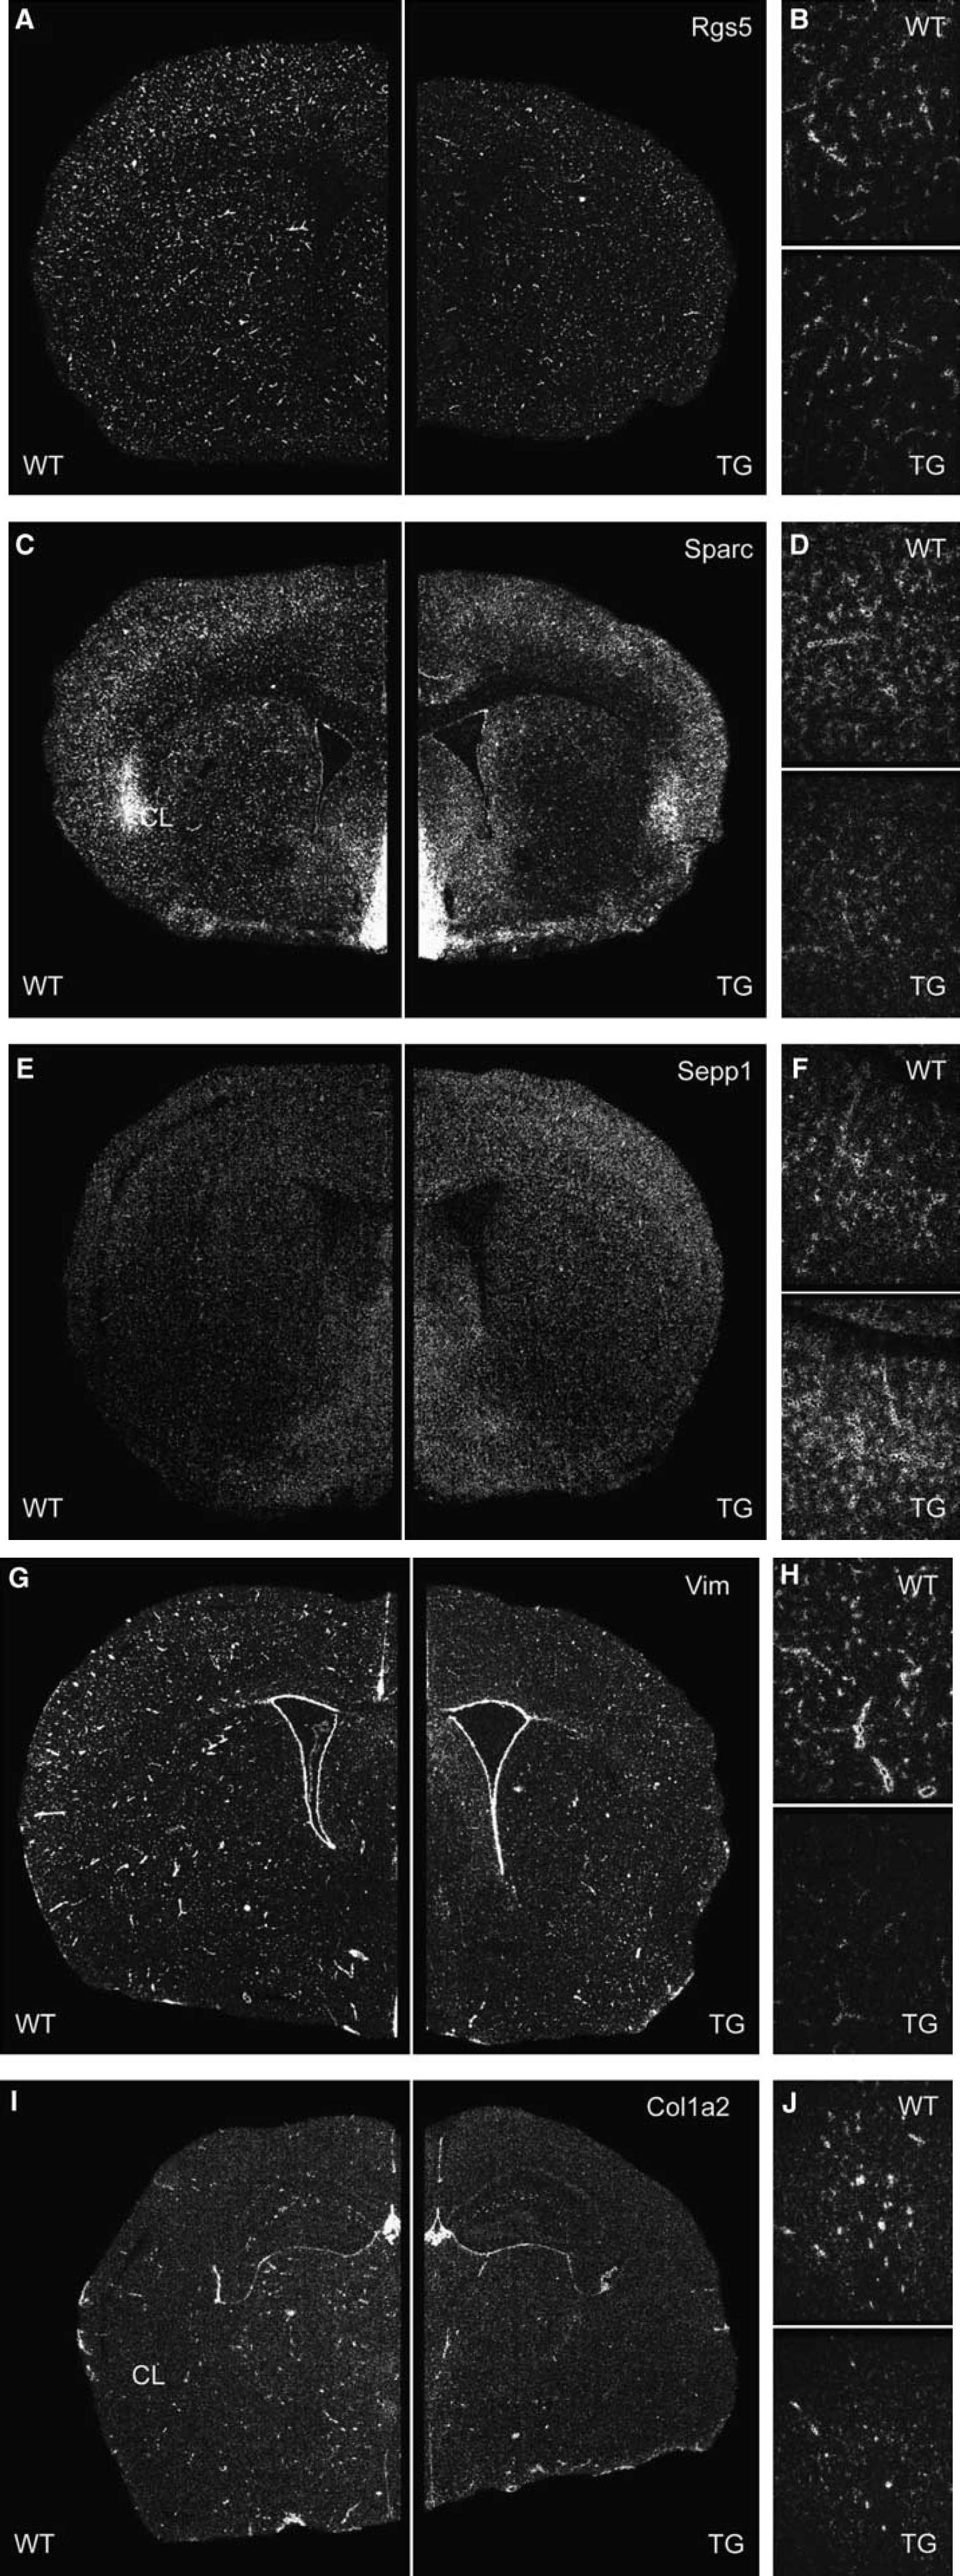
Cross-confirmation of CRH-R1 deficiency-dependent gene expression in the cerebral vasculature of CRH-tg mice. Expression of Rgs5 (
The Density of Cerebral Blood Vessels was Affected Neither in Corticotropin-Releasing Hormone Receptor Type 1 Knockout Nor in Corticotropin-Releasing Hormone Overexpressing Mice, but Alkaline Phosphatase Activity was Regulated Differently
To test whether the observed differences in gene expression potentially resulted from quantitative morphologic differences, we investigated the density of the cerebrovascular network. Cryosections of CRH-R1 wild-type and mutant mice were stained for the basement membrane protein collagen IV to visualize blood vessels. No significant genotype-dependent differences regarding the density of capillaries were observed (data not shown). We further examined AP activity, which is a specific marker for endothelial cells of arteries, arterioles, and capillaries, and distinguishes afferent from efferent blood vessels in the brain (Bell and Scarrow, 1984). Staining of cryosections with the AP substrate BCIP confirmed the similarity of cerebral microvessel density in the brains of CRH-R1 mutant and wild-type animals. However, a strong difference in enzymatic activity became apparent (Figure 5A). Histomorphometrical quantification revealed a 1.8-fold upregulation of AP activity in sections of CRH-R1-deficient brains compared with wild-type brains (Figure 5C). Accordingly, collagen IV staining of cerebral blood vessels of CRH-tg mice revealed no genotype-dependent differences in the density of the neurovascular network compared with wild-type littermates (data not shown). However, AP staining manifested a marked decrease of enzymatic activity in CRH-tg brains compared with wild-type littermates (Figures 5B and 5C).
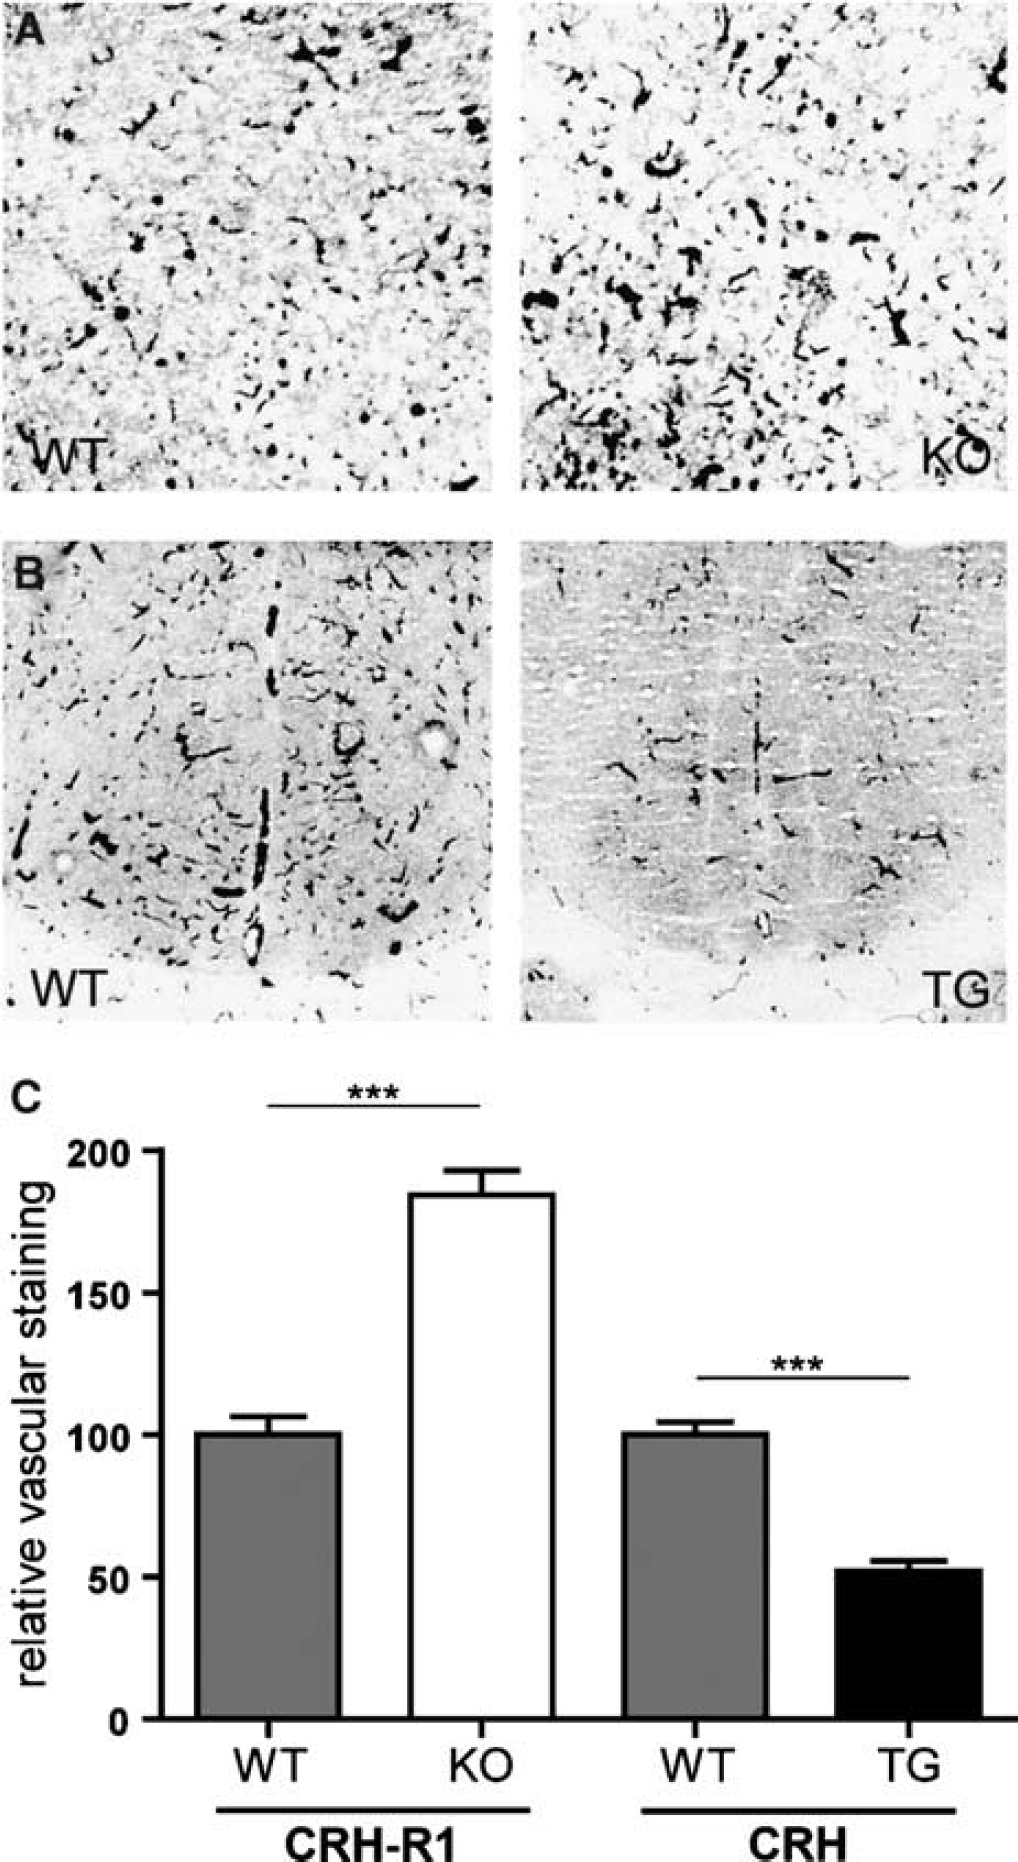
The activity of AP in the cerebral vasculature is altered in CRH-R1 knockout and CRH-tg mice. Representative bright field photomicrographs of AP-stained cryosections from the striatum of (
Perfusion of entire brains of CRH-R1 mutant mice and wild-type littermates with BCIP revealed that the increase in AP staining is consistently present throughout the afferent blood supply, from pial arteries on the surface of the brain to intracerebral capillaries (Figures 6A and 6B). This is in contrast to CRH-tg mice, where AP activity is severely downregulated within the afferent blood supply (Figures 6C and 6D). In summary, these results establish AP as a marker reflecting CRH/CRH-R1-dependent changes in neurovascular gene expression.
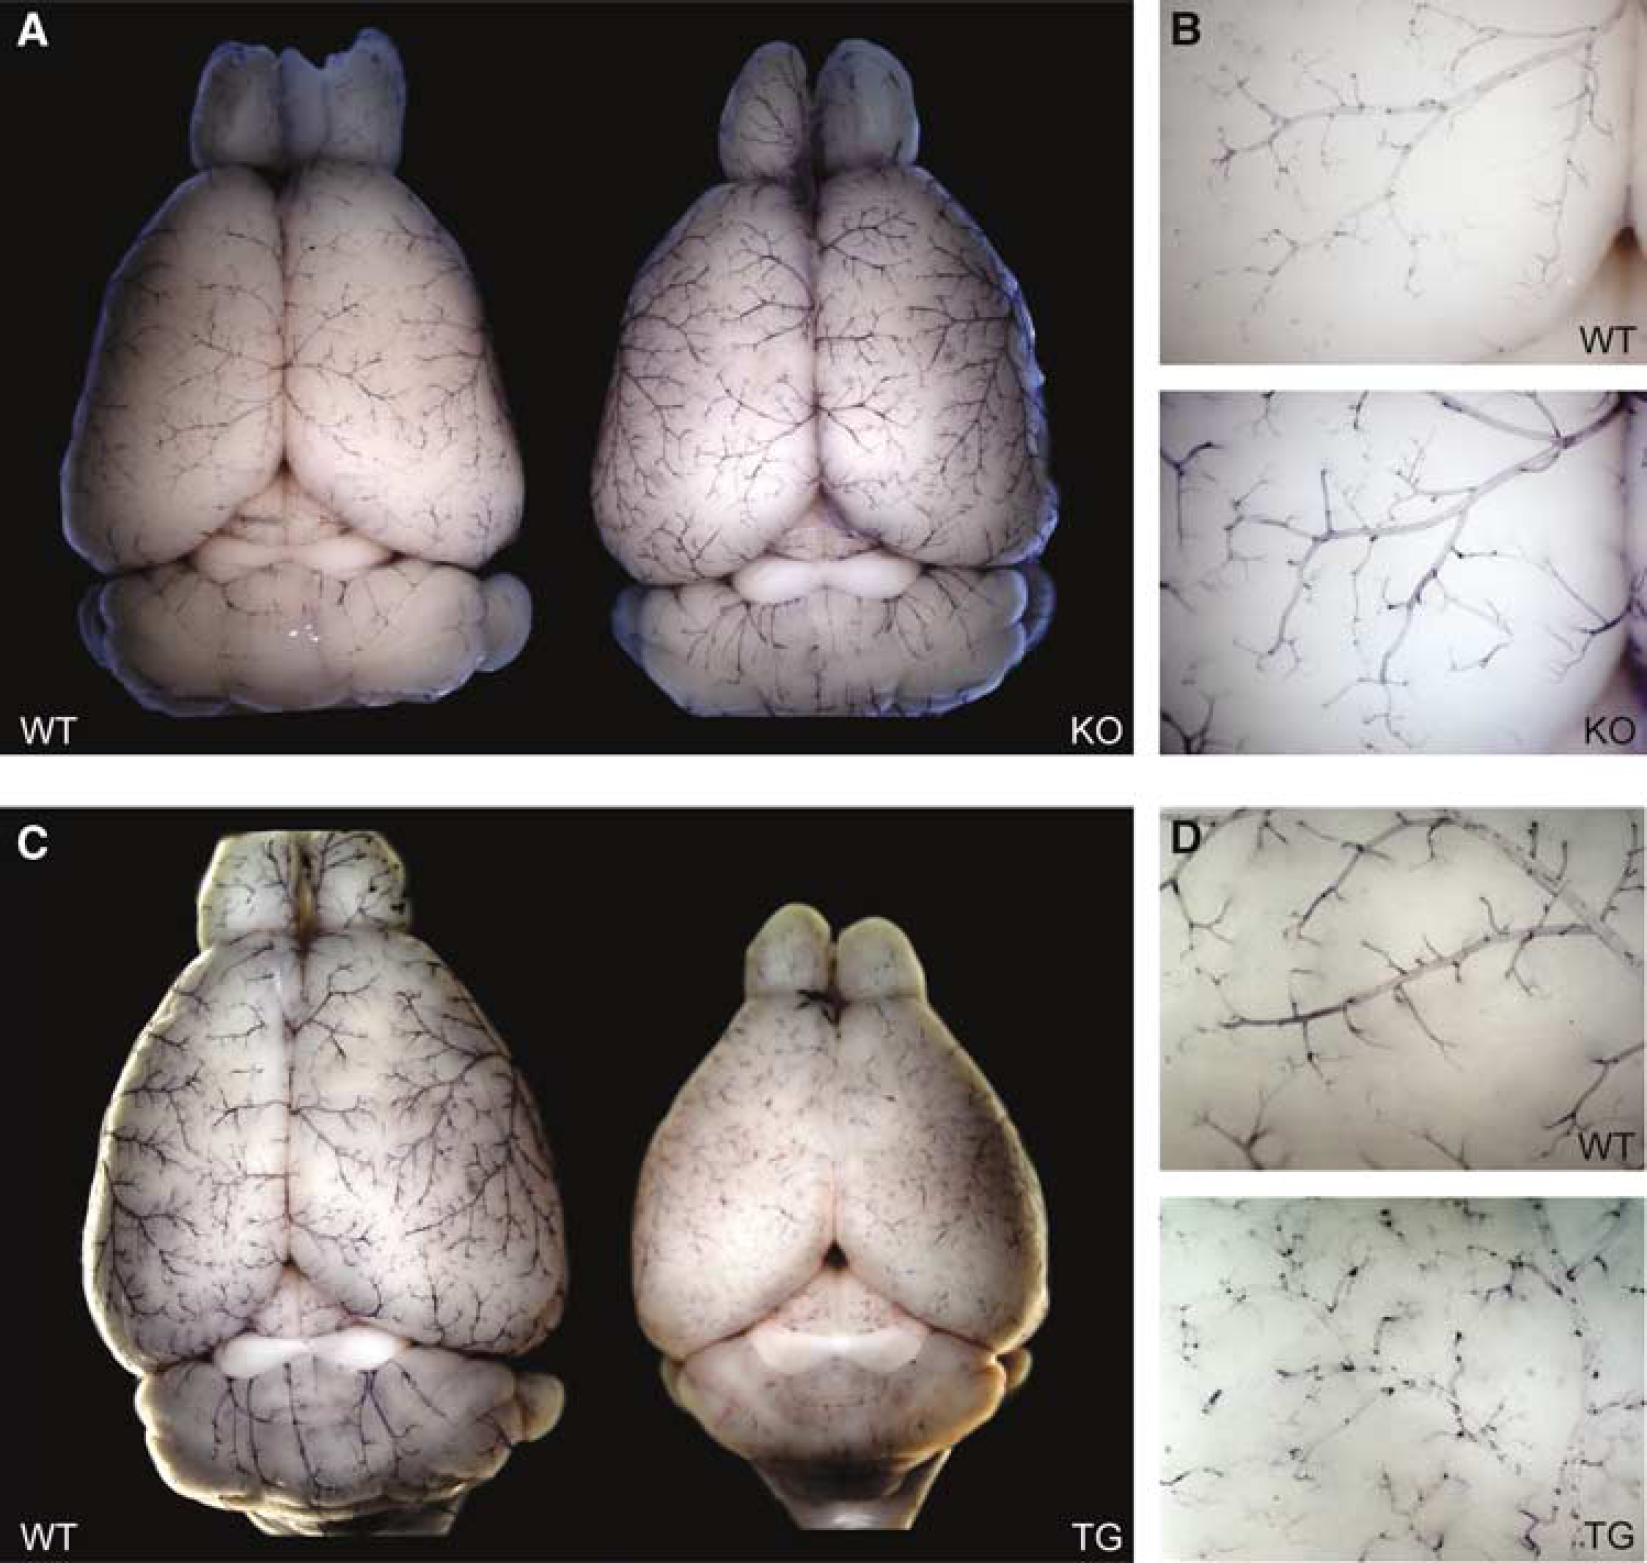
Alkaline phosphatase activity in the afferent blood supply of CRH-R1 knockout and CRH-tg mice is regulated genotype dependently. Dorsal view of (
Corticotropin-Releasing Hormone Receptor Type 1 is Expressed in the Cerebral Microvasculature
The observed changes in cerebrovascular gene expression in CRH-R1 mutant animals and their confirmation in CRH-tg mice suggest a direct role of the CRH/CRH-R system in modulating neurovascular gene expression. Since the expression of CRH and its receptors in the cerebral vasculature of the mouse has not been studied in detail, we investigated the expression of Crh, Crhr1, and Crhr2 by semiquantitative RT-PCR in RNA extracted from specimen enriched in murine cerebral vasculature.
We demonstrated the strong enrichment of cerebral blood vessels using glucose transporter 1 (Glut1) and Rgs5 as specific markers for endothelial and perivascular cells (pericytes and smooth muscle cells), respectively (Figure 7A). The purity of blood vessels was assessed by RT-PCR using neurogranin (Ngrn) as a marker for neurons as well as the Map2, which is a marker for neurons and astrocytes. The low expression of Nrgn in the vascular sample indicates only a minor contamination with neurons. However, the increased expression of Map2 in the vascular sample compared with the brain sample suggests a co-purification of astrocytes that most likely remain attached to the cerebral vasculature. This interpretation is supported by the increased expression of Gfap observed in the sample enriched in cerebral vasculature (Figure 7A). RT-PCR revealed the expression of Crhr1 in the cerebral vasculature. Crhr2 was also found expressed, however, at lower levels whereas Crh is not expressed or its expression level was below the detection limit (Figure 7B).
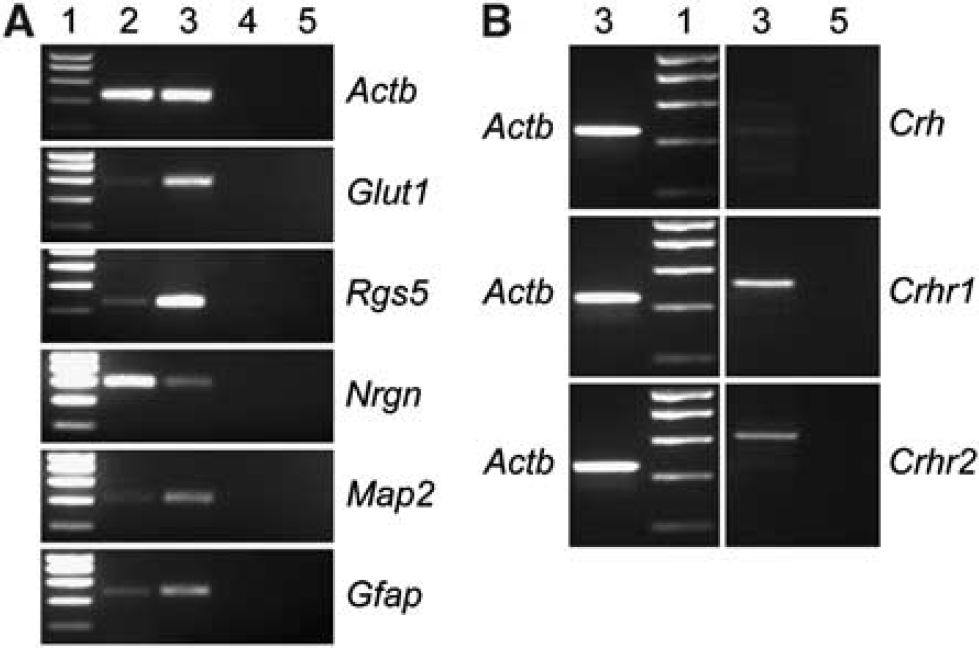
Expression analysis of Crh, Crhr1, and Crhr2 in adult cerebral vasculature. (
Discussion
Despite the enormous heterogeneity of the brain, which consists of a multitude of different cell types and is composed of numerous functionally and morphologically distinguishable units, we identified and confirmed differentially expressed genes establishing the MPIP-17k array as a reliable platform for expression profiling. The comparison of gene expression profiles of brains derived from CRH-R1 knockout and wild-type mice identified alterations in gene expression predominantly related to (i) the HPA axis, (ii) the HPT axis, and (iii) the cerebral vasculature.
Hypothalamic–Pituitary–Adrenal Axis Dysregulation in Corticotropin-Releasing Hormone Receptor Type 1 Mutant Mice Results in Altered Expression of Genes Controlling Hypothalamic–Pituitary–Adrenal Axis Activity and Glucocorticoid Signaling
The PVN plays a crucial role in controlling HPA axis activity via stress-induced expression and release of CRH. Disruption of the HPA axis in CRH-R1 knockout mice results in an activation of the hypothalamic vassopressinergic system, which is sufficient to maintain normal basal plasma ACTH levels (Muller et al, 2000). Similar adaptive mechanisms may account for altered expression of Rgs5, Vim, Sparc, and Col1a2 observed in the PVN of CRH-R1 knockout mice. As genes directly related to HPA axis control and glucocorticoid signaling, we found Nr3c1, Hsd11b1, Fkbp4, Calr, and p23 differentially expressed between wild-type and knockout mice. Nr3c1, also known as glucocorticoid receptor (GR), was found to be upregulated 1.2-fold in the brain of CRH-R1 mutant mice. An autoregulation of GR has been demonstrated earlier in adrenalectomized rats, which show increased hippocampal GR expression (Reul et al, 1989). Hsd11b1, the key enzyme regulating intracellular regeneration of glucocorticoids in the brain and pituitary, was increased 1.3-fold in CRH-R1 mutant brains likely by similar regulatory mechanisms. Studies with mice deficient in Hsd11b1 have demonstrated the importance of this 11-β-hydroxysteroid dehydrogenase for HPA axis regulation (Harris et al, 2001). Our result is in line with expression-profiling experiments using CRH-tg mice, which reported a 0.57-fold down-regulation of Hsd11b1 in the hippocampus potentially attributed to the chronic elevation of glucocorticoids in these mice (Peeters et al, 2004). Peeters and co-workers further demonstrated a 2.17-fold upregulation of Fkbp5 in the temporal area and in the nucleus accumbens of CRH tg mice. Our studies revealed an increase of Fkbp4 (+ 1.1-fold) in the entire brain of CRH R1 knockout mice. Glucocorticoid receptor forms a heteromultimeric cytoplasmic complex with heat-shock protein (HSP) 90, HSP70, and FKBP5. On ligand binding, FKBP5 is replaced by FKBP4, which links the complex to dynein and thereby mediates the transport to the nucleus. Expression of p23, another co-chaperone stabilizing the GR-HSP90 complex and involved in GR activation, was found 1.1-fold increased (Dittmar et al, 1997). The upregulation of Calr (+ 1.2 fold) most likely parallels regulatory mechanisms involving Fkpb4 and p23. CALR is a multifunctional protein, which is capable of binding to the DNA-binding domain of GR and facilitates its export from the nucleus to the cytoplasm (Holaska et al, 2002). In CRH-R1-deficient mice, the increase in Fkbp4, p23, and Calr expression might contribute to compensatory processes counteracting low plasma corticosterone levels, in contrast to CRH-tg mice, where upregulation of Fkbp5 is rather attenuating GR as a response to high levels of circulating glucocorticoids.
Differential Expression of Hypothalamic–Pituitary–Thyroid Axis Components Reflects Cross-Regulatory Mechanisms Between Hypothalamic-Pituitary-Adrenal and Hypothalamic–Pituitary–Thyroid Axes
The HPT axis is a stress-responsive endocrine system, which is regulated by glucocorticoids, the end product of the HPA axis. Different from the HPA axis, the HPT axis is inhibited in depressed patients (Musselman and Nemeroff, 1996). Glucocorticoids repress the HPT axis on the level of the hypothalamus by inhibiting thyrotropin-releasing hormone expression (Kakucska et al, 1995). Activation of the HPA axis has been associated with the decreased production of thyroid-stimulating hormone and inhibition of peripheral conversion of l-thyroxine (T4) to the biologically more active 3,5,3′-l-triiodothyronine (T3). The herein reported microarray analysis identified an altered expression of several major HPT axis components in the brain of CRH-R1 mutant mice reflecting the regulatory influence of the HPA axis. For instance, Ttr (also known as prealbumin), which is in the brain the only thyroid hormone-binding plasma protein, was downregulated 1.1/1.2-fold. Under physiologic conditions, TTR functions as a carrier for T4 and vitamin A, in the latter case through binding to the retinol-binding protein (Monaco, 2000). T4, which is the major secretory product of the thyroid gland, is converted by DIO2 to active T3. Thereby DIO2 plays a critical role in locally regulating the intracellular T3 concentration (Bianco et al, 2002). We found Dio2 upregulated 1.5-fold in mutant mice, potentially resulting in increased brain T3 levels. This result is in agreement with array data by Peeters et al (2004), where Dio2 was found to be downregulated (0.53-fold) in the prefrontal cortex of CRH-tg mice. The downregulation of the nuclear hormone receptor Thra (−1.1-fold), which is the executer of T3 activity (O'Shea and Williams, 2002), might reflect a consequence of increased local T3 levels because of elevated DIO2 activity. Finally, the downregulation of Trip12 (−1.2-fold) underscores the direct impact of the HPA axis disruption on the HPT axis in CRH-R1-deficient mice.
Corticotropin-Releasing Hormone Receptor Type 1 Deficiency and Corticotropin-Releasing Hormone Overexpression Interfere with Neurovascular Gene Expression
Apart from the HPA and HPT axis, our attention was drawn to the cerebral vasculature by the high proportion of regulated genes localized to the microvasculature and to cells associated with the blood–brain barrier. For instance, Rgs5 (+1.2-fold) is almost exclusively expressed throughout the cerebral microvascular network. RGS5 belongs to a large family of multifunctional signaling proteins, acting as GTPase-activating proteins, thereby negatively regulating G protein-coupled receptor signaling. RGS5 was identified as a novel marker for pericytes and vascular smooth muscle cells by the expression profiling of PDGF-B-deficient mouse embryos (Bondjers et al, 2003), and was found downregulated in brain capillaries of stroke-prone spontaneously hypertensive rats (Kirsch et al, 2001). RGS5 regulates platelet-derived growth factor receptor-β and G protein-coupled receptor-mediated signaling pathways active during fetal vascular maturation as well as during phases of active vessel remodeling (Berger et al, 2005).
The expression of several structural constituents of the cerebral vasculature including Sparc, Vim, and Col1a2 was induced in CRH-R1 knockout brains. The Ca2+-binding matricellular glycoprotein SPARC modulates the interaction of cells with the extracellular matrix by regulating cell adhesion and binding of growth factors. SPARC regulates the activity of PDGF, VEGF, and fibroblast growth factor-2, which are important for vascular homeostasis (Raines et al, 1992; Kupprion et al, 1998). SPARC was induced in mature blood vessels close to cerebral lesions suggesting a role in processes related to angiogenesis after injury (Mendis et al, 1998). It is known to bind collagen type I in vivo, which is one of the major fibril-forming extracellular matrix proteins maintaining the structural integrity of blood vessels. SPARC has been shown to suppress the expression of collagen type I (Francki et al, 1999) and a deficiency in type I collagen negatively affects the accumulation of extracellular SPARC (Iruela-Arispe et al, 1996). Type I collagen is a triple-stranded rope-like coiled structure of one alpha 2 and two alpha 1 chains. Accordingly we found Col1a2 and Col1a1 upregulated in CRH-R1 mutant brains. Another structural component that was increased in CRH-R1 mutant animals is Vim, an intermediate filament protein found in ependymal cells, and activated astrocytes, but also in cells of blood vessels such as pericytes and smooth muscle cells (Schnitzer et al, 1981).
In contrast to CRH-R2-deficient mice, which develop a systemic hypervascularization postnatally (Bale et al, 2002), we could not detect any signs of altered vascular densities in the brain of CRH-R1-deficient mice. This finding rather favors a functional than a structural alteration of the vascular network. This viewpoint is supported by significantly increased AP activity in the afferent cerebral vasculature of CRH-R1 mutant mice, in particular, when considering that the appearance of cytochemically detectable AP activity in endothelial cells of capillaries and arterioles in mouse brain coincides with maturation of blood–brain barrier (Vorbrodt et al, 1986). The implication of CRH and related peptides in cardiovascular function is well established and may play an important role in cardiovascular adaptations to stress (Coste et al, 2002). Acute stress increases blood–brain barrier permeability, an effect involving CRH, which has been demonstrated to directly affect brain microvessel endothelial cells (Esposito et al, 2002). The expression of CRH receptors in the cerebral vasculature has not yet been studied in detail although the CRH receptor protein has been detected in bovine and rat brain microvascular endothelial cells by Western blot albeit using an antibody detecting both receptors (Esposito et al, 2003). To our knowledge, the present study provides the first evidence by means of RT-PCR that Crhr1 is expressed in the cerebral microvasculature. Whether Crhr1 is expressed in vascular endothelial cells, pericytes, or vascular smooth muscle cells remains to be investigated in detail. Expression in blood vessel-associated astrocytes has been demonstrated recently (Stevens et al, 2003).
Taken together, our data show the potential of microarray analyses not only to dissect the molecular mechanisms underlying known phenotypes but also to identify previously unrecognized phenotypes in genetically engineered mouse models.
Footnotes
Acknowledgements
The authors thank Daniela Kohl, Katja Mayer, Sabrina Meyr, and Tanja Orschmann for excellent technical assistance. We thank Daniela Vogt Weisenhorn, Peter Weber, and Carola Hetzel for helpful contributions.
References
Supplementary Material
Please find the following supplemental material available below.
For Open Access articles published under a Creative Commons License, all supplemental material carries the same license as the article it is associated with.
For non-Open Access articles published, all supplemental material carries a non-exclusive license, and permission requests for re-use of supplemental material or any part of supplemental material shall be sent directly to the copyright owner as specified in the copyright notice associated with the article.