
Abstract
Astrocytic glutamate (Glt) uptake keeps brain interstitial Glt levels low. Within the astrocytes Glt is converted to glutamine (Gln), which is released and reconverted to Glt in neurons. The Glt–Gln cycle is energy demanding and impaired energy metabolism has been suggested to cause low interstitial Gln/Glt ratios. Using microdialysis (MD) measurements from visually noninjured cortex in 33 neurointensive care patients with subarachnoid hemorrhage, we have determined how interstitial Glt and Gln, as a reflection of the Glt–Gln cycle turnover, relate to perturbed energy metabolism. A total of 3703 hourly samples were analyzed. The lactate/pyruvate (L/P) ratios correlated to the Gln/Glt ratios (r = −0.66), but this correlation was not stronger than the correlation between L/P and Glt (r = 0.68) or the correlation between lactate and Glt (r = 0.65). A novel observation was a linear relationship between interstitial pyruvate and Gln (r = 0.52). There were 13 periods (404 h) of ‘energy crisis’, defined by L/P ratios above 40. All were associated with high interstitial Glt levels. Periods with L/P ratios above 40 and low pyruvate levels were associated with decreased interstitial Gln levels, suggesting ischemia and failing astrocytic Gln synthesis. Periods with L/P ratios above 40 and normal or high pyruvate levels were associated with increased interstitial Gln levels, which may represent an astrocytic hyperglycolytic response to high interstitial Glt levels. The results imply that moderately elevated L/P ratios cannot always be interpreted as failing energy metabolism and that interstitial pyruvate levels may discriminate whether or not there is sufficient astrocytic capacity for Glt–Gln cycling in the brain.
Introduction
Intracerebral microdialysis (MD) makes it possible to monitor the neurochemistry in the injured human brain, and numerous attempts have been made to determine the significance of different MD patterns (reviewed by Hillered et al, 2005). The interstitial lactate/pyruvate ratio (L/P) is currently regarded the most sensitive and specific MD marker to indicate that the tissue's demand for glucose and/or oxygen is not met (for references see Bellander et al, 2004). During ischemia, interstitial glutamate (Glt) commonly increase as L/P increase (for references see Hillered et al, 2005). High Glt levels are, however, regarded as a less specific marker of energy perturbation because interstitial Glt elevations can have multiple causes, including cellular leakage, altered synaptic transmission, blood–brain barrier leakage and inhibited uptake (Hillered et al, 2005). High interstitial L/P and Glt have generally been associated with poor outcome when observed in conditions such as subarachnoid hemorrhage (SAH) (Persson et al, 1996; Sarrafzadeh et al, 2004), thromboembolic stroke (Dohmen et al, 2003), seizures (Vespa et al, 1998), and traumatic brain injury (Bullock et al, 1998).
Sodium-dependent high capacity astrocytic transporters remove Glt from the synaptic cleft, terminate synaptic transmission, and prevent excitotoxicity (Danbolt, 2001). The astrocytic Glt transport is coupled to increased energy metabolism for provision of ATP to restore the membrane potential (for references see Magistretti and Pellerin, 1999). Glt is amidated to glutamine (Gln) by ATP-dependent astrocytic Gln-synthetase. Gln exit astrocytes down a concentration gradient through System N amino-acid transporters and enter neurons against a concentration gradient through System A sodium-coupled amino-acid transport (Broer and Brookes, 2001). Within neurons, Gln is converted to Glt by mitochondrial glutaminase (Broer and Brookes, 2001). The Glt–Gln cycle between neurons and astrocytes is a major metabolic pathway requiring ∼80% of the total brain glucose consumption (Magistretti et al, 1999; Shen et al, 1999). Astrocytic glucose utilization increase in response to rising interstitial Glt levels (Magistretti and Pellerin, 1999) and astrocytic Glt uptake decrease when ATP production fails (Buck et al, 2003).
Decreased interstitial Gln/Glt ratios have been reported in acute and chronic brain injuries such as traumatic brain injury (Cavus et al, 2005; Richards et al, 2003), hypoxia (Raman et al, 2005), and epilepsy (Labiner et al, 1999; Petroff et al, 2002; Samuelsson et al, 2003). Impaired Glt–Gln cycling because of compromised energy metabolism was the proposed mechanism behind the high interstitial Glt levels and the low interstitial Gln levels in those studies.
To further explore the relationship between the Glt–Gln cycle and the energy metabolism, we set out to examine whether energy perturbation generally is associated with low Gln/Glt ratios in the brain. We used MD measurements from visually noninjured cortex in patients with spontaneous SAH, during their first week of neurointensive care. These patients occasionally experience episodes of compromised brain metabolism, owing to increased intracranial pressure, vasospasm, hypotension, hypoxia, hyperthermia, and seizures. The MD measurements consequently include a spectrum of situations with respect to the energy status of the tissue from which the MD-probe samples.
Materials and methods
Patients
Thirty-three patients (22 women and 11 men) with spontaneous SAH, admitted to the neurointensive care unit at Uppsala University Hospital, who received MD-monitoring as part of the standard care regime, were included. Mean age was 55.5 (standard deviation, s.d. 8.9) years. Patients were admitted between April 2003 and September 2005. All were believed to have a potential to survive. The median World Federation of Neurosurgical Surgeons grade (Teasdale et al, 1988) was 3.5 (range 1 to 5). The aneurysms were treated surgically (n = 16) or with endovascular therapy (n = 16). In one patient no aneurysm was found. The MD probes were placed in the frontal lobe cortex, either before or during the treatment of the aneurysm, via a separate burr hole in front of the ventricular drain (n = 28) or through a bone flap (n = 5). Care was taken to insert the probe in visually noninjured cortex. Mean duration from first sign of SAH to start of MD sampling was 29.5 (s.d. 24) h. Mean duration of MD sampling was 112 (s.d. 37) h. In our neurointensive care protocol, all patients have bed rest and receive nimodipine. We aim to keep the patients normovolemic and normotensive. Patients with decreased level of consciousness are intubated and artificially ventilated. Computed tomography-scans on all patients in the present study, performed on clinical indication, showed no radiologic signs of bleeding around the MD probe.
Microdialysis
Intracerebral MD was performed using CMA/70 probes with 10 mm membrane length (CMA Microdialysis, Stockholm, Sweden). The probes were perfused with artificial cerebral spinal fluid (Na+ 148 mmol/L, Ca2+ 1.2 mmol/L, Mg2+ 0.9 mmol/L, K+ 2.7 mmol/L, Cl− 155 mmol/L) at a rate of 0.3 μL/min using a microinjection CMA/106 pump (CMA Microdialysis). Samples were taken hourly and analyzed bedside for lactate, pyruvate, and urea with enzymatic techniques using a CMA/600 Microdialysate Analyzer (CMA Microdialysis). Urea was monitored to control the probe performance (Ronne-Engstrom et al, 2001). At least 3 h passed after insertion of the probe and start of sampling to allow for normalization of changes owing to probe insertion. The CMA/600 Microdialysate Analyzer was automatically calibrated when started as well as every sixth hour using standard calibration solutions from the manufacturer. Quality controls at two different concentrations for each substance were performed every weekday. Imprecision values for between-assay coefficient of variation was < 10% for the low and < 5% for the high concentration control samples.
Samples were analyzed for Glt and Gln with high performance liquid chromatography with fluorescence detection as described previously (Hillered et al, 1989). Briefly, the amino acids were automatically derivatized with o-phthaldialdehyde in a CMA/200 (CMA Microdialysis) refrigerated microsampler and gradient separated on a Nucleosil C18 column, 5 μm 60 × 4 mm (CMA Microdialysis). The mobile phase gradient consisted of 0.1 mol/L sodium acetate buffer pH 6.7 with 2.5% tetrahydrofurane and methanol concentration increasing from 5% to 97.5%. Quality control measurements of the high performance liquid chromatography system using blank water samples, as well as standardized calibration solutions mimicking those of the human samples were run daily. In addition, internal control samples were run together with each patient series. Imprecision values were 3% to 5% for within-assay coefficient of variation and 5% to 9% for between-assay coefficient of variation for the Glt and Gln measurements.
Analysis, Statistics, and Presentation of Data
Statistical analysis and graphical presentation was performed using Statistica 7.1. for Windows (StatSoft Inc., Tulsa, OK, USA). Results were regarded significant if P < 0.05.
To explore the relationship between Glt, Gln, and energy metabolites, correlation analyses were performed on raw and logged MD data with regard to Glt, Gln, Gln/Glt, L/P, lactate, and pyruvate. Missing data were pair-wise deleted. Correlation analyses were performed using parametric as well as nonparametric statistics. To test differences in Pearson correlation coefficients Fisher's z transformations were conducted.
The median interstitial Gln concentration during the first six sampling hours and the median interstitial Gln concentration during the last six sampling hours were determined for each of the 33 patients. The median concentrations at the start of the sampling were compared with the median concentrations at the end of the sampling using Wilcoxon matched pairs test.
For each patient, the MD concentration of lactate, pyruvate, Glt, Gln, L/P, and Gln/Glt were plotted over time and analyzed for patterns. Periods where the L/P ratio reached above 40, indicating energy crisis (Vespa et al, 2005), were identified. At least two consecutive L/P ratios above 40 was required to be considered a period. The concentration curves for Glt and Gln were subsequently carefully examined to determine if interstitial Gln and Glt increased or decreased during the period when L/P reached above 40. We defined an ‘increase in Glt’ when the concentration of Glt was higher in all the ‘high L/P samples’ as compared with the preceding Glt baseline concentration. In addition, the interstitial Glt levels should reach above the normal upper reference limit (32 μmol/L; Reinstrup et al, 2000) to be classified as an ‘increase’. For Gln, it is currently less clear what to regard as a normal interstitial Gln concentration. We defined an ‘increase in Gln’ when the Gln concentration was higher in all the high L/P samples as compared with the preceding Gln baseline concentration and/or there was a clear ‘upward slope’ of the Gln curve during the high L/P period. We defined a ‘decrease in Gln’ when the Gln concentration was lower in all high L/P samples as compared with the preceding Gln baseline concentration and/or there was a clear ‘downward’ slope of the Gln curve during the high L/P period. A pattern where no obvious pattern was discerned, for example in the case where there was both increasing and decreasing interstitial Gln concentration during the high L/P period, was classified as ‘varying’.
Using Kruskal–Wallis analysis of variance with post hoc testing and multiple comparisons of mean ranks, it was tested whether Gln and Glt levels during periods of high L/P ratios differed according to whether the interstitial pyruvate concentration was below, within, or above the normal range (119–213 μmol/L; Reinstrup et al, 2000).
Ethics
The local ethics committee for human research approved the study. Informed consent to participate in the study was obtained from all patients or their proxy.
Results
In total, 3703 MD samples were collected and analyzed. Glt correlated positively to L/P (r = 0.68) and to lactate (r = 0.65) (Table 1). The Gln/Glt ratio correlated negatively to L/P (r = −0.66). These relationships were of log–log nature (Figure 1). Very high Glt and very low Gln/Glt predominantly occurred when the L/P ratio exceeded 40 (Figure 1). There was no correlation between interstitial Gln and L/P and no relation between Glt and Gln (Table 1).
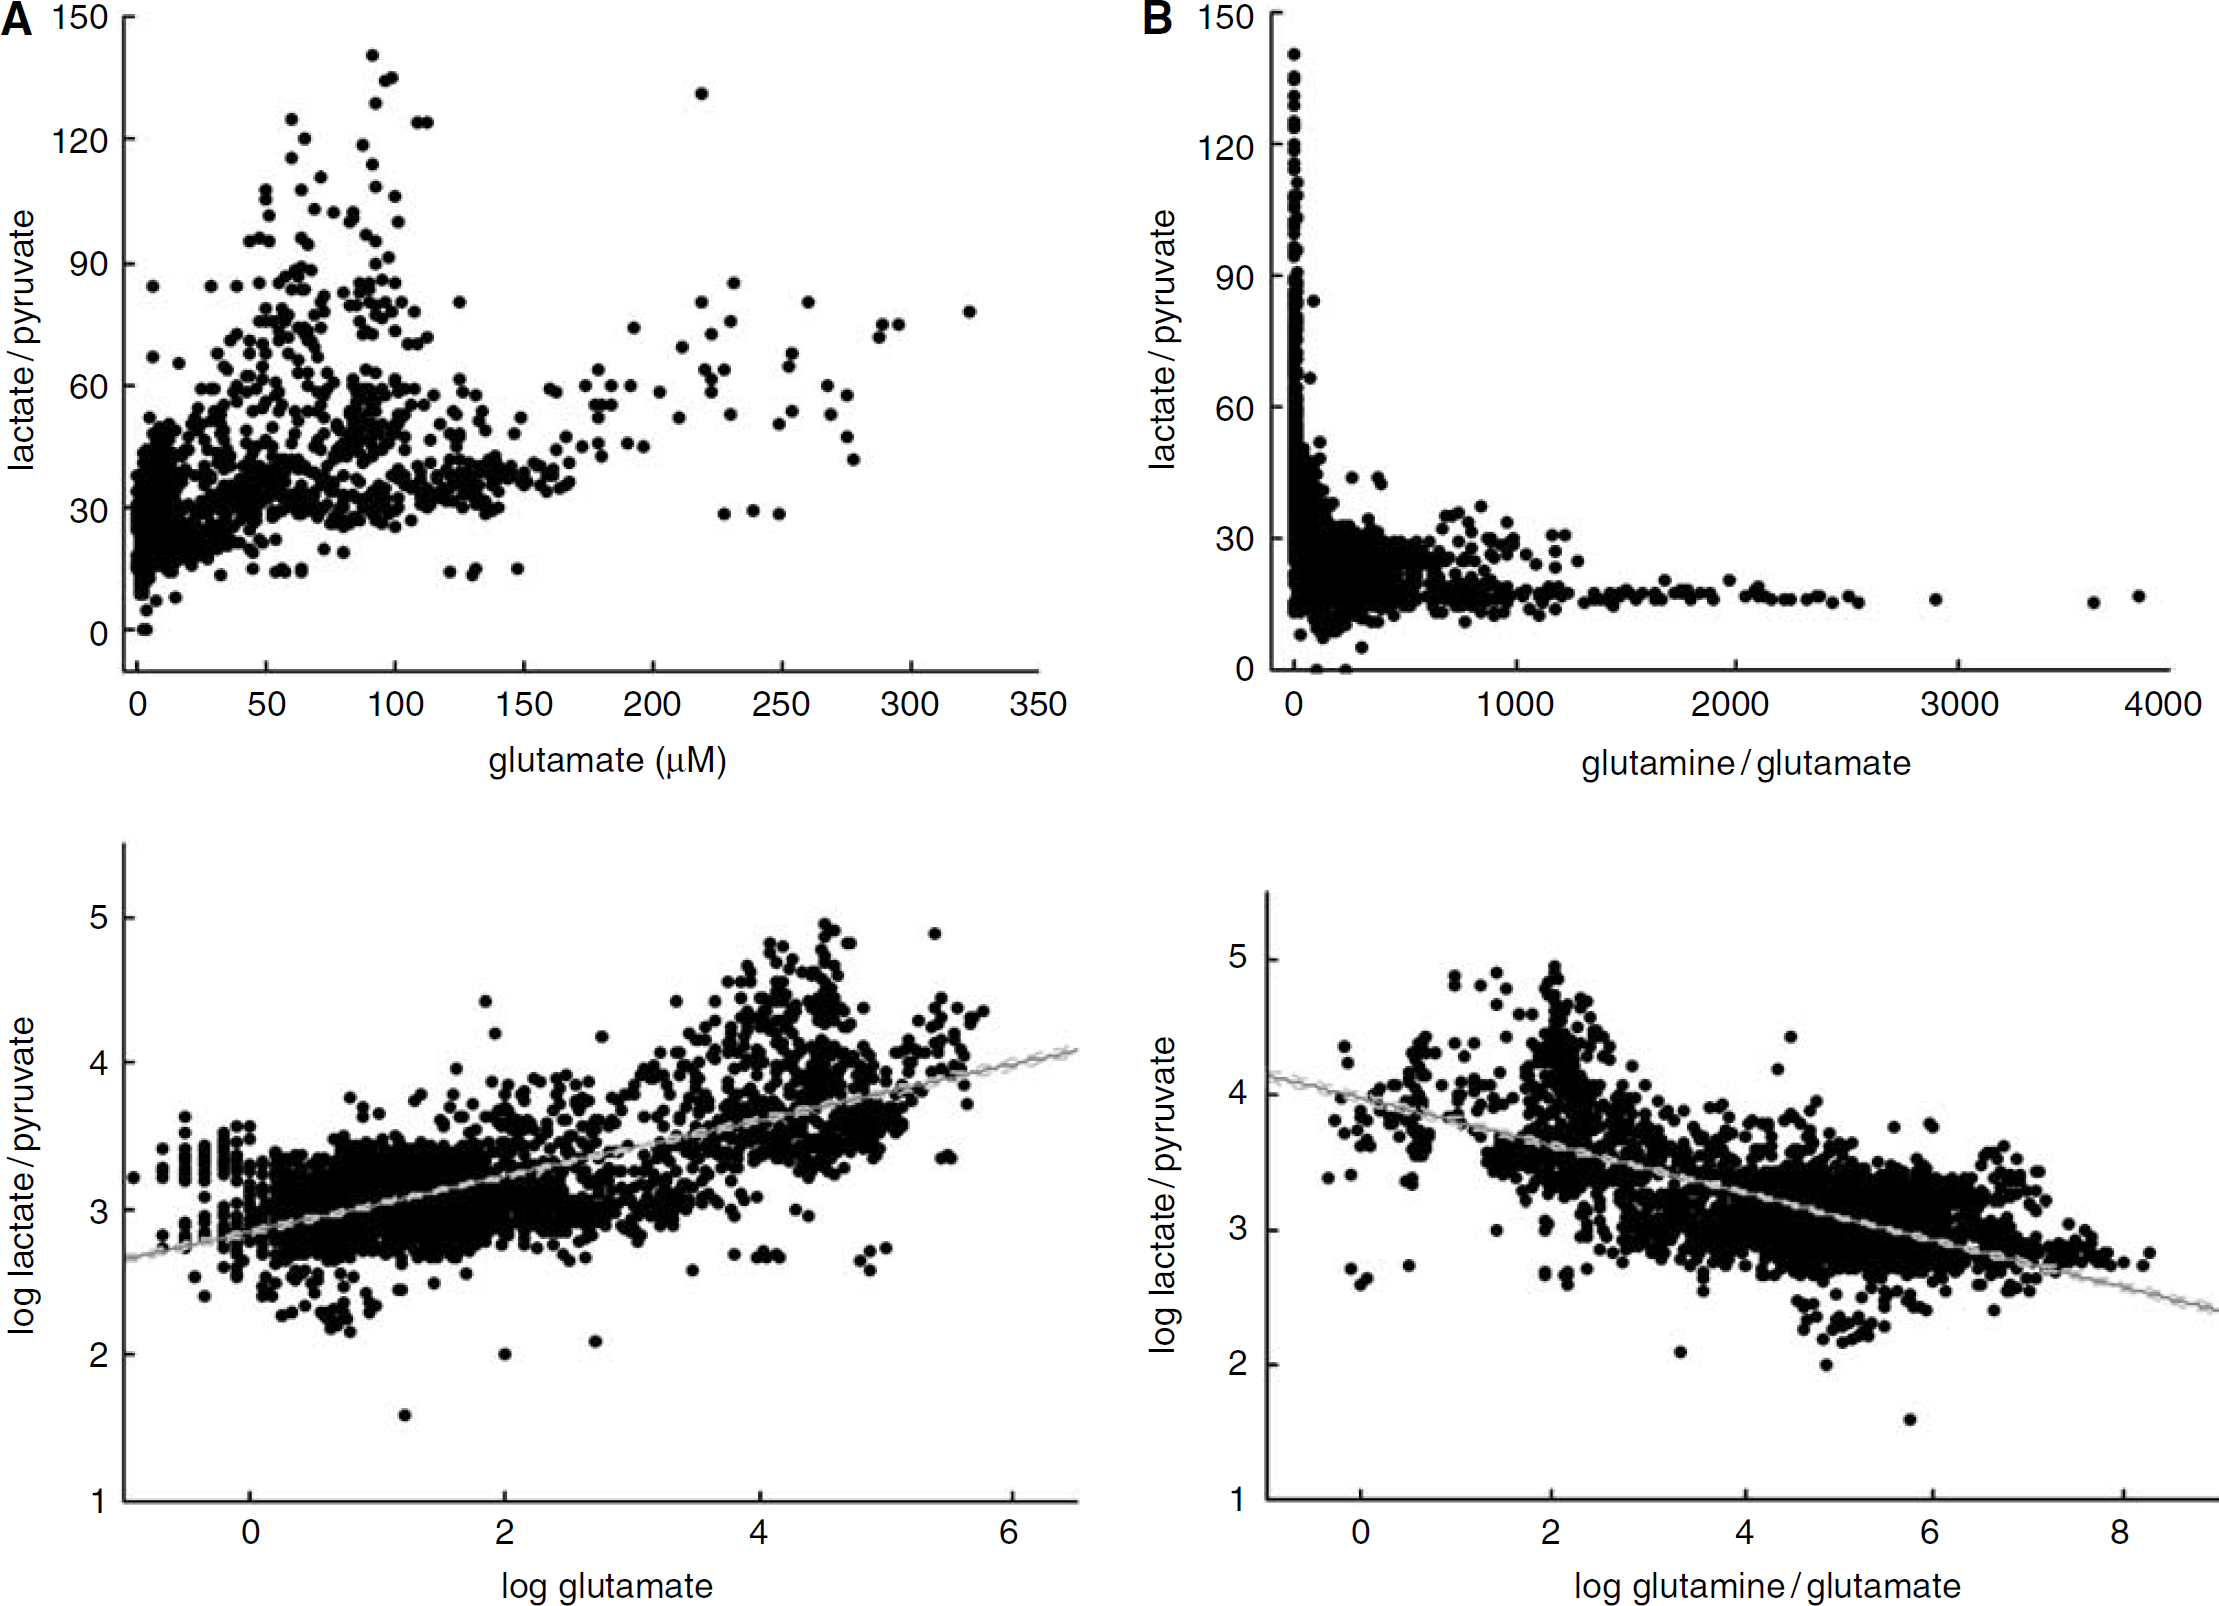
Scatterplots of raw (top) and logged (bottom) concentration in MD samples collected at the neurointensive care unit during the first week of treatment for SAH in 33 patients. (
Correlation matrix for the concentration of glutamine (Gln), glutamate (Glt), pyruvate (Pyr) and lactate (Lac) in microdialysis samples (n = 3,703) collected during the first week of treatment in 33 patients with subarachnoid hemorrhage
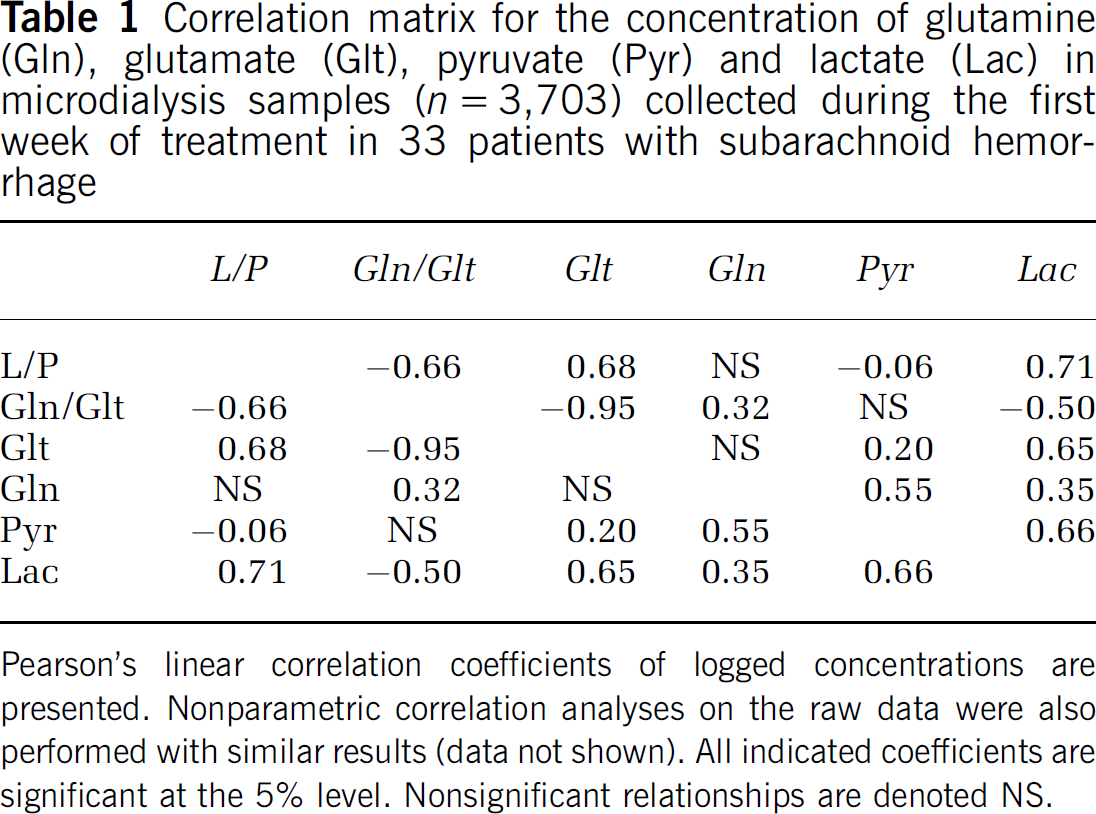
Pearson's linear correlation coefficients of logged concentrations are presented. Nonparametric correlation analyses on the raw data were also performed with similar results (data not shown). All indicated coefficients are significant at the 5% level. Nonsignificant relationships are denoted NS.
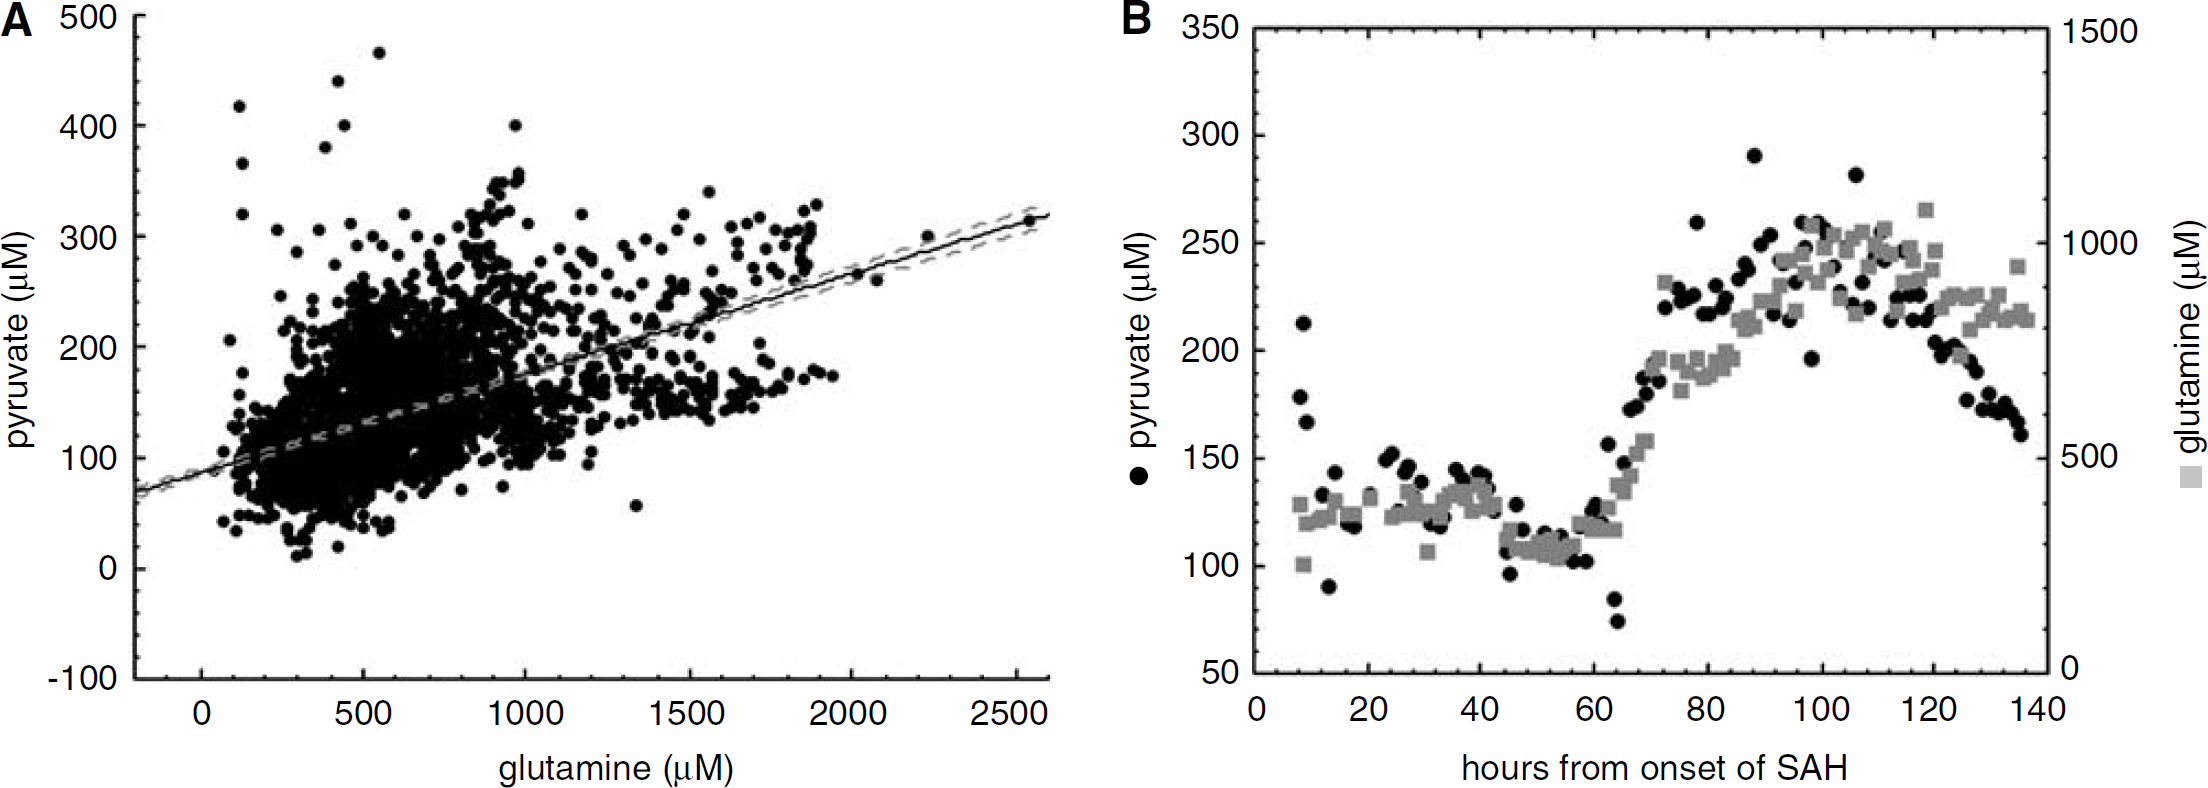
There was a significant correlation between interstitial levels of Gln and pyruvate (Table 1) and the relationship appeared linear (Figure 2A). In 22 out of 33 patients, the Gln curve and pyruvate curve had similar shapes (exemplified in Figure 2B). In 28 out of 33 patients, Gln levels were higher at the end of sampling compared with the beginning of the sampling (Figure 3).
(
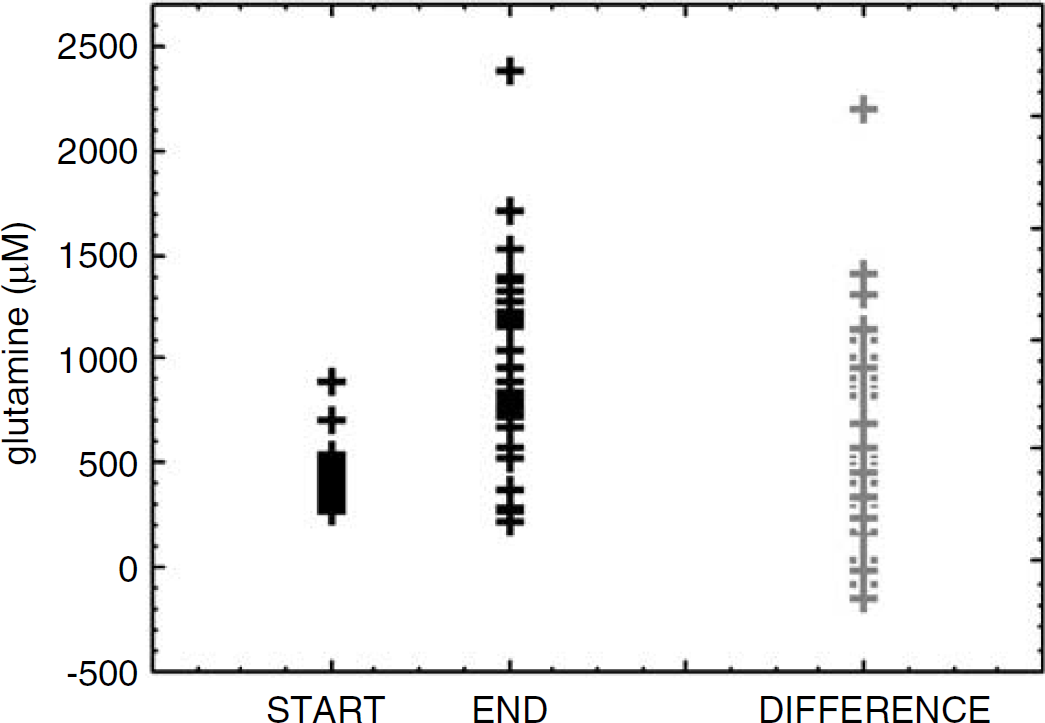
The median interstitial Gln concentration during the first 6 h of sampling (start) and during the last six sampling hours (end) for the 33 patients. The difference between each start and end value is also presented. Glutamine concentrations increased during the monitoring time (P < 0.001).
Thirteen periods of energy crises, where L/P exceeded 40, were identified in 13 patients (median duration 20 h, range 2 to 120 h, total duration 404 h). The median L/P ratio of these 404 samples was 53 (range 40 to 141). All 13 periods were associated with obvious increases in interstitial Glt from baseline, median peak Glt level being 110 μmol/L (range 33 to 320 μmol/L). The direction of the Gln concentration curve varied however. In four out of 13 periods where L/P exceeded 40, the interstitial Gln levels decreased (exemplified in Figure 4A). In seven out of 13 periods where L/P exceeded 40, there was a varying response involving both increasing and decreasing Gln concentration. In two out of 13 periods where L/P exceeded 40, the interstitial Gln concentration increased, concomitantly to increasing Glt, lactate, and pyruvate (exemplified in Figure 4B).
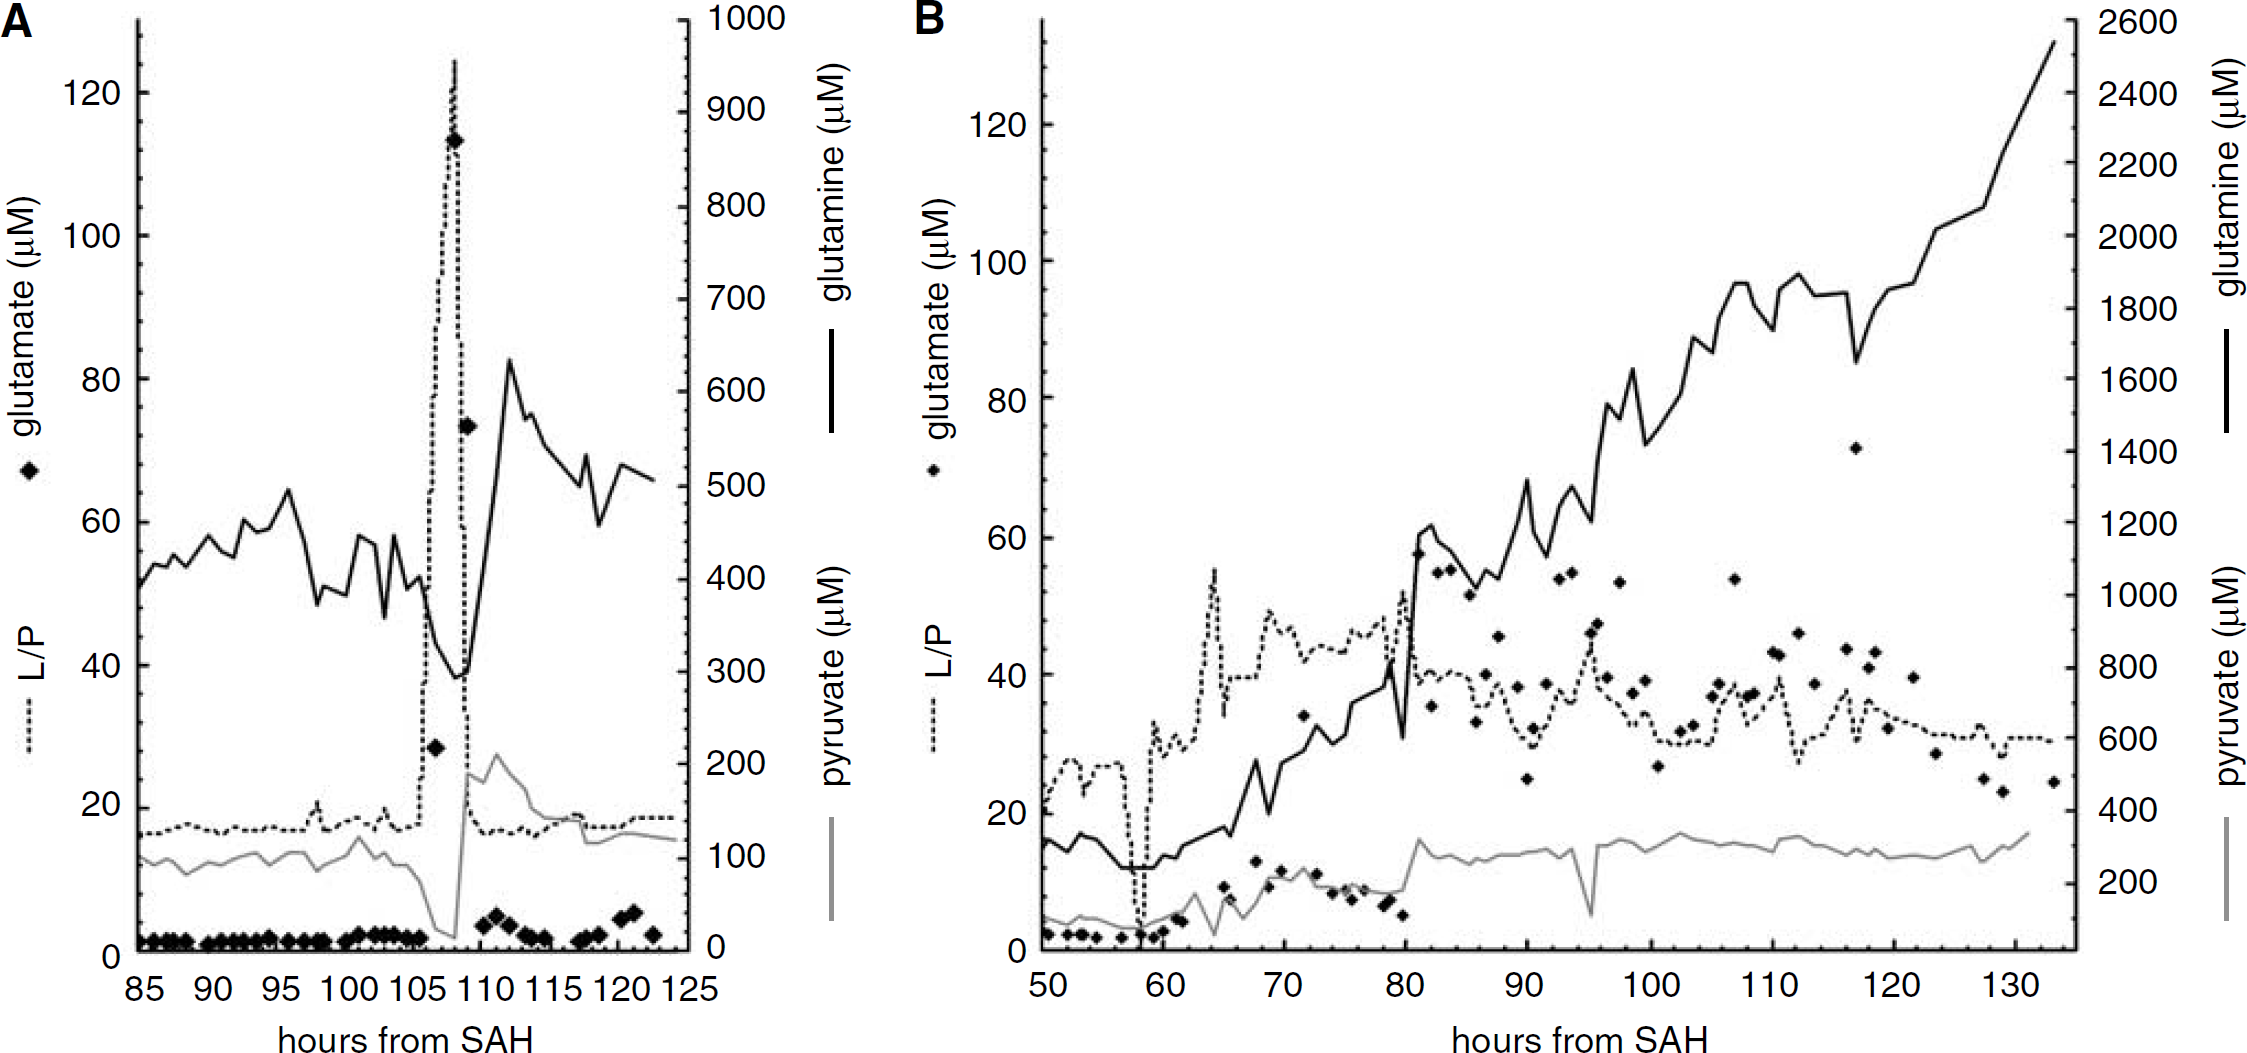
Examples on MD measurements from two patients to illustrate decreasing versus increasing interstitial Gln concentration during periods where the interstitial lactate/pyruvate ratio (L/P) exceeds 40. (
The pyruvate level was below the normal range (119 to 213 μmol/L; Reinstrup et al, 2000) in 214 (53%) of the 404 samples with L/P ratios above 40 (L/P range in these 214 samples: 40 to 141). The pyruvate level was within the normal range in 169 (42%) of the 404 samples with L/P ratios above 40 (L/P range in these 169 samples: 40 to 108). The pyruvate level was above the normal range in 21 (5%) of the 404 samples with L/P ratios above 40 (L/P range in these 21 samples: 40 to 60). The Gln concentration in the three groups, categorized according to whether pyruvate was below, within or above the normal range, differed significantly (Figure 5). Glutamine/glutamate ratios were lower in the low pyruvate group compared with the normal pyruvate group and the high pyruvate group. The difference in Gln/Glt ratio between the high pyruvate group and normal pyruvate group did not reach statistical significance (Figure 5).
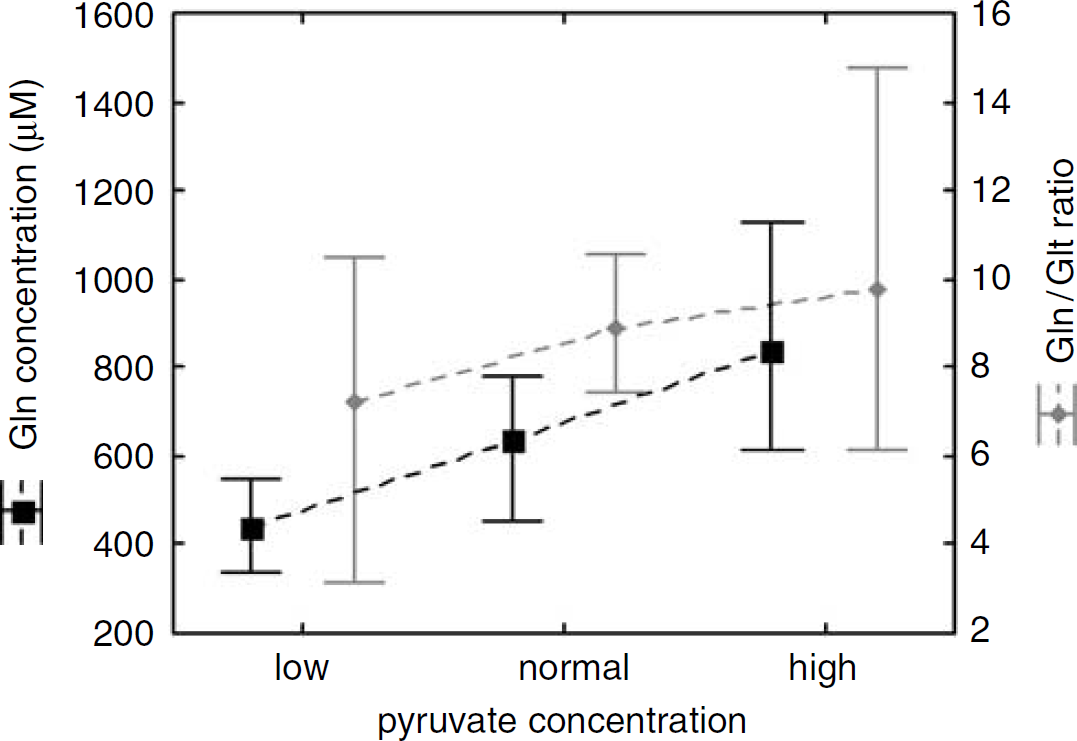
Glutamine (Gln) concentration and glutamine/glutamate (Gln/Glt) ratios in MD samples where interstitial L/P ratios exceeded 40 (n = 404) subgrouped depending on whether the pyruvate concentration was low (< 119 μmol/L, n = 214), normal (119 to 213 μmol/L, n = 169), or high (>213 μmol/L, n = 21) (Reinstrup et al, 2000). Plots represent median values with the 25% to 75% range. The Gln concentration differed significantly between the three groups (P < 0.01). Gln/Glt ratios were lower in the low pyruvate group compared with the normal pyruvate group and the high pyruvate group (P < 0.05). The difference in Gln/Glt ratio between the high pyruvate group and normal pyruvate group did not reach statistical significance.
Microdialysis Probe Performance
The microdialysate urea levels were stable throughout the monitoring periods for all 33 cases, indicating functioning probes (Ronne-Engstrom et al, 2001).
Discussion
We have conducted an observational study in an SAH patient cohort, where the patients received the MD-probe in conjunction with a ventricular drain for release of high intracranial pressure or during acute aneurysmal surgery. All patients were unconscious or sedated during the majority of the sampling time. The measurements consequently reflect the interstitial chemistry in severely compromised brains. Nevertheless, this in vivo human study was an opportunity to observe how alterations in energy metabolites relate to the interstitial Gln/Glt ratios as a reflection of the Glt–Gln cycle, a topic of increasing interest.
As previously shown by others, we observed a strong correlation between the interstitial Glt levels and the L/P ratio as well as between Glt and lactate (Persson et al, 1996; Sarrafzadeh et al, 2005, 2003). High Glt and low Gln/Glt ratios predominantly occurred when the L/P ratio exceeded 40 (Figure 1). This finding is in line with previous observations where L/P ratios above 40 has been characterized as a threshold for ‘energy crisis’ (Vespa et al, 2005) and has been associated with high Glt levels (Persson et al, 1996). We found no correlation between interstitial Gln and the L/P ratio and no inverse relationship between interstitial Gln and Glt (Table 1). Interstitial Gln increased with time in a majority of the patients (Figure 3). When observing the data it was apparent that the fluctuations in interstitial Gln were less pronounced than for Glt. This may not be surprising considering the efficient high capacity systems for both Glt release and Glt uptake. Glutamine travels more slowly, with both release into and uptake from the interstitial space partly depending on concentration gradients across the cell membranes of neurons and astrocytes (Broer and Brookes, 2001). The absolute level of interstitial Gln at any given time is therefore a consequence of the rate of astrocytic production, the rate of astrocytic release and the rate of neuron uptake during the preceding period. Transiently reduced Gln production associated with energy perturbation could consequently have been missed in the gross correlation analysis where the majority of the 3703 samples represented normal L/P ratios with low Glt levels indicating an efficient astrocytic Glt uptake. We therefore specifically identified ‘energy crisis’ periods with L/P > 40 and determined whether interstitial Gln and Glt increased or decreased during these periods as compared with the preceding baseline concentration. In 13 out of 13 periods where the L/P ratio exceeded 40, we observed a coincident increase in interstitial Glt. During overt ischemic conditions, it has been shown that extracellular Glt accumulation mainly derive from reversed astrocytic Glt transport owing to failing astrocytic membrane potentials (Seki et al, 1999; Szatkowski et al, 1990). If Glt leave the astrocytes, intracellular Glt concentration will fall and there will be less substrate for Gln-synthetase. A decreased Gln synthesis would presumably be reflected in the interstitial space as Gln normally leaves the astrocytes by diffusion. When analyzing the Gln concentration curve during the 13 periods of energy perturbation, no definitive pattern however emerged; interstitial Gln concentration increased in some cases and decreased in some cases. However, when pyruvate was considered it became possible to predict whether Gln and the Gln/Glt ratio would increase or decrease during the high L/P period. The relationship between interstitial Gln and pyruvate, present in the entire material (Figure 2A) as well as in the subgroup of high L/P samples (Figure 5), is a novel observation that may enhance the understanding of the Glt–Gln cycle energetics.
Brain ischemia normally involves low pyruvate and high lactate levels as ischemia is characterized by anaerobic glycolysis where neither the tricarboxylic acid cycle nor the nicotinamide adenine dinucleotide regeneration functions properly owing to lack of oxygen. We observed reduced interstitial Gln levels when the L/P ratio and Glt increased and pyruvate decreased, which support the notion of reduced Gln-synthetase activity owing to lack of substrate and/or energy during ischemic conditions. The observation that Gln production appeared to be reduced when interstitial pyruvate decreased might indicate that pyruvate per se better indicates failing astrocytic metabolism than does the L/P ratio.
Increasing interstitial concentrations of pyruvate and lactate after SAH has been interpreted as ‘hyperglycolysis’ and has been associated with good recovery (Cesarini et al, 2002). For every generated pyruvate molecule, at least one ATP has been produced from glycolysis and there is further potential of more ATPs from oxidative metabolism. Astrocytes with maintained pyruvate production would consequently have energy to spend on the highly prioritized Glt uptake. If the astrocytes have the capacity to become ‘hyperglycolytic’, they will not succumb when exposed to increasing interstitial Glt levels but may respond with an accelerated Glt uptake (Magistretti and Pellerin, 1999). This, in turn, will result in augmented substrate availability for Gln-synthetase followed by a higher rate of Gln diffusion out of the cell. This is in accordance with our observation that high interstitial pyruvate in times of high L/P and high Glt was associated with increasing interstitial Gln levels. Contrary to the case of ischemia, where failing astrocytic energy production results in astrocytic Glt leakage, high Glt levels during periods of hyperglycolysis presumably are caused by other mechanism than reversed astrocytic transport, for example neuronal transmission.
The Glt–Gln cycle is the major metabolic pathway of both Glt and Gln in the brain (Kanamori et al, 2002; Thanki et al, 1983). Other pathways however also exist, which may have influenced our results. In astrocytes, Glt can be oxidatively degraded instead of being amidated. Astrocytes can also synthesize Glt de novo by carboxylation of pyruvate, an anaplerosis estimated to account for 10 to 30% of the exported Gln (Hertz, 2006). In vitro, high extracellular Glt levels increase astrocytic Glt degradation and decrease pyruvate carboxylation (for references see Hertz, 2006). During enhanced glutamatergic activity, an increased total tissue content of both Glt and Gln has been reported in vivo, indicating that astrocytic de novo synthesis exceeds degradation during high Glt transmission (Hertz, 2004).
Data on normal human interstitial Gln levels are scarce. In pediatric traumatic brain injury patients (Richards et al, 2003) and in adult neurointensive care unit patients (Ronne Engstrom et al, 2005) where a set-up similar to ours were used, the highest MD-Gln level was 572 and 1,200 μmol/L, respectively. In animals, the reported basal Gln concentration range is between 150 and 1,000 μmol/L (Xu et al, 1998; Kanamori and Ross, 2004). High Gln levels has been considered neuroprotective (Suarez et al, 2002) and the Gln-synthetase expression can increase in response to injury and high Glt levels (Ramonet et al, 2004). Unlike most other amino acids, there is no steep concentration gradient for Gln across the blood–brain barrier (Xu et al, 1998) and Gln can traverse the blood–brain barrier in both directions. The Gln transport is, however, highly controlled and the localization of Gln-transporters at the endothelial–astrocyte interface is such that it favors out-flux from the brain (Hawkins et al, 2006). Ischemia has been associated with decreased blood to the brain Gln transport, suggested to be due to failing endothelial cell membrane potentials (Kawai et al, 1999). Decreased Gln influx in the globally compromised brain acutely after SAH may have contributed to the low Gln levels observed early after insertion of the MD probe in most of our patients (Figure 3). Published data from our group (Ronne Engstrom et al, 2005) and data from a work in progress, where plasma amino-acid levels were compared with MD measurements, indicate little correlation between plasma and brain interstitial alterations of Gln and Glt. In addition, decreased plasma and peripheral tissue Gln levels is associated with critical illness such as SAH (Suojaranta-Ylinen et al, 1996) but we observed increasing brain Gln levels in a majority of our patients. Thus, both experimental data as well as the histologic make-up of the blood–brain barrier indicate that interchange of amino acids between the interstitial room and blood is highly regulated. This argues against that the reported alterations in interstitial Glt and Gln have been significantly influenced by the systemic metabolism. We instead submit that the Gln increase over time in a majority of the patients in our study represents a hypermetabolism in astrocytes that have been subjected to stress, including high interstitial Glt levels. Noticeably, the highest Gln levels (> 2,500 μmol/L, Figure 4B, hour 133) in our material was not found in the metabolically most ‘normal’ brain but in a brain with signs of intense energy production as well as a high interstitial Glt load. This pattern presumably indicates a very high Glt–Gln cycle turnover.
In conclusion, this neurointensive care unit study where 3,703 MD samples from the cortex in SAH patients where analyzed showed that the brain interstitial Gln/Glt ratio correlates inversely to the L/P ratio, but this correlation is mainly due to a correlation between Glt and lactate. There was no correlation between interstitial Glt and Gln. There was a linear relationship between interstitial Gln and pyruvate. Analysis of periods with L/P ratios above 40 revealed that interstitial Gln levels decreased when there were high L/P ratios, low pyruvate levels, and high Glt levels interstitially. We submit that the Gln decrease is a consequence of astrocytic Glt release and decreased Glt–Gln cycle turnover owing to energy perturbation. Interstitial Gln increased during periods with high L/P, high Glt, and high/normal pyruvate levels. This pattern may represent a high Glt–Gln cycle turnover in astrocytes that are able to respond to increasing interstitial Glt levels by hyperglycolysis. Our findings suggest that L/P ratios above 40 cannot always be interpreted as energy failure and that the interstitial pyruvate levels may discriminate whether or not there is sufficient astrocytic capacity for Glt–Gln cycling. The clinical significance of high interstitial Gln/Glt ratios and high Glt–Gln cycle turnover in the recovering brain remains to be further explored.
Footnotes
Acknowledgements
We are grateful to Inger Ståhl-Myllyaho for her expertise work with the HPLC system and to the staff at the neurointensive care unit for care of the patients and collection of the MD samples.