
Abstract
We have evaluated the spatial relationship between clotted vasculature and the structural integrity of layer V cortical neurons in YFP (yellow fluorescent protein)-H transgenic mice 2 to 10 h after photothrombotic stroke. Fortuitously, ischemic zones could be finely mapped about dysmorphic YFP labeled axons and dendrites using histology since texas-red dextran used to assess blood flow in vivo was trapped within fixed clotted vessels. Ischemic damage to layer V neurons located at the border of ischemia was contained within apical tuft spiny dendritic structures and did not propagate to spines on the more proximal region of the apical dendrite. The lateral spread of dendritic damage decayed sharply with distance from the edge of ischemia (50% reduction in beaded dendrites within ~ 100 μm) and increased with time up to 6 h after stroke but not thereafter. Axonal damage also increased with time but extended further laterally than dendritic damage, up to 500 μm from the stroke core. Apoptotic and necrotic cell death cascades were activated 6 h after stroke; however, only within 300 μm of the ischemic core. These data suggest that the axonal and dendritic circuitry of neurons located 300 μm outside of an ischemic zone can be relatively free of damage or commitment to cell death suggesting that they may be in an ideal position to contribute to functional recovery. Given that ischemic damage may have a larger effect on circuitry involving superficial dendrites and projecting axons, it is conceivable that surviving peri-infarct neurons may have unique structural and functional properties.
Introduction
Focal stroke is characterized by an ischemic core surrounded by a severely hypoperfused penumbra (Hossmann, 1994). Tissue at the core of a stroke is generally considered to be irreversibly damaged; however, penumbral tissue may still be viable as here, only a fraction of cells are lost (Kato and Kogure, 1999). The evolution of cell death in the ischemic penumbra is a highly dynamic process, with the incidence of dying cells increasing with time after infarction (Jones et al, 1981). Ultimately, whether a penumbral cell will survive depends on its proximity to the ischemic vasculature and the degree/duration of ischemia. Although survival of penumbral tissue has been previously evaluated, it is not known whether there is acute damage to the fine axonal and dendritic circuitry within this region in vivo and how this relates to ongoing apoptotic and necrotic cell death. Previously, using 2-photon in vivo imaging of layer V neurons in yellow fluorescent protein (YFP) expressing transgenic mice we have shown that severe cortical ischemia produced by local photothrombosis leads to a widespread loss of cortical tuft dendritic structure within minutes (Zhang et al, 2005a). Here, we wished to uncover whether this in vivo damage would propagate into the deeper dendritic and axonal compartments of these same neurons as well as what the spatial and temporal pattern of this ischemic damage would be. Examination of the integrity of tissue immediately adjacent to the infarct is important as this is where changes such as adaptive neuronal plasticity (Dancause et al, 2005) and circuit reorganization (Carmichael et al, 2001) that underlie functional recovery are thought to occur. By defining the extent and time course of axonal and dendritic ischemic damage within the penumbra, we wish to establish how much of the peri-infarct circuitry is salvageable and thus may contribute to recovery acutely after stroke. Using texas red (TR) dextran caught within fixed ischemic vessels as a means of identifying ischemic zones (Schaffer et al, 2006), we have finely mapped the spatial relationship between clotted vessels and damage to the axonal and dendritic circuitry of YFP expressing layer V pyramidal neurons. We report that peri-infarct tissues 300 μm outside of an ischemic zone can be relatively free of dendritic damage and nuclear abnormalities suggesting that they may be in an ideal position to contribute to recovery of function after stroke.
Materials and methods
Animals
Adult, C57BL/6 YFP expressing transgenic mice (H-line; Feng et al, 2000) aged 3 to 5 months and between 25 and 32 g were used for all experiments. Protocols were approved by the University of British Columbia Animal Care Committee and are consistent with Canadian Council for Animal Care guidelines.
Stroke Models
For the majority of experiments we used the rose bengal (RB) cortical photothrombosis model of stroke. Before induction of stroke, animals were prepared for in vivo 2-photon imaging as in Zhang et al (2005a). Animals were anesthetized with an intraperitoneal (i.p.) injection of urethane (0.12% w/w, supplemented at 0.02% w/w as needed) and supplemented with 2 mmol/L glucose in phosphate-buffered saline (PBS) (0.2 to 0.3 ml, i.p., every 1 h). Body temperature was monitored with a rectal temperature probe and maintained at 37°C using a heating pad and feedback regulation from the probe. A 2 × 2 mm2 cranial window was made over the somatosensory cortex at coordinates of -0.8 mm dorsal and 2.0 mm lateral from bregma, leaving the dura intact. To induce stroke, RB (0.03 mg/g mouse, diluted to 10 mg/ml in PBS) was injected into the mouse via the tail vein using a 28½; gauge needle after warming the tail. Photoactivation of the dye was then achieved by focusing green light (535 ± 25 nm; ~ 3 mW) from an HBO 100 W arc lamp on the brain surface for 1 to 2 mins through a × 10, 0.3 numerical aperture objective. In some cases, a craniotomy was not used and animals were also not imaged using the 2-photon microscope. In these animals, the skull overlying the RB photoactivation area was thinned using a dental drill and photoactivation was performed through the thinned bone. Control animals were those that received a sham stroke, which consisted of the same craniotomy procedure (in the same location as stroke animals) and laser exposure (1 to 2 mins) without injection of RB dye. In every case the area of light reaching the exposed cortex was limited by the field aperture to ~ 0.5 mm2. This relatively large area of photoactivation was to ensure a high degree of local clotting, reducing the possibility for collateral paths of blood flow (Schaffer et al, 2006). In all experiments, the area and depth of ischemic vessels was greater than the expected area (~ 0.5 mm2) because of diffusion of clots or clot-inducing factors, or the ability of out of focus light to activate RB. Both the thin skull and craniotomy preparations produced lesions of similar size. In a previous study (Zhang et al, 2005a), we found that in a subset of animals where blood flow was monitored with fluorescein isothiocyanate -dextran, nearly complete reperfusion and accompanying restoration of damaged dendrites could be observed. In the current study, all animals that underwent RB stroke showed stable clots (little reperfusion) allowing us to better track areas of ischemia in fixed preparations.
For the middle cerebral artery occlusion (MCAO) model of stroke ischemia—reperfusion was induced using a modified version of the intraluminal suture method as described previously in rats (Longa et al, 1989). Briefly, anesthesia was induced with urethane (0.12% w/w) and body temperature was maintained at 37°C ± 0.5°C using a heating pad and feedback regulation from a rectal temperature probe. Animals were placed in a supine position and an incision was made along the midline of the ventral side of the neck. First, a 5-0 silk suture (Ethicon, Markham, ON, Canada) was used to block the common carotid artery on the side of the middle cerebral artery (MCA) to be occluded. Then, two sutures were placed around the external carotid artery and a heat coagulator was used to cauterize the external carotid artery between them. This allowed for the external carotid artery to be more accessible during insertion of the suture. After blocking the internal carotid artery with a micro-aneurysm clip (Harvard Apparatus, Holliston, MA, USA), a small hole was cut in the external carotid artery where a 5-0 poly-
In Vivo 2-Photon Imaging
Mice were maintained under urethane anesthesia for the entire imaging session. Animals were fitted into a custom-made 2-photon microscope as previously described (Kleinfeld et al, 1998; Zhang et al, 2005a). For in vivo time-lapse imaging of dendritic structure, multiple Z-series were taken at the indicated time intervals over 5 h. The imaged dendrites were typically within 100 μm of the pial surface and therefore in layer I. Stroke was confirmed by in vivo 2-photon imaging of blood flow as previously described (Zhang et al, 2005a).
Confocal Microscopy on Fixed Coronal Sections
At 2, 6, or 10 h after induction of stroke or sham surgery, animals were overdosed with sodium pentobarbital and then transcardially perfused with PBS followed by 4% paraformaldehyde in PBS. Sections (100 μm) were cut coronally on a vibratome. Those sections that contained the sham or photoactivated area were then used for imaging on a Zeiss LSM 510 confocal microscope. Emission filters were set to 530 to 560 nm for the YFP signal and 595 to 650 nm for TR-dextran. To examine fine dendritic structure, two-channel, high-resolution (1024 × 1024, 0.143 μm pixels) z-stacks (1 μm) were taken with a × 63, 1.2 numerical aperture water immersion lens.
Staining and Immunohistochemistry
All staining and immunohistochemistry was performed on floating, 100-μm-thick coronal sections of YFP expressing transgenic mice. Propidium iodide (PI; 10 μmol/L; Sigma, St Louis, MO, USA) was diluted in 0.3% Triton X-100 in PBS and incubated at room temperature for 1 h. Sections were rinsed 3 × for 10 mins in PBS before mounting. Anti-m3D175 antiserum against the cleavage site of caspase-3 (a generous gift of Dr T Momoi) was diluted in 1:1000 in Ab buffer (3% bovine serum albumin and 0.3% Triton X-100 in PBS) and incubated overnight at 4°C. For detection of calpain activation, we used antiserum against the 136 kf N-terminal fragment of α-spectrin (a generous gift of Dr T Saido; 1:500). Sections were incubated at 80°C for 30 mins in 10 mmol/L sodium citrate (pH 8.5) and then rinsed for 5 mins in PBS before anti-136 kf Ab incubation, also overnight at 4°C. All sections were rinsed 3 × for 5 mins in PBS after primary Ab incubation and then incubated with a goat anti-rabbit immunoglobulin M Alexa 546-conjugated secondary antibody (Molecular Probes, Eugene, OR, USA) for 1 h at room temperature. Sections were rinsed 3 × for 10 mins in PBS before mounting.
Image Analysis
Image analysis was performed using NIH ImageJ software.
Spatial Spread of Ischemic Damage to Dendrites
For the analysis of the spatial spread of ischemic damage to dendrites, a grid with tiles measuring 100 × 100 μm was placed over 20 × tiled images of the ischemic hemisphere. The ischemic interface (border between ischemic and non-ischemic tissue) was defined as the vertical interface where 10% or less of total vessels spanning cortical layers I to V were ischemic (those vessels with TR-dextran caught within them) and was demarcated with a line. Each dendrite was then scored as being beaded or normal. A beaded dendrite was defined as an apical dendritic shaft with two or more periodic dendritic constrictions resembling beads on a string. Dendritic beading was counted laterally across the cortex in 100 μm bins, beginning at the ischemic interface and ending 500 μm away. This analysis was performed between 50 and 100 μm below the surface of the cortex. An average was taken from three coronal sections per animal, in different animals studied at three time points: 2, 6, and 10 h after stroke.
Spatial Spread of Ischemic Damage to Axons
For analysis of the spatial spread of axonal damage to layer V neurons a rating scale was devised as follows: 0 = no axonal damage (all axons intact), 1 = minor damage (~25% of axons beaded), 2 = moderate damage (~ 50% of axons beaded), and 3 = severe damage (~ 75% of axons beaded or complete loss of axonal integrity) (see Supplementary Figure 1). A grid with tiles measuring 100 × 100 μm was placed over 20 × tiled images of the ischemic hemisphere and the edge of the stroke core was demarked with a line. A number (0 to 3) was then assigned to each tile of axons starting 100 μm from the ischemic interface within the stroke core and extending 800 μm laterally throughout the axons of layer V neurons. An average was taken from three coronal sections per animal at three different time points: 2, 6, and 10 h after stroke.
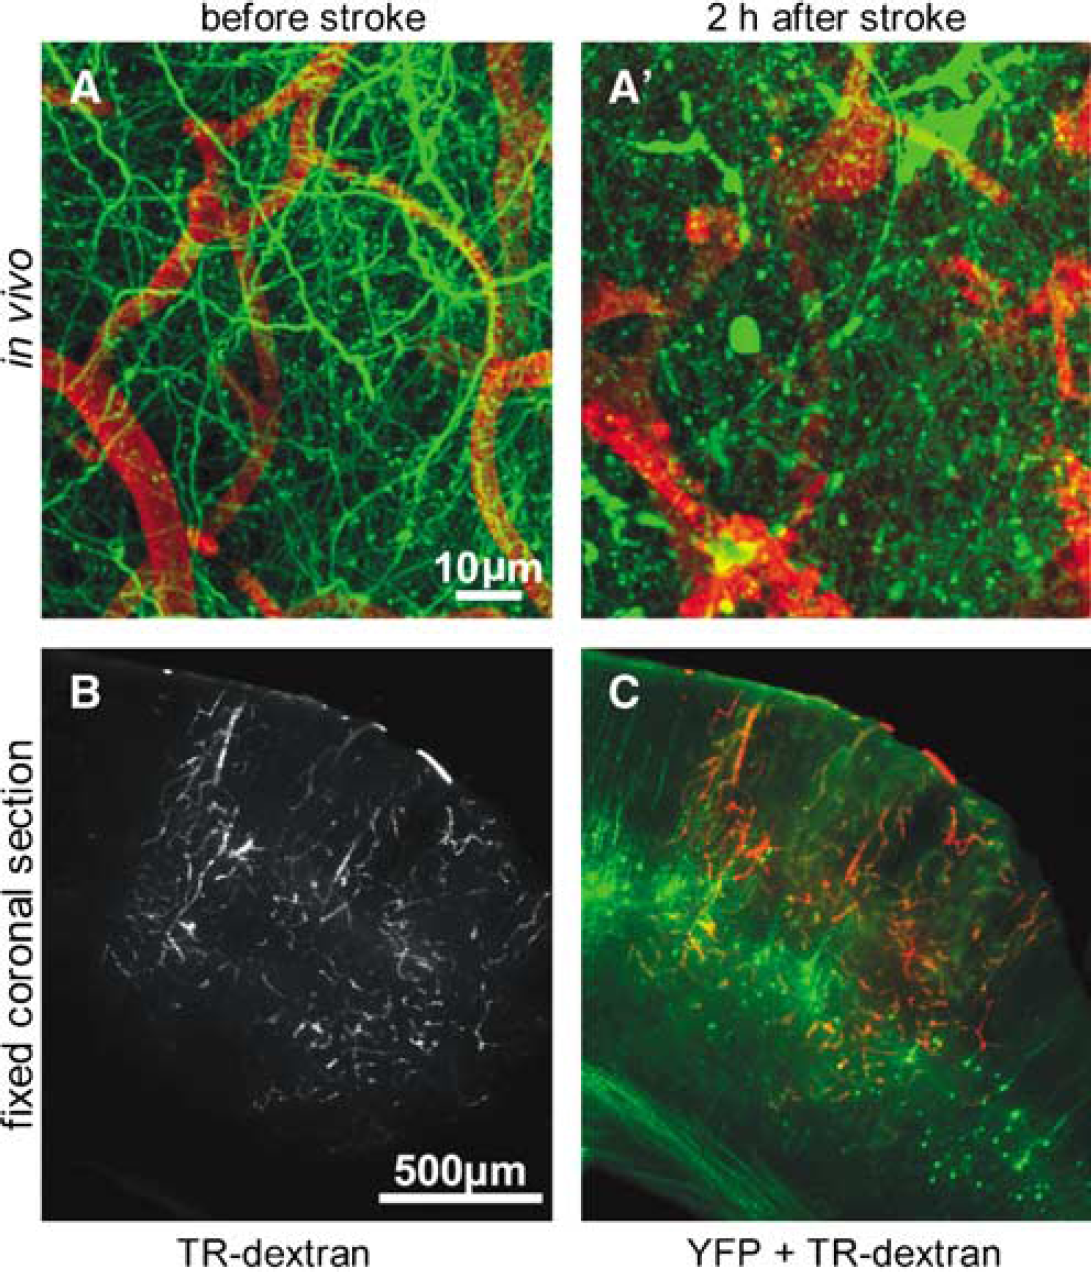
A model for examining the spatial relationship between clotted vessels and ischemic damage to layer V neurons. (
Statistical Analysis
All data are shown as mean ± s.e.m. Statistical analyses were performed using unpaired, two-tailed Student's t-test, one-way ANOVA or two-way ANOVA with Bonferroni's post hoc test where appropriate. Analysis of rating scores was performed with a non-parametric Mann—Whitney U-test or Kruskal—Wallis test. GraphPad Prism (version 4.0; GraphPad Software, San Diego, CA, USA). *P < 0.05, **P < 0.01, and ***P < 0.001.
Results
A Model for Examining the Spatial Relationship between Clotted Vessels and Ischemic Damage to Layer V Neurons
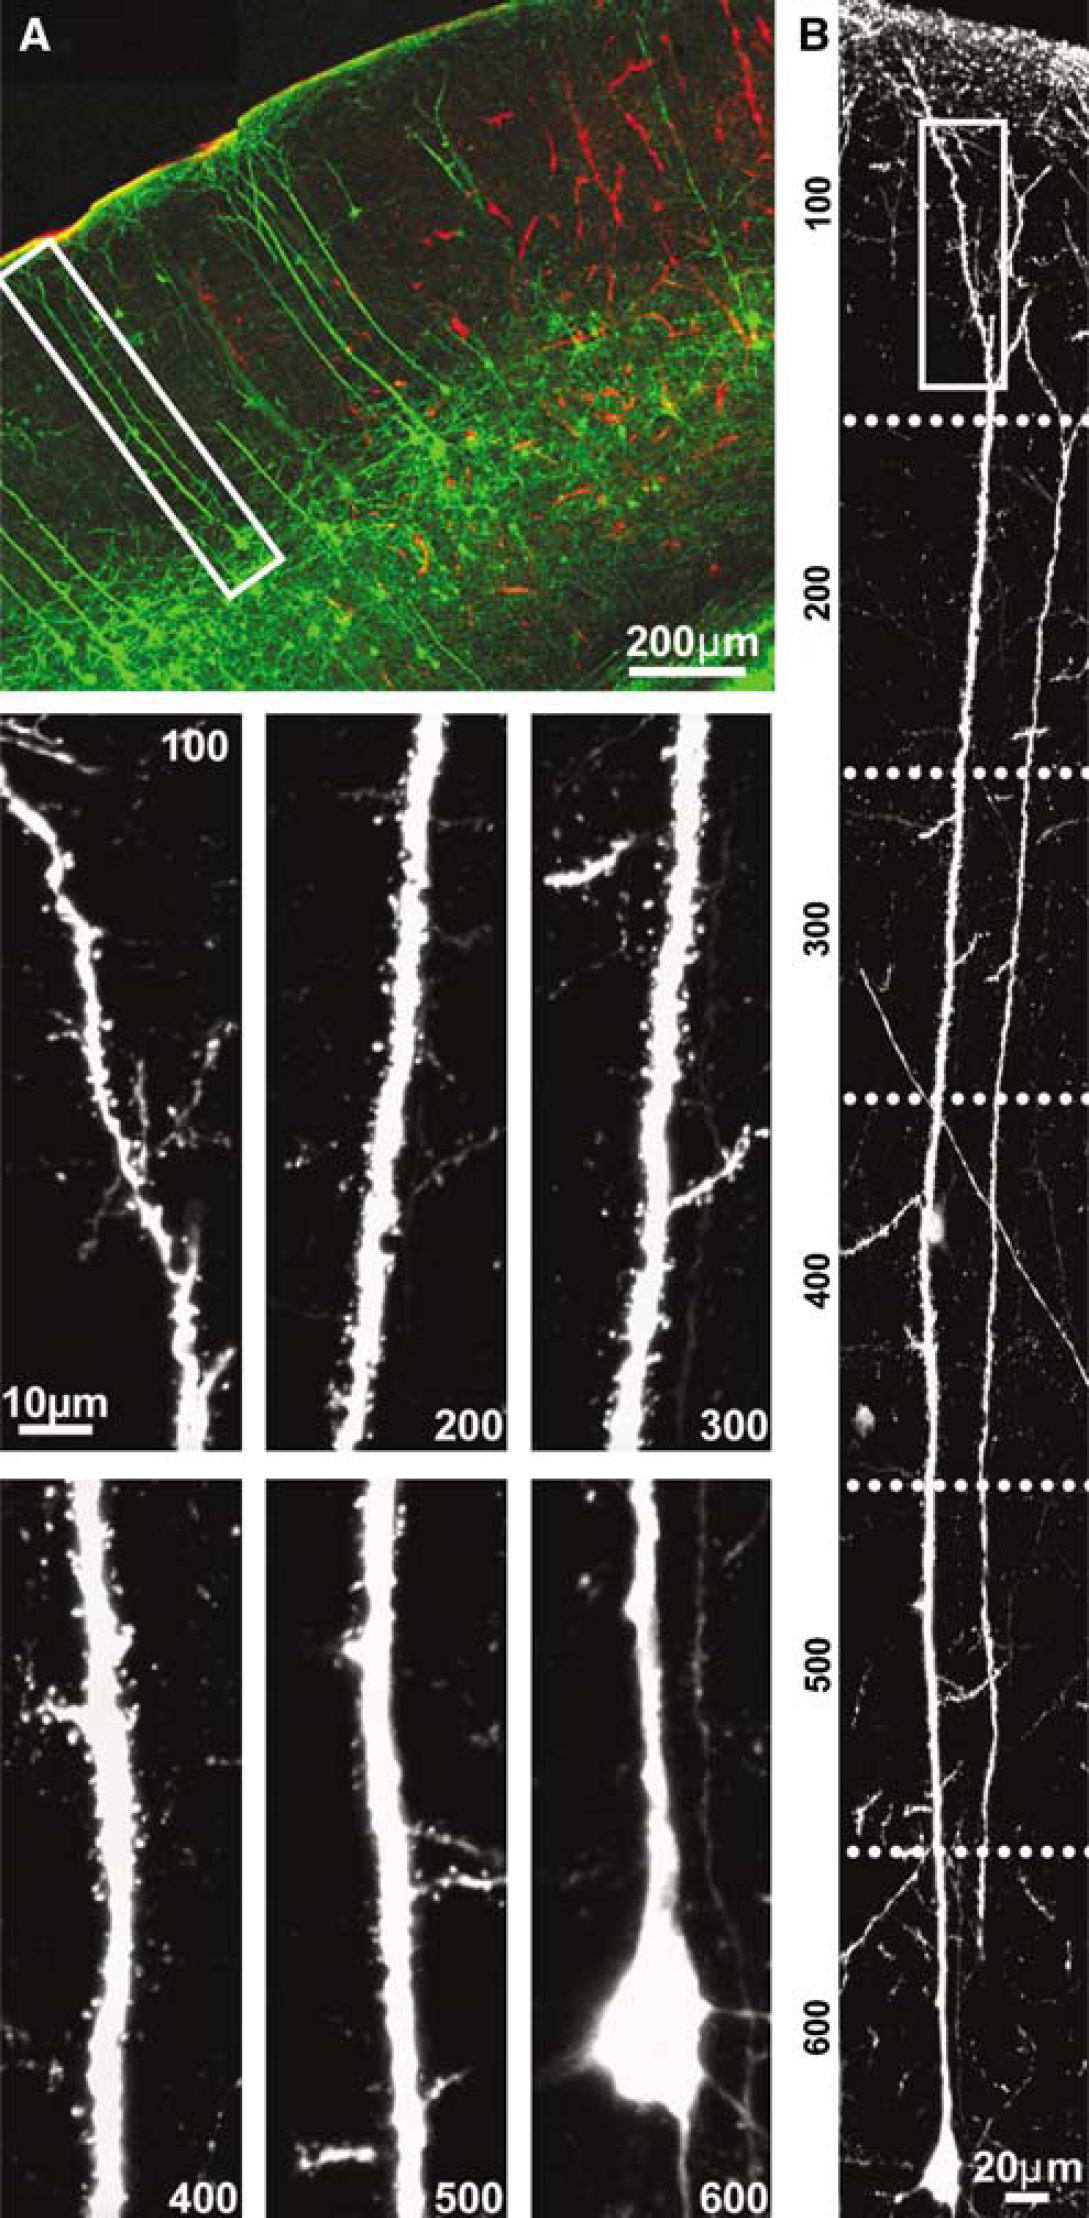
Using RB-induced photothrombosis (Watson et al, 1985) we were able to produce stable clots in YFP expressing transgenic mice, which were readily observed in vivo and lasted for up to 10 h as confirmed by subsequent histology. 2-photon imaging revealed that clots were associated with the deterioration of apical tuft dendritic structure 2 h after stroke (Figure 1A and Figure 1A′). Coronal sections of fixed tissue obtained from animals perfused after in vivo imaging sessions revealed trapping of TR-dextran within the ischemic vessels (Figure 1B). In each experiment RB-induced clots spanned all cortical layers and generally extended to the subcortical white matter found at depths of ~900 μm. The lateral spread of clots throughout the sensorimotor cortex was on average 891 ± 181 μm (n = 2) at 2 h, 1017 ± 73 μm (n = 3) at 6 h, and 1987 ± 207 μm (n = 3) at 10 h after stroke. Clots ended abruptly with a relatively sharp border at all time points (data not shown). The origin of the sharp ischemic borders was unknown but may be attributed to separate cortical zones defined by penetrating surface arteries or tissue-derived factors that actively regulate the extent of RB-induced clotting. Using the trapped TR-dextran as a map of the ischemic zone, we could assess the spatial relationship between morphologic damage to layer V cortical neurons and RB-induced clots throughout all layers of the cortex (Figure 1C). Note that within the somatosensory cortex of this line of mice most YFP expression occurs within layer V neurons, making it convenient to monitor the morphology of these cells but impossible to comment on the fate of principal neurons in other layers or interneurons.
Laminar Distribution of Ischemic Damage to Dendrites
Given the restricted nature of RB-induced clots we were able to examine the spatial relationship between vascular clotting and neuronal damage. We found that regions with high densities of clots at the core of photoactivation showed nearly a complete loss of layer V neuron dendritic structure and YFP fluorescence whereas damage to neurons located near the margins of the stroke seemed to be localized to the dendritic tuft. To verify this apparent laminar distribution of ischemic damage to dendrites, we reconstructed the entire dendritic structure from the pial surface to the cell body with 0.143 μm/pixel confocal imaging. Specifically, we addressed whether damage to dendritic tufts would lead to propagating damage throughout other compartments of the same neuron. In three animals killed 6 h after stroke, we examined nine different cells near the ischemic interface (defined as the border where clotted vessels end) and observed the same laminar distribution of ischemic damage in each case. We observed intense blebbing within the dendritic tuft and a complete loss of dendritic spines in this region (Figure 2A, panel 100). Moving down the dendritic tree, the remaining portion of the apical dendrite extending 200 to 500 μm below the surface of the cortex appeared to be intact as indicated by the presence of spines within these regions (Figure 2A, panels 200 to 500). The most proximal region of the apical dendrite as it extended from the cell body also appeared intact although, here, spines were difficult to resolve (Figure 2A, panel 600). Since this was also observed in images of control dendrites on the opposite non-ischemic hemisphere (data not shown), this may be related to out of focus fluorescence from the large proximal dendrite. We also tried to assess the structure of basal and oblique dendrites but found that the high density of axons and other processes within these regions obscured the identification of individual spines. Another issue with basal and oblique dendrites was that they could project laterally from ischemic areas into the penumbra and were difficult to trace back to a particular cell. We were therefore limited to analyzing large apical dendrites and their tuft extensions.
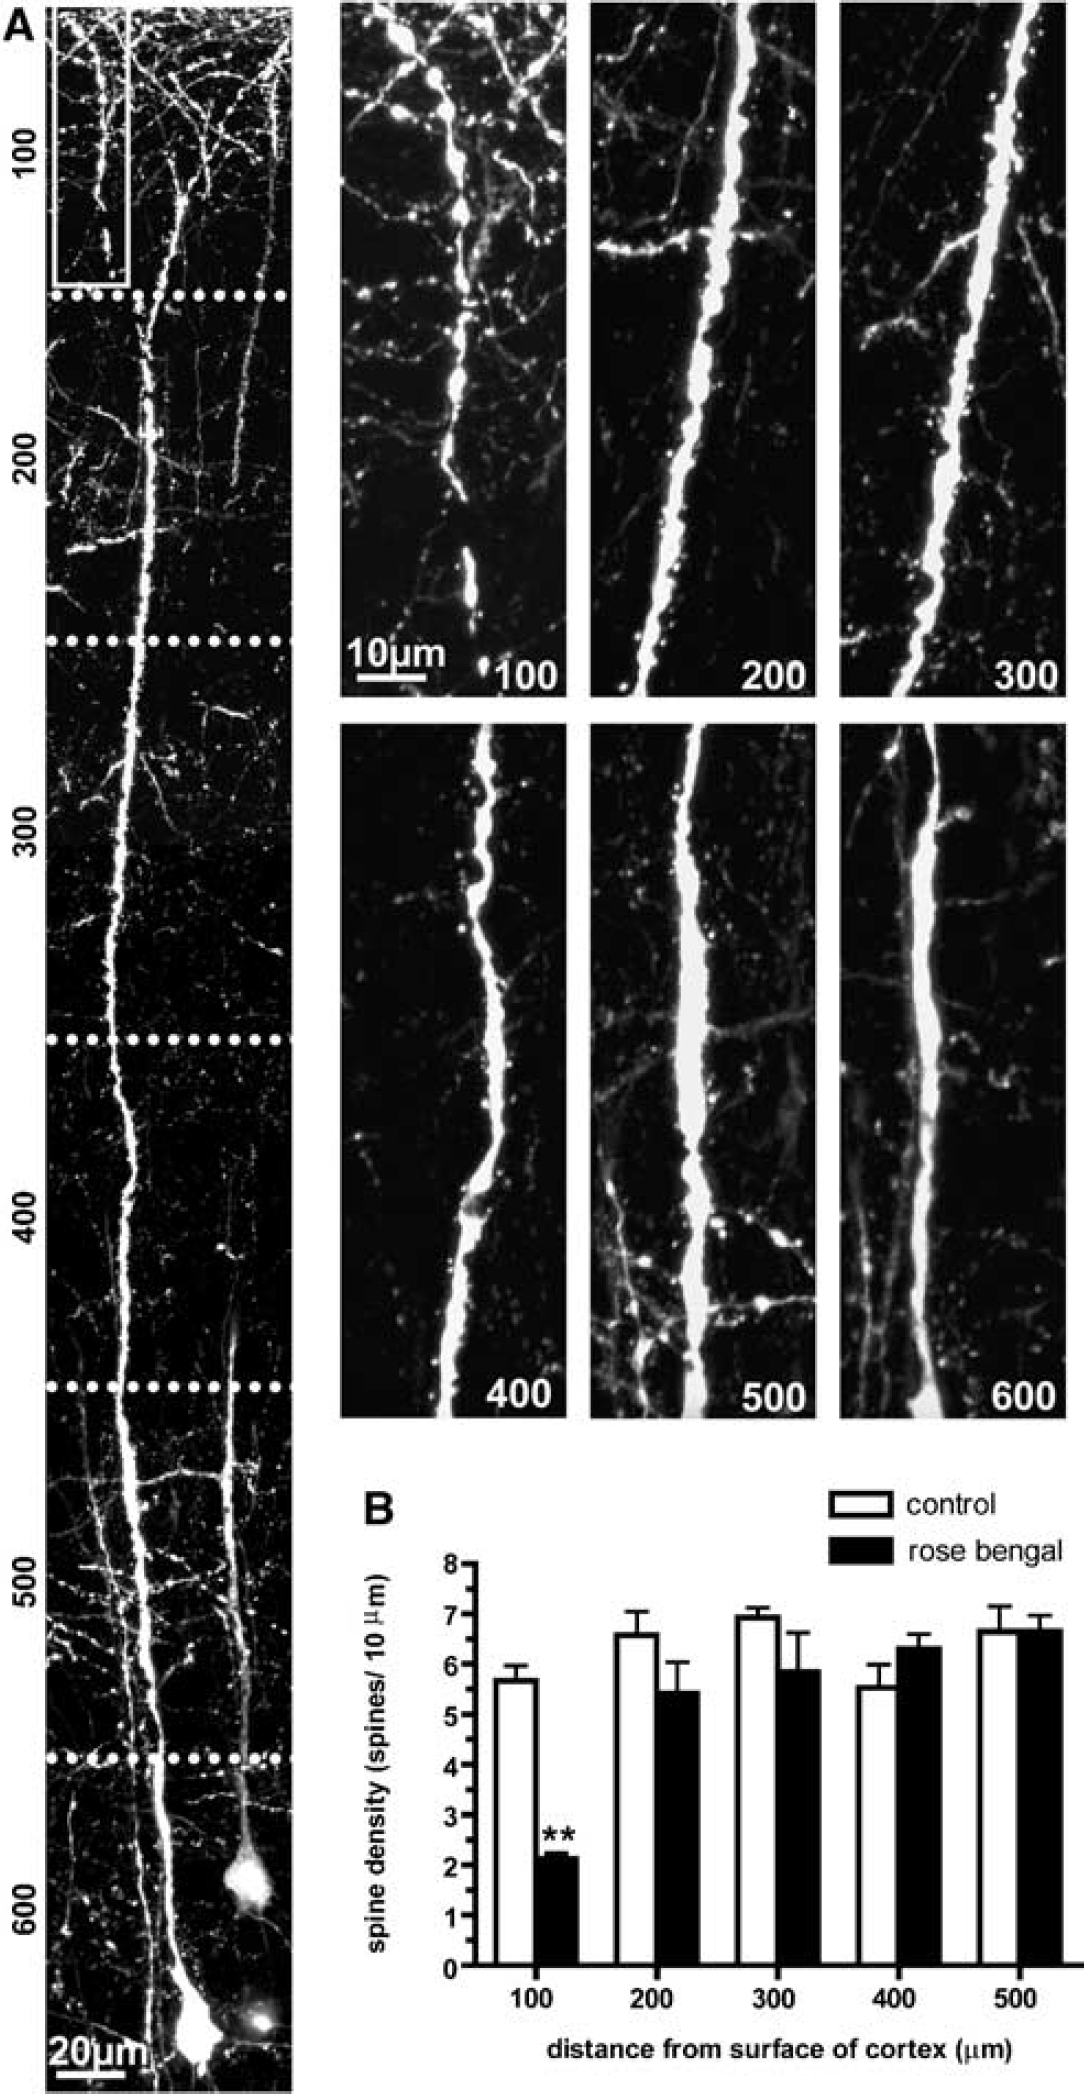
Neurons located at the ischemic border of photothrombotic stroke show a laminar distribution of ischemic dendritic damage. (
To quantify the apparent laminar distribution of ischemic damage to dendrites of layer V neurons, we performed an analysis where we measured the spine density in 100 μm segment bins along the entire apical dendrite, beginning with the dendritic tuft at the pial surface and extending 600 μm deep into the cortex ending at the level of the cell body. This analysis revealed that the dendritic spine density varied significantly with depth into the cortex when RB stroke animals were compared with sham stroke control animals (F4,14 = 5.11, P < 0.01; two-way ANOVA; Figure 2B). More specifically, in RB stroke animals, the dendritic tuft spine density (within the first 100 μm from the surface of the cortex) was significantly reduced (2.12 ± 0.11 spines/10 μm, n = 3 animals) when compared with control values (5.67 ± 0.24 spines/10 μm, n = 3 animals; P < 0.01, ANOVA with Bonferroni's post hoc test); however, the spine density throughout the rest of the length of the apical dendrite (from 200 to 500 μm from the surface of the cortex) was not significantly different from control values. We did not measure the spine density at the 600 μm depth as the poor resolution of spines in this region (because of out of focus fluorescence from the very large apical dendrite) would have confounded our analysis. Based on our analysis of spine density throughout the length of layer V neuron apical dendrites, we suggest that in neurons bordering a region of ischemia it is possible for dendritic structures located in deeper cortical layers to escape ischemic damage even when the more superficial dendritic regions have been compromised.
One potential concern with the RB stroke model is that ischemia may be more intense within surface vessels since the photoactivation is strongest here. Interestingly, our results argue against this and show that clots are present even 1 mm below the cortical surface. This indicates that surface photoactivation spreads clotting to deeper layers and thus dendrites in deeper layers are still ischemic, but apparently less susceptible to structural damage. To further address this point we have used a second model of stroke, the MCAO model, which does not use photoactivation and produces ischemia throughout all cortical layers as well as in the striatum (Carmichael, 2005). A total of three YFP expressing mice underwent this procedure and examination of layer V neurons in these animals revealed a profound pattern of laminar ischemic damage in each case. As shown in Figure 3A, there was severe blebbing beginning within the dendritic tufts (panel 100) and extending 200 μm below the cortical surface (panel 200); however, the more proximal regions of the apical dendrites appeared to be intact (panels 300, 400, 500, and 600). Importantly, all three animals also exhibited signs of subcortical striatal damage suggesting that all cortical layers were ischemic. Analysis of dendritic spine density throughout the entire length of layer V neurons in MCAO stroke animals revealed similar results as in the RB stroke model; spine density varied significantly with distance from the surface of the cortex when MCAO stroke animals were compared with sham stroke controls (F4,15 = 9.75, P < 0.001; two-way ANOVA; Figure 3B). Middle cerebral artery occlusion stroke dendritic spine density at the surface of the cortex (100 μm: 0.99 ± 0.10 spines/10 μm, n = 3 animals) as well as between 100 and 200 μm deep into the cortex (200 μm: 3.28 ± 0.33 spines/10 μm, n = 3 animals) was significantly reduced compared with control values at 100 μm (5.67 ± 0.25 spines/10 μm; n = 3 animals; P < 0.001; ANOVA with Bonferroni's post hoc test) and 200 μm (6.07 ± 0.02 spines/10 μm, n = 3 animals; P < 0.01; ANOVA with Bonferroni's post hoc test). Spine density at 300, 400, and 500 μm did not differ significantly between MCAO stroke and control animals (P > 0.05; ANOVA with Bonferroni's post hoc test). Thus, in contrast to the RB stroke model, dendritic damage in the MCAO stroke model seemed to propagate slightly deeper (by 100 μm) into the cortex. The observation that a similar pattern of ischemic damage to dendrites of layer V neurons was found in two separate models of stroke strengthens the validity of our findings and suggests that dendritic tufts are the dendritic region most vulnerable to ischemic damage. Although the MCAO stroke model was perhaps more physiologically relevant, it was extremely difficult to perform in mice and only variable levels of reperfusion were produced. We also found that the MCAO model did not result in significant trapped TR-dextran since a small degree of blood flow returned on suture removal permitting the TR-dextran to be washed out during perfusion. Given the advantages of the RB model such as localized clotting and trapping of TR-dextran to map ischemic zones we continued to use it for all subsequent analysis.
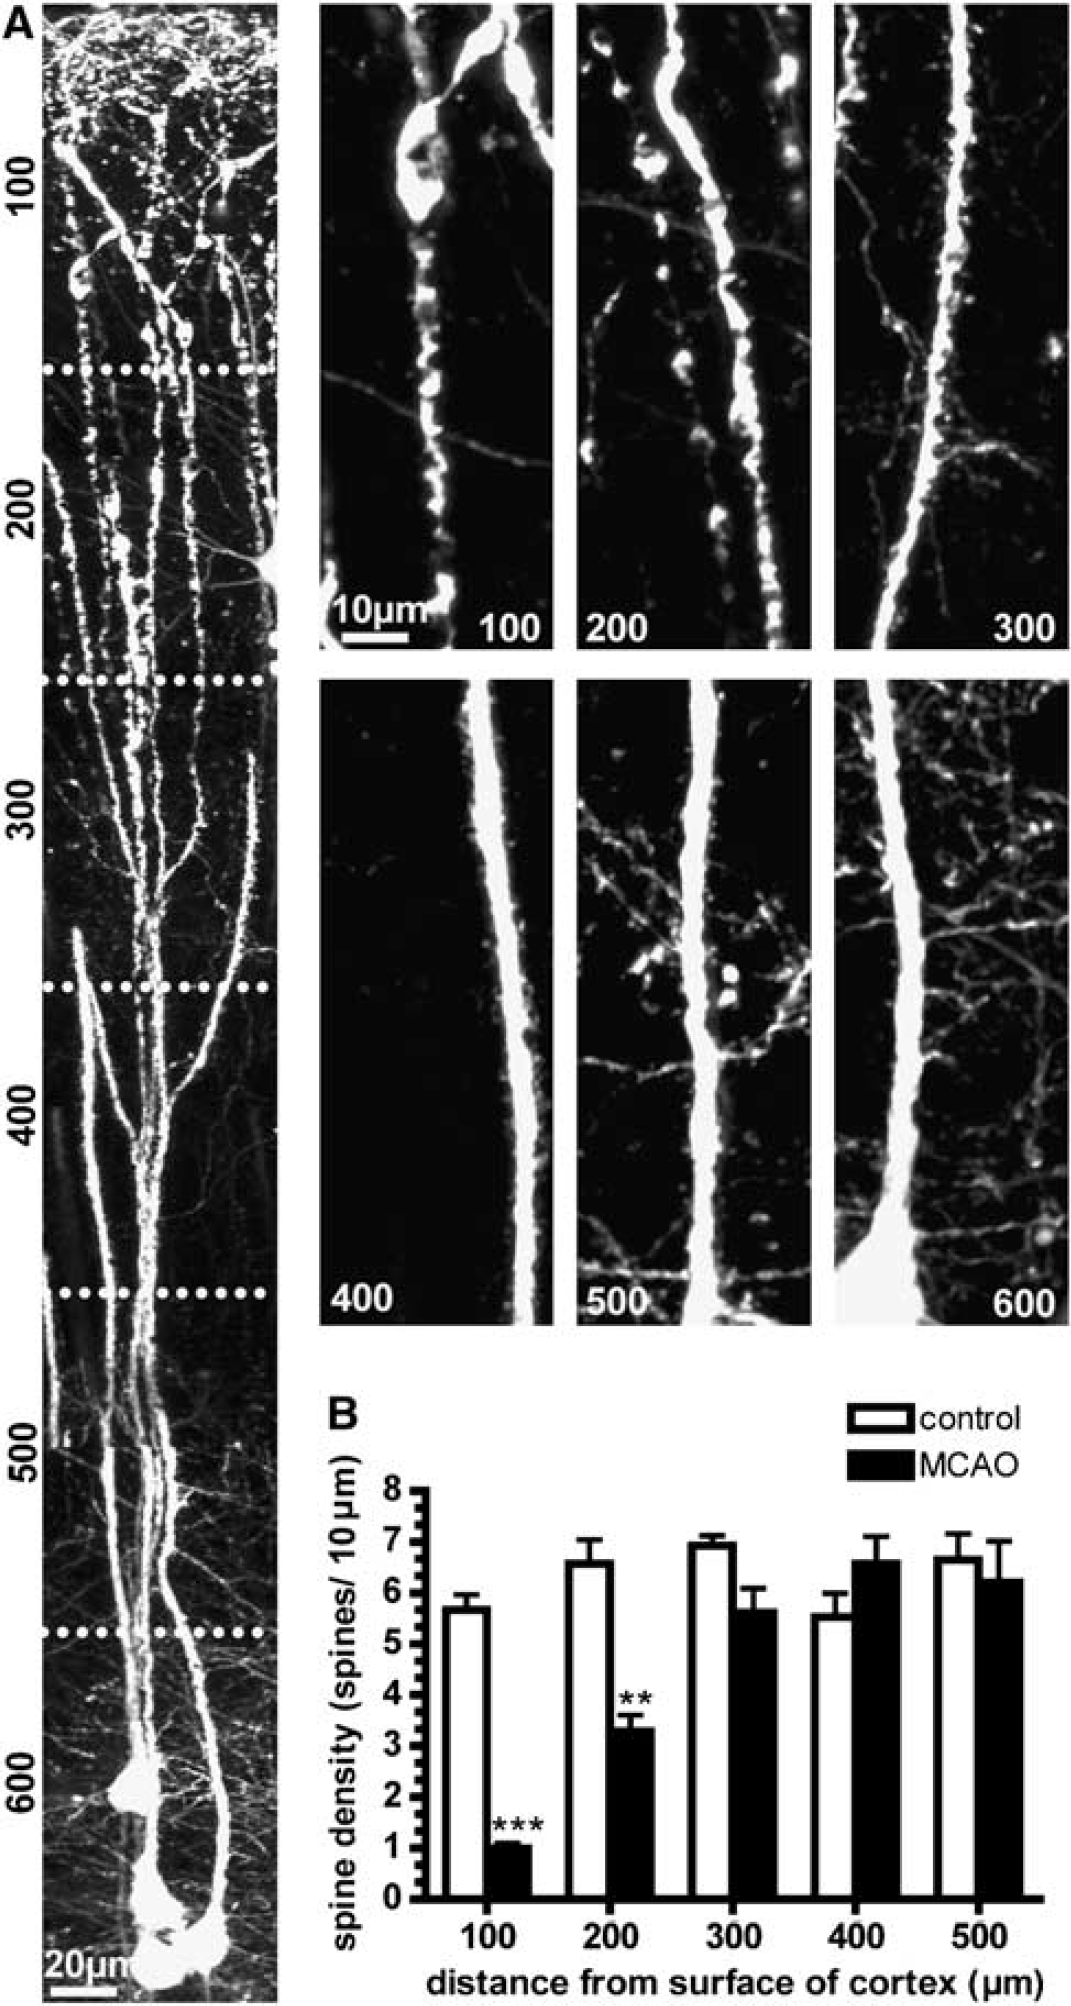
Middle cerebral artery occlusion stroke produces a laminar distribution of ischemic dendritic damage in layer V neurons. (
Spatial Distribution of Ischemic Damage to Dendrites
We wished to determine the extent of ischemic damage to dendrites beyond the stroke core as well as the time course of this damage to establish how much of peri-infarct circuitry is potentially salvageable and thus may contribute to recovery acutely after stroke. Using trapped TR-dextran labeled fluorescent clots as a means of identifying ischemic zones, we determined how far laterally dendritic damage would spread throughout the cortex from areas with clotted blood vessels at 2, 6, and 10 h after stroke. First, we performed a low-resolution analysis by scoring dendrites as being beaded or intact. A beaded dendrite was defined as an apical dendritic shaft with two or more periodic dendritic constrictions resembling beads on a string. No beaded dendrites were found at any time point within the nonischemic hemisphere or within sham stroke control animals (n = 4, subjected to 6 h of imaging) (Figure 4A) and all dendrites located within the ischemic core were found to be beaded at 2 h (Figure 4B), 6 h (Figure 4C), and 10 h (Figure 4D) after RB stroke. To determine if dendritic damage changed as a function of time and distance from the infarct, we performed a two-way ANOVA with time and distance as factors. Our analysis revealed that there was a significant effect of distance (F5, 30 = 49.33, P < 0.001) as well as time after stroke (F2, 30 = 12.93, P < 0.001) on the extent of beaded dendrites; however, no significant interaction was observed between these two variables (F10, 30 = 0.87, P = 0.57) (Figure 4E). For each time point we pooled data at all distances together and found that dendritic damage increased significantly from 2 h (10.0% ± 1.7%, n = 2) to 6 h (37.3% ± 6.2%, n = 3) (n = 3.39, P < 0.05; unpaired t-test), but did not increase further at 10 h after stroke (42.4% ± 5.9%, n = 3) (P = 0.59; unpaired t-test) (Figure 4F). For each distance we pooled data at all time points after stroke together and found that dendritic damage decreased with distance from the ischemic interface (Figure 4G). Specifically, there was nearly a 50% decrease in the number of beaded dendrites between 0 μm (100% ± 0%, n = 8) and 100 μm (54.4% ± 6.5%, n = 8) away from the ischemic interface. There was also a significant decrease in the number of beaded dendrites between 100 μm (54.4% ± 6.5%, n = 8) and 200 μm (35.6% ± 6.8%, n = 8) away from the ischemic interface (t = 2.5, P < 0.05; unpaired t-test). This analysis indicates that the incidence of beaded and hence damaged dendrites falls sharply with increasing distance from the ischemic interface and increases with time after stroke, up to 6 h but not thereafter.
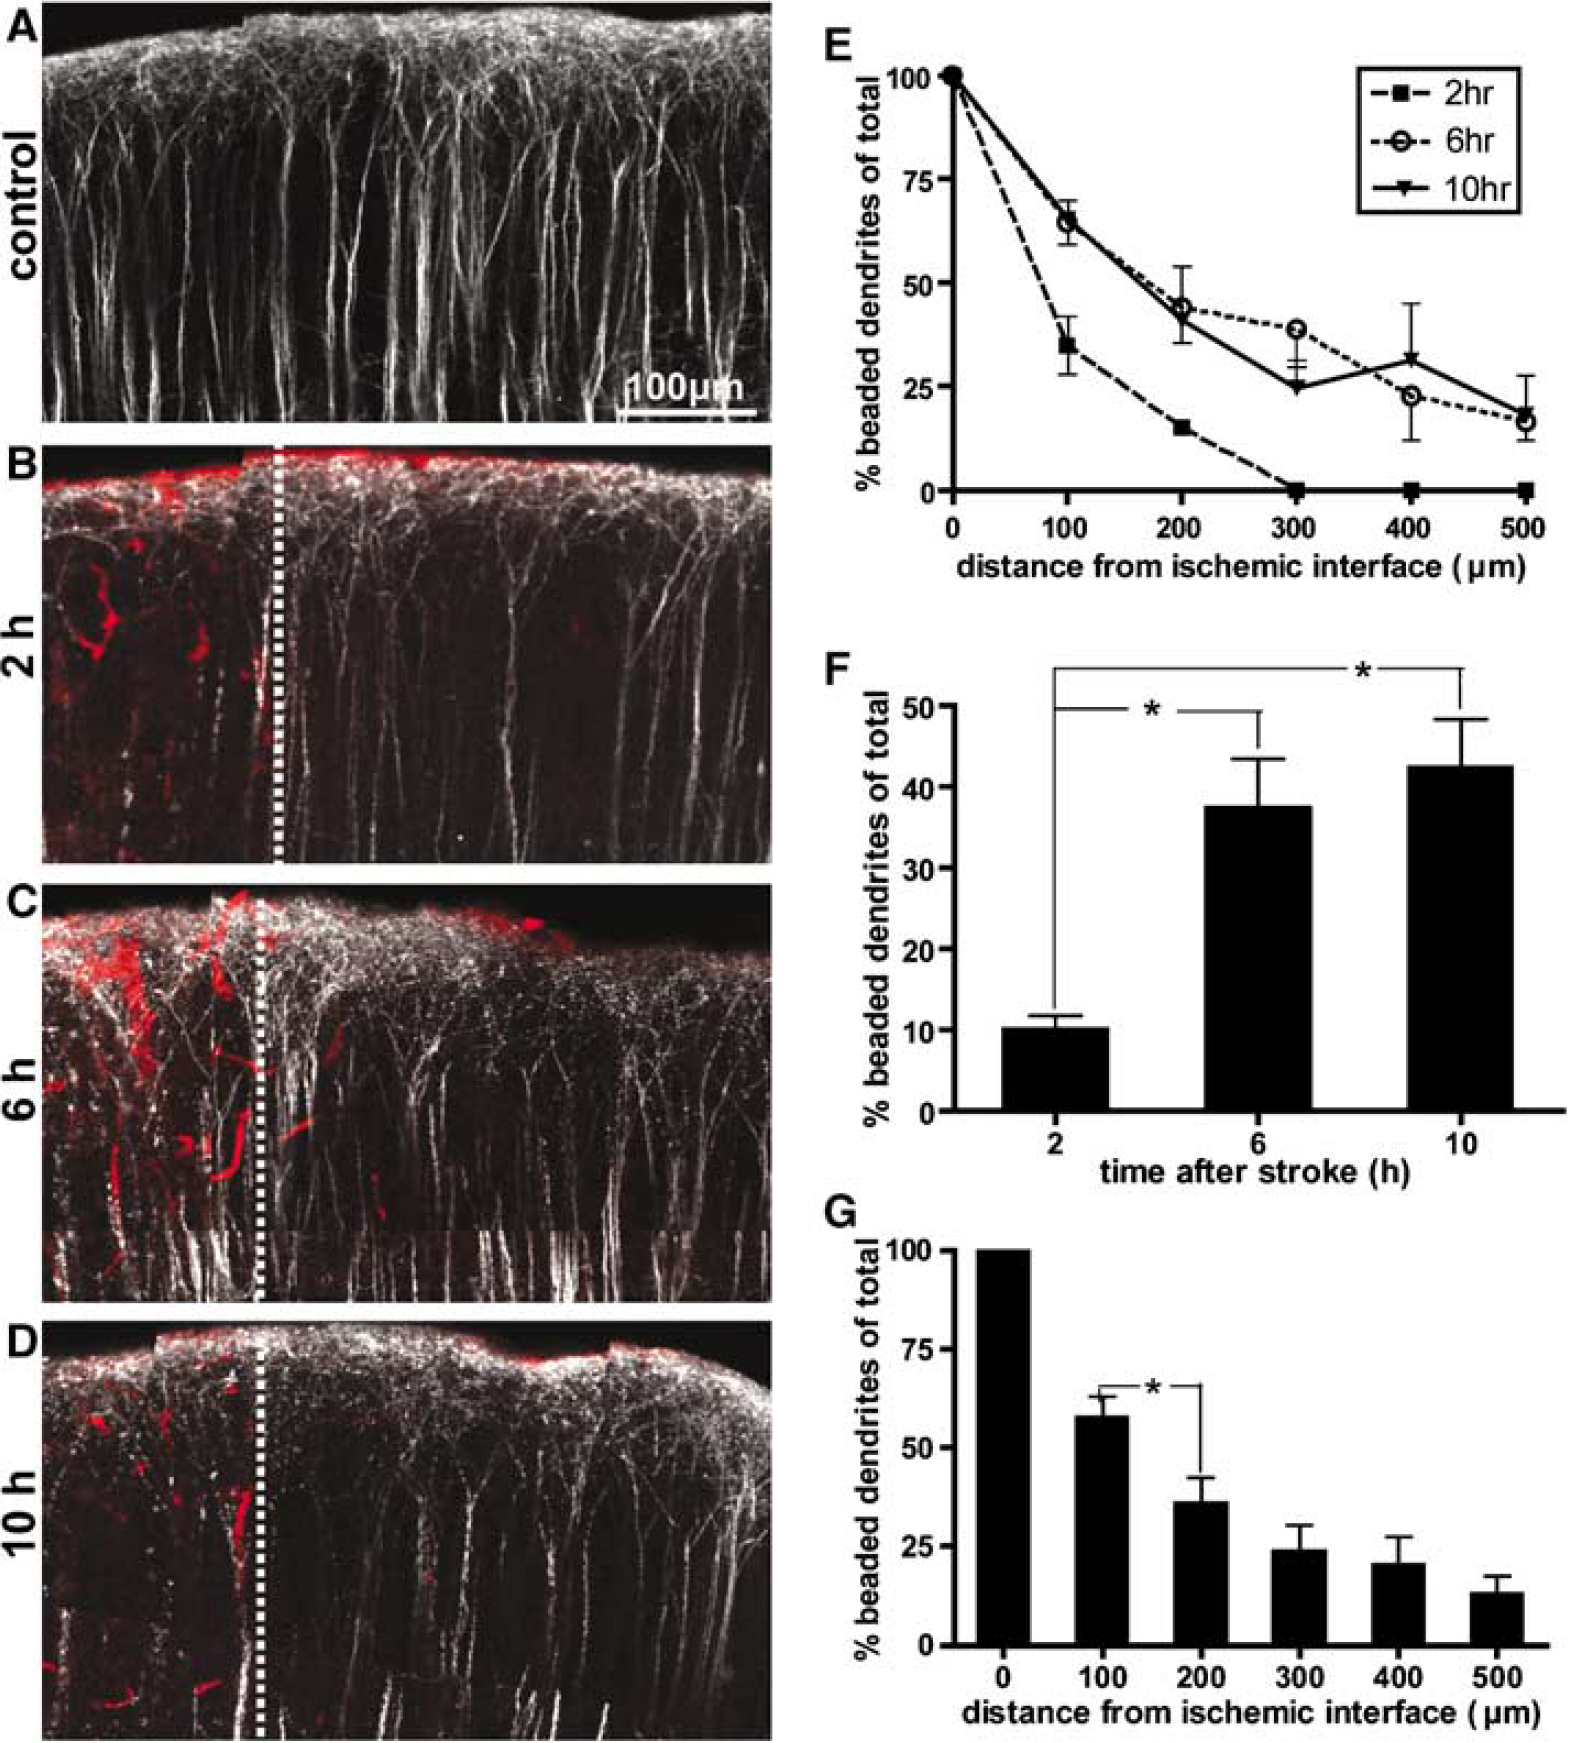
Spatial distribution of ischemic damage to dendrites. (
To verify that certain neurons located as close as 100 μm from the stroke core could be entirely free of ischemic damage, we performed a high-resolution analysis of non-beaded layer V YFP neurons located between 100 and 300 μm from the ischemic interface in three animals killed 6 h after stroke (Figure 5A). Using confocal imaging, we reconstructed the entire dendritic structure of these neurons, from the cell body to the dendritic tufts (Figure 5B). This analysis revealed that the spines and dendritic structure of these neurons could be intact throughout all cortical layers (Figure 5B, panels 100 to 600), including the most superficial dendritic tuft (Figure 5B, panel 100). Thus, the dendritic tuft of layer V neurons located at the ischemic interface seems to be more vulnerable to ischemic damage, whereas neurons located between 100 and 300 μm from this interface may escape ischemic damage altogether and retain structural integrity throughout their length.
Neurons located near a of ischemia show intact dendritic structure throughout their length. (
Spatial Distribution of Ischemic Damage to Axons
The extent of axonal ischemic damage was also of interest as layer V cortical neurons are the major output neurons of the cortex that synapse within the midbrain, hindbrain, and spinal cord, ultimately affecting motor function. Further, the issue of damage to projecting axons can only be addressed in histology since these axons exit layer V neurons more that 600 μm below the surface of the cortex and well out of range for in vivo imaging of small structures. Axonal beading has previously been shown to be a response to anoxia (Tekkok et al, 2005), thus we used this morphologic characteristic as a representation of axonal ischemic damage. A very moderate level of axonal damage was apparent in sham stroke control animals within a similar region to animals that underwent RB photoactivation (Figure 6A). This slight apparent damage in the control group varied somewhat across the medial to lateral extent of the brain and was possibly associated with mechanical effects of the craniotomy or its impact on the perfusion/brain removal process. In animals that received a RB stroke, observation of the axons of layer V neurons within the ischemic core and adjacent cortex revealed that beaded axons were located well beyond the ischemic interface and that this effect became more apparent with time after the stroke (Figure 6B–Figure 6D). To further elucidate the extent of axonal damage in space and time in both RB stroke animals and sham stroke controls, we devised an axonal damage rating (ADR) scale whereby 0 = no axonal damage (all dendrites intact), 1 = minor damage (~ 25% of axons beaded), 2 = moderate damage (~ 50% of axons beaded), and 3 = severe damage (~ 75% of axons beaded or complete loss of axonal integrity) (Supplementary Figure 1). To reduce the chance that the axons we scored were projecting from the infarct core, we examined the morphology of vertically oriented axons leaving the layer V neuron cell bodies. This analysis confirmed our observations and revealed that the severity of axonal damage extended well beyond the ischemic interface at all time points after stroke and this effect became more prominent with increasing time after the ischemic insult (Figure 6E). To increase statistical power, ADR scores were collapsed across distance for each group. As such, we found that there was a significant difference between the level of axonal damage among the four groups (P < 0.05; Kruskal—Wallis test) (Figure 6F). When compared with the control value (0.46 ± 0.20, n = 4), the level of axonal damage was increased at 2 h (1.53 ± 0.47, n = 2), 6 h (1.88 ± 0.40, n = 3), and 10 h (2.55 ± 0.24, n = 2) after stroke but this affect was only found to be statistically significant at the 6 h time point (P < 0.05; Mann—Whitney U-test) (Figure 6F). We also pooled together the ADR scores from each time point after stroke (collapsed across distance) and found that the level of axonal damage was significantly greater than control values from 100 to 500 μm beyond the ischemic interface (P < 0.05; Mann—Whitney U-test) but dropped to near control levels at 600 μm (Figure 6G). The level of axonal damage at 600 μm (1.67 ± 0.43, n = 7), 700 μm (1.10 ± 0.30, n = 7), and 800 μm (0.85 ± 0.26, n = 7) away from the ischemic interface did not differ significantly from sham stroke control values (600 μm: 0.87 ± 0.30; 700 μm: 0.75 ± 0.29; 800 μm: 0.50 ± 0.22; n = 4, P > 0.05; Mann—Whitney U-test). Thus, it seems that the spatial spread of axonal damage increases with time after stroke and extends further laterally throughout the cortex than does ischemic damage to dendrites. This suggests that the axons of layer V neurons may be more vulnerable to ischemia than their dendrites.
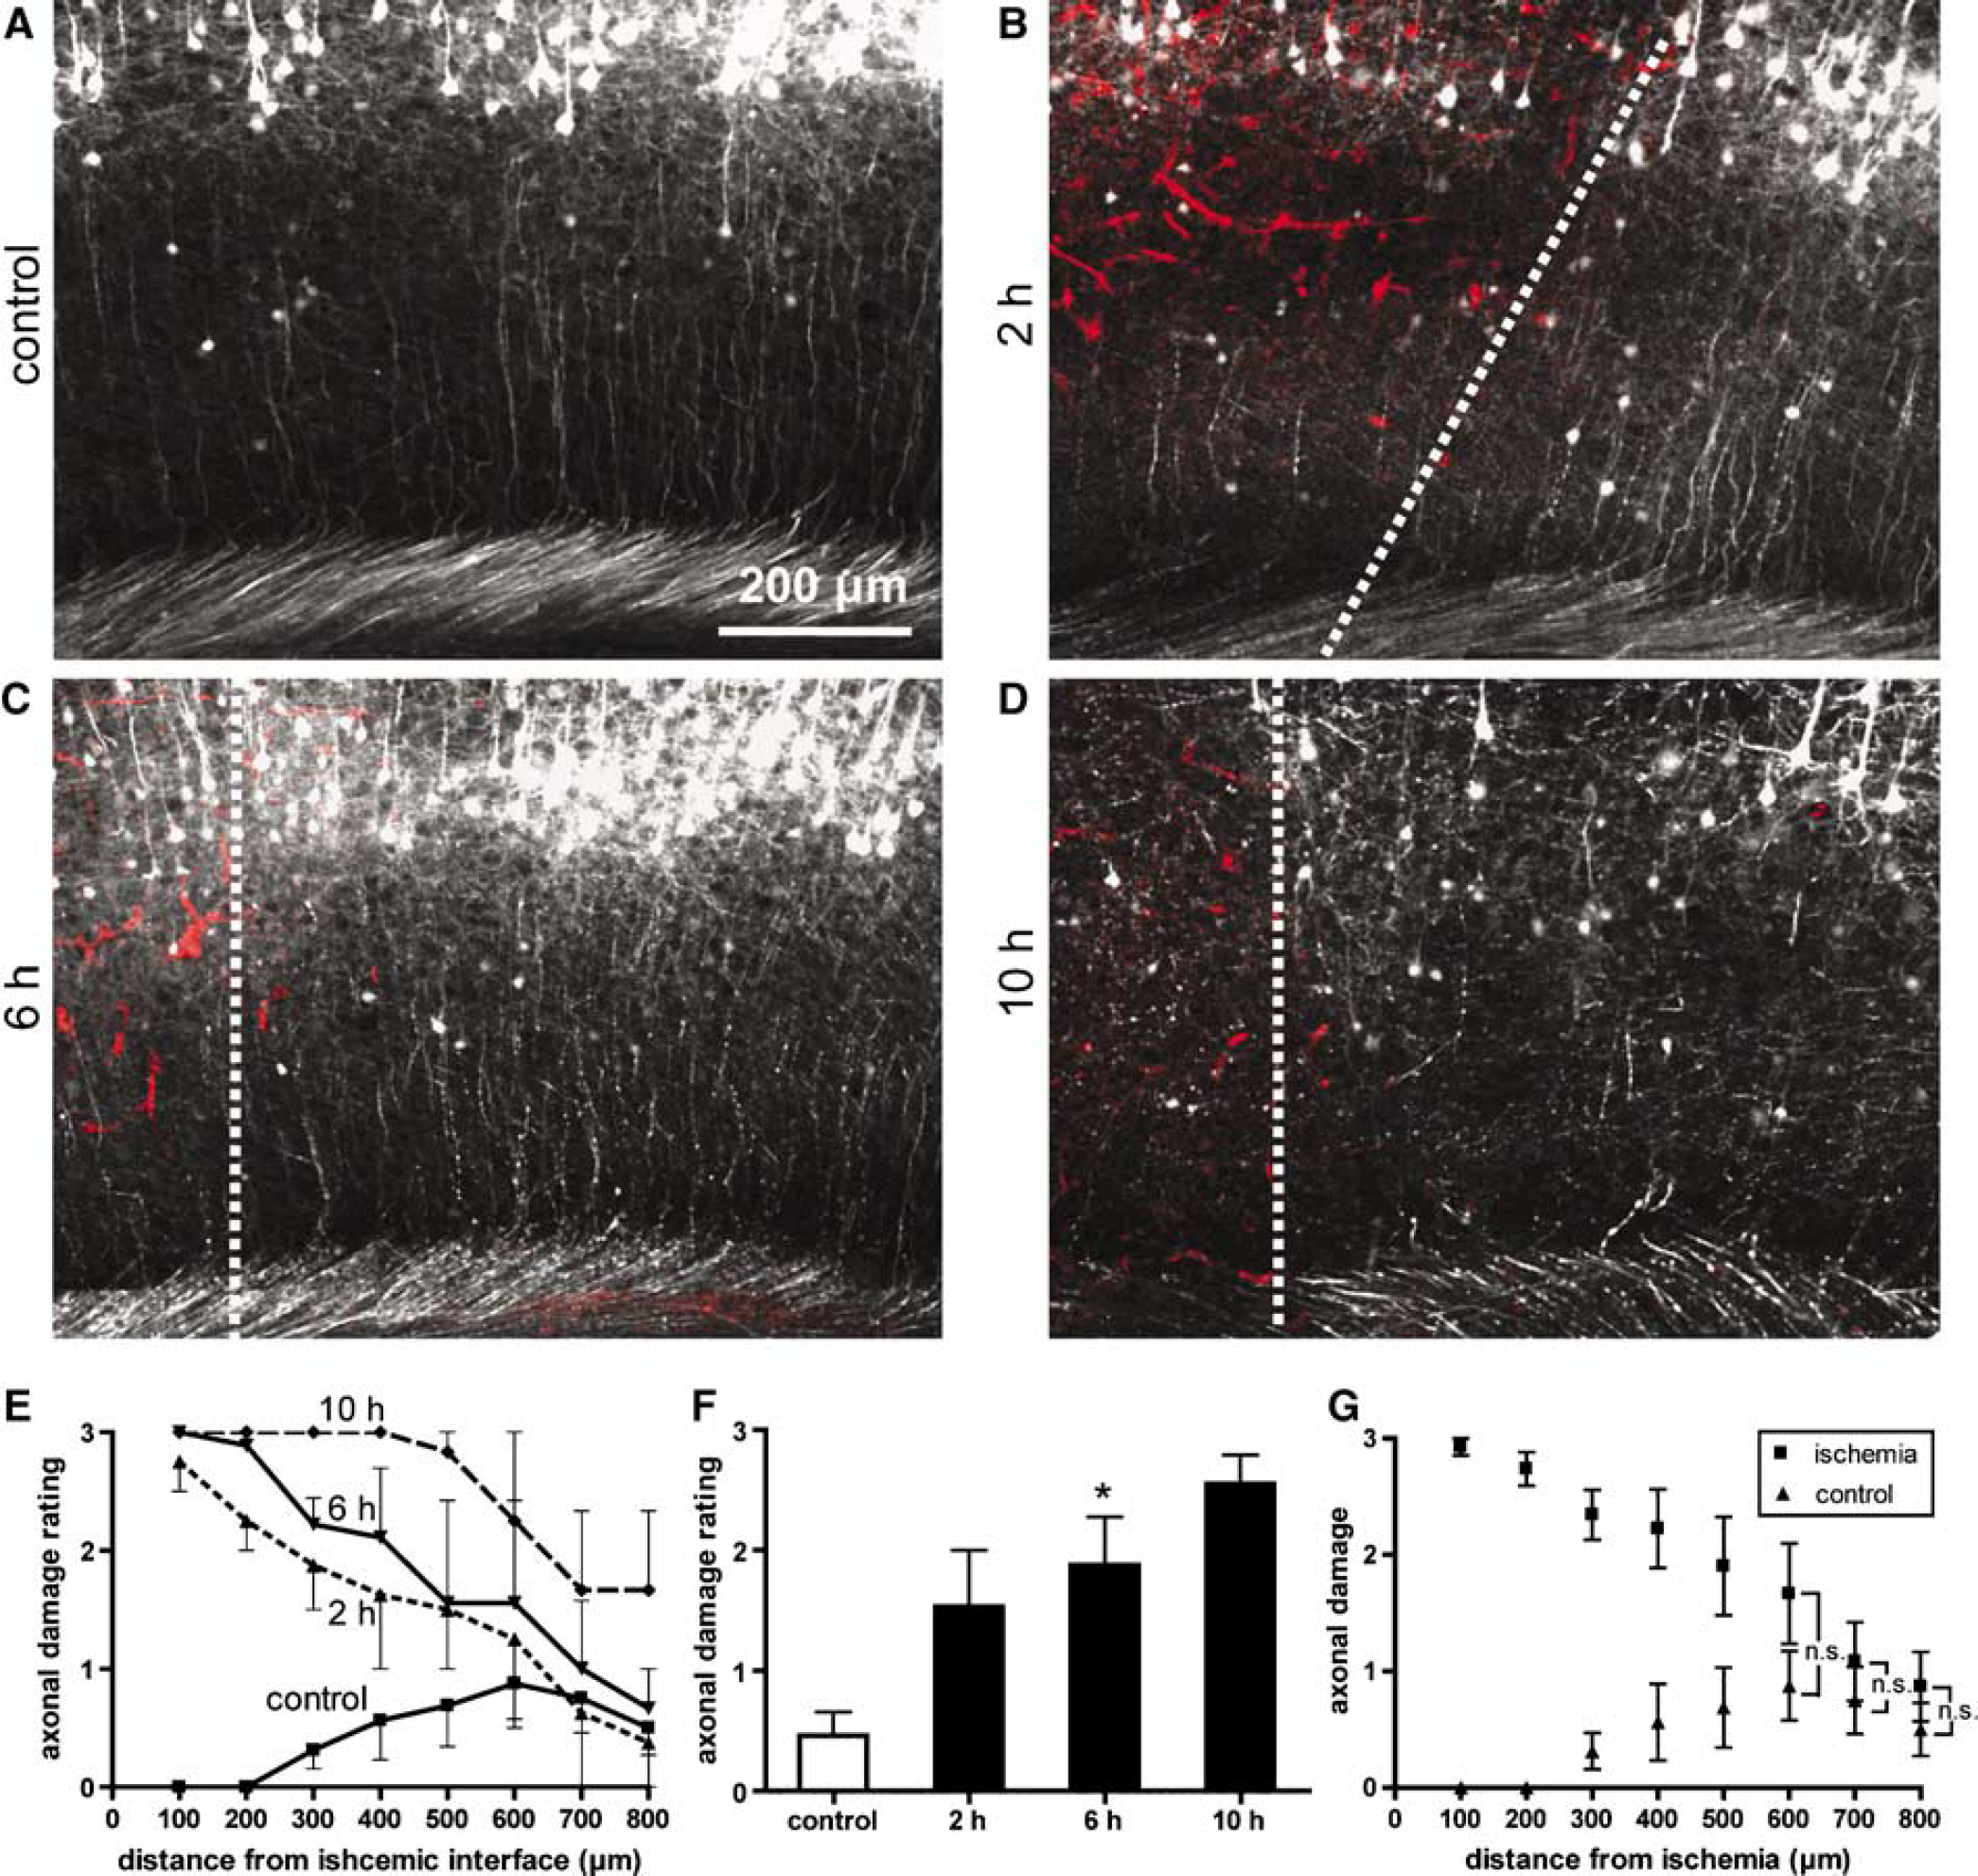
Spatial distribution of ischemic damage to axons. (
Cell Fate Throughout the Ischemic Core and Penumbra
Here, we have been using axonal and dendritic beading as a measure of compromised neuronal circuitry; however, it is not entirely clear what the fate is of neurons exhibiting this type of beaded morphology. To determine the viability of layer V neurons located throughout the ischemic core and penumbra 6 h after RB stroke, we first used PI staining to assess the integrity of cells' nuclei by measuring their size. Propidium iodide is generally used as a marker of cell death in cell culture and live tissue slices because, in these cases, it stains only cells with a compromised plasma membrane. Here, because we used PI staining on fixed and permeabilized tissue slices all cells were labeled with PI, thus we chose to use the size of a cell's nucleus as a measure of its integrity. In our application, all PI-stained sections were treated with RNase to enrich for nuclear staining. An analysis of only YFP expressing layer V neurons within the nonischemic hemisphere (control; Figure 7A and Figure 7A′), stroke core (–150 to 0 μm; Figures 7B and Figure 7B′), as well as 0 to 150, 150 to 300, and 300 to 450 μm (Figure 7C and Figure 7C′) away from the ischemic interface (defined as 0 μm) revealed that distance from the ischemic interface had a significant effect on the size of a cell's nucleus (P < 0.001; ANOVA). More specifically, the nucleus size of YFP neurons located within the stroke core (83.5 ± 5.9 μm2, n = 3 animals) as well as 0 to 150 μm (68.3 ± 4.1 μm2, n = 3 animals) and 150 to 300 μm (76.2 ± 6.3 μm2, n = 3 animals) away from the ischemic interface was significantly smaller than that of control YFP cells (143.1 ± 3.0 μm2, n = 4 animals; P < 0.001; ANOVA with Bonferroni's post hoc test) (Figure 7D). Interestingly, the nuclei of YFP cells located between 300 and 450 μm away from the edge of the ischemic zone (121.6 ± 7.7 μm2, n = 3 animals) were significantly larger than the nuclei of cells located between 150 and 300 μm away (P < 0.01; ANOVA with Bonferroni's post hoc test) and not statistically different from control YFP cells (P > 0.05; ANOVA with Bonferroni's post hoc test) (Figure 7D). Thus, it seems that cells located up to 300 μm from the border of the ischemic zone are compromised, as indicated by the condensed size of their nucleus, whereas cells beyond this distance are relatively intact. This could indicate a penumbral zone where cells may be functionally impaired but potentially still viable.
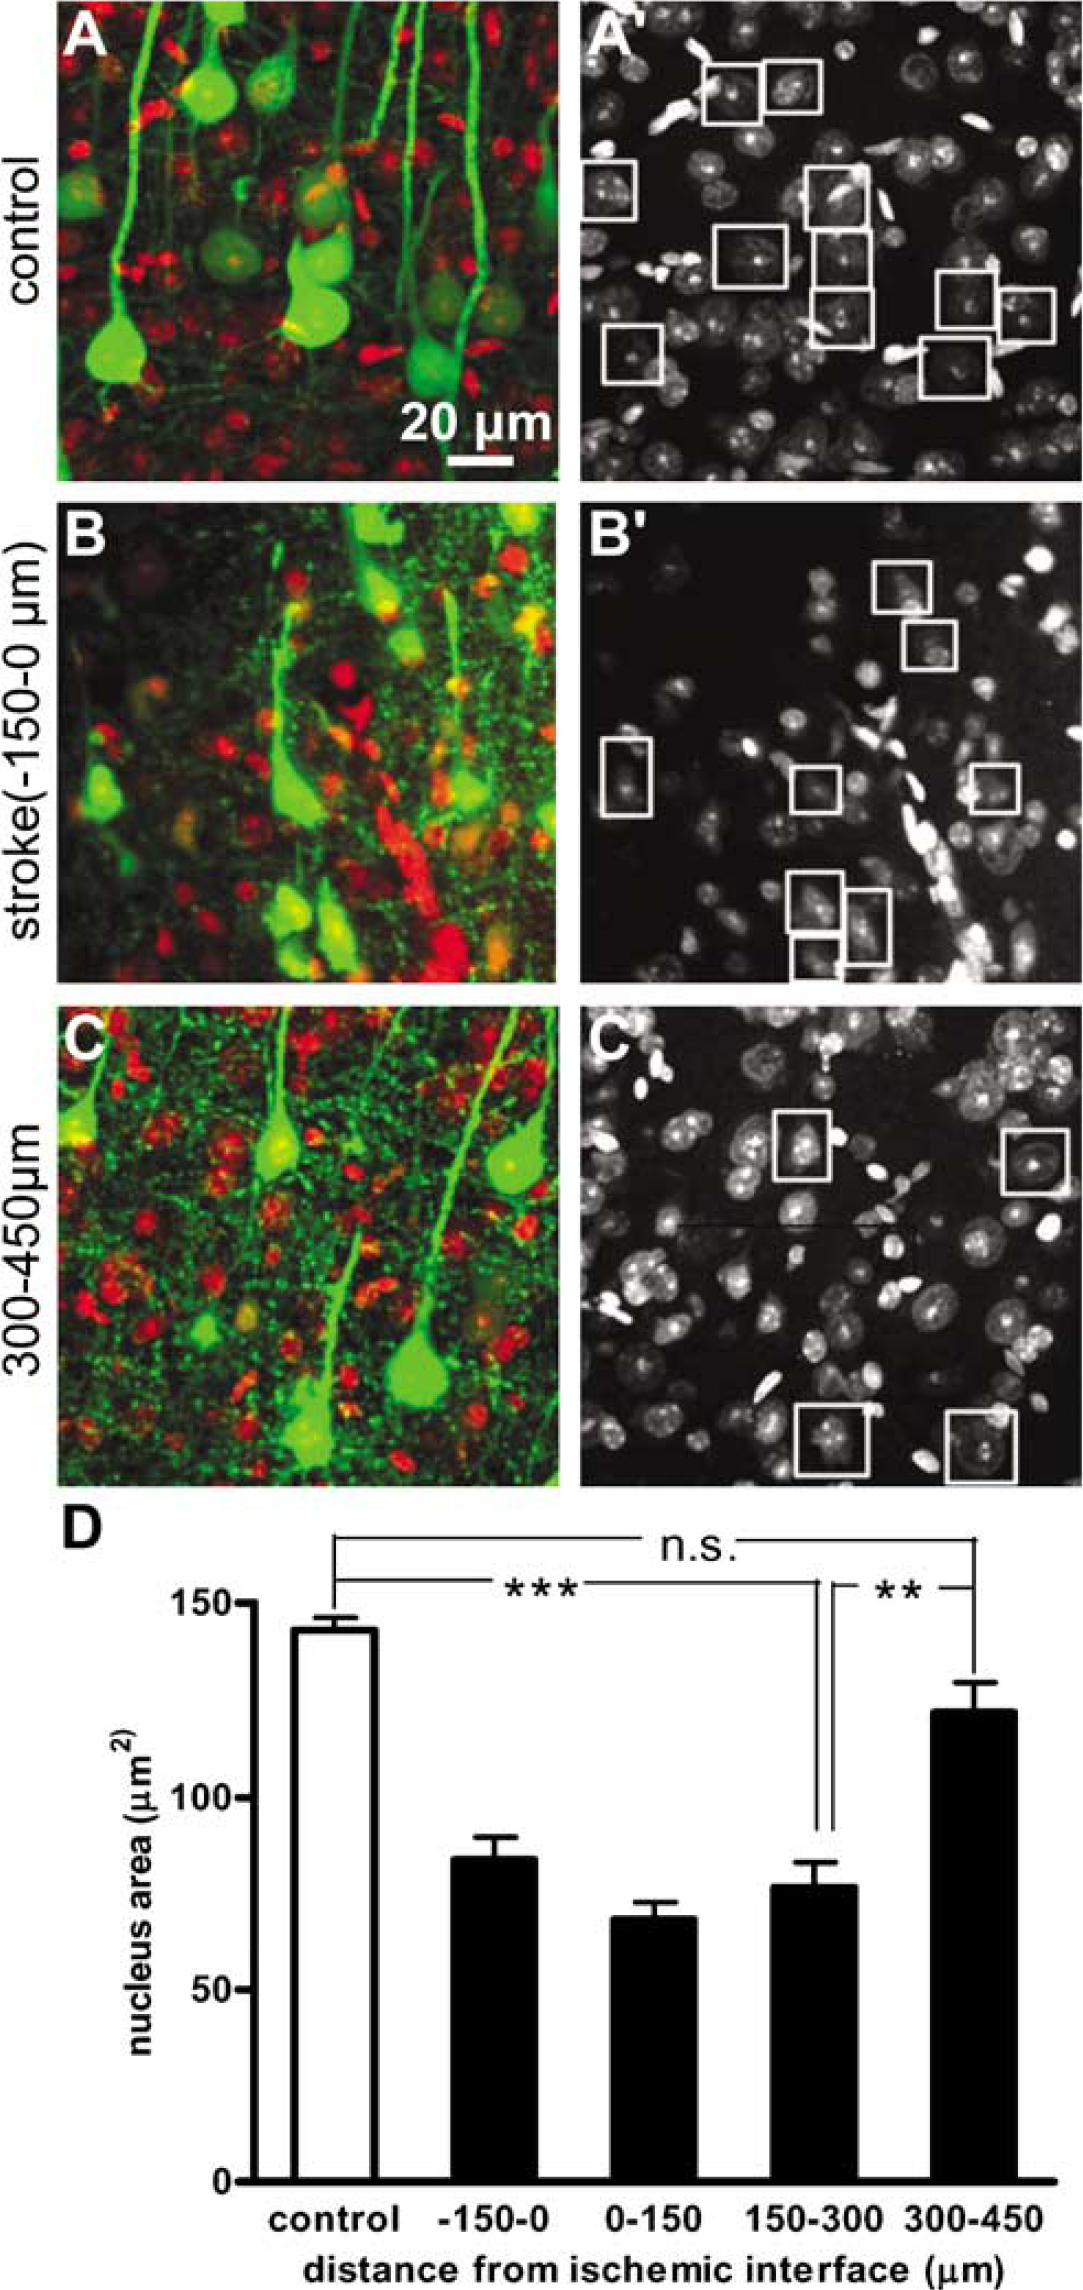
PI staining reveals changes in nuclear size of YFP layer V neurons throughout the ischemic core and penumbra. (
Spatial Profile of Neuronal Apoptosis in the Ischemic Core and Penumbra
As nuclear condensation is a morphologic characteristic of apoptosis (Majno and Joris, 1995) is it probable that cells with condensed (pyknotic) nuclei may be undergoing this form of cell death. To examine this possibility we performed immunostaining on sections of YFP mice 6 h after RB stroke using antiserum against the caspase-3 cleavage site (Urase et al, 2003) (Figure 8A). Caspase-3 is a cytosolic cysteine protease whose activation has been shown to be associated with apoptotic cell death after ischemic brain injury (Chen et al, 1998). Indeed, we found many layer V YFP neurons within the stroke core (Figure 8B, panel 1) as well as in the ischemic penumbra (Figure 8B, panels 2 to 3) to be anti-m3D175 positive; however, there was significantly less staining in YFP neurons located between 300 and 450 μm away from the stroke border (Figure 8B, panel 4). Yellow fluorescent protein neurons located on the non-ischemic hemisphere did not show any anti-m3D175 staining indicating specificity of the antibody (Figure 8B, panel ctrl). Analysis of the number of anti-m3D175 positive YFP apoptotic cells with distance from the ischemic interface revealed a similar spatial distribution to cells with condensed nuclei as indicated by PI staining (Figure 8C). Specifically, the percentage of anti-m3D175 positive apoptotic YFP neurons located within the stroke core (–150 to 0 μm from the ischemic interface; 84.2% ± 4.1%) did not differ significantly from those located between 0 and 150 μm (77.9% ± 5.0%) or 150 and 300 μm (82.9% ± 2.7%) from the ischemic interface (P > 0.05; ANOVA with Bonferroni's post hoc test; n = 3 animals). Beyond this distance, between 300 and 450 μm, significantly fewer YFP neurons were labeled with anti-m3D175 (24.9% ± 7.8%) (P < 0.001; ANOVA with Bonferroni's post hoc test). Thus, neuronal apoptosis appears to be activated 6 h after stroke within the core of the ischemic lesion and extending up to 300 μm in the surrounding penumbral tissue.
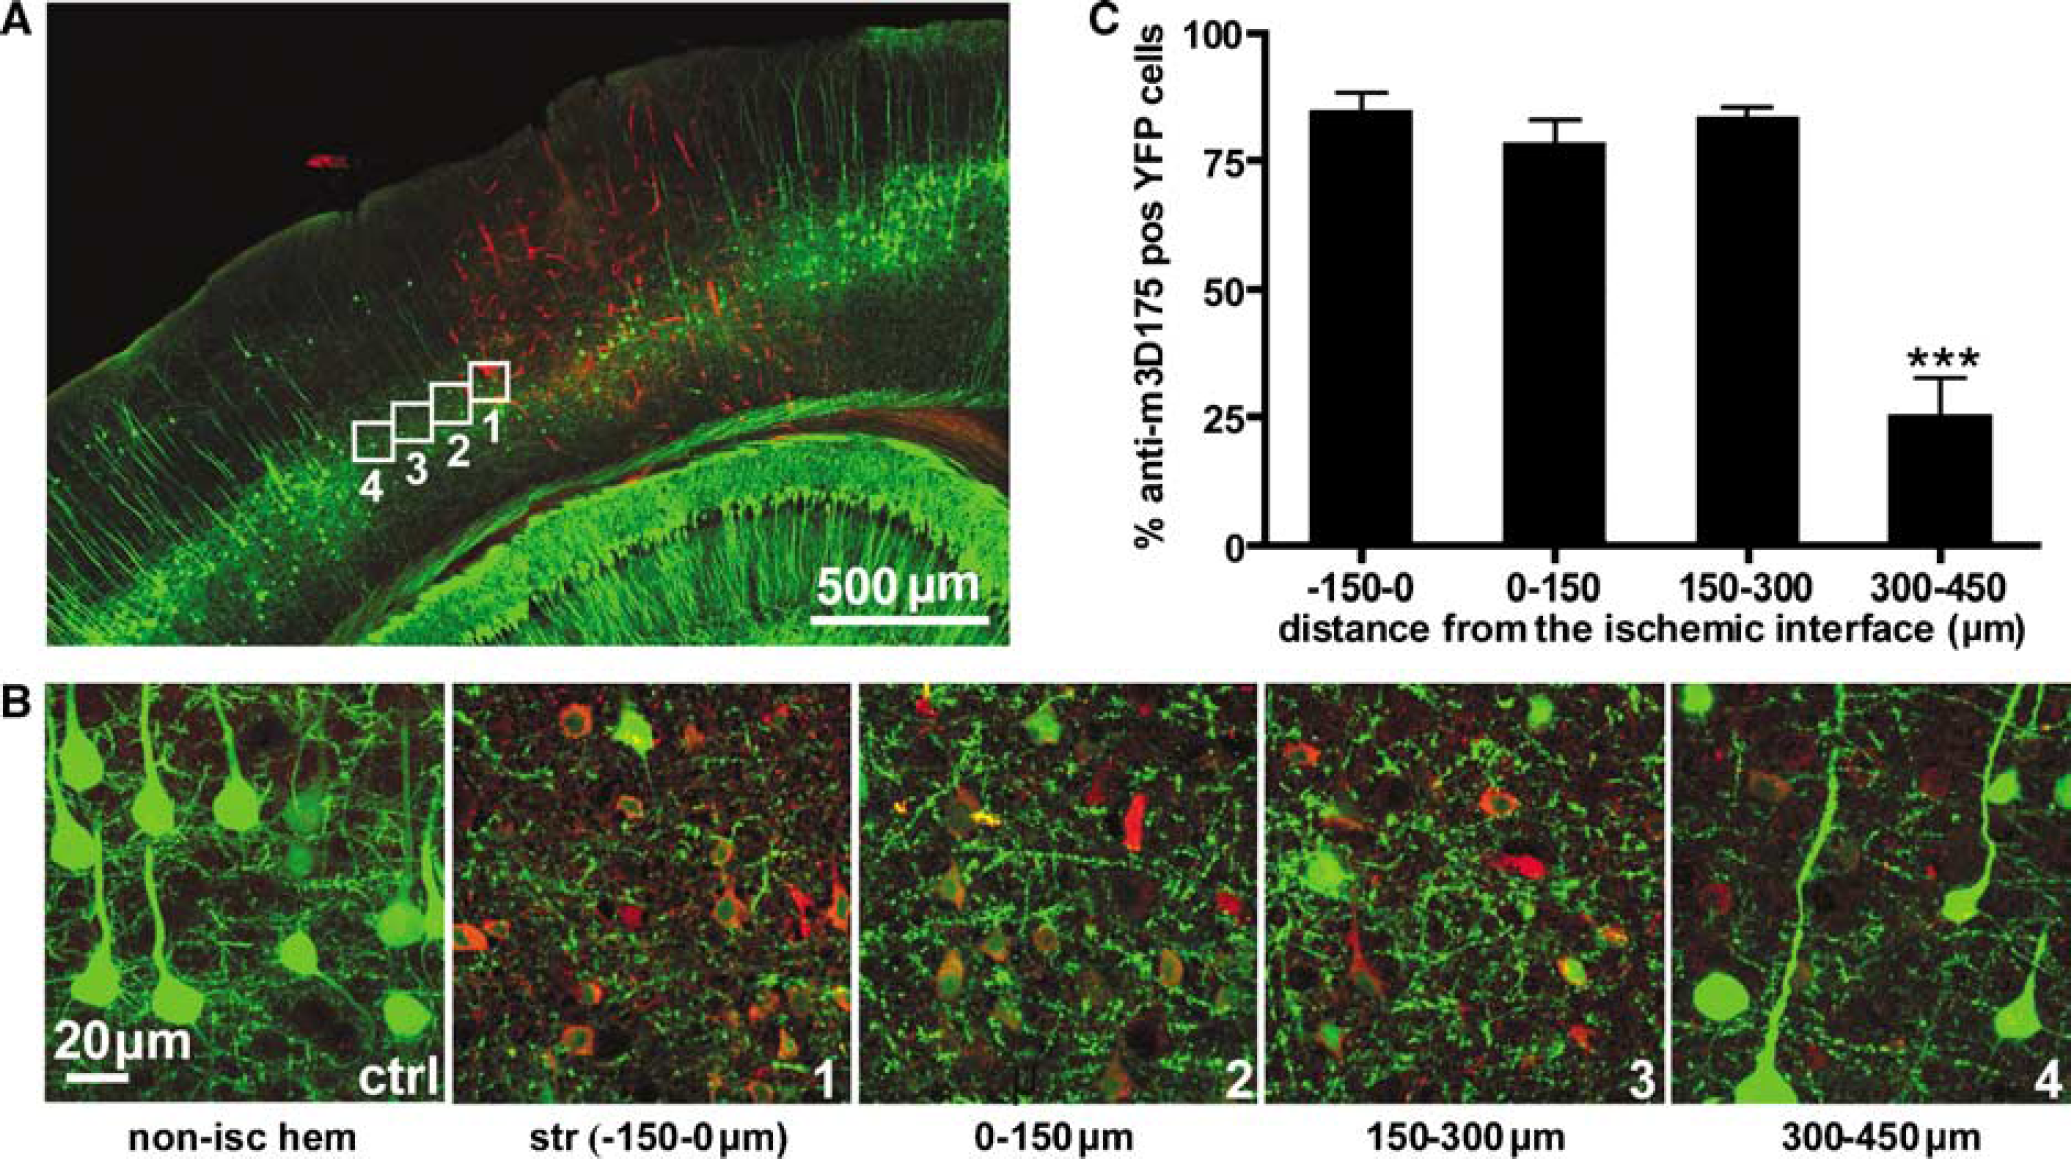
Spatial pattern of neuronal apoptosis 6 h after RB stroke. (
Spatial Profile of Neuronal Necrosis in the Ischemic Core and Penumbra
Both apoptotic and necrotic cell death cascades have been implicated in ischemia and these have been shown to be concomitantly activated in the same set of ischemic neurons (Unal-Cevik et al, 2004). We wished to determine if and where necrotic cell death cascades were occurring in our animals, 6 h after stroke. To test this, we performed immunostaining on slices of YFP mice 6 h after RB stroke using an antibody to the 136-kDa fragment of calpain-cleaved α-spectrin (136 kf of α-spectrin) (Figure 9A). Calpain is a calcium-dependent neutral cysteine protease that is known to be activated after brain ischemia (Yamashima et al, 2003) and the 136 kf of α-spectrin breakdown is only generated during neuronal necrosis making it a specific marker for this form of cell death (Takano et al, 2005). The spatial pattern of activated necrotic cell death indicated by staining for the 136 kf of α-spectrin was similar to the spatial pattern of activated apoptotic cell death indicated by anti-m3D175 staining. No cells in the nonischemic hemisphere stained for the 136 kf of α-spectrin (Figure 9B, panel ctrl); however, in the stroke core (–150 to 0 μm) nearly all YFP cells were 136 kf α-spectrin positive (95.4% ± 4.5%, n = 3 animals) (Figure 9B, panel 1). There was a high number of 136 kf α-spectrin positive YFP neurons located between 0 and 150 μm (94.0% ± 1.7%, n = 3 animals) (Figure 8B, panel 2) and 150 and 300 μm (84.3% ± 11.6%, n = 3 animals) (Figure 9B, panel 3) away from the ischemic interface (denoted as 0 μm); however, between 300 and 450 μm this number decreased to 37.4% ± 5.5% (n = 3 animals) (Figure 9B, panel 4). The number of potentially necrotic 136 kf α-spectrin positive YFP neurons between 300 and 450 μm away from the ischemic interface was significantly reduced compared with those located in the core of the stroke and up to 300 μm away (P < 0.05; ANOVA with Bonferroni's post hoc test) (Figure 9C). Thus, it appears that necrotic and apoptotic cell death cascades are activated in a similar spatial pattern 6 h after stroke. Since the percentage of YFP cells that stained for these markers approached 90% (near the core), we would expect that individual layer V neurons would have components of both cell death pathways activated within them.
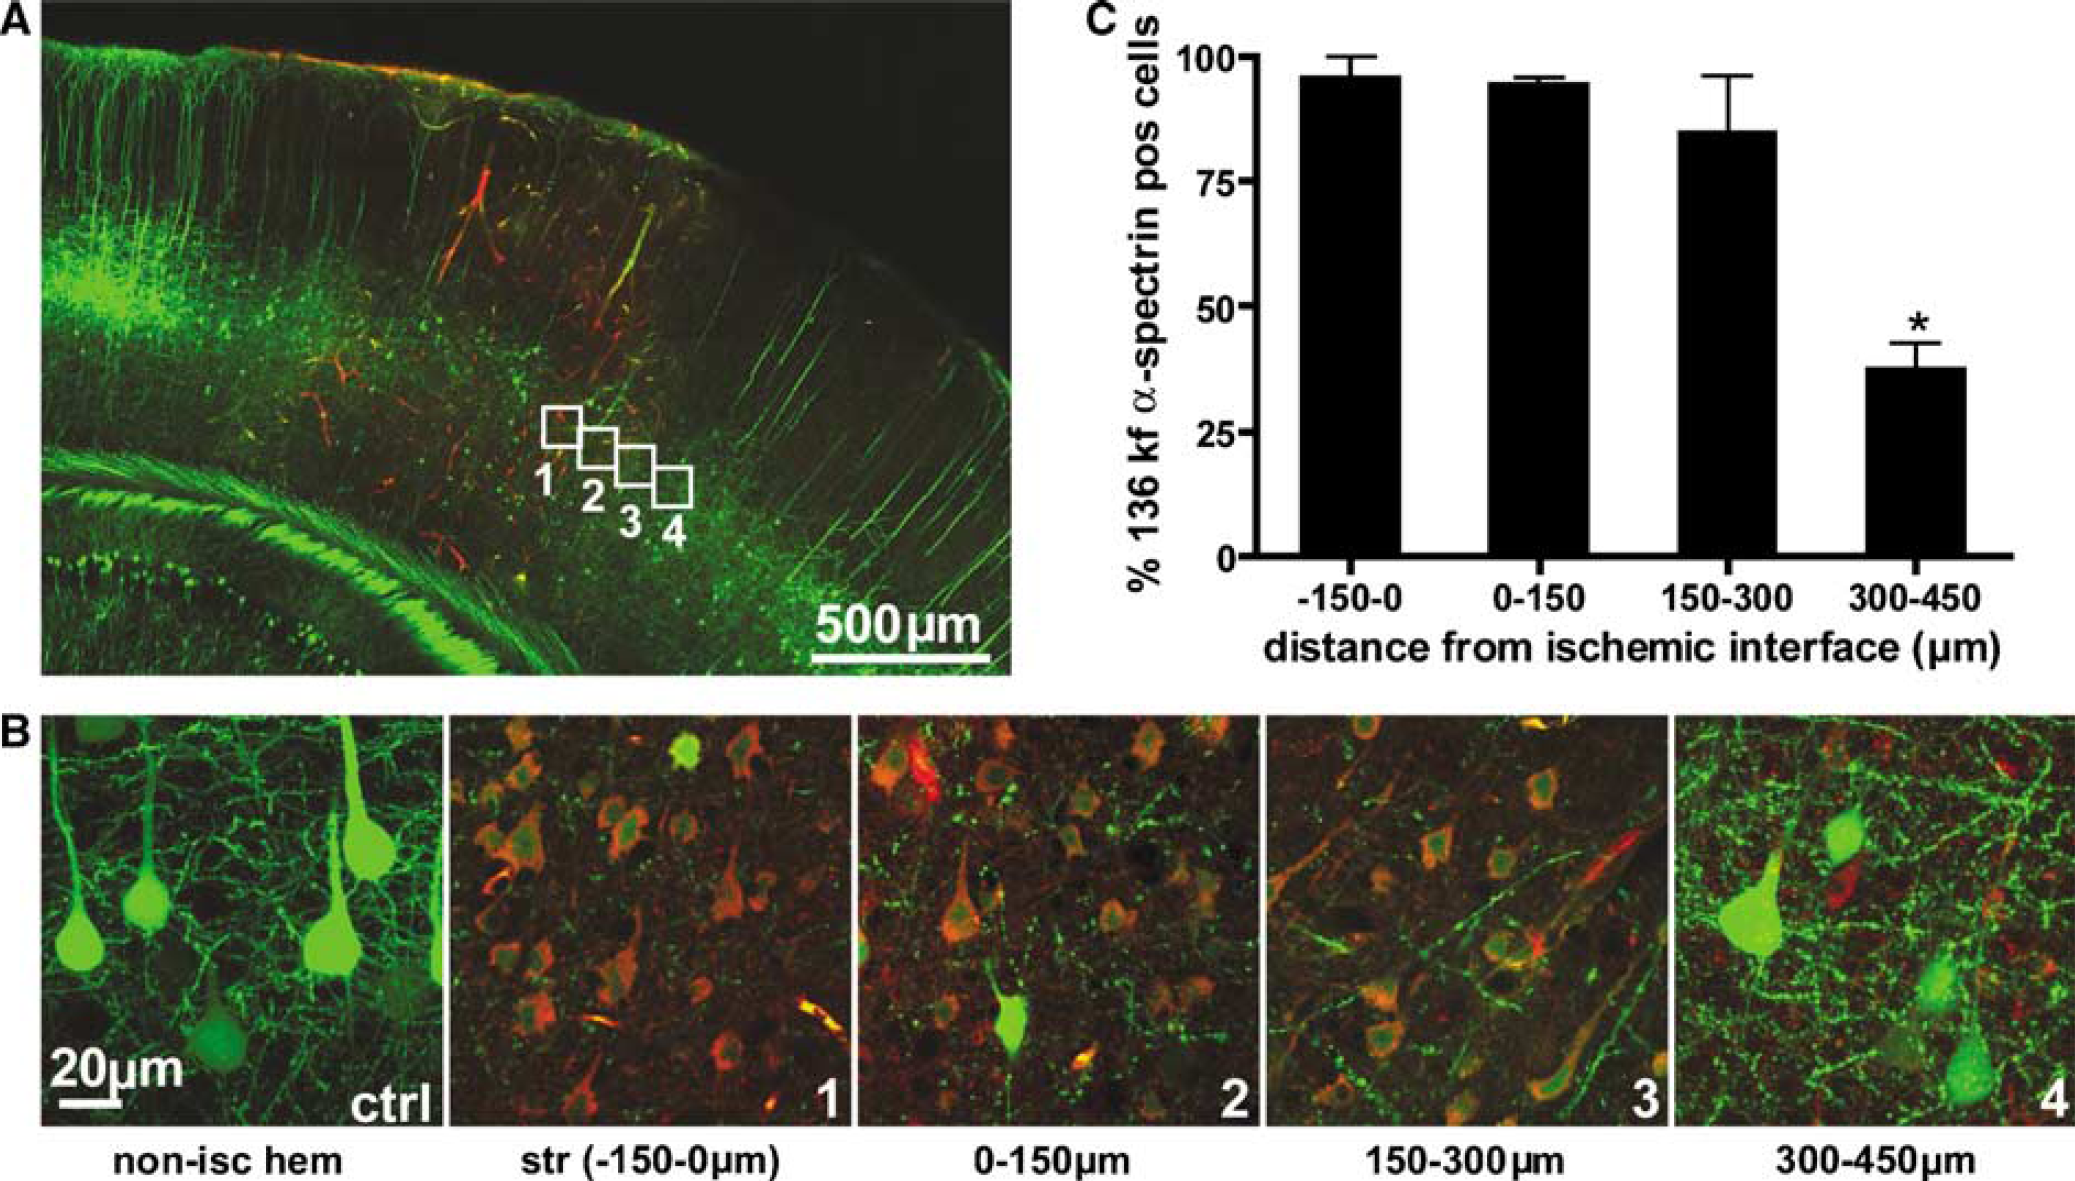
Spatial pattern of neuronal necrosis 6 h after RB stroke. (
Discussion
A Sharp Border Exists between Normal and Damaged Synaptic Circuitry
Fortuitously, in the RB stroke model, TR-dextran becomes lodged within ischemic vessels on fixation providing a map of ischemic zones. Together with YFP fluorescence of layer V neurons, the extent of axonal and dendritic damage was mapped in relation to the location of ischemia within the first 2 to 10 h after stroke. Dendritic beading was used as an early marker of excitotoxic and anoxic damage to neurons (Hori and Carpenter, 1994; Jarvis et al, 1999; Park et al, 1996; Zhang et al, 2005b). Our analysis shows that the incidence of beaded dendrites falls sharply with increasing distance from the lesion site, with nearly a 70% decrease in the number of beaded dendrites within the first 100 μm from the ischemic core border and no beaded dendrites beyond 300 μm at 2 h after stroke. In another study, assessment of neuronal function in peri-infarct cortex with cytochrome oxidase staining 7 days after focal stroke revealed that the region of partially damaged synaptic structures extended ~ 0.5 mm laterally and 1.1 mm medially from the lesion edge (Katsman et al, 2003). The fact that we observed sharper ischemic borders than in this study could reflect that we examined a significantly earlier time point and also used more sensitive measures of aberrant synaptic structure such as spine loss and dendritic beading.
Although the size of our ischemic lesions increased with time, the lateral spread of damage to dendrites remained relatively confined to the location of ischemia (~ 50% decrease in beaded dendrites 100 to 200 μm from the ischemic interface) at both 6 and 10 h after stroke despite the potential for diffusion of released cytotoxic factors such as glutamate, nitric oxide, or other factors from the dying core (Witte et al, 2000). Perhaps, these cytotoxic factors have a limited range of diffusion because of uptake and inactivation mechanisms and only affect cells within the stroke core. Alternatively, local resting microglia may become activated by the ischemic insult and infiltrate the site of injury, thus acting to contain ischemic damage. Recently, a neuroprotective role of microglia has been supported in vivo by their immediate response to local damage (Davalos et al, 2005; Nimmerjahn et al, 2005).
With regard to lesion size, we report a large increase in dendritic beading between 2 and 6 h after stroke within the ischemic interface, but little further increase from 6 to 10 h. This is within the therapeutic time window for stroke treatment and would argue that treatment within this time window could strongly influence the fraction of intact circuitry left for recovery. Although regions with trapped TR-dextran reflect ischemic vessels, an important caveat is that the histological analysis we perform here does not measure blood flow at border regions. It is possible that deficits in blood flow may extend further laterally than the distribution of stable clots. In unpublished work we have examined the ischemic interface 1 h after stroke (in live animals) and have found cases where most dendrites were intact even within an ischemic zone, providing it was within 50 to 100 μm from an area with relatively normal blood flow. These results would suggest that more circuitry could be salvaged if treatment could be performed even earlier.
Selective Damage to Dendritic Tufts
It is clear that neuronal circuitry within the ischemic core is irreversibly damaged and therefore unlikely to contribute to recovery. The fate of neurons and their synaptic circuitry at the margins of ischemia, however, is unclear and is likely to be a critical determinant of functional recovery since this circuitry, by proximity, often functions in a related manner to tissue lost in the core (Carmichael, 2005). Examination of the laminar distribution of ischemic damage to layer V neurons at the border of the ischemic zone revealed that dendritic beading was most prominent within dendritic tufts (Figure 2). The fact that this pattern of ischemic damage was apparent at 2, 6, and 10 h after RB stroke shows that this was not necessarily a reflection of a progressive process at an intermediate time point. This was also not because of the nature of the photothrombotic insult as this was also observed in the MCAO model of stroke (Figure 3).
It has previously been established that certain subsets of neurons, including layer V neurons, are particularly vulnerable to ischemic damage (Jones and Schallert, 1992); however, compartmentalized dendritic damage within individual neurons is a relatively new finding. A potential explanation for this compartmentalized damage is that processes with a higher surface area to volume ratio such as small dendritic tuft branches and axons are not able to buffer aberrant ion fluxes as efficiently as somatic compartments and larger dendrites thus making them more susceptible to excitotoxicity. This would also explain why the axons of layer V neurons at the ischemic border appeared to be more damaged than nearby proximal dendrites. However, in the case of the MCAO stroke, we can clearly show a gradient of damage along the large apical dendrite up to 200 μm below the surface of the cortex (Figure 3), showing that the increased ischemic damage near the surface may not be restricted to smaller tuft branches. It is conceivable that a laminar variation in blood supply occurs since layer V neuron dendrites are oriented radially along vascular territories defined by penetrating arteries. It is possible that dendritic processes in deeper cortical regions are less ischemic because of redundant horizontally oriented blood flow derived from adjacent territories that are less ischemic. Another possibility is that the beaded dendritic tufts that we observed immediately adjacent to the lesion site were branches projecting from those neurons located within the dying core; however, in most cases we have traced these dendritic tufts and can show this is not the case. We have shown a similar pattern of damage in two different stroke models suggesting that they engage similar mechanisms of dendritic damage. However, it is also conceivable that the dendrites show similar morphology since both models (as performed) did not permit robust reperfusion. It is possible that if prompt reperfusion had occurred the laminar distribution of damage may have been different.
The idea that the more distal (tuft) region of the apical dendrite of layer V neurons may be more vulnerable to ischemic damage is consistent with studies showing that this region undergoes a higher degree of modification than basal dendrites after denervation (Wellman and Sengelaub, 1995) or in response to an aspiration-induced stroke model (Gonzalez and Kolb, 2003). However, other studies indicate that the basal and not apical dendritic arborization of surviving peri-infarct layer V neurons was increased after ischemia (Biernaskie and Corbett, 2001). The loss of dendritic tuft spiny structures may have implications for recovery if the neuronal somata and associated basal dendrites survive. For example, one would expect cortical layer I activity to be largely absent but deeper layers could contribute to residual circuitry during recovery.
Selective Damage to Layer V Neuron Axons
Analysis of the incidence of beaded axons extending from layer V neurons located adjacent to the stroke core indicated that the spatial spread of ischemic damage to axons extended further laterally than the damage seen within the apical dendrites of these same neurons (Figure 10). It is possible that the higher surface area to volume ratio of axonal processes makes them more susceptible to ischemia than dendrites. A series of reports have shown that oligodendrocytes contain glutamate receptors (Agrawal and Fehlings, 1997) and these are associated with the sensitivity of white matter tracts to excitotoxic and anoxic damage when studied in vitro (Karadottir et al, 2005; Micu et al, 2006). Another possibility is that excitotoxic mechanisms initiate a retrograde message in the dendritic tufts that surpasses the proximal region of the dendrite, selectively affecting the axon.
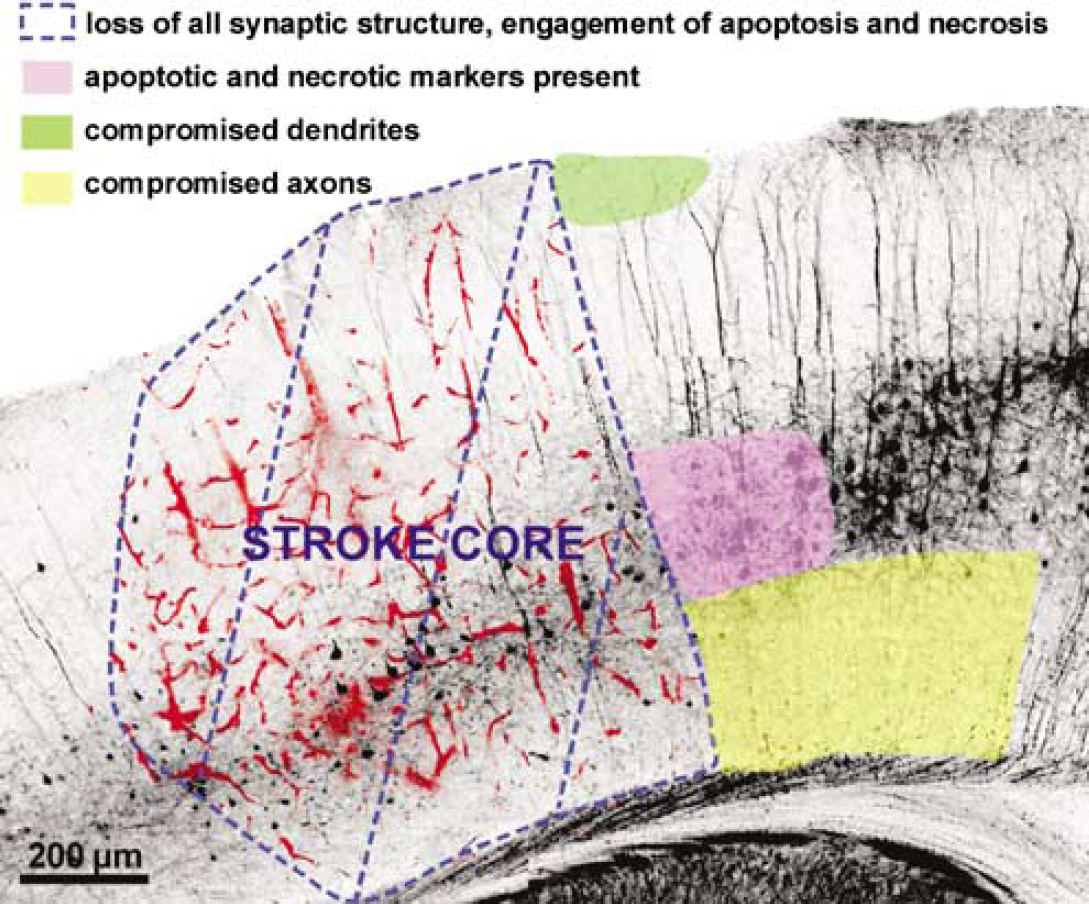
Spatial map of regions of complete and partial ischemic damage in relation to the location of ischemia. Coronal section of a YFP transgenic mouse 6 h after stroke showing trapped TR-dextran in ischemic vessels (red). The stroke core (blue dashed lines) is a region of irreversibly damaged synaptic structure and engagement of apoptotic and necrotic cell death cascades. Apoptotic and necrotic markers are also found within the first 300 μm adjacent to the stroke core (lavender shading). Ischemic damage was most apparent within the apical tuft dendrites of layer V neurons, within 100 μm of the ischemic border (green shading). Ischemic damage to the axons of layer 5 neurons extended up to 600 μm beyond the stroke core (yellow shading).
Evidence for Activation of Cell Death Mechanisms Within Peri-Infarct Zones
Immunohistologic analysis of YFP neurons located in peri-infarct tissue revealed that cells with condensed nuclei as well as activated caspase-3 and calpain-cleaved α-spectrin staining were concentrated within 300 μm outside the ischemic core (Figure 10). Beyond this distance, the nuclear size of YFP neurons did not differ from YFP neurons located on the nonischemic hemisphere and there was a significant reduction (~50%) in the number of cells that exhibited markers of apoptosis or necrosis. The spatial distribution of apoptotic and necrotic indices has been a matter of debate in ischemia. Some studies report a predominance of apoptotic markers in penumbral tissue (Benchoua et al, 2001; Sasaki et al, 2000) with necrotic markers being localized to the infarct core (Ferrer and Planas, 2003). However, other findings suggest that the location of these types of cell death are not so easily dissociated and depend on the nature and timing of the ischemic insult (Benchoua et al, 2001). Here we report evidence for both markers of apoptosis and necrosis 6 h after ischemia and we show that these are found in both the stroke core and penumbra. In another model of focal ischemia, active caspase-3 labeling was found to be present in the border zone between ischemic cortical tissue and nonischemic striatal tissue (Davoli et al, 2002). In our study, the localized activation of apoptotic and necrotic mechanisms within the first 300 μm of cortex adjacent to the lesion site suggests that this is an ideal site where delayed administration of potential antiapoptotic agents (Wang et al, 2002) could rescue cells from progression to death.
Dendritic Beading as a Sign of Neuronal Compromise
Focal bead-like swelling in dendrites and axons is thought to be a neuropathological sign of ischemia (Hori and Carpenter, 1994; Zhang et al, 2005b). Evidence shows that dendritic beading can be a reversible phenomenon (Kirov et al, 2004; Zhang et al, 2005a) associated with neuronal cell dysfunction and in some cases can precede cell death (Ikegaya et al, 2001; Takeuchi et al, 2005). With regard to function, preliminary data from our lab indicate that regions with beaded dendrites are not inactive as assessed by analysis of sensory-evoked intrinsic optical signals (in preparation). Here, we show that up to 90% of neurons within the first 300 μm outside of the ischemic core can show apoptotic and necrotic markers within 6 h after stroke onset. Since many of these neurons have beaded dendrites (in particular within the superficial first 100 μm), we would expect that dendritic beading might be an early sign of cell death pathway involvement. However, as stated earlier, since antiapoptotic treatments can rescue neurons even after ischemia it is unclear whether these immunoreactive markers reflect an absolute commitment to cell death. Thus, neurons with beaded dendrites may represent a population of cells that have become functionally impaired because of glutamate excitotoxicity or energy failure, but remain potentially viable, albeit with altered synaptic circuitry.
Footnotes
Acknowledgements
The authors thank Dr A El-Husseini for use of the Zeiss confocal microscope, Dr TC Saido for the 136kf α-spectrin antiserum, Dr T Momoi for the m3D175 antiserum, Ping Li for development of the MCAO stroke model and C Brown for statistical advice.
References
Supplementary Material
Please find the following supplemental material available below.
For Open Access articles published under a Creative Commons License, all supplemental material carries the same license as the article it is associated with.
For non-Open Access articles published, all supplemental material carries a non-exclusive license, and permission requests for re-use of supplemental material or any part of supplemental material shall be sent directly to the copyright owner as specified in the copyright notice associated with the article.