
Abstract
The manner in which fully mature peri-infarct cortical dendritic arbors remodel after stroke, and thus may possibly contribute to stroke-induced changes in cortical receptive fields, is unknown. In this study, we used longitudinal
Introduction
The branching patterns of a dendritic arbor are inexorably linked to its ability to functionally integrate synaptic inputs obtained from multiple sources (Spruston, 2008). As a result, progressive changes in the architecture of a dendritic arbor will determine the size and selectivity of the receptive field of that neuron. The topic of determining the manner by which dendritic arbors change over time has been subjected to intensive study and remains an important question. This is particularly true for understanding experience-dependent forms of cortical plasticity in which neuronal receptive fields change dramatically after manipulations of sensory experience (Buonomano and Merzenich, 1998; Fox, 2009; Gilbert and Wiesel, 1992; Kaas, 2000) or after focal ischemic stroke (Brown et al, 2009; Dijkhuizen et al, 2001; Nudo and Milliken, 1996; Winship and Murphy, 2008; Xerri et al, 1998).
Much of what is known about the structural dynamics of mature cortical dendritic arbors has been inferred from histologic examinations. The general consensus of histologic studies conducted in normal animals has been that once excitatory cortical pyramidal neurons mature (at 1 to 2 months of age in rodents), their arbors become relatively stable (Petit et al, 1988). These conclusions have recently been supported by longitudinal
Materials and methods
Animals
Two-to-three-month old male transgenic mice that expressed green fluorescent protein (GFP) predominately within cortical layer 5 neurons (GFP-M line) (Feng et al, 2000), were used in this study. All the mice were housed in standard laboratory cages and were given free access to food and water and kept on a 12-h light–dark cycle. All experiments were conducted according to the guidelines set by the Canadian Council for Animal Care.
Cranial Window Procedure
The surgical implantation of a glass cranial window was performed according to previously published procedures (Brown et al, 2009; Mostany and Portera-Cailliau, 2008; Trachtenberg et al, 2002). Mice were anesthetized with 1.5% isoflurane gas mixed in air, fitted into a custom-made stereotaxic frame. Body temperature was maintained at 371C using a rectal thermoprobe and a temperature feedback regulator. Using a high-speed dental drill, a circular region of the skull (∼3 to 4 mm diameter) was carefully thinned. HEPES-buffered artificial cerebral spinal fluid was applied to the skull intermittently to keep the skull moist and the brain cool after drilling. Once the skull became very thin (i.e., until transparent), fine-tipped surgical forceps were used to remove the piece of bone. The exposed brain was dabbed with a small piece of gel foam soaked in artificial cerebral spinal fluid to keep it moist. A 5-mm circular glass coverslip (no. 1 thickness) was placed over the exposed brain and fixed into place using dental cement and cyanoacrylate glue. Exceptional care was taken to minimize any contact between the brain and the dental cement. Mice were administered a single injection of 2% dexamethasone (intramuscularly, 0.02 mL) and were then returned to their home cages for 4 to 5 weeks before the first imaging session. Mice that showed any symptoms of brain damage such as beaded dendrites or loss of clarity in the imaging window before stroke were excluded from the study.
Photothrombotic Stroke
Unilateral ischemic stroke was induced in the somatosensory cortex using the photothrombotic method (Watson et al, 1985). This model of focal ischemic stroke was necessary for precisely targeting the region of cortex adjacent to where neurons had been imaged with high resolution before stroke. Briefly, mice were anesthetized with ketamine/xylazine (intraperitoneally100 mg/kg ketamine and 10 mg/kg xylazine), fitted into a stereotaxic frame, and placed under an epifluorescent microscope. To induce stroke, the forelimb cortex region was illuminated with green epifluorescent light using a 10 × objective (NA = 0.3) for 12 mins after an injection of 1% rose Bengal solution (intraperitoneally, 100 mg/kg, in phosphate-buffered saline).
Imaging and Data Collection
For chronic imaging of cortical dendritic arbors, mice were anesthetized with an injection of ketamine/xylazine (intraperitoneally, 100 mg/kg ketamine and 10 mg/kg xylazine) and fitted into a custom-made frame. This regime provided effective anesthesia for ∼1 h and was well tolerated by the mice. Using images of the surface vasculature combined with epifluorescence imaging, the same dendritic arbors could be easily identified from week to week.
High-resolution
Apical dendritic tufts were imaged to a depth of 150 to 200 μm below the pial surface. During each session, multiple image stacks were collected at 1.5 μm steps covering an area of 287 × 287 μm2 (1,024 × 1,024 pixels, 0.28 μm per pixel), averaging 2 images per section. As mice do not easily tolerate long bouts of anesthesia (enacted repeatedly over several weeks), and because individual apical dendritic tufts can extend laterally over several hundreds of microns, our imaging regime was designed specifically to sample a large volume of cortex. As such, our image stacks were not taken with sufficient resolution and to analyze dendritic spines (particularly small ones), which were examined in a previous study (Brown et al, 2009). All images shown in the figures were projected, cropped, and aligned using the Image J software.
Image stacks for each apical dendritic tuft were stitched together and traced in three dimensions using custom-written IgorPro software (Wavemetrics). Estimates of dendritic remodeling were based on measuring the length of dendritic branch tips over time (Lee et al, 2006). Only the most distal branch tips that were clearly visible and had a distinct point of origin (i.e., a branching point) were included in the analysis. Deeper primary and second-order apical dendrites were not included in the analysis, because they are often orientated directly perpendicular to the image plane, thus making an accurate assessment of their start and end points difficult because of poorer resolution in the axial plane.
Histology and Confocal Imaging
After the final imaging session, the location of the imaged dendrite was marked by placing a DiI-laden micropipette (0.5% in dimethyl sulfoxide) into the cortex. The mice were deeply anesthetized with an anesthetic and perfused transcardially with 10 mL of 0.1 mol/L phosphate-buffered saline, followed by 10 mL of 4% paraformaldehyde. The brains were transferred to 30% sucrose solution and cut into 40-μm-thick slices on a freezing microtome. Staining for the amino acid γ-aminobutyric acid (GABA) was used to identify inhibitory cortical interneurons and was performed according to previously published procedures (Lee et al, 2006). Briefly, sections were incubated overnight in 0.1 mol/L phosphate-buffered saline containing primary rabbit antibodies for GABA (polyclonal, 1:1,000, Sigma, St Louis, MO, USA), 0.2% Triton X-100, and 2% normal goat serum. The sections were then incubated with Alexa594-conjugated goat anti-rabbit sera (1:1,000, Molecular Probes, Eugene, OR, USA), mounted onto glass slides, and coverslipped.
Neurons imaged chronically
Statistics
All data are presented as means ± s.e. Statistical analyses were conducted using ANOVA (analysis of variance) with Bonferroni's multiple comparison
Results
Adult male mice that sparsely express GFP within subsets of excitatory cortical pyramidal neurons (2 to 3 months of age, GFP-M line; Feng et al (2000)) were implanted with a cranial glass window and kept in their home cages for 4 to 5 weeks before the first imaging session. Previous data from our laboratory (Brown et al, 2009) and those from others (Keck et al, 2008; Mostany and Portera-Cailliau, 2008) have shown that the cranial window preparation (after 4 weeks recovery) does not significantly enhance microglial or astrocyte activation, or alter dendritic spine turnover and functional sensory maps in the cortex. Typically, only 1to 2 neurons expressed GFP within the entire cranial window (∼3 mm in diameter), which allowed us to clearly identify the same neurons between each imaging session and image their entire apical dendritic arbor with minimal overlap from adjacent neurons. Sparse labeling meant that neurons could be easily identified in the postmortem brain tissue to determine which layer each neuron resided in (see Figure 1 for information regarding the laminar position of each neuron and number of imaging sessions). Histologic analysis showed that the imaged neurons that typically resided in layer 5 or 2/3, displayed classic features of excitatory cortical neurons such as a pyramidal-shaped soma, a prominent vertically oriented apical tuft, spiny basilar dendrites, and an absence of GABA immunostaining (see Supplementary data).
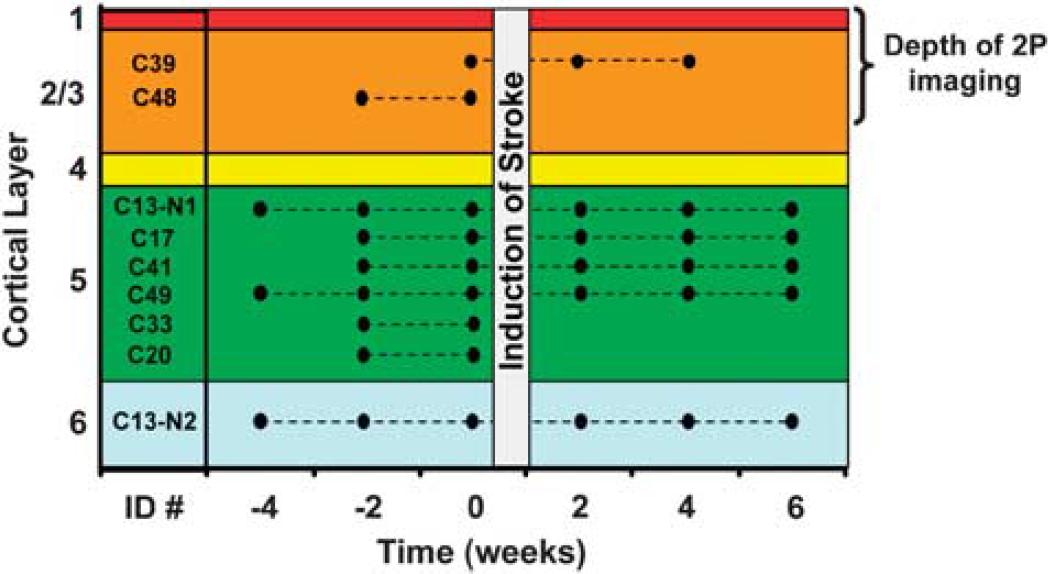
Summary of imaging sessions and laminar position of each neuron. Each mouse was assigned an arbitrary name (e.g., C39) and imaged every other week. Only one neuron was imaged in each mouse, except for mouse C13. Neurons were imaged for 2 to 4 weeks before, and up to 6 weeks after stroke. As one cannot control or predetermine the exact location of the infarct border, some imaged neurons were destroyed by the stroke (C20, 33, 48; resided within the infarct core) and therefore could not be imaged after stroke induction.
To provide a baseline estimate of structural plasticity, apical dendritic tufts were imaged for 2 to 4 weeks before the induction of stroke to a depth of 150 to 200 μm below the pial surface. Analysis of three-dimensional image stacks indicated that these dendrites were relatively stable before stroke (Figures 2A, 2C, and 2D), adding and retracting 35 ± 4 and 59 ± 10 μm of dendrites respectively, every 2 weeks. Totaling the absolute value of additions and retractions yielded an estimate of the total length remodeled, which for controls amounted to 94 ± 11 μm or 7% of the total dendrite length every 2 weeks. However, we should note that three-dimensional measurements possess a certain degree of error, which we accounted for by comparing measurements obtained before and after tilting the head of the mouse, or by repeated tracings of a dendrite imaged twice in the same day (see Supplementary data). Our analysis indicate that on average, ∼4.8 μm of error could be introduced for every 100 μm of dendrite measured. Considering an average tuft length of 1,275 ± 108 μm for all neurons (measured before stroke), ∼61 μm of dendritic remodeling could be attributed to measurement error (dashed lines in Figures 3E and 3G).
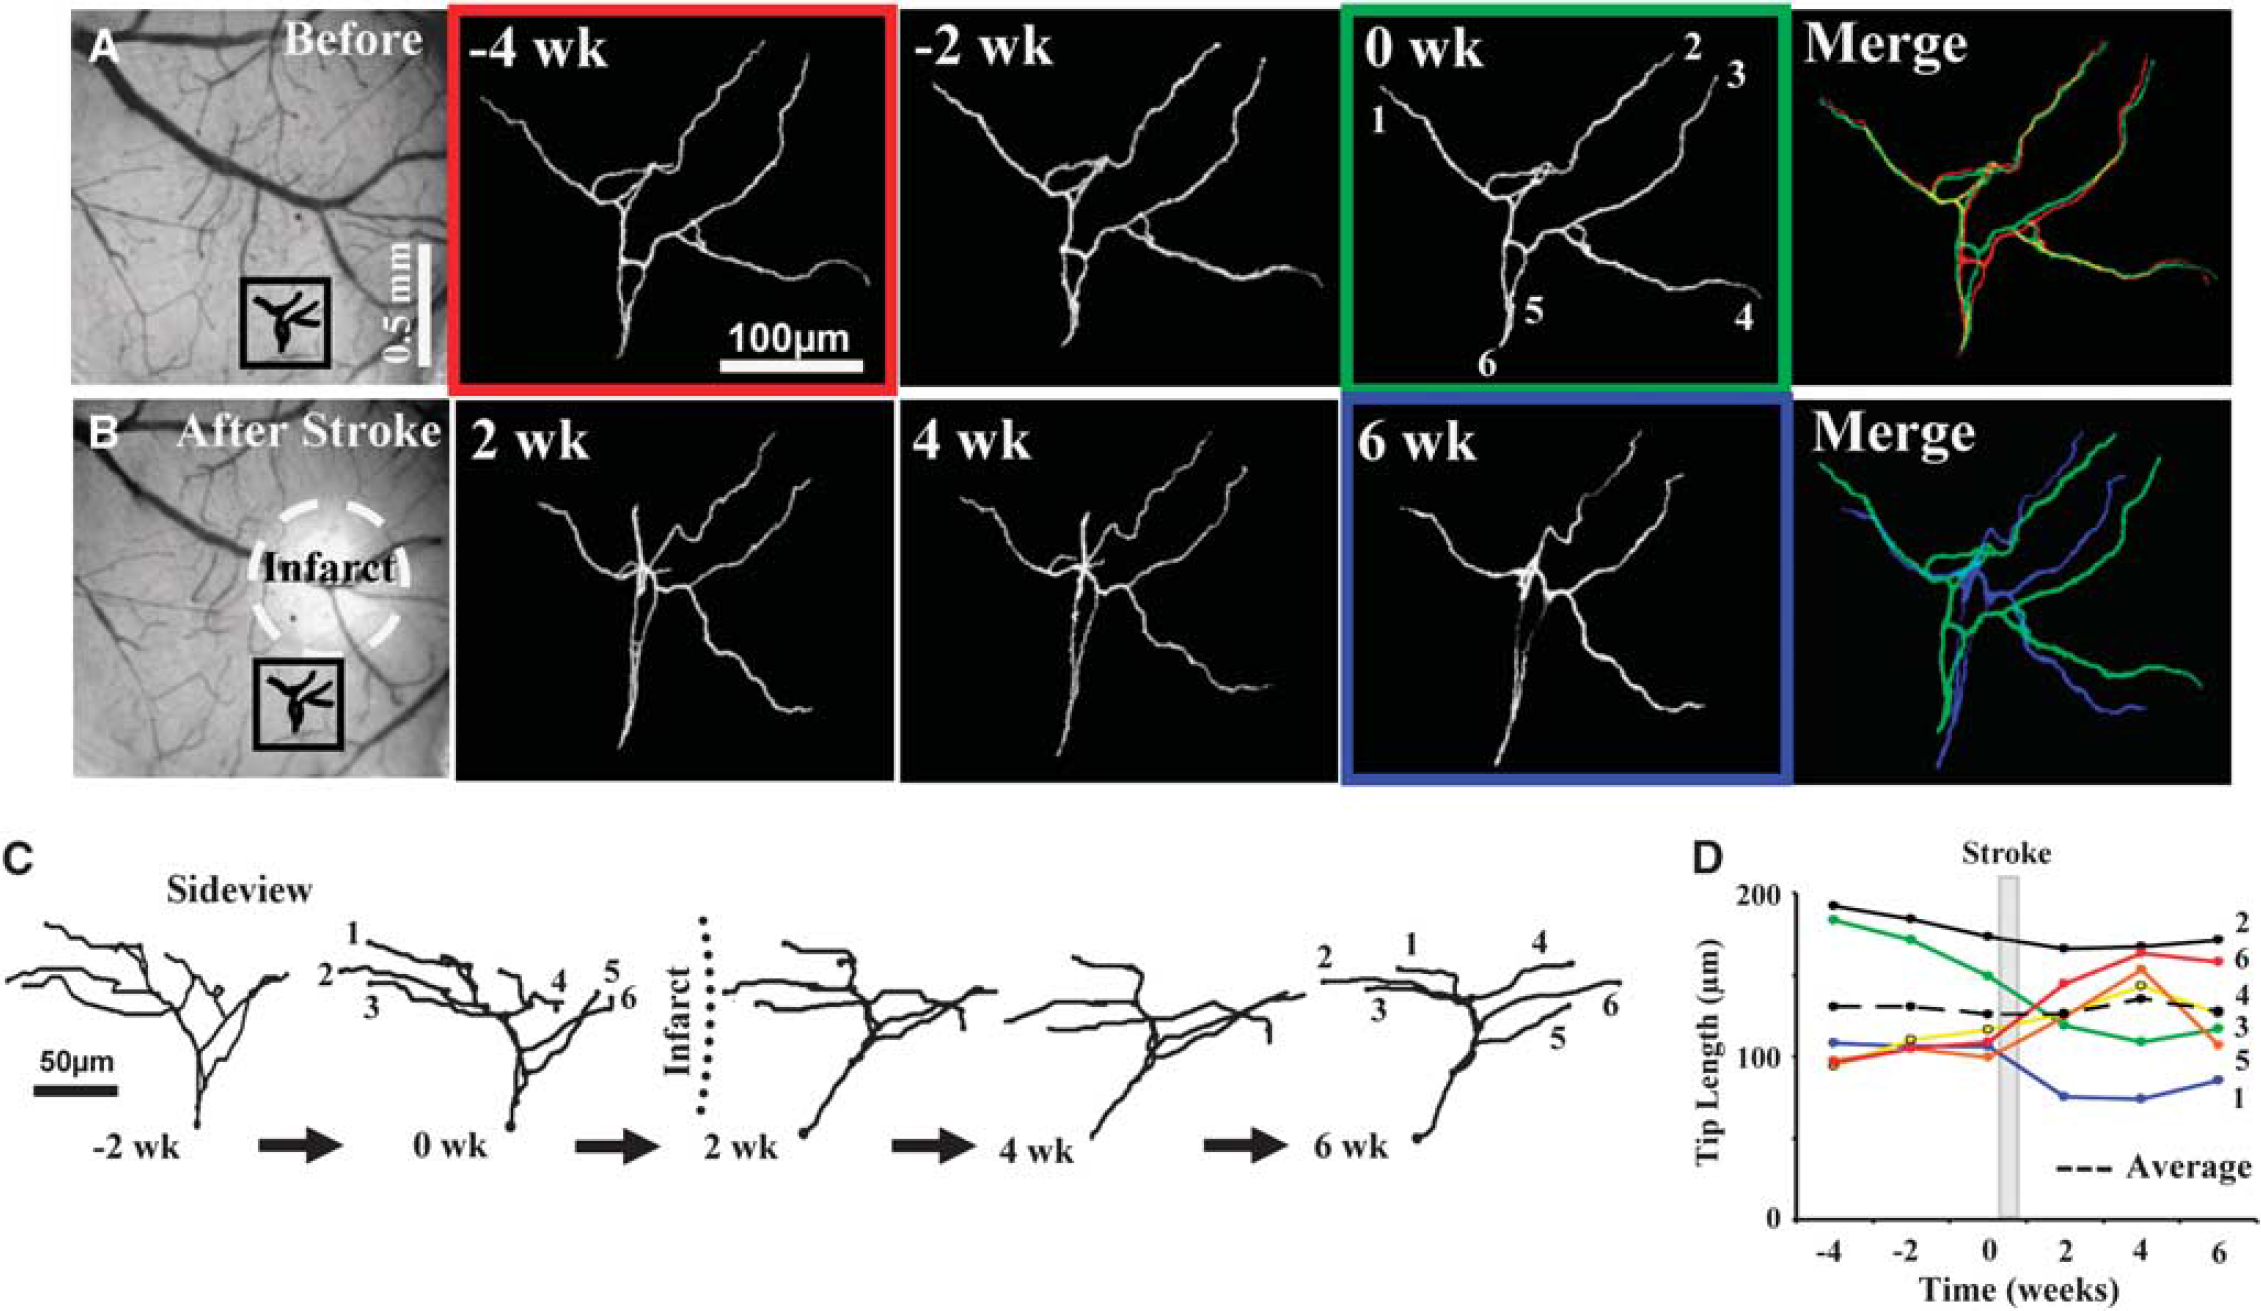
Arrangement of cortical dendrites before and after focal stroke. (
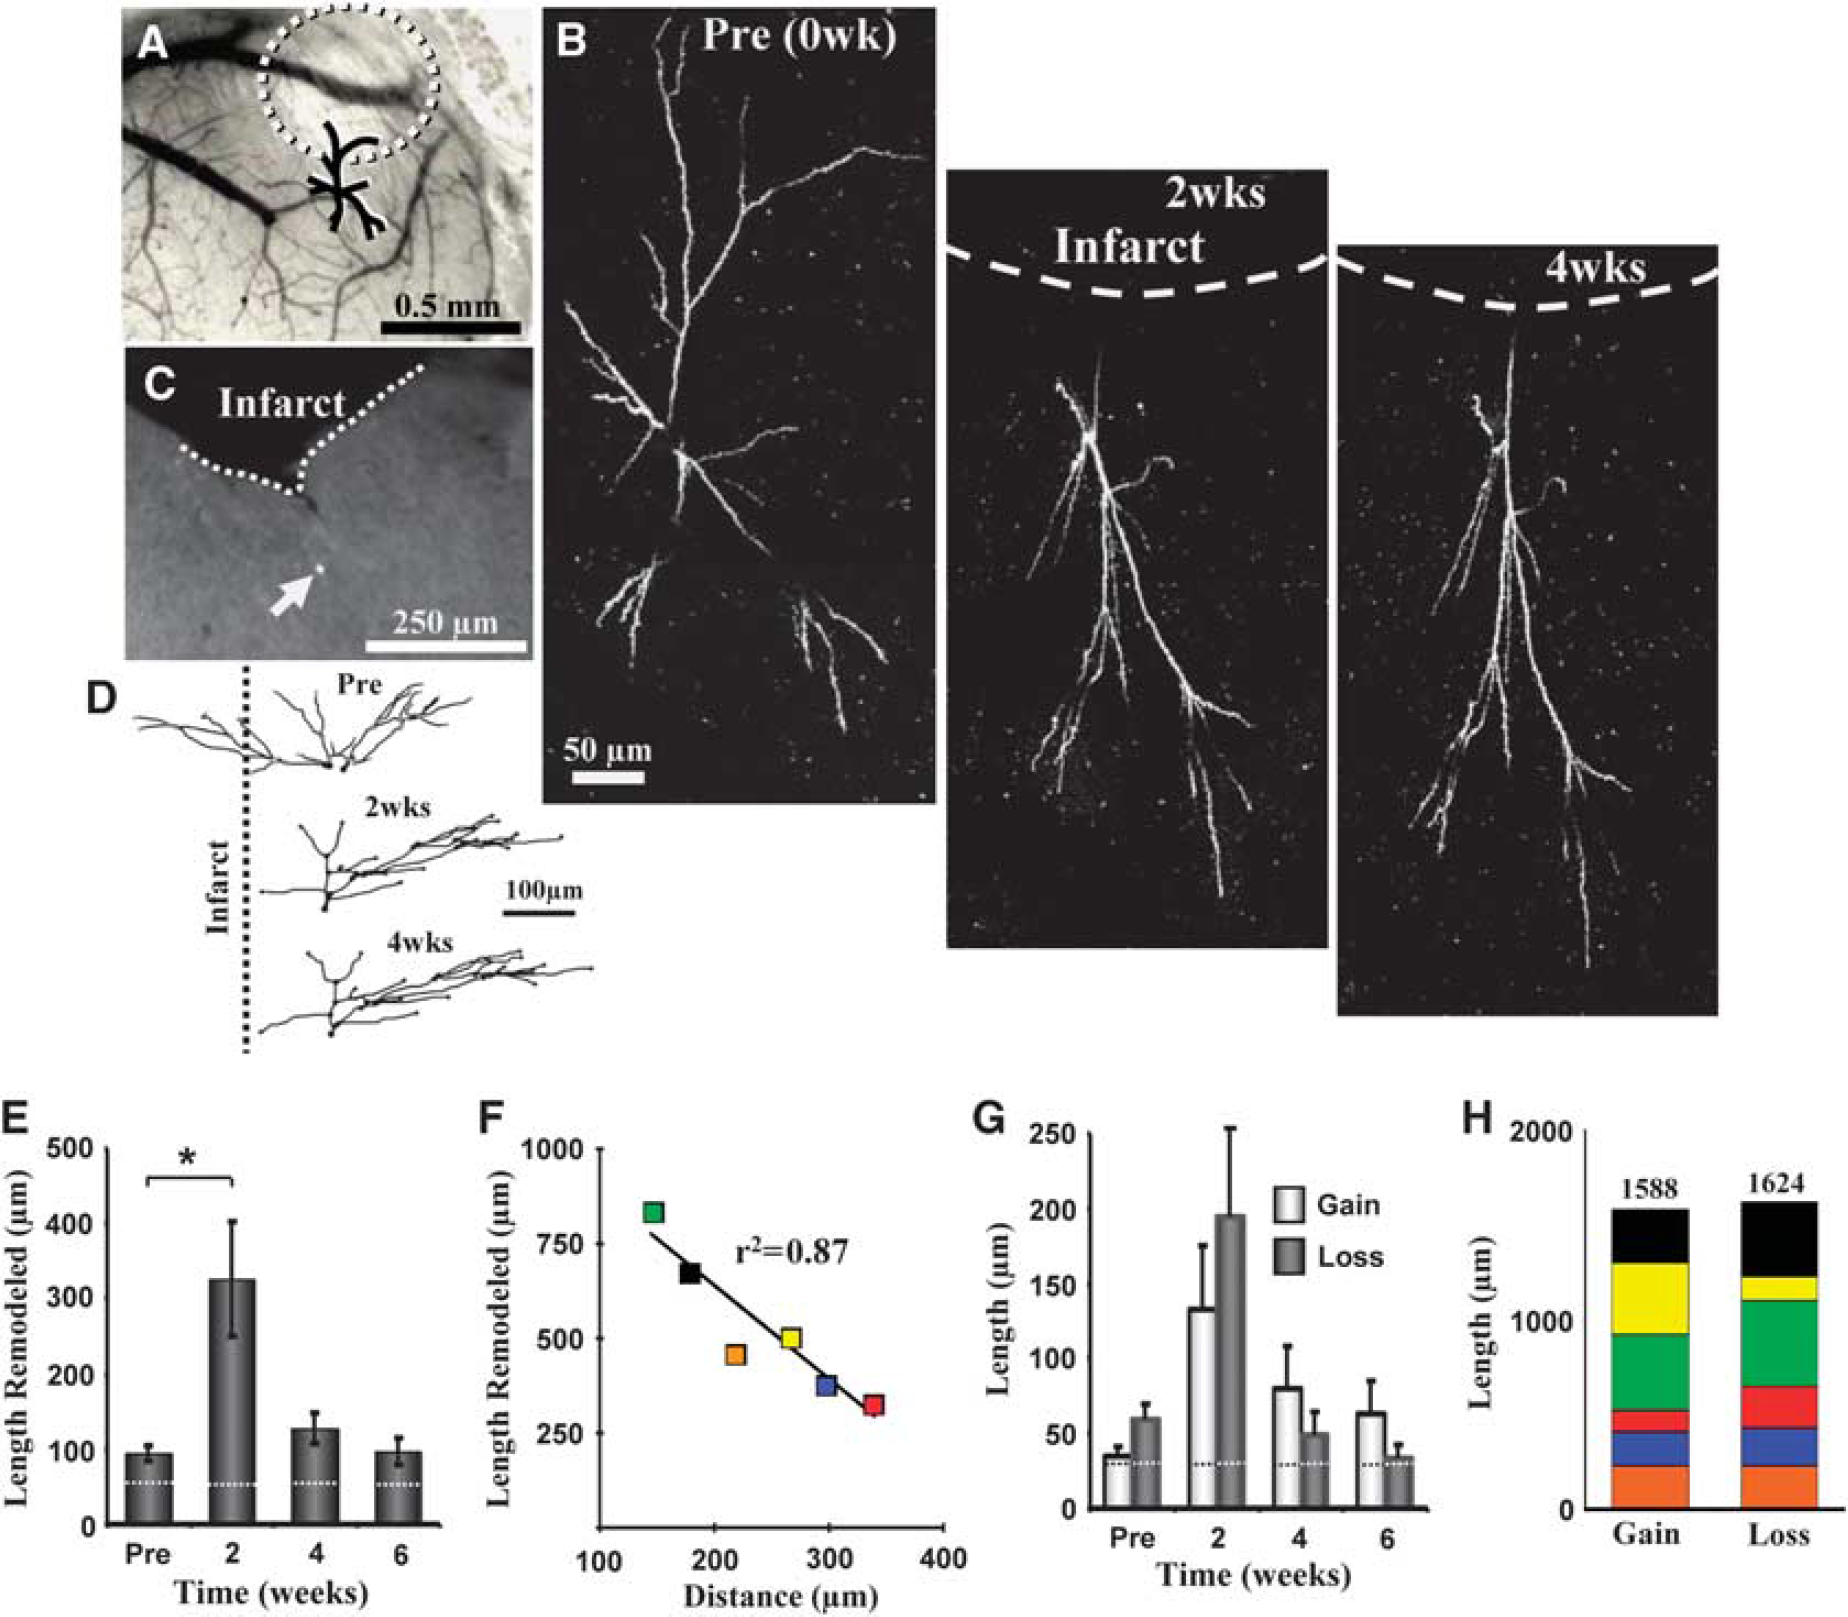
Remodeling of dendritic arbors after stroke. (
Given the relatively stable nature of cortical pyramidal neuron dendritic arbors (Chow et al, 2009; Lee et al, 2006; Mizrahi and Katz, 2003; Trachtenberg et al, 2002), we then examined whether focal ischemic stroke could trigger structural remodeling in these neurons. To do this, photothrombotic stroke was induced through the cranial window in the cortical territory adjacent to the imaged dendritic arbor (infarct size ∼580 ± 36 μm in diameter, the highly reflective tissue in Figures 2B and 3A must be noted). Consistent with previous work (Brown et al, 2008; Brown et al, 2009), the photothrombotic stroke extended down to layer 6 and the white matter. As one cannot precisely control the infarct size, only 6 of the 9 neurons imaged weeks before stroke were present afterwards. The apical dendrites of these neurons, all within 400 μm of the infarct border were imaged every 2 weeks for 4 to 6 weeks after stroke. The results of our study indicate that focal stroke notably altered the configuration of apical dendrites in the peri-infarct zone (Figures 2B, 2C and 3B, 3D). These peri-infarct neurons grew and retracted large segments of their apical tree over the 4-to-6-week recovery period (Figures 3A–3D, also see Figures 4A and 4B). Quantitative analysis of three-dimensional reconstructions was conducted to ensure that changes in the appearance of apical dendrites (shown in two-dimensional images) were due to changes in absolute length. Our analysis showed that stroke significantly increased the total length of dendrite that was remodeled per neuron (82 branches analyzed from 6 neurons, 5 different mice, F(3,22) = 8.4,
Previous histologic studies that examined dendritic plasticity in the contralesional hemisphere (Biernaskie and Corbett, 2001; Jones and Schallert, 1992), have shown that stroke preferentially favored a net growth of dendritic arbors. In this study, we discovered that in the peri-infarct zone or ipsilesional hemisphere, the average dendritic arbor length remained relatively constant over the 6-week recovery period (F(3,20) = 0.03,
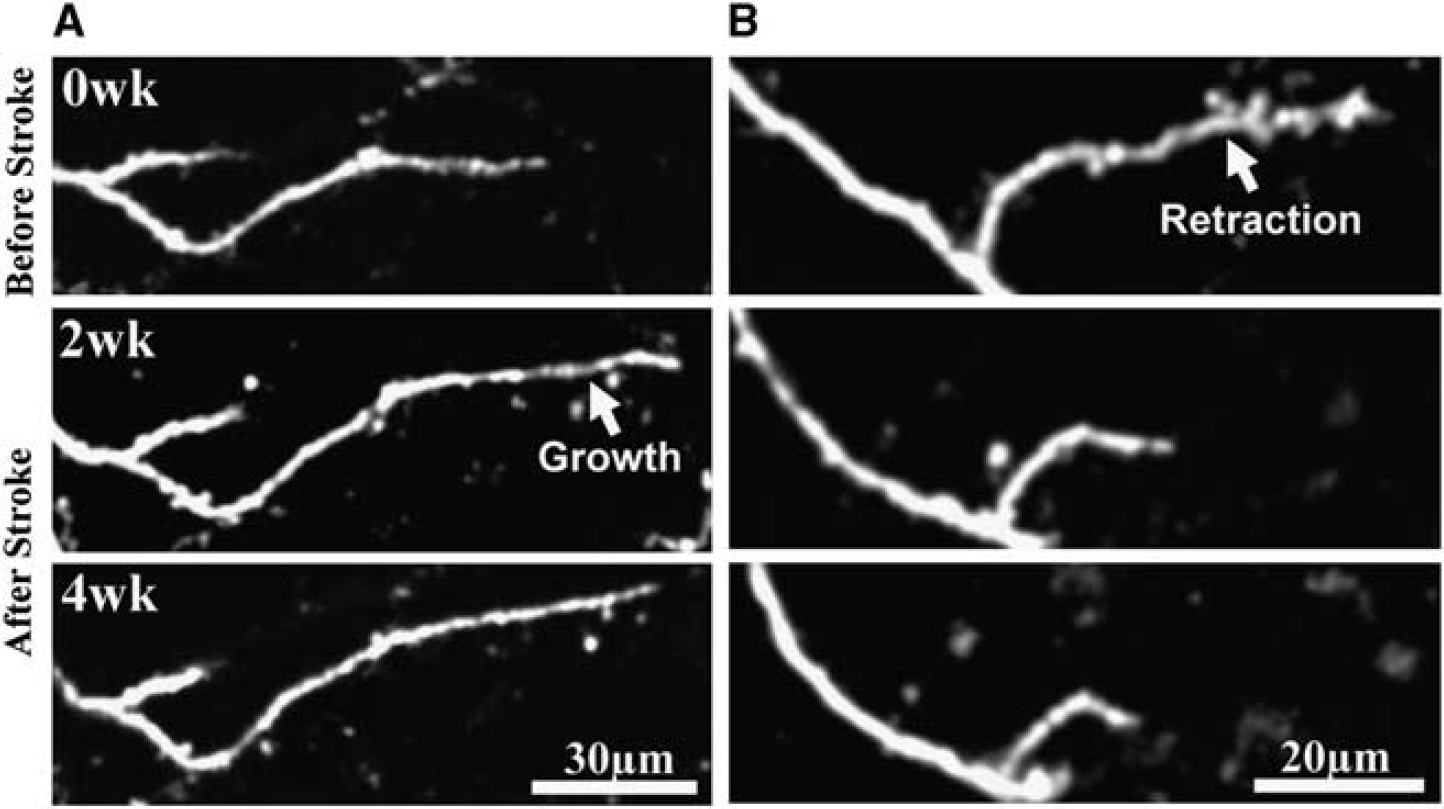
Examples of dendrite tip remodeling after stroke. (
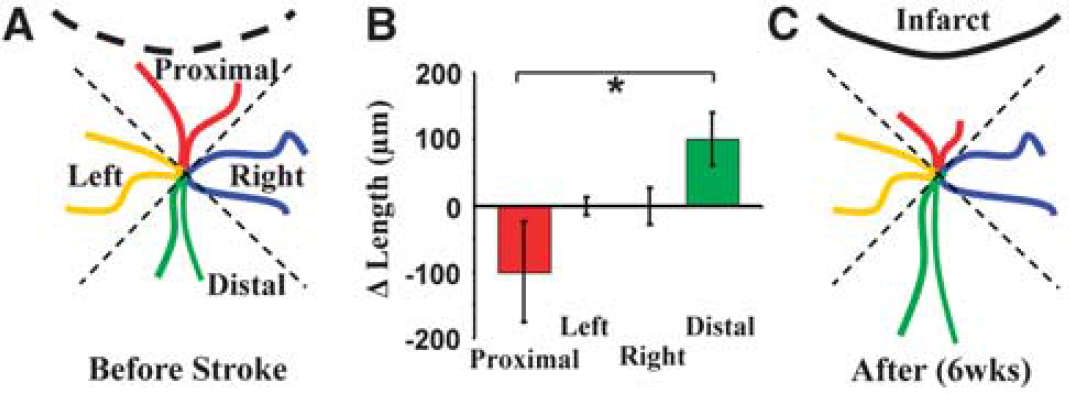
Region-specific remodeling of dendrites. (
Although previous histologic and acute imaging studies have shown that sensory deprivation or stroke can alter the overall appearance of mature dendrites (Brown et al, 2007; Hickmott and Steen, 2005; Tailby et al, 2005), direct time-lapse images, showing the process by which these structures change, are lacking. Therefore, we analyzed changes in the length of each dendritic branch tip over time and grouped each one according to their location relative to the infarct (four groups, see Figure 5A). Quantification of the average change in dendrite tip length per neuron showed a significant bias in growth patterns (F(3,20) = 3.26,
Discussion
It is a widely accepted fact that experience or injury-induced plasticity of mature cortical circuits is mediated through functional changes in synaptic communication (Buonomano and Merzenich, 1998; Fox, 2009; Nudo and Milliken, 1996) or remodeling of fine synaptic structures, such as dendritic spines (Brown et al, 2007; Keck et al, 2008; Zuo et al, 2005). To date, few studies have reported large-scale changes in the structure of mature dendritic arbors (particularly the apical tree), although histologic studies have reported changes in basilar dendrite complexity and orientation in response to enriched environments (Wallace et al, 1992), sensory deprivation (Hickmott and Steen, 2005; Tailby et al, 2005), and stroke (Biernaskie and Corbett, 2001; Gonzalez and Kolb, 2003; Jones and Schallert, 1992). One potential limitation of previous studies has been that they relied on static images of the neuronal structure (using Golgi–Cox staining or
Normally, the apical dendrites of pyramidal neurons are relatively symmetric (Larsen and Callaway, 2006; Larsen et al, 2007). Previous work from our laboratory examining Golgi—Cox-stained tissue (Brown et al, 2008) or single time-point imaging of dendrites after stroke (Brown et al, 2007) has shown that peri-infarct neurons become highly asymmetric with their arbors preferentially oriented away from the site of infarction. Unfortunately, these studies did not monitor individual dendritic arbors over several weeks, which left open the possibility that asymmetrically oriented dendritic trees may have had nothing to do with selective growth and retraction of tips, but rather, may have been caused simply by the rapid degeneration of arbors within the infarct core or by the collapsing of peri-infarct trees due to mechanical pressures. In this study, using three-dimensional reconstructions of chronically imaged dendritic trees, we provide direct evidence that peri-infarct dendrites do in fact grow preferentially away from the site of infarction, whereas dendrites oriented toward the infarct progressively shorten. In light of previous data showing that the border between the intact and dying tissue is established relatively quickly after photothrombotic stroke (within several hours to a few days (Zhang and Murphy, 2007)), it would seem unlikely that the retraction of dendritic tips over several weeks simply reflects ischemia-induced degeneration of dendrites that extends into the infarct core. This is especially true, given that only 4 branch tips out of 82 tips analyzed (average of 13.67 tips per neuron after stroke) extended toward the infarct core and were no longer present 2 weeks after stroke. Even if these tips were not included in the analysis, the amount of remodeling after stroke is still highly significant relative to prestroke values (F(3,22) = 11.6,
Green fluorescent protein is expressed in only a small fraction of cortical neurons. This expression pattern raises the possibility that there may be something unique about this population of fluorescently labeled pyramidal cells. From an anatomic perspective, GFP- or yellow fluorescent protein (YFP)-labeled cortical neurons (under the Thy-1 promoter) have a dendritic morphology and spine structure (e.g., spine length and density; (Enright et al, 2007; Holtmaat et al, 2009)) that is comparable with cortical pyramidal neurons identified with Golgi–Cox, biocytin staining, or viral transfection (Brown et al, 2008; Larsen and Callaway, 2006; Larsen et al, 2007; Nimchinsky et al, 2001). Similarly, mapping of local circuits with laser scanning photostimulation has shown that GFP-positive cortical neurons in layer 5 receive synaptic inputs that are indistinguishable from non-GFP-positive cortical neurons (Holtmaat et al, 2005). However, with increasing recognition of cellular diversity in the cerebral cortex, even within pyramidal-shaped neurons of the same layer, it is possible that GFP/YFP-positive pyramidal cells shown in this study may not behave identically to other pyramidal neurons. Indeed, a recent study has shown that YFP-positive pyramidal cells in layer 5 have excitatory inputs and spiking properties that differ from non-YFP-positive layer 5 neurons (Yu et al, 2008).
One particularly intriguing aspect of our data was that large-scale structural renovations proceeded in a balanced manner. The fact that total dendritic length within individual neurons did not change significantly over time, despite a threefold increase in dendrite remodeling, suggests that mature cortical neurons may possess an intrinsic mechanism that conserves the total amount of space each neuron occupies. Although this type of homeostasis has been postulated in previous studies that measured dendritic features in Drosophila embryos (Tripodi et al, 2008) and postmortem sections of the hippocampus (Samsonovich and Ascoli, 2006), our data are the first to directly visualize this phenomenon within individual neurons
Footnotes
Acknowledgements
The authors thank PuMin Wang for surgical expertise, Albrecht Sigler for assistance with computer programming, and Heidi Erb for managing the mouse colony. This work was supported by operating grants to T.H.M. and the In Vivo Imaging Centre from the Canadian Institutes of Health Research (CIHR) and a Grant in Aid from the Heart and Stroke Foundation of British Columbia and the Yukon.
The authors declare no conflict of interest.