
Abstract
Brain function requires oxygen and maintenance of brain capillary oxygenation is important. We evaluated how faithfully frontal lobe near-infrared spectroscopy (NIRS) follows haemoglobin saturation (SCap) and how calculated mitochondrial oxygen tension (PMitoO2) influences motor performance. Twelve healthy subjects (20 to 29 years), supine and seated, inhaled O2 air-mixtures (10% to 100%) with and without added 5% carbon dioxide and during hyperventilation. Two measures of frontal lobe oxygenation by NIRS (NIRO-200 and INVOS) were compared with capillary oxygen saturation (SCap) as calculated from the O2 content of brachial arterial and right internal jugular venous blood. At control SCap (78% ± 4%; mean ± s.d.) was halfway between the arterial (98% ± 1%) and jugular venous oxygenation (SVO2; 61% ± 6%). Both NIRS devices monitored SCap (P < 0.001) within ~5% as SvO2 increased from 39% ± 5% to 79% ± 7% with an increase in the transcranial ultrasound Doppler determined middle cerebral artery flow velocity from 29 ± 8 to 65 ± 15 cm/sec. When SCap fell below ~70% with reduced flow and inspired oxygen tension, PMitoO2 decreased (P < 0.001) and brain lactate release increased concomitantly (P < 0.001). Handgrip strength correlated with the measured (NIRS) and calculated capillary oxygenation values as well as with PMitoO2 (r > 0.74; P < 0.05). These results show that NIRS is an adequate cerebral capillaryoxygenation-level-dependent (COLD) measure during manipulation of cerebral blood flow or inspired oxygen tension, or both, and suggest that motor performance correlates with the frontal lobe COLD signal.
Introduction
Cerebral function depends on an uninterrupted oxygen (O2) delivery. The cerebral O2 reserve is low as illustrated by the immediate loss of consciousness with arrested cerebral blood flow (CBF) since the effect cannot be explained by depletion of intermediary metabolites (Gjedde, 2005). It is therefore important that CBF is maintained in situations with low blood pressure, reduced arterial carbon dioxide (CO2) tension (PaCO2), or reduced central blood volume (Madsen et al, 1995). Blood-oxygenation-level-dependent evaluations of CBF are important to imaging studies of brain function (Silva et al, 1999), whereas the capillary-oxygen-level-dependent (COLD) control of brain oxygen diffusion is the basis for an emerging understanding of the neuroenergetics of brain function (Gjedde, 2005). Capillary oxygenation can be monitored noninvasively by near-infrared spectroscopy (NIRS) in real-time during situations ranging from surgery (Skak et al, 1997) to strenuous whole body exercise (Nielsen et al, 2001).
The NIRS monitors haemoglobin oxygenation in tissue (Jobsis, 1977) and confirms the COLD-related increase of haemoglobin oxygenation observed by functional magnetic resonance imaging (Strangman et al, 2002), for example, during rhythmic handgrip or moderate whole body exercise. The increase in NIRS oxygenation parallels that of regional cerebral perfusion detected by transcranial Doppler in several clinical situations (Ide et al, 1999; Madsen and Secher, 1999). Likewise, both the middle cerebral artery mean flow velocity (MCA Vmean) and NIRS determined frontal lobe oxygenation decrease during maximal exercise in response to lowered arterial O2 tension (PaO2) and PaCO2 (Imray et al, 2005; Nielsen et al, 1999), during standing (Harms et al, 2000; van Lieshout et al, 2001), and during head-up tilt induced hypovolaemic shock (Madsen et al, 1995).
Near-infrared spectrometry determined capillary oxygenation is functionally related to the balance between SaO2 and SvO2. It is unknown whether the measured oxygenation in brain tissue faithfully reflects the average brain capillary oxygenation as a function of the arterial oxygenation (SaO2) and of venous blood draining to the internal jugular vein (SvO2). To resolve this issue, assessment of the relative contributions of O2 saturation of arterial and venous blood to the spectroscopically derived value is required. Both fixed, for example, 25% arterial and 75% venous (Pollard et al, 1996), and variable ratios (Watzman et al, 2000) have been used to estimate average capillary brain oxygenation. The relative magnitude of the arterial, capillary, and venous components of the total human cerebral blood volume remains unknown and the effect of changes in CBF on oxygenation of the brain is incompletely understood (Ito et al, 2005; Watzman et al, 2000). Positron emission tomography reveals an increase in the arterial blood volume fraction when CBF increases (Ito et al, 2005) while NIRS, indirectly, shows that the arterial fraction decreases (Watzman et al, 2000).
It is the primary hypothesis of this study that NIRS monitors the cerebral capillary O2 saturation (SCap). The study compared capillary oxygenation (SCap) in the frontal lobe calculated from the venous and arterial O2 content and the blood flow velocity in the MCA to values obtained by NIRS. A second aim of the study was to test a hypothetical effect of postural collapse of the internal jugular veins (Dawson et al, 2004; Gisolf et al, 2004) on brain SvO2. To these purposes, CBF and capillary oxygenation were manipulated by varying the O2 and CO2 fractions of the inspired gas mixture in both the supine and the seated body position. A third aim was to determine changes of cerebral/brain capillary oxygenation and calculated mitochondrial tensions in relation to motor neuron activity. This function of the central nervous system was tested by maximal isometric handgrip and rapid finger movements (mouse clicking). Finally, we tested whether capillary oxygenation in skeletal muscle and bone oxygenation react to changes of PaCO2 and SaO2.
Methods
Eleven young, healthy men and one woman (mean age of 24 ± 3 years (s.d.), height 182 ± 8 cm and weight 77 ± 10 kg) participated in the study. The subjects gave informed written consent to the study as approved by the ethics committee of Copenhagen and Frederiksberg (KF 01-263/04).
Experimental Design
Under local anaesthesia (lidocain, 2%) subjects received a retrograde catheter in the right internal jugular vein with the Seldinger technique (1.6 mm, 14 gauge; ES-04706, Arrow International, PA, USA), guided by ultrasound and advanced to the bulb of the vein. Arterial blood was drawn from a catheter in the brachial artery (1.1 mm, 20 gauge) of the nondominant arm. The internal jugular venous pressure was measured with a transducer (Edwards Life Sciences, Irving, CA, USA) placed at a height corresponding to the tip of the catheter and mean arterial pressure was measured with a similar transducer at the level of the heart. Blood pressure data were interfaced with a Dialogue-2000 (IBC-Danica, Denmark), sampled at 100 Hz (DI-720, Dataq, OH, USA) and stored on disk. Furthermore, the arterial pressure waveform was analysed for changes in left ventricular stroke volume and heart rate using Modelflow software (Beatscope, BMI-TNO, The Netherlands). The stroke volume was computed by simulation of a nonlinear, time-varying model of the aortic input impedance (Bogert and van Lieshout, 2005) and cardiac output was the product of stroke volume and heart rate. Modelflow tracks changes cardiac output with a ~2% accuracy (Harms et al, 1999).
Measures of capillary frontal lobe oxygenation from one (n = 8) or both (n = 4) cerebral hemispheres were obtained by NIRS with two different probes (SNIRO; NIRO-200, Hamamatsu, Japan and SINVOS; INVOS, Somanetics, Troy, MI, USA). Both assume a homogeneous medium and use spatially resolved spectroscopy coupled to an analytical solution of the diffusion equation (Suzuki et al, 1999). Both machines also use an internal calibration either derived independently from the pathway length of the infra-red light (NIRO) or from a direct measurement of the pathway length (INVOS). The devices were placed over separate hemispheres in a counter-balanced order for eight subjects. Mean O2 saturation was computed as the average of the SINVOS and SNIRO values and expressed either as SNIRS or reported for each hemisphere (SLeft and SRight, respectively). The arterial to venous cerebral blood volume fraction was derived from SNIRS using the method introduced by Watzman et al (2000). Figure 1 shows the placement of the probe and the travel of infra-red light through the tissue. The changes in total haemoglobin, as the sum of oxy- and deoxygenated haemoglobin, relative to the values obtained at start-up, was obtained as a measure of cerebral blood volume under the optodes.
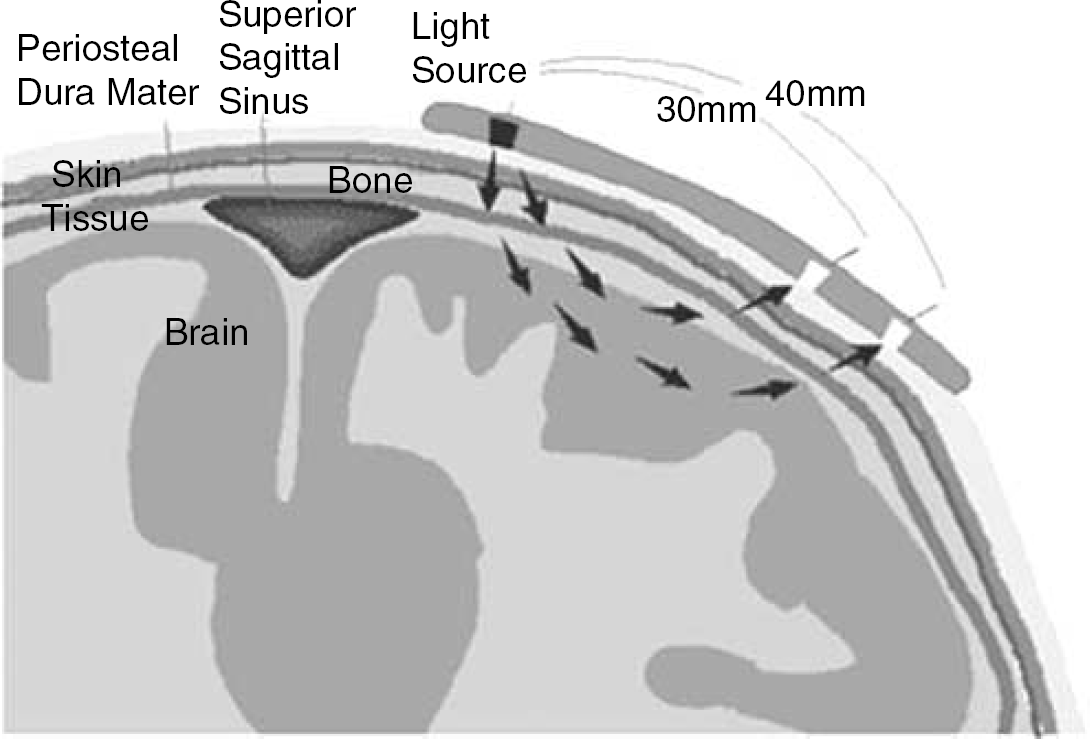
Schematic cut of the frontal lope in the sagital plane. Only a fragment of the emitted near infra-red light will reach the optodes due to scattering of the photons as they traverse the tissue from the emitter to two receiving optodes located 30 and 40 mm from the emitter (Courtesy of Somanetics Inc.).
To evaluate the CO2 reactivity of other tissues as well as to consider the influence of PaO2 on tissue oxygenation, NIRS was also recorded with the NIRO-200 from the dorsal flexor muscle compartment of the dominant forearm (SMus) and from the tibia bone of the right leg (SBone) measured ~10 cm distally to the patella tendon. To indicate gross changes in forearm muscle temperature the forearm skin temperature was recorded with an infrared thermometer (OS530HR, OMEGA Engineering, CT, USA) in six subjects at the end of each trial.
The MCA Vmean was monitored beat-to-beat by transcranial Doppler (Transcan, EME, Überlingen, Germany) for evaluation of CBF. The position with the best signal—noise ratio at the proximal part of the MCA was selected and the vessel insonated at a depth of 40 to 60 mm with the probe secured with a headband. MCA Vmean was computed from the integral of the maximum frequency Doppler shifts over one heartbeat. When interpreting Doppler velocity data a major assumption is an unchanged calibre of the insonated vessel. Serrador et al (2000) and Bradac et al (1976) showed no variation in vessel diameter with changes in PaCO2 and it appears that the CBF is regulated distally to the MCA. Although some effect of PaCO2 on vessel diameter cannot be excluded (Valdueza et al, 1999), we consider that changes in MCA velocity in response to changes in PaCO2 reliably correlate with changes in 133Xenon determined CBF response to PaCO2 obtained by direct and indirect measurements (Jørgensen, 1995).
Posture
Resting in the supine position, the subjects were asked to inhale air-mixtures with three O2 fractions, with and without 5% CO2 added from a partially water-filled Douglas-bag, or they were asked to hyperventilate, that is, increase their ventilation three to four times, with verbal feedback provided (Table 1; evaluations made in the listed order). The subjects breathed through a mouthpiece connected to an online gas analyser (CPX/D, MedGraphics, St Paul, MN, USA), which recorded breath-by-breath pulmonary ventilation. The body position was then changed from supine to seated, with a 45° support for the upper body, and the measurements were repeated. For each intervention 5 to 10 mins was allowed before measurements were obtained. At the end of each intervention, blood was sampled in preheparinized syringes and analysed immediately for SaO2, SvO2, and the total O2 content, including physically dissolved oxygen (caO2; cvO2, respectively) as well as PaCO2 using a combined blood gas machine and co-oximeter (ABL 725, Radiometer, Copenhagen, Denmark) including an evaluation of CO-haemoglobin that was excluded from the calculation of the O2 content.
MCA Vmean, blood gas, and NIRS variables with the estimated capillary oxygen saturation (SCap)
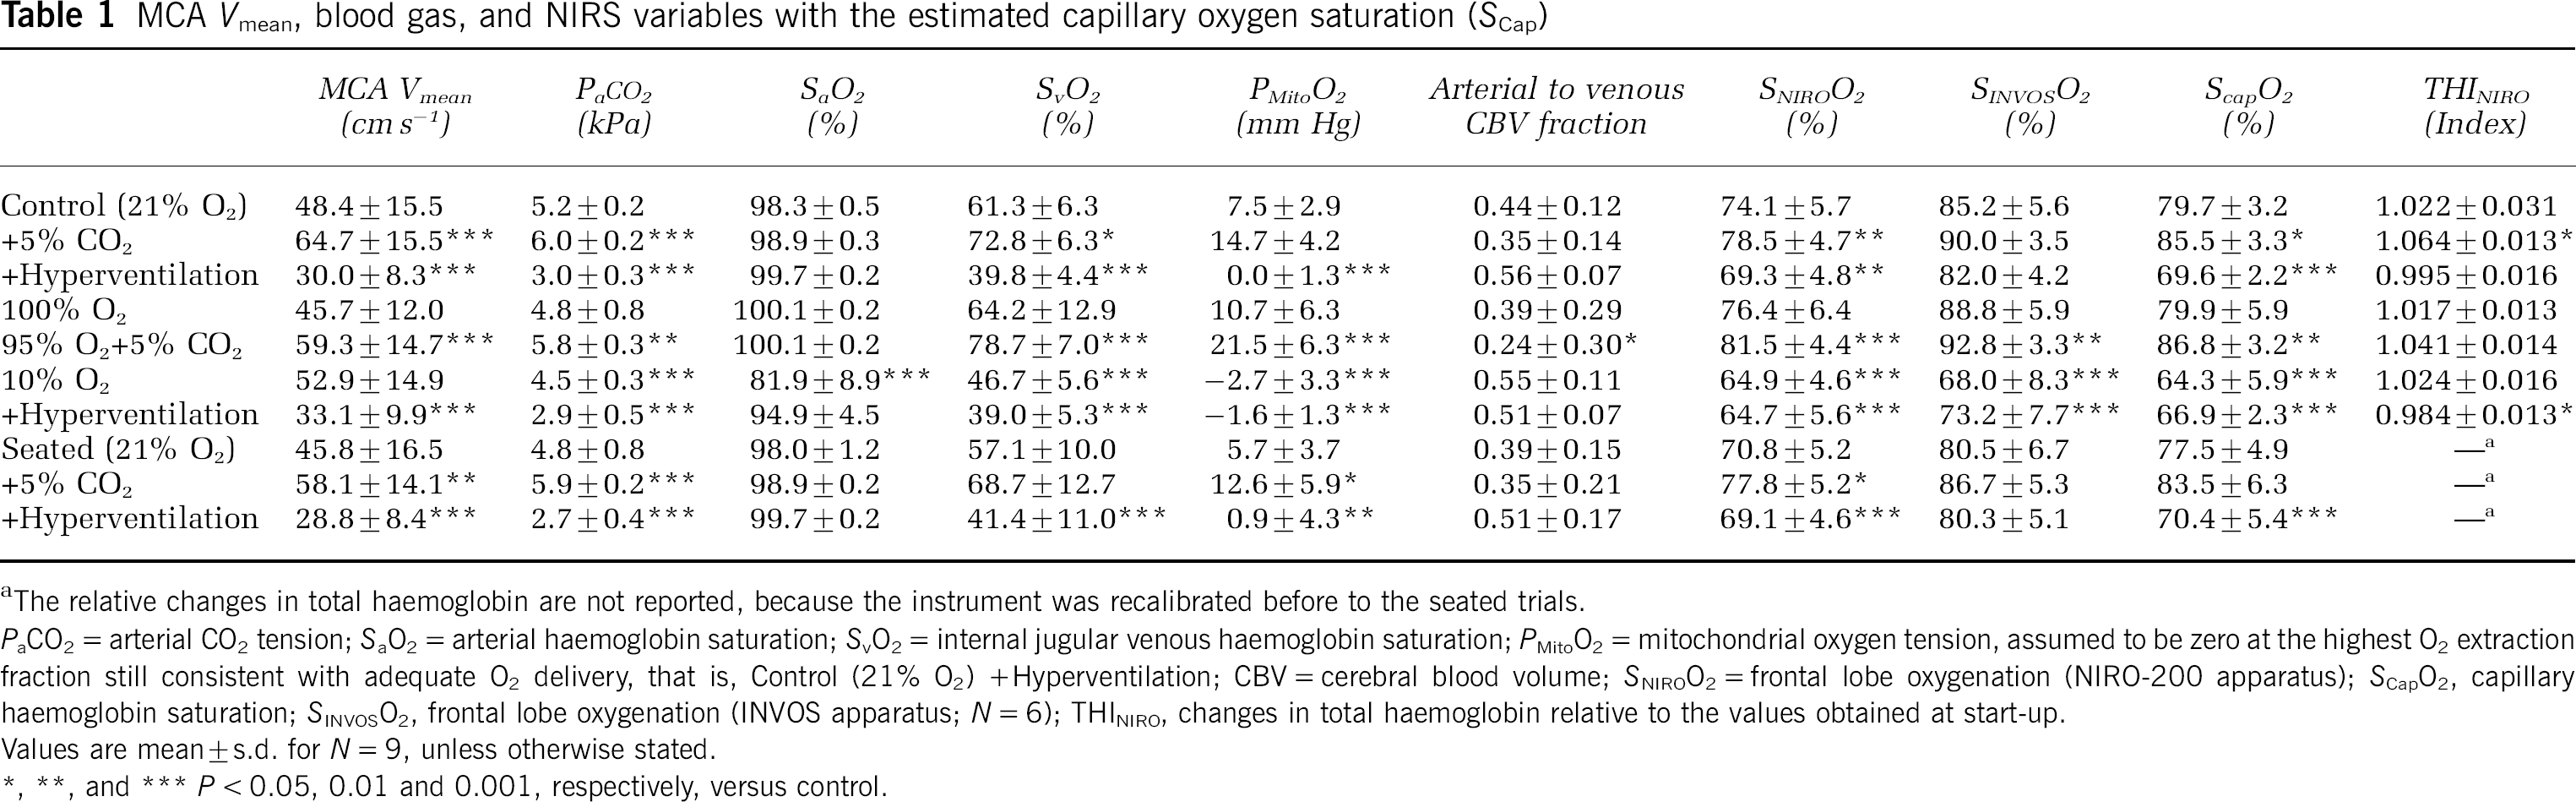
The relative changes in total haemoglobin are not reported, because the instrument was recalibrated before to the seated trials.
PaCO2 = arterial CO2 tension; SaO2 = arterial haemoglobin saturation; SvO2 = internal jugular venous haemoglobin saturation; PMitoO2 = mitochondrial oxygen tension, assumed to be zero at the highest O2 extraction fraction still consistent with adequate O2 delivery, that is, Control (21% O2) +Hyperventilation; CBV = cerebral blood volume; SNIROO2 = frontal lobe oxygenation (NIRO-200 apparatus); SCapO2, capillary haemoglobin saturation; SINVOSO2, frontal lobe oxygenation (INVOS apparatus; N = 6); THINIRO, changes in total haemoglobin relative to the values obtained at start-up.
Values are mean ± s.d. for N = 9, unless otherwise stated.
P < 0.05, 0.01 and 0.001, respectively, versus control.
Motor Activation
To evaluate the effect of changes in cerebral capillary oxygenation on motor activation a ~4 sec maximal isometric voluntary handgrip contraction (MVC) was performed immediately after blood sampling and the maximal force reported. To realize fast twitch fibre activation, a 5 sec maximal mouse click frequency task was repeated three times and the median frequency reported.
Calculations
Using the formalism developed previously (Gjedde, 2005; Gjedde et al, 2005), the SCap was calculated as
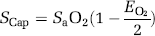
where the O2 extraction fraction (EO2) is
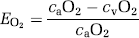
and combining (1) and (2) yields:
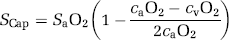
The approach based on the extraction fraction is motivated by the fundamental assumption first introduced by Kety (1957) and iterated by Weibel (1984) that the O2 extraction rises linearly with distance as the blood traverses the capillary network from arterial to venous end, because the capillary geometry is such that all segments of the capillary bed satisfy coequal amounts of brain tissue. The dissolved O2 accounts for less than 2% of the total oxygen O2 (0.12 mmol/L at 100 mm Hg PO2) and was disregarded in relation to oxygen availability. Equation 3 can then be simplified to
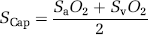
which (unlike Equation 1), is exact also when dissolved oxygen is included in the consideration. Solution of the Hill equation of O2 saturation yielded the mean capillary O2 tension (PCap),
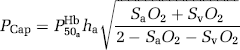
where P50aHb is the PO2 when haemoglobin is half-saturated (26 mm Hg) and ha is Hill's coefficient (2.84 for arterial blood).
Changes in CBF and cerebral O2 consumption (JO2) were derived from MCA Vmean and the cerebral arterial-venous difference for O2 assuming an unchanged calibre of the MCA (Bradac et al, 1976; Serrador et al, 2000) with supine resting mean CBF set at 46 mL 100 g−1 min−1 (Madsen et al, 1993).
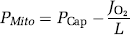
Because of the absence of capillary recruitment in the brain, O2 diffusibility (L) was assumed constant at any measured blood flow level (Gobel et al, 1989). The diffusibility was calculated at the highest O2 extraction fraction still consistent with adequate O2 delivery, assuming mitochondrial oxygen tension (PMito) to be zero. Thus, L was calculated as the value associated with the measured O2 consumption and PCap

for the condition in which mitochondrial oxygen was assumed to be zero. The PMito was then
Analysis
The bias was defined as the mean difference between SCap and either the SNIRO or the SINVOS. The range of agreement was the mean bias ±1.96 s.d. (Bland and Altman, 1986). The variance of the jugular venous O2 content and the NIRS-derived oxygenation in the seated and supine positions were calculated to evaluate the relevance of jugular venous blood sampling with a potential reduced representation of cerebral metabolism when in the seated position venous drainage is redirected to spinal vessels (Alperin et al, 2005; Epstein et al, 1970).
Data are presented as mean ± s.d. and Pearson's correlation analysis was used to evaluate associations between variables. One-way repeated-measures ANOVA followed by Bonferroni post hoc evaluation for multiple comparisons were used to identify differences across trials. Two- and three-way ANOVAs were used to examine the effect of position and method on sampling variance. Stepwise forward-regression analysis was used to test the strength of the association between MVC and median click frequency as the dependent variables and SMus, SNIRS, and PMito as well as forearm skin temperature as independent variables. The parameters were entered into the forward-regression analysis if a change was identified with a one-way repeated measures ANOVA across trials. All regression analyses were made on the average values across subjects and a P-value of 0.05 was considered statistically significant (SigmaStat, Build 3.0, SPSS Inc., IL, USA).
Results
In all but two subjects, SvO2 fell below 40% during hyperventilation with hypoxia. In two subjects SvO2 did not decrease below ~60% with low correlation coefficients between SCap and SNIRS (r < 0.8; P > 0.05), suggesting jugular vein collapse with blood O2 saturation not being representative for brain SvO2 and these data were excluded from the analysis. A third subject was excluded because of incomplete data acquisition. Thus, data are presented from nine subjects with paired NIRO and INVOS data from six subjects (Table 1).
Effects of O2 and Carbon dioxide
The SvO2 was varied from 39.0% ± 5.3% to 78.8% ± 7.0% as SaO2 ranged from 81.9% ± 8.9% to 100.1% ± 0.2%, PaCO2 from 2.7 ± 0.4 to 6.0 ± 0.2 kPa and MCA Vmean from 28.8 ± 8.4 to 64.7 ± 15.5 cm/sec, with SNIRS ranging from 64.9% ± 6.0% to 84.9% ± 7.6% and SCap from 64.3% ± 5.9% to 86.8% ± 3.2% (Table 1). The changes of NIRS estimates of total frontal lobe haemoglobin correlated with PaCO2 (r2 = 0.92; P < 0.001).
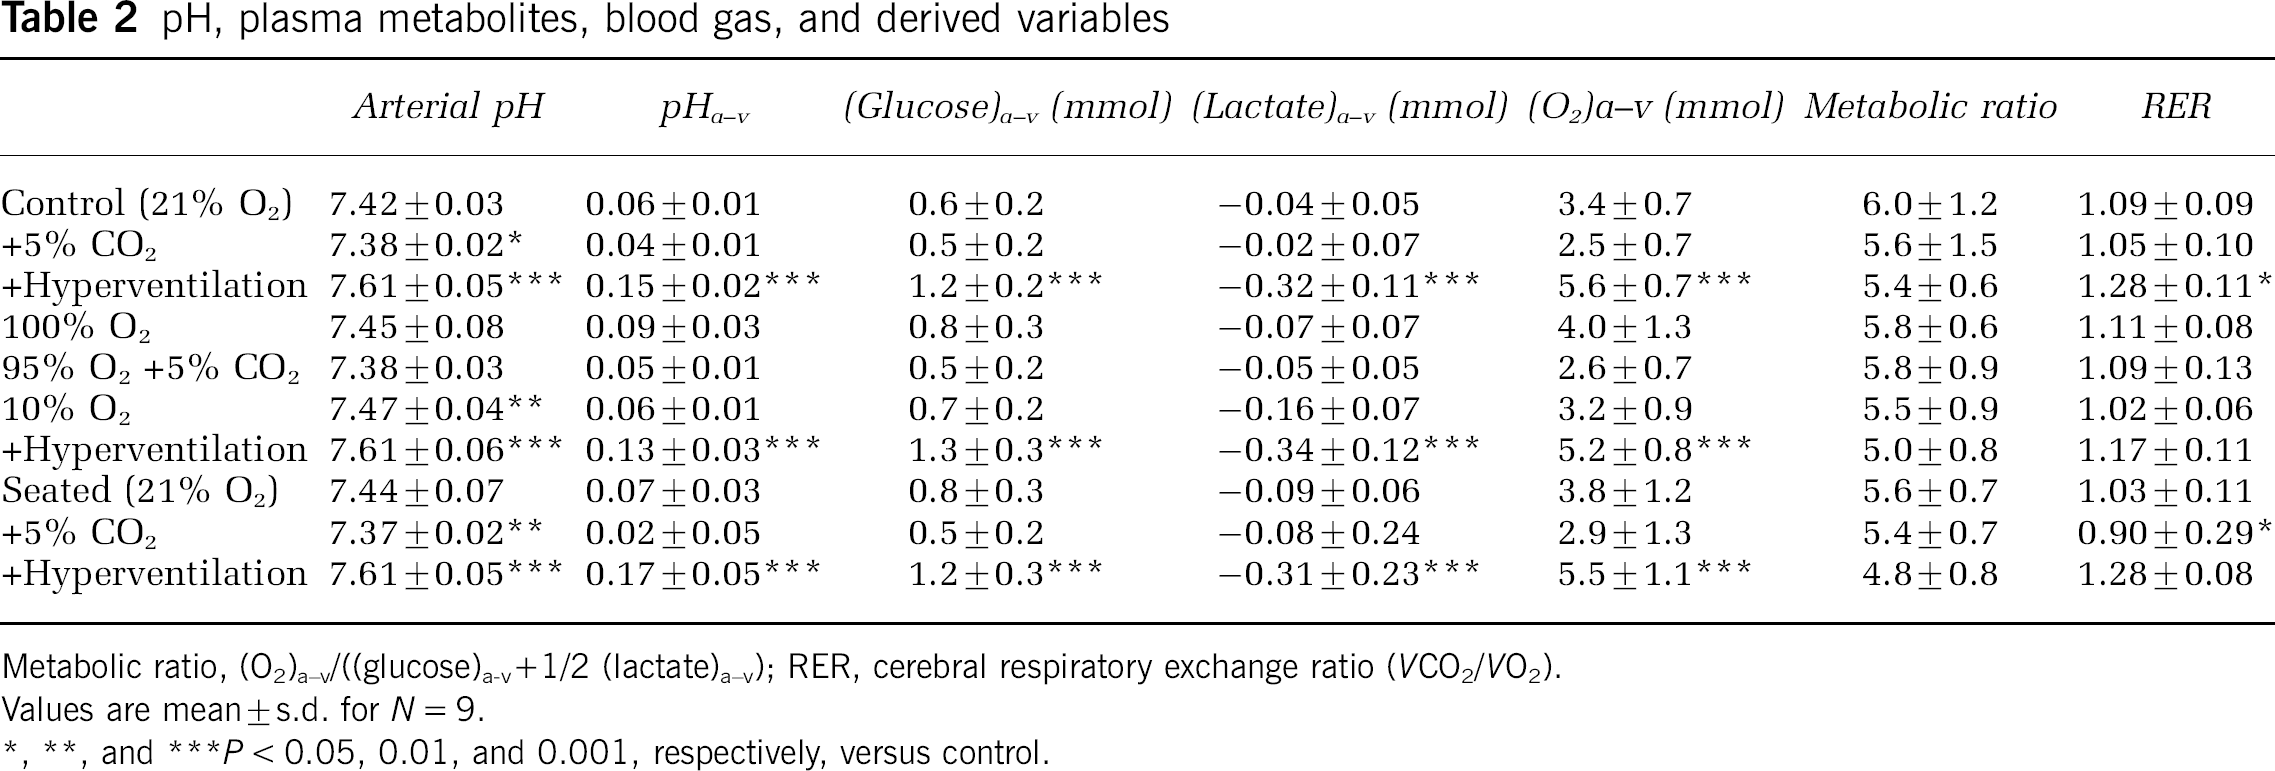
There was no change in cerebral O2 consumption (P = 0.85) compared with the average JO2 of 153 ± 51 μmol 100 g−1 min−1 across the trials. The cerebral O2 extraction fraction ranged between 22% ± 7% during hyperoxia with superimposed hypercapnia and 60% ± 4% during hypocapnia. The highest O2 extraction fraction was consistent with the limit of adequate O2 delivery of 60% (Gjedde, 2005; Gjedde et al, 2005). Using this highest extraction fraction yielded an L of 4.4 ± 1.5 μmol 100 g−1 min−1 mm Hg−1 (Equation 6) and this value was used to calculate the mitochondrial O2 tension (Equation 7; Table 2). Acute hypoxia and hyperventilation changed PMitoO2 with O2 delivery (Figure 2). During hypoxia, however, changes in PMitoO2 appeared to depend on PaO2 within the small range of O2 delivery (Figure 2).
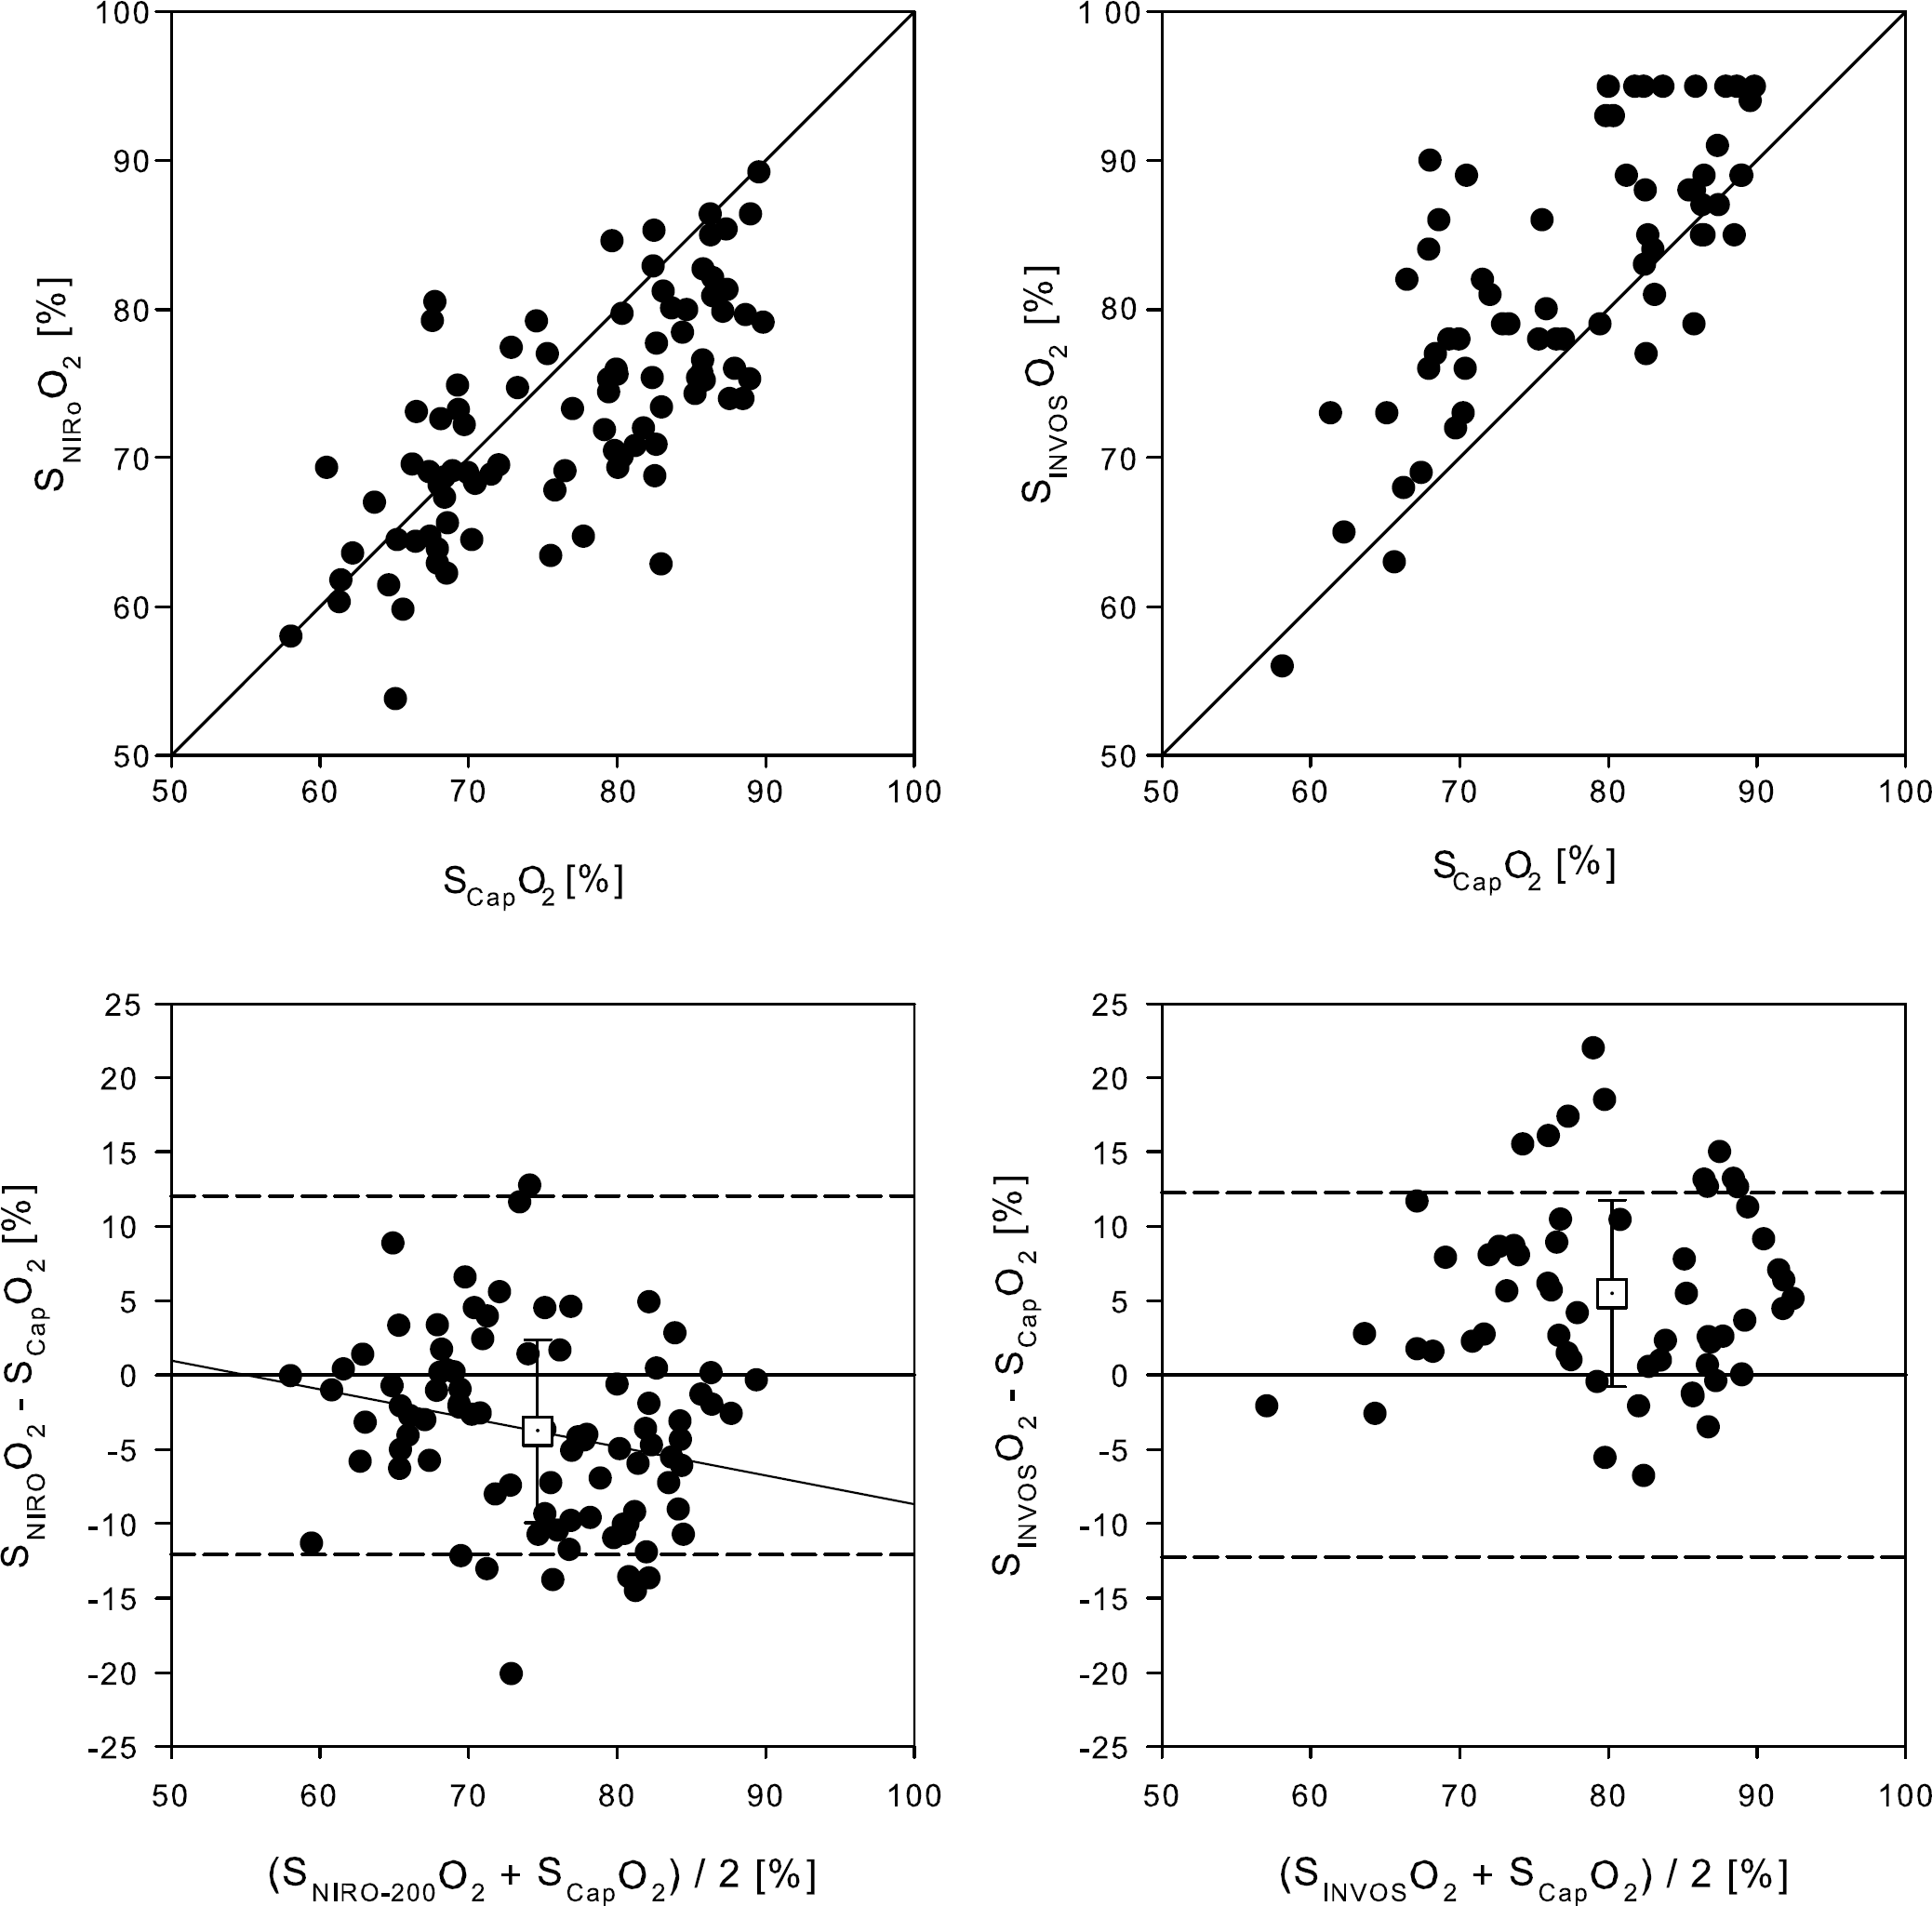
pH, plasma metabolites, blood gas, and derived variables
Metabolic ratio, (O2)a−v/((glucose)a−v+1/2 (lactate)a−v); RER, cerebral respiratory exchange ratio (VCO2/VO2).
Values are mean ± s.d. for N = 9.
P< 0.05, 0.01, and 0.001, respectively, versus control.
Changes in mitochondrial oxygen tension (ΔPMitoO2) from control during manipulation of the inspired O2 and CO2 tensions. Oxygen delivery calculated as arterial O2 content times CBF. Circles indicate normoxia, filled triangles hyperoxia, and open triangles hypoxia. Open circle, normoxic supine rest. Solid line linear regression of the normoxic values. Values are averages ± s.e.m. for N = 9.
Glucose utilization and O2 extraction changed inversely with flow and thus no significant changes were observed in the cerebral metabolic or respiratory exchange ratios. pH changed across the trials (P < 0.001) and was on average 0.08 ± 0.05 lower in the jugular vein than the artery (P < 0.001) with the largest difference in the hyperventilation trials (P < 0.001; Table 2).
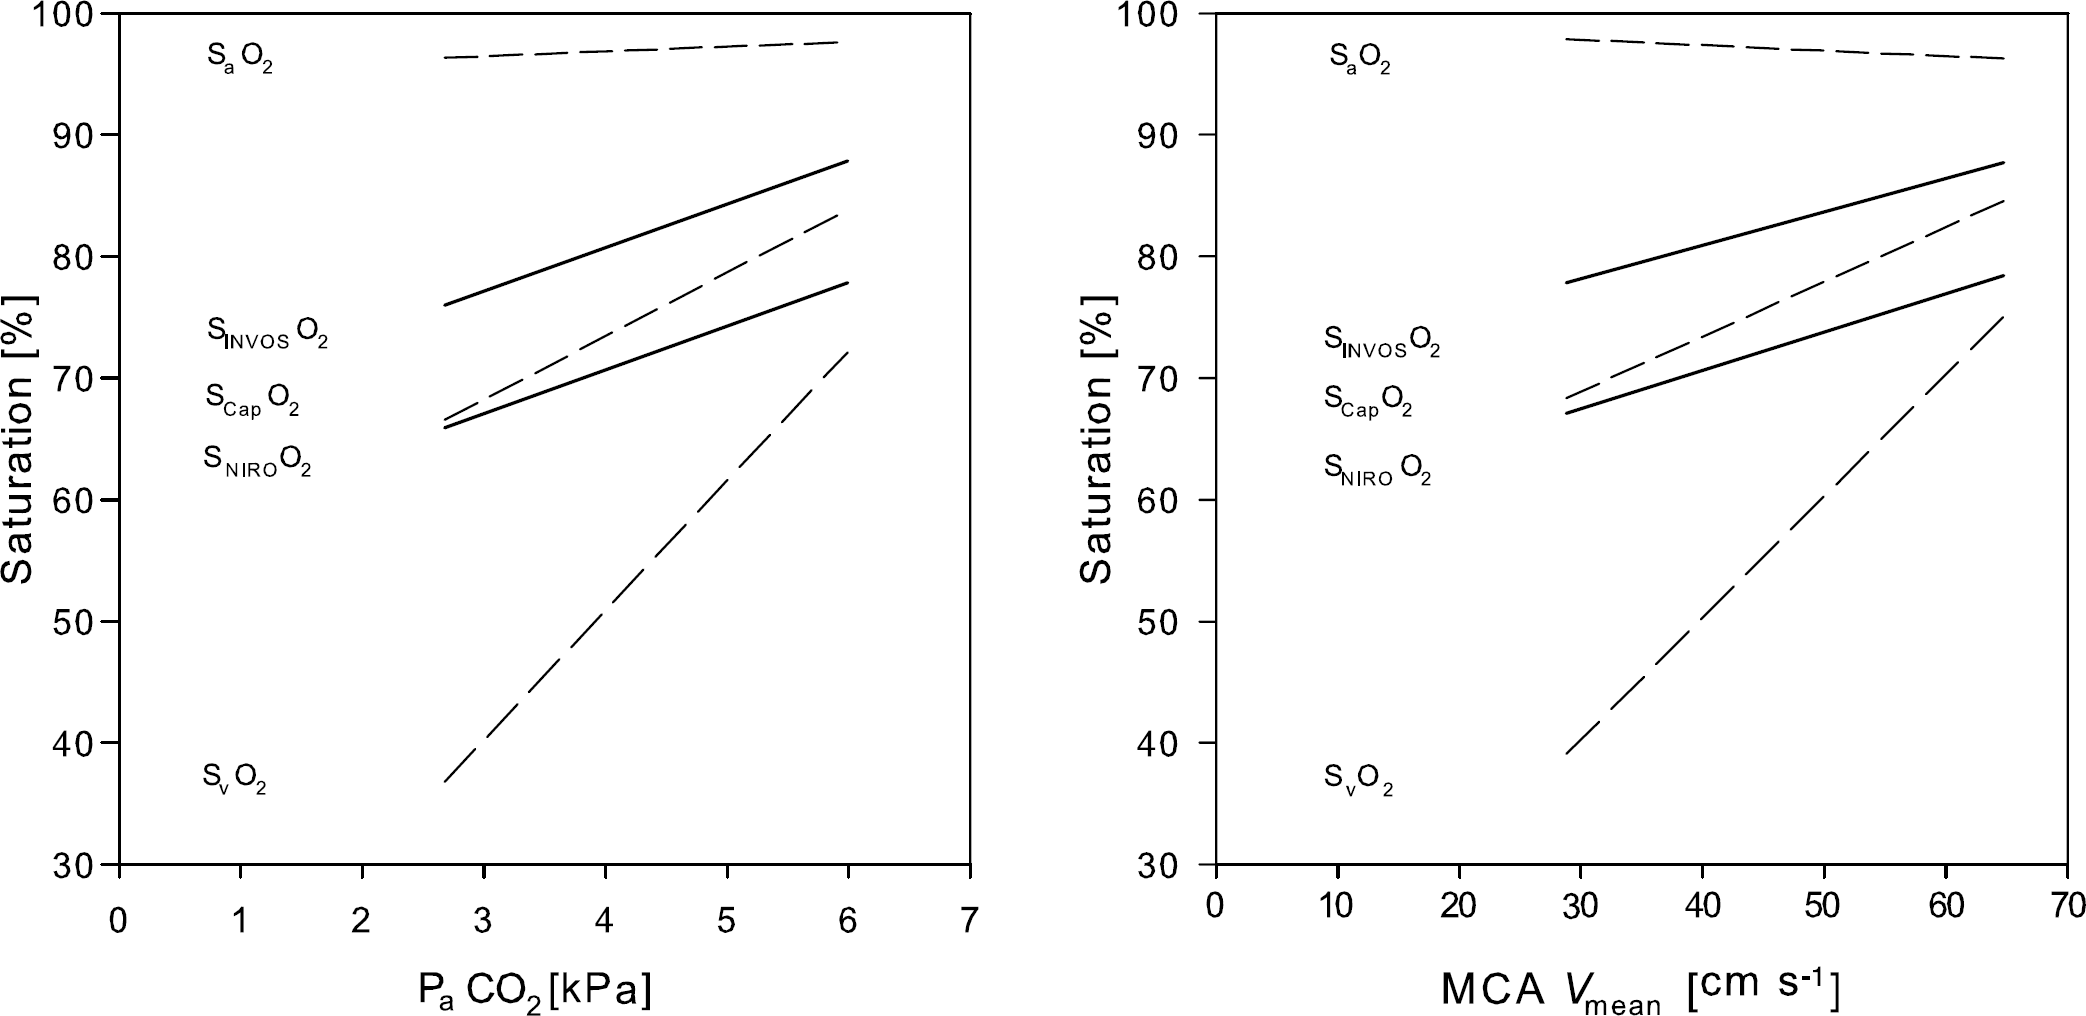
SNIRO followed SCap throughout the measured range (Figures 3 and 4), however, there was a weak correlation between the bias and the observed average value (r = −0.23; P = 0.027) with the mean bias less than zero (–3.8% ± 6.2%; P < 0.001; Figure 3, left panel), indicating some underestimation at higher values. For the INVOS device, bias and mean value did not correlate, with mean bias greater than zero (5.5% ± 6.3%; P < 0.001; Figure 3, right panel) and no difference in the magnitude of the bias (P = 0.10). The bias of the two NIRS devices combined was −0.5% ± 5.8% (P = 0.46 versus zero bias) and for that value there was no significant correlation between bias and the mean observation (r = −0.202; P = 0.06).
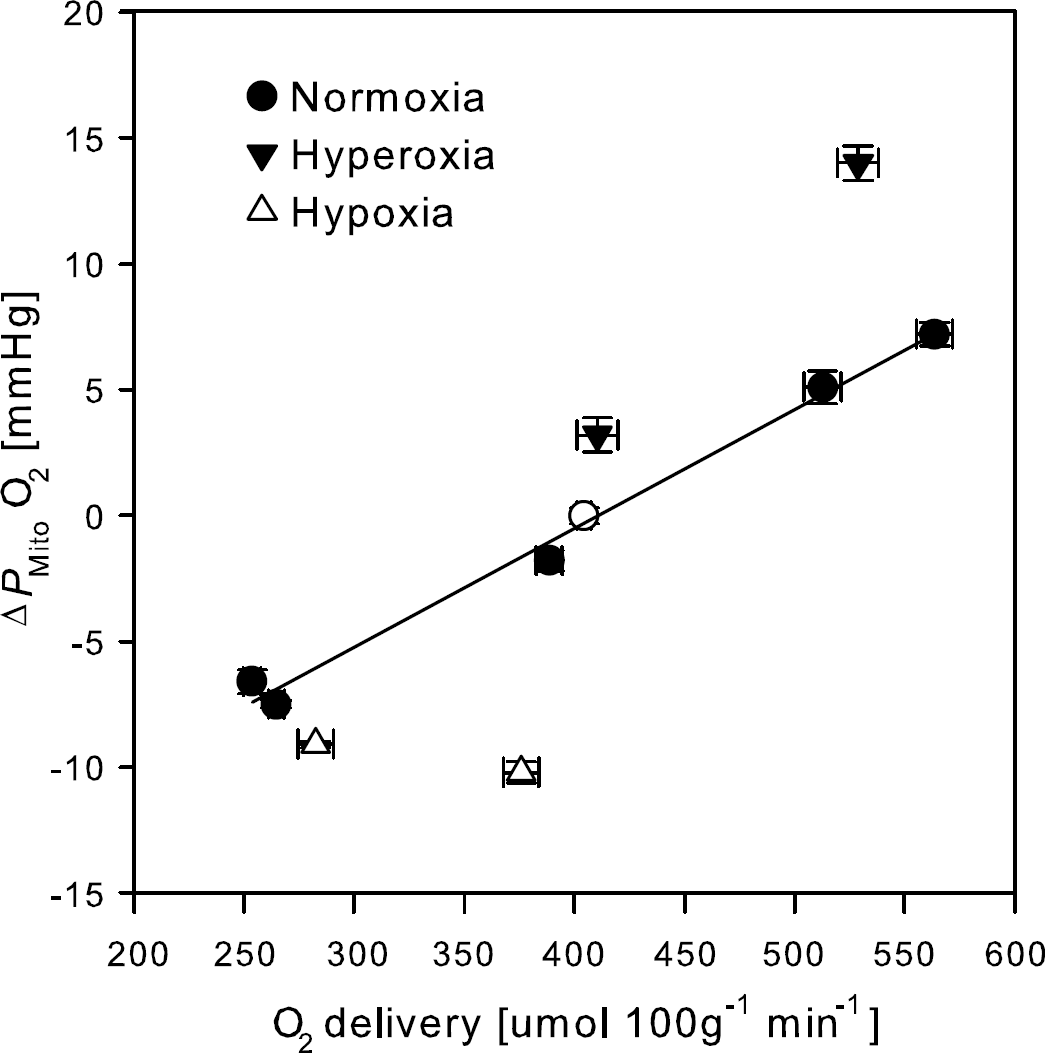
Frontal lobe oxygenation at different levels of arterial CO2 tension (PaCO2; left panel) and middle cerebral artery mean blood flow velocity (MCA Vmean; right panel). Dashed lines represent linear regression of the arterial haemoglobin saturation (SaO2), internal jugular venous haemoglobin saturation (SvO2), and capillary haemoglobin saturation (SCapO2). Solid lines represent linear regression of frontal lobe oxygenation measured with a NIRO-200 (SNIROO2) and an INVOS apparatus (SINVOSO2; N = 6. Values are averages for N = 9, unless otherwise stated.
Bland—Altman plot for NIRS determined frontal lobe oxygenation versus the corresponding capillary saturation. SNIROO2, NIRO-200 apparatus (N = 9); SINVOSO2, INVOS apparatus (N = 6); SCapO2, capillary haemoglobin saturation. Broken lines represent zero ± 1.96 s.d. A solid indicates a correlation (P < 0.05). Open boxes, mean value ± s.d.
Posture
The mean arterial pressure did not change across trials (P = 0.16; Table 3). In the supine position PaCO2 was 5.2 ± 0.2 kPa and MCA Vmean 48.4 ± 15.5 cm/sec. The SCap in the frontal lobe (74.1% ± 5.7% and 85.2% ± 5.6%, NIRO and INVOS, respectively) was between SaO2 (98.3% ± 0.5%) and SvO2 (61.3% ± 6.3%). In the seated versus the supine position, jugular venous pressure decreased, while sampling variance increased (33 versus 127 arbitrary units (a.u.); P = 0.03). Conversely, no change was observed for SNIRS (P = 0.37) and, therefore, sampling variance was greater for jugular bulb oximetry than for NIRS (80 versus 21 a.u.; P = 0.03). The SRight was 80% ± 8% and the SLeft 75% ± 6% (P < 0.001) also after transition to the seated position.
Cardiovascular, temperature, and peripheral NIRS variables
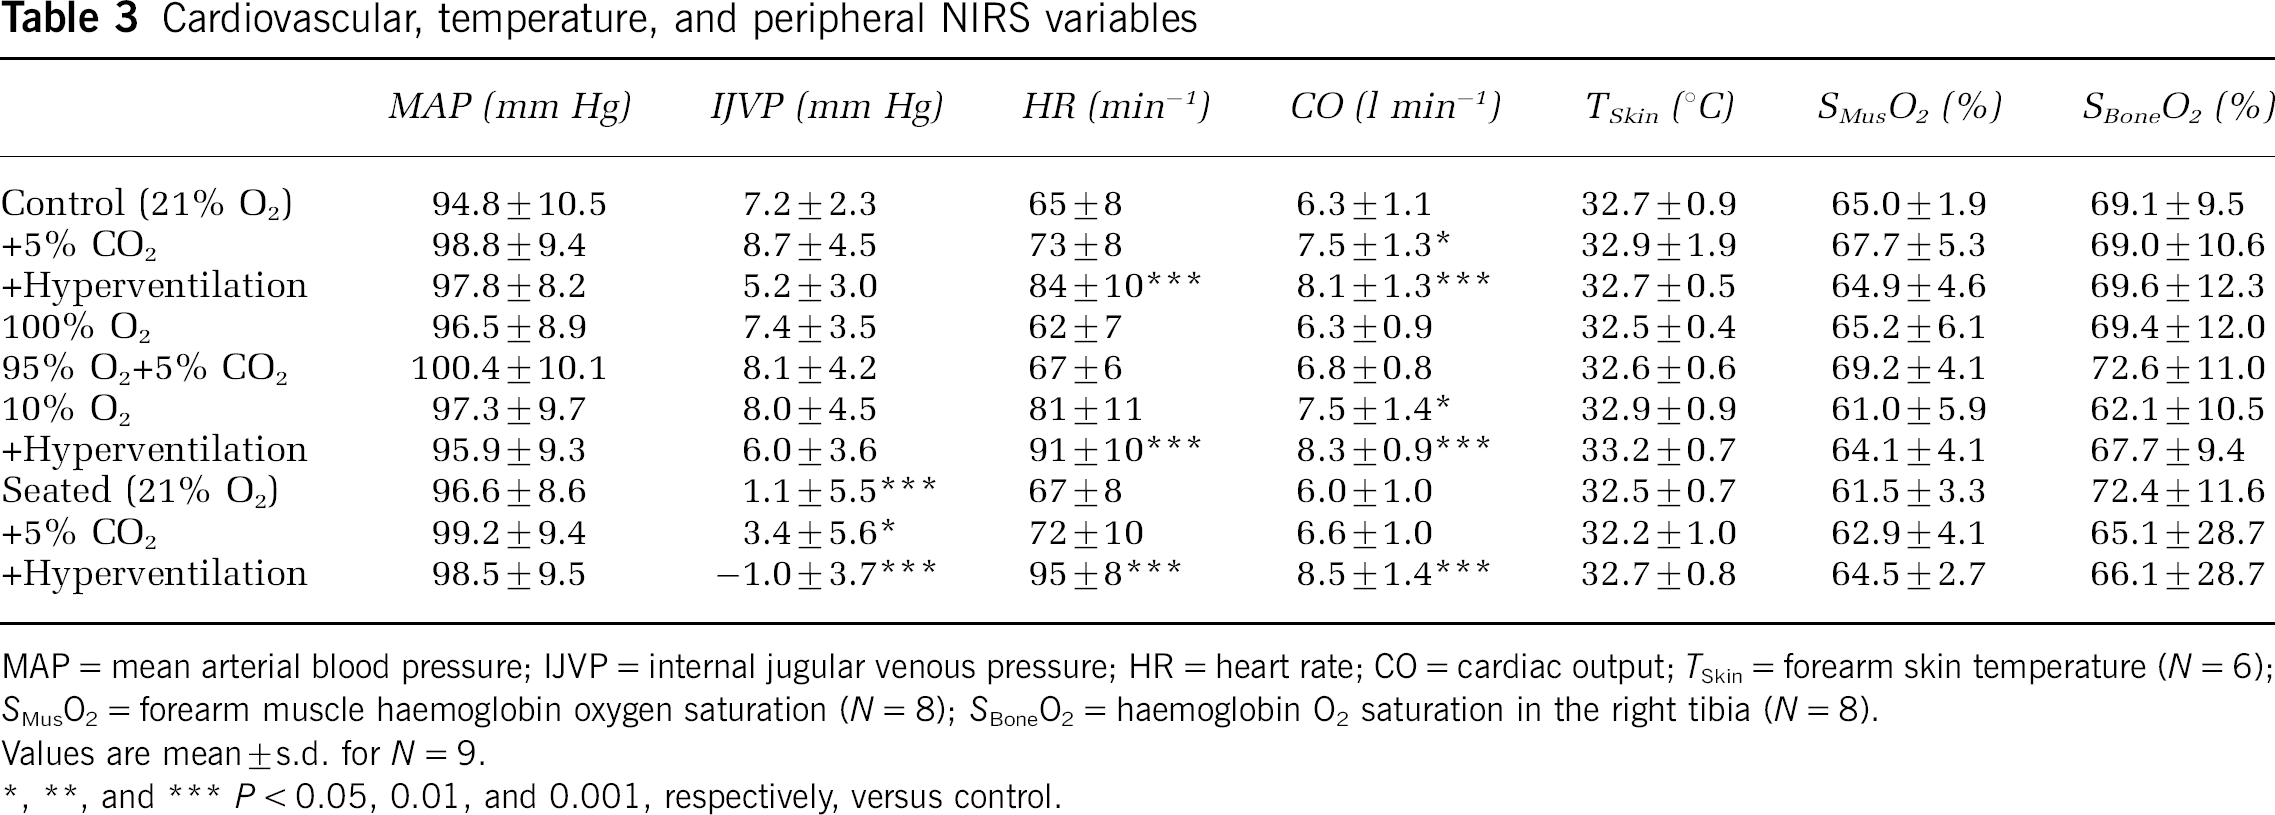
MAP = mean arterial blood pressure; IJVP = internal jugular venous pressure; HR = heart rate; CO = cardiac output; TSkin = forearm skin temperature (N = 6); SMusO2 = forearm muscle haemoglobin oxygen saturation (N = 8); SBoneO2 = haemoglobin O2 saturation in the right tibia (N = 8).
Values are mean ± s.d. for N = 9.
P < 0.05, 0.01, and 0.001, respectively, versus control.
The NIRS CO2 reactivity for the brain and muscle tissue in the supine position was 2.7% ± 0.8% kPa−1 and 0.6% ± 1.3% kPa−1 respectively (Figure 5). In the seated position the cerebral NIRS CO2 reactivity decreased to 2.1% ± 0.5%kPa−1 (P = 0.004) and that change was not correlated significantly to changes in cardiac output. Furthermore, the CO2 reactivity of MCA Vmean declined in the seated position (18.3 ± 3.7 versus 23.1% ± 4.2% kPa−1; P = 0.019).
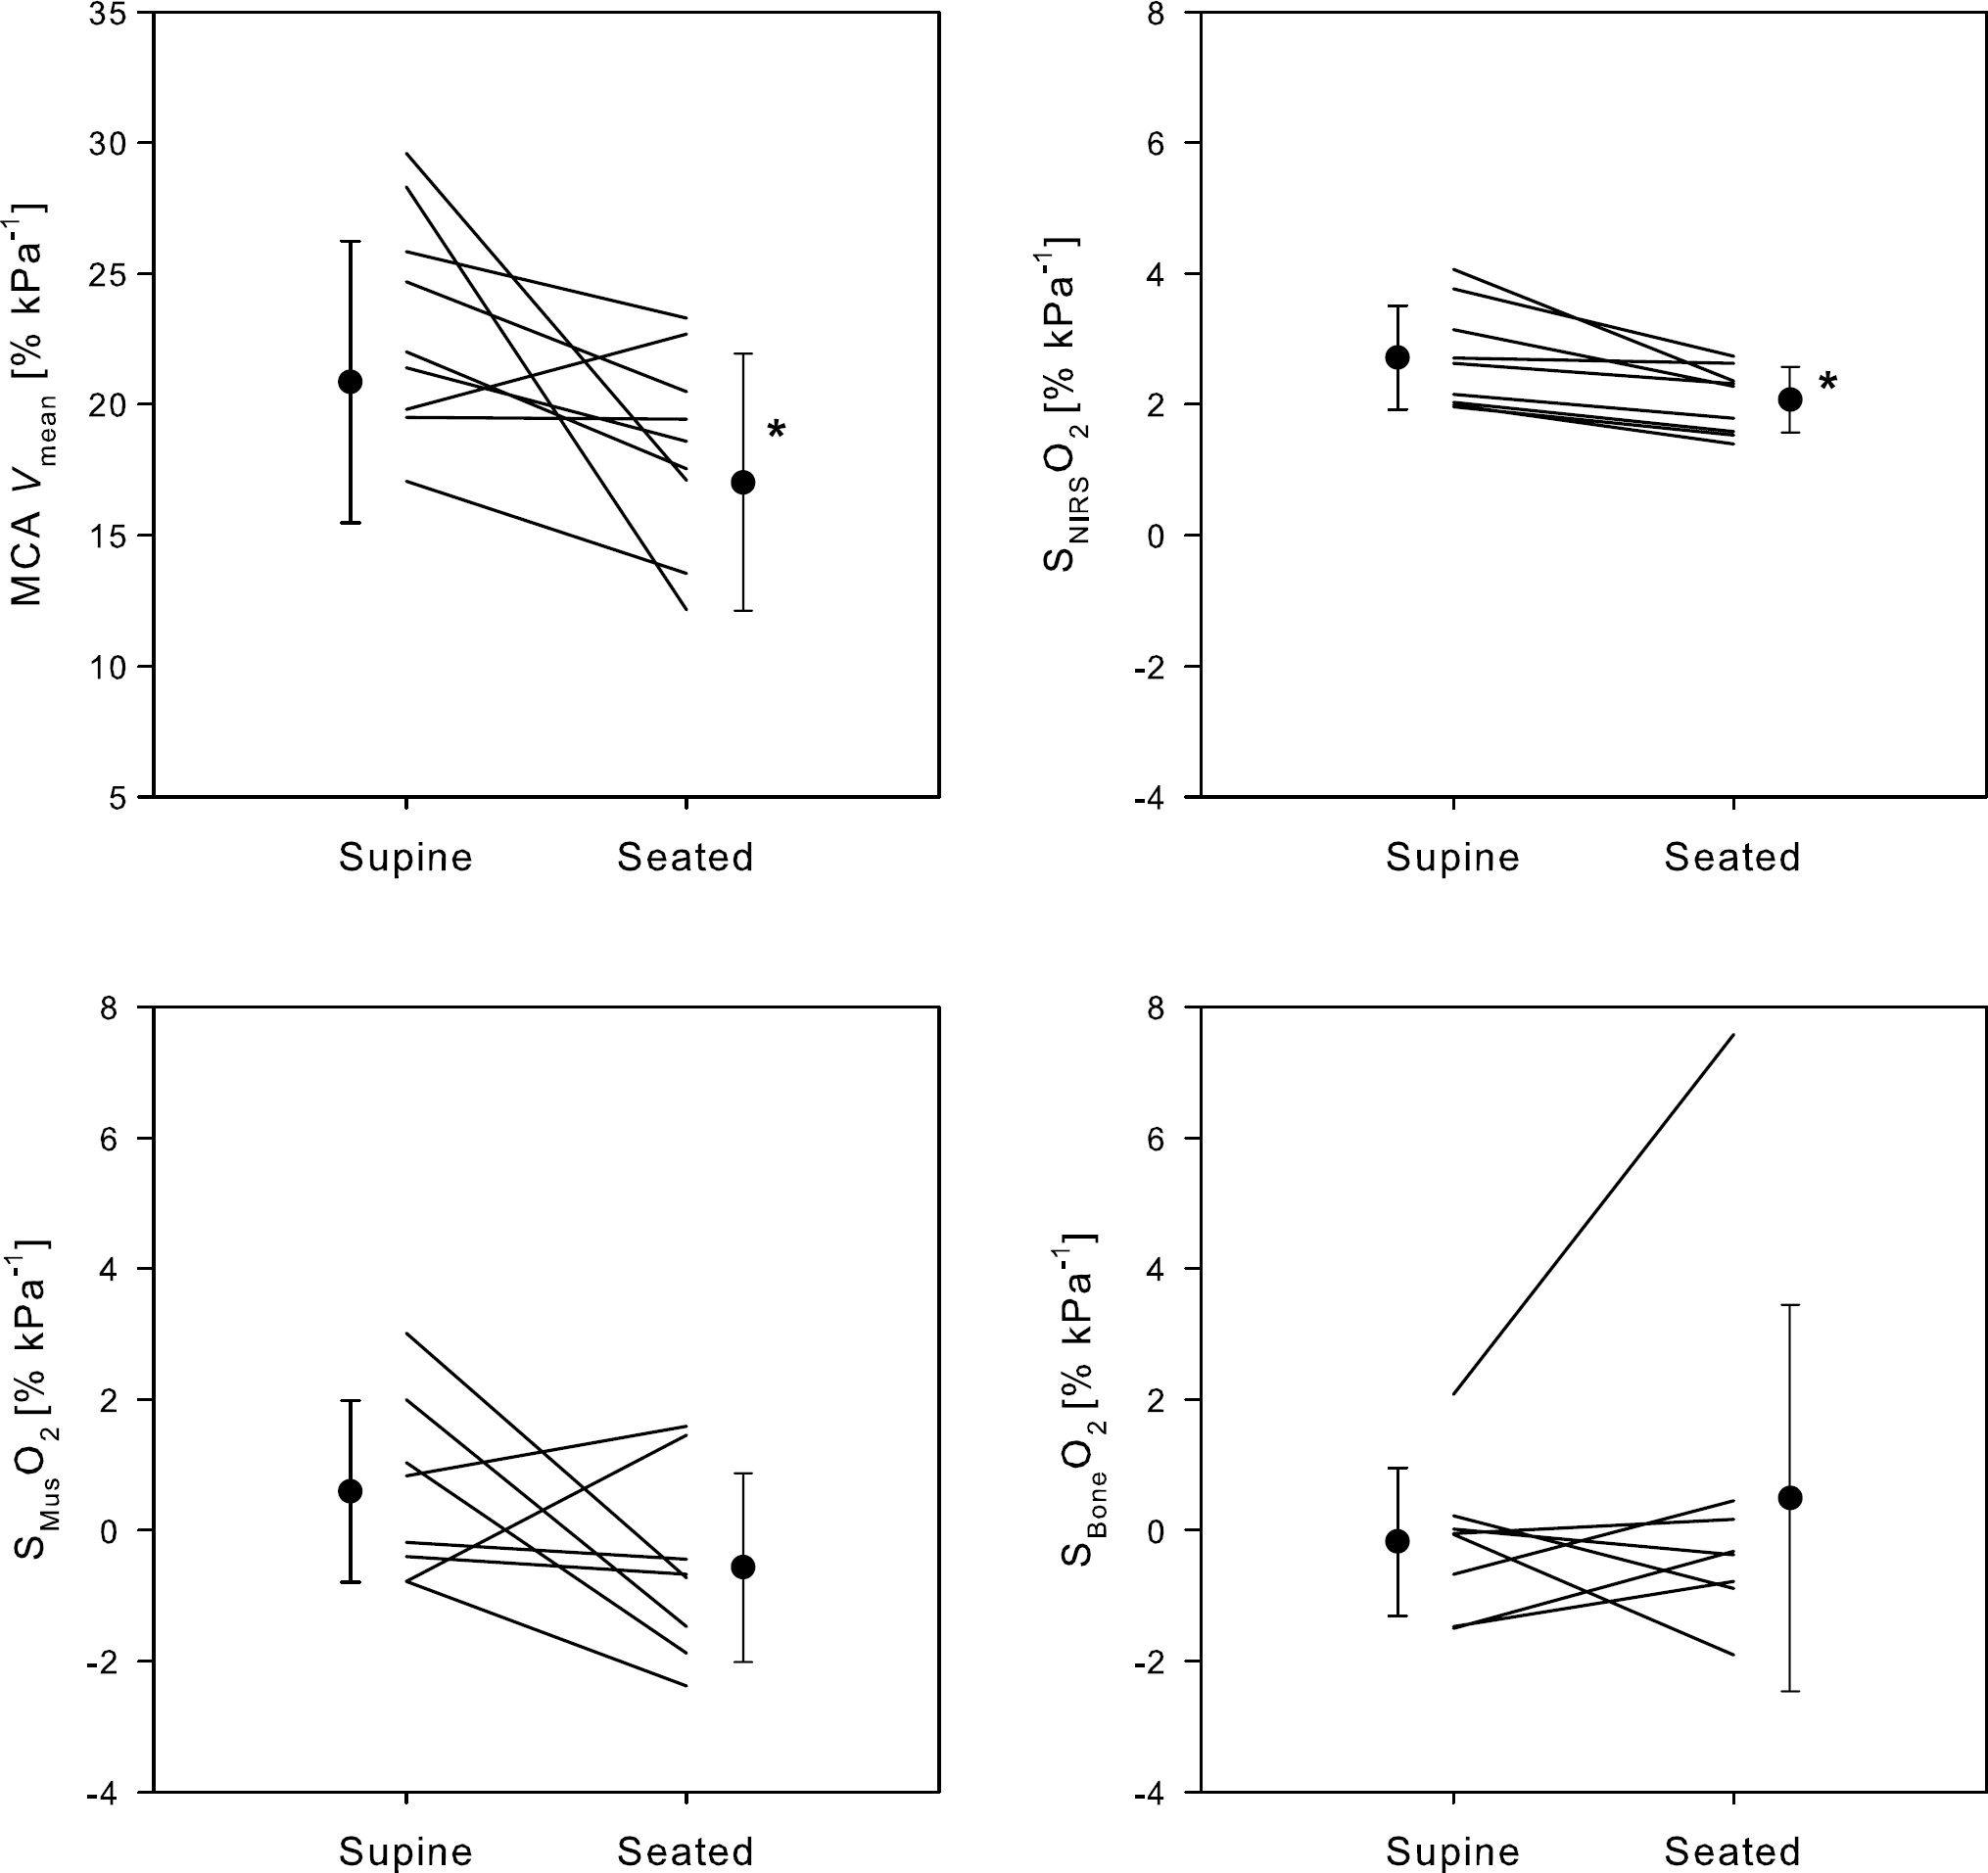
Cerebral, muscle, and bone CO2 reactivity. MCA Vmean, middle cerebral artery mean blood flow velocity; SNIRSCO2, frontal lobe haemoglobin saturation by NIRS (SNIRSO2; average of NIRO-200 and INVOS); SMusO2, muscle haemoglobin saturation measured by NIRS; SBoneO2, bone haemoglobin saturation measured by NIRS. Lines represent each subject and filled circles mean ± s.d. for N = 9. Asterisk, difference between the supine and seated position (P < 0.05).
Motor Activation
When breathing room air, MVC was 67.4 ± 11.1 a.u. and the mouse task click frequency 6.2 ± 0.9 Hz. MVC decreased to a nadir of 54.9 ± 11.7 a.u. (P < 0.001 versus control) during hypoxia with superimposed hyperventilation, while the mouse task click frequency was comparable across the trials (P = 0.13; Figure 6). No significant change was observed in forearm skin temperature (P = 0.86) and while the ANOVA test for SMus yielded an outcome (P < 0.001), the individual variations from control did not. Handgrip strength, but not the frequency of finger movement, correlated with the measured (NIRS) and calculated capillary oxygenation as well as with the calculated mitochondrial O2 tension (r = −0.79, r = −0.77, and 0.74, respectively; P < 0.05). Subsequent stepwise forward-regression analysis, with SMus, SNIRS, and PMito as independent variables, identified SNIRS as the best predictor of MVC.
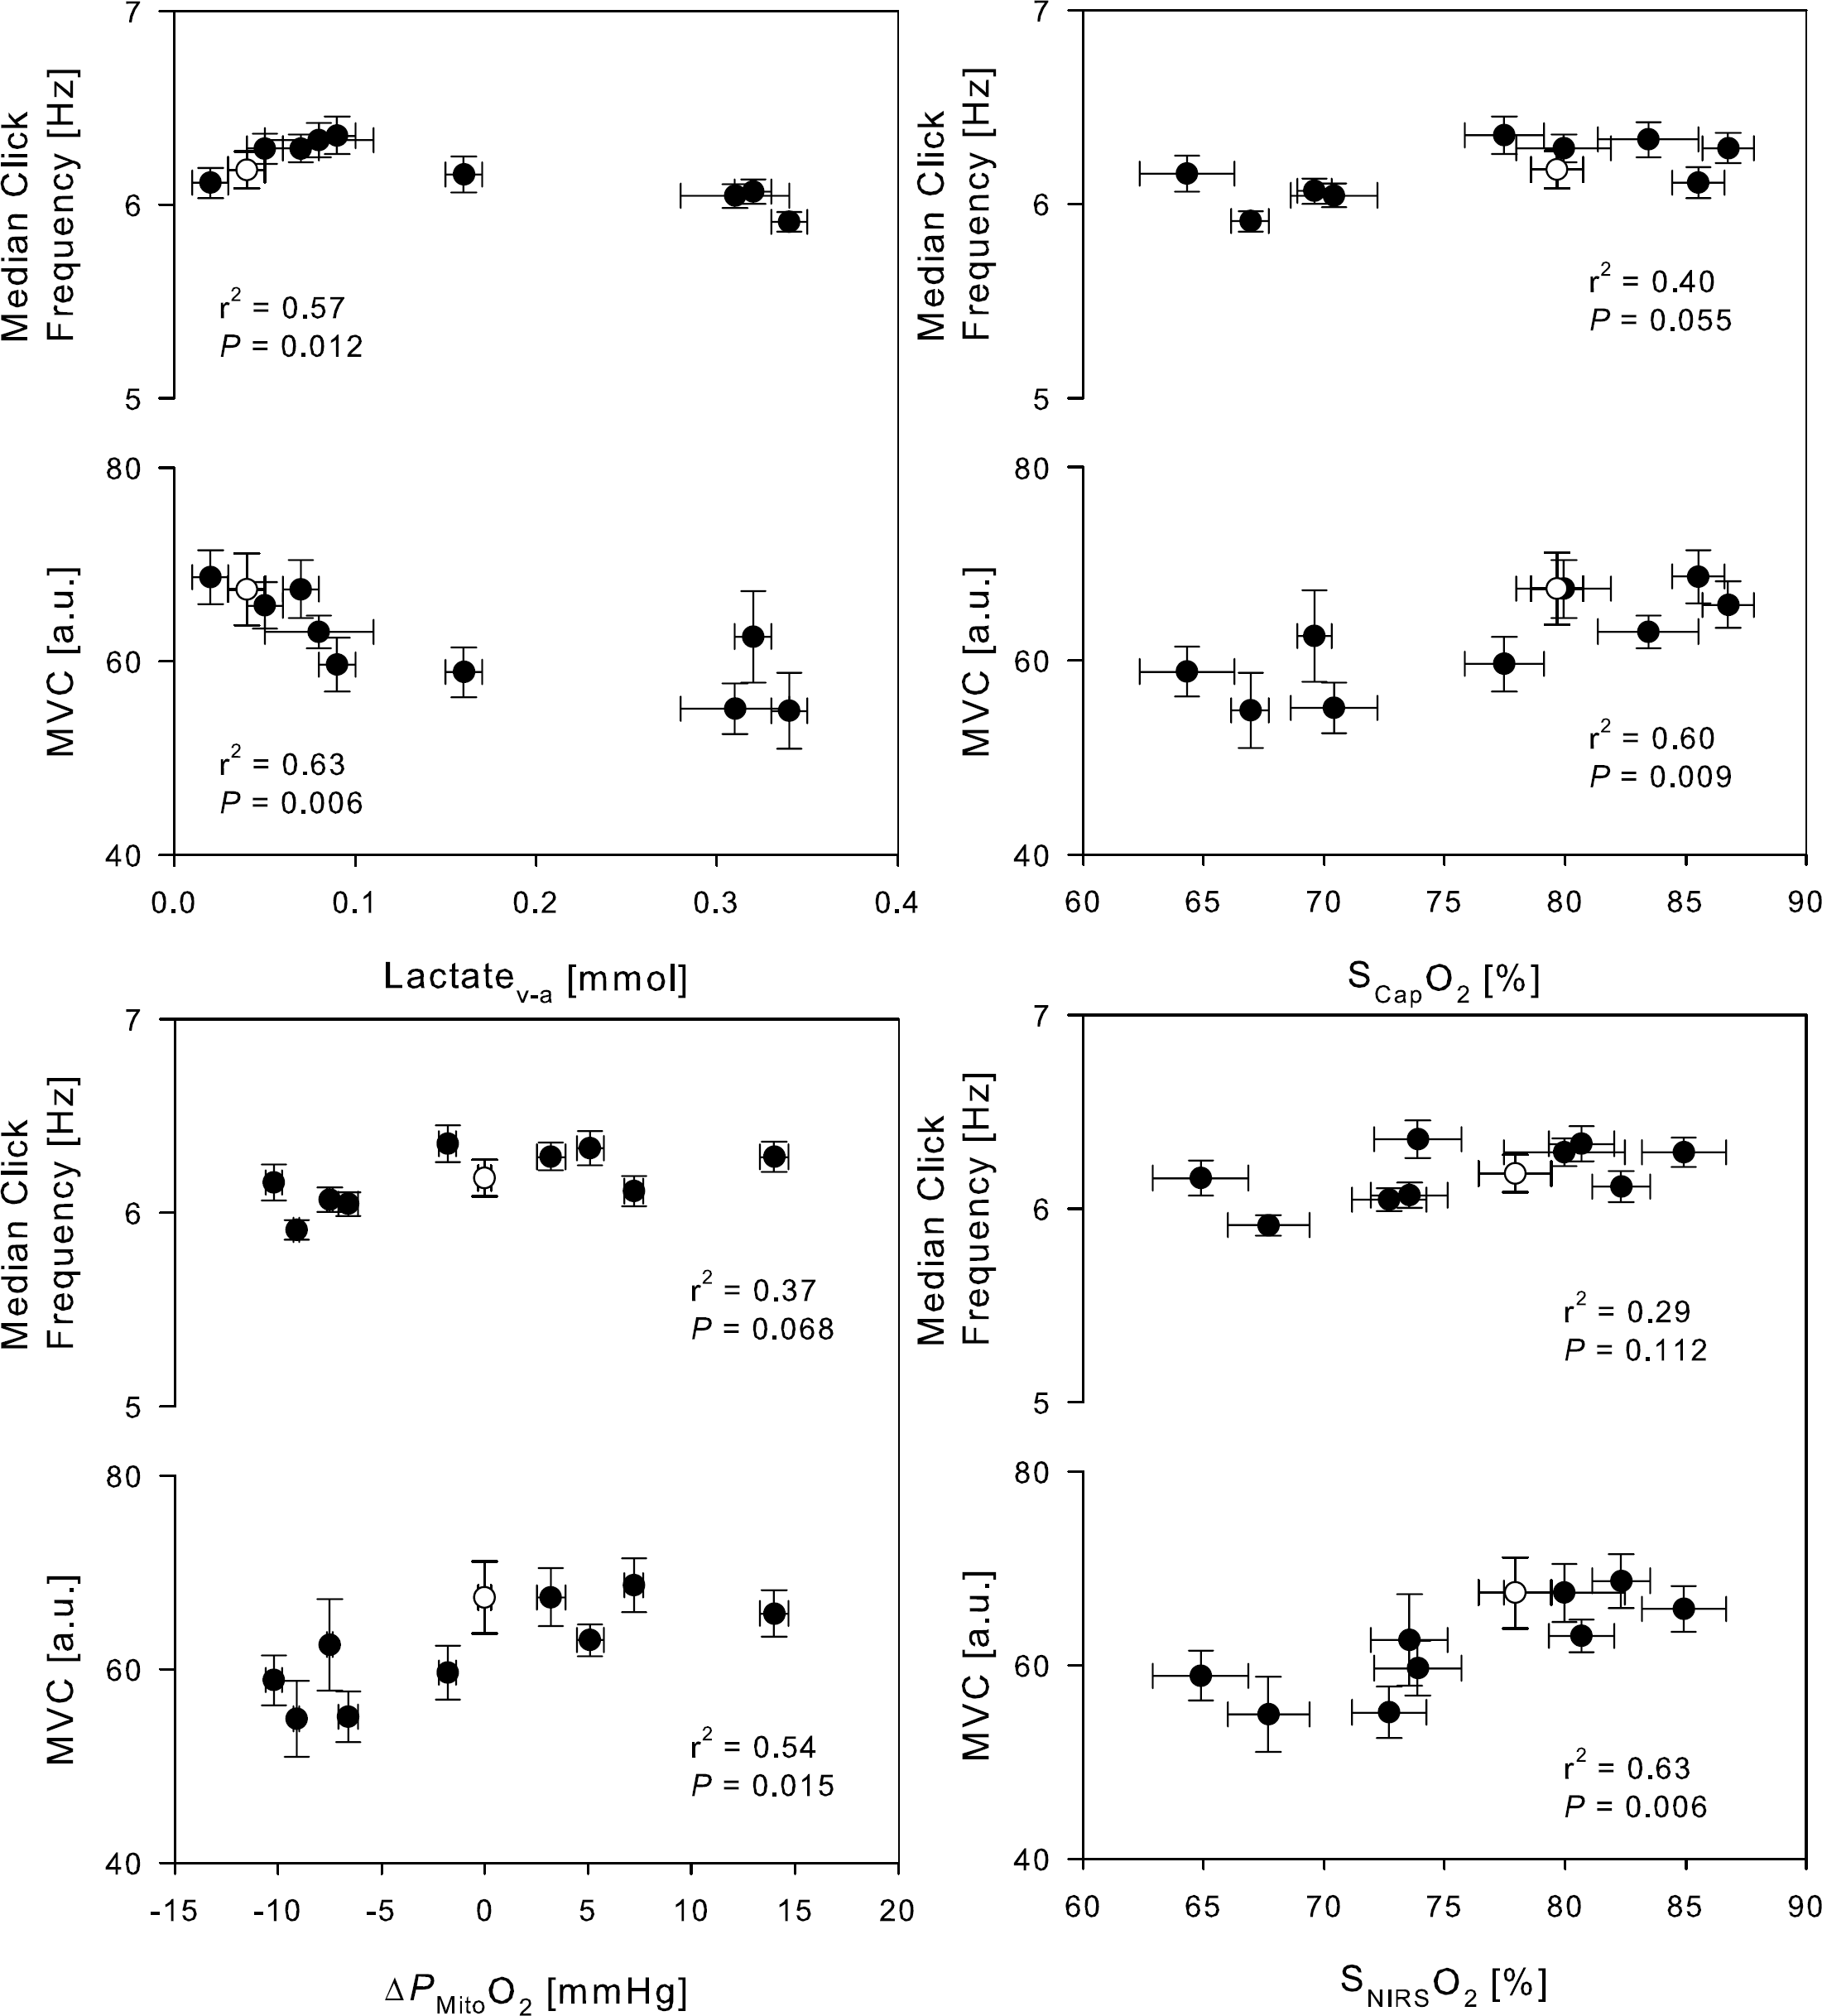
Dominant forearm muscle strength and mouse task click frequency related to frontal lobe O2 saturation, arterio-venous lactate difference, capillary O2 saturation and the mitochondrial oxygen tension. Open symbol, control. MVC, maximal voluntary handgrip; SNIRSO2, average of NIRO-200 and INVOS; SCapO2, capillary oxygen saturation; ΔPMitoO2, changes in mitochondrial oxygen tension from control. Values are averages ± s.e.m. for N = 9.
Discussion
The purpose of this study was to examine the potential of NIRS as a COLD signal. The new findings of this study are: (1) The COLD NIRS signal tracks the capillary O2 saturation for a two-fold variation in CBF; (2) a decrease in the COLD NIRS signal and in the calculated mitochondrial O2 tension impair motor activation; (3) CO2 reactivity of the cerebral circulation and the cerebral cortical oxygenation decrease with assumption of the upright posture, while muscle tissue oxygenation is not modified by the arterial CO2 tension (PaCO2); and (4) the scatter in jugular venous oxygenation values increases from the supine to the upright position.
Oxygen delivery to the brain is vital to cerebral function. The immediate loss of consciousness when CBF is obstructed confirms that the O2 reserve of the brain is low compared with its metabolism and that O2 supply is intimately related to consciousness. Because of the low O2 reserve in the brain, noninvasive and real-time monitoring is required when evaluating capillary oxygenation during surgery, which is often associated with low blood pressure in response to anaesthesia or a blood loss. The NIRS is applicable under a variety of conditions ranging from bedside monitoring in intensive care and in the operating theatre to documenting the effects of maximal whole body exercise in the physiology laboratory. The NIRS monitors the increase in capillary oxygenation during activation (Ide et al, 1999; Nielsen et al, 2001) as well as the reduction that accompanies a decrease in central blood volume (Madsen et al, 1995; van Lieshout et al, 2001), in PaO2 and/or in PaCO2 (Imray et al, 2005; Nielsen et al, 1999). Such observations allow qualitative evaluation of the NIRS signal, but until now they did not relate changes in brain oxygenation directly to variations in PaO2 and PaCO2 in a quantitative manner. The present results show that the COLD NIRS signal monitors cerebral capillary oxygenation derived from a determination of the arterial and the venous O2 contents (Gjedde et al, 2005) with a ~5% underestimate of the brain capillary oxygenation by NIRO and ~5% overestimate by INVOS. To calculate oxygenation by NIRS, knowledge of the distance light traverses through the tissue is required and both spatially resolved COLD NIRS signals followed changes in frontal lobe capillary oxygenation for the full physiological range of O2 and CO2 tensions in humans.
Pollard et al (1996) used a fixed and Watzman et al (2000) an estimated arterial to venous cerebral blood volume fraction for evaluation of the brain NIRS COLD signal. A proposed fixed 25% arterial to 75% venous cerebral blood volume ratio has not been validated and it is unlikely that the composition of the cerebral blood volume remains stable at different levels of PaCO2 and, consequently, CBF (Watzman et al, 2000). Gas is exchanged along the entire vascular pathway from arteries to venules (Sejersen, 1970) rendering an evaluation of tracking brain oxygenation by NIRS solely on the basis of the volume ratio between two vascular compartments unsatisfactory. Watzman et al (2000) calculated a ratio of arterial to venous blood volume from the COLD NIRS signal with an increased arterial volume fraction during hypocapnia and a reduction with hypercapnia, a finding that is supported by the present results (Table 1). A decreased arterial to venous cerebral blood volume fraction during hypercapnia, that is, vasodilatation, is not in agreement with positron emission tomography data (Ito et al, 2005) demonstrating an increasing arterial to capillary and venous volume fraction during hypercapnia and decreasing arterial fraction during hypocapnia. However, the relative reactivity of the resistance versus capacitance vessels to CO2 is not known, and we acknowledge that a comparison of NIRS to PET data is not straightforward since we are unaware to what extent the two methodologies interrogate the same tissue. The changes of total haemoglobin (Table 1) correlate with changes of PaCO2 in parallel with the vasodilation caused by CO2 and the present results indicate that the NIRS COLD signal follows changes in capillary haemoglobin saturation and tissue vessel volume. We consider the COLD NIRS measure of the capillary O2 saturation an adequate estimate of average capillary oxygenation of brain tissue, although the capillary volume may encompass only ~1% of the cerebral blood volume.
A potential limitation of the study is that the calculation of the cerebral capillary oxygenation is complicated by applying variables that do not reflect the same area of the brain where transcranial Doppler measures flow velocity in the MCA while the COLD NIRS signal reflects a frontal lobe volume. We also consider an asymmetry in brain drainage by the left versus right jugular veins (Himwich et al, 1947). The usually larger right internal jugular vein is normally representative of cortical drainage while the left, usually smaller vein drains blood largely from subcortical areas (Ferrier et al, 1993). However, the interventions were designed to manipulate global CBF and capillary oxygenation and should be expected to display a similar response across the brain circulation.
The cerebral CO2 reactivity declines in the upright compared with the supine position (Mayberg et al, 1996) and a similar decrease was observed for the COLD NIRS signal. In contrast, neither when supine, nor when seated, was there a CO2 response in the NIRS signal from muscle tissue. The central blood volume or cardiac output may be important to the cerebral reactivity, although no correlation was observed between changes in reactivity in response to the small change in cardiac output induced by the change from the supine to the seated position. The reduced CO2 reactivity in the seated position could be an effect of redistribution of blood flow between cortical and subcortical areas. Most likely the difference between the two jugular veins is negligible in the supine position but may become of importance when the subject is seated. From supine to upright CBF (Scheinberg and Stead, 1949), MCA Vmean (Bode, 1991), and the NIRS determined cerebral tissue oxygenation decrease (Madsen et al, 1995; Van Lieshout et al, 2003). Such reductions in indices of CBF take place even though the cerebral perfusion pressure remains within what is considered to be its autoregulatory range. Furthermore, when getting upright, the PaCO2 declines related to hyperventilation and reduction in cardiac output (Immink et al, 2006). Hypocapnia induces a decrease in CBF by vasoconstriction (Lennox and Gibbs, 1932) and the postural decrease in CBF is at least partially caused by the postural decline in PaCO2 (Panerai et al, 1999). The postural reduction in both MCA Vmean and NIRS determined cerebral tissue oxygenation has been attributed, at least in part, to cerebral vasoconstriction related to postural hypocapnia and an increase in sympathetic tone (Ogoh et al, 2005). In humans both CBF and MCA Vmean decrease during unilateral trigeminal ganglion stimulation (Visocchi et al, 1996) and increase after stellate ganglionic blockade (Ide et al, 2000; Umeyama et al, 1995) supporting an influence of sympathetic nerves on the cerebral circulation. Thus, orthostatic stress affects cerebral perfusion by baroreflex-induced sympathetic outflow to the cerebral circulation independently of the influence of PaCO2 (LeMarbre et al, 2003).
The jugular veins are not always the principal cerebral drain because the veins in the vertebral plexus dominate in the upright position (Epstein et al, 1970). In rhesus monkeys, the jugular vein serves as the principal cerebral drain during supine rest, but blood flow distribution is shifted towards the spinal veins in the upright position. The internal jugular vein collapses and its blood pressure approaches ~0 mm Hg when the subject is upright (Dawson et al, 2004) as confirmed in this study. The jugular vein cannot sustain a continuous blood column and attenuation of jugular venous flow is reflected in an increase in sampling variance in the upright compared with the supine position.
Static handgrip MVC, but not fast dynamic finger movements, appeared to be influenced by brain capillary oxygenation. It is unlikely that the attenuated MVC was caused by factors within the muscles, as the forward stepwise-regression identified neither the muscle O2 saturation nor the estimated muscle temperature as predictors of the reduction. Conversely, cerebral capillary oxygenation was identified as a potential cause of central fatigue that can arise from an imbalance of the cerebral O2 delivery and the demand, in sustained rather than in repeated contractions. When central fatigue is provoked by repeated isometric contraction, the ability to sustain the contraction is more affected than the rate of rise of tension (Secher, 1992) similar to what is seen after partial neuromuscular blockade that primarily affects slow twitch muscle fibres. Thus, central inhibition of recruitment of slow twitch muscle fibres seems to increase when the mitochondrial oxygen tension is reduced within the brain.
The concomitant decrease in mitochondrial oxygen tension and increase in brain lactate release suggest causal relationship between low mitochondrial oxygenation and increased lactate production. Phosphofructokinase, a regulatory enzyme of glycolysis, is pH sensitive and will be activated during hypocapnia (Siesjö, 1978). Under these conditions, the increased rate of glycolysis at constant oxygen consumption will lead to an increase in brain lactate and efflux of lactate. However, the rise in pH caused by the hypocapnia will also reduce the lactate/pyruvate ratio and hence reduce the lactate output and the manoeuvre associated with the highest lactate release is also associated with the lowest, albeit nonsignificant, metabolic ratio (Table 2).
Calculation of the mitochondrial oxygen tension is based on several assumptions. The diffusibility can only be calculated when the mitochondrial oxygen tension is assumed to be zero, which then defines the limit to which the extraction fraction can rise and still be consistent with adequate oxygen delivery. This is by necessity an approximation but Gjedde et al (2005) showed that the extraction fraction consistent with this threshold is just below 60%. However, subsequent calculations of mitochondrial oxygen tensions depend on several factors in addition to the diffusibility. Although the calculation is an approximation, the use of a fixed diffusibility establishes the correct relationship between the values, accepting that the absolute values of the mitochondrial oxygen tension may be off by a value determined by the true mitochondrial tension in the reference condition in which it was assumed to be zero, as well as by any changes of L and the reference parameters of the oxygen—haemoglobin dissociation curve. Oxygen binding to haemoglobin is dependent on pH that varies with trial and across the vascular bed (Table 2). Most ex vivo measurements of the haemoglobin saturation curve generally confirm the validity of using a single weighted and Hill coefficient for the entire curve. The ABL 725 machine can estimate P50Hb and use of this, along with the subsequently derived Hill coefficient, does not change the overall appearance of the results. Thus, although the present formalism does not account for Bohr effect driven changes in P50aHb directly and thus does not deal with the issue that both the P50aHb and the resulting Pcap and PMito, would be expected to decrease with hypocapnia and increase with hypercapnia, the result of a single average P50aHb is an acceptable approximation. The changes in mitochondrial oxygen tension are therefore not likely to be an effect of the formalism.
The present data indicate that the magnitude of slow twitch motor activation, as illustrated by a maximal handgrip, can be predicted from the cerebral O2 status rather than that of the muscle. Furthermore, it is illustrated that the COLD NIRS signal matches the calculated capillary saturation, although the exact value may vary with the chosen algorithm and method.