
Abstract
Quantification of water permeability can improve the accuracy of perfusion measurements obtained with arterial spin labeling (ASL) methods, and may provide clinically relevant information regarding the functional status of the microvasculature. The amount of labeled water in the vascular and tissue compartments in an ASL experiment can be estimated based on their distinct diffusion characteristics, and in turn, water permeability determined from the relative vascular and tissue contributions. In the present study, a hybrid magnetic resonance imaging technique was introduced by marrying a continuous ASL method with a twice-refocused spin—echo diffusion sequence. Series of diffusion-weighted ASL signals were acquired with systematically varied b values. The signals were modeled with fast and slow decaying components that were associated with the vascular and tissue compartments, respectively. The relative amount of labeled water in the tissue compartment increased from 61% to 74% and to 86% when the postlabeling delay time was increased from 0.8 to 1.2 and to 1.5 secs. With a b value of 50 secs/mm2 the capillary contribution (fast component) of the ASL signal could be effectively minimized. Using the single-pass approximation model, the water permeability of gray matter in the human brain was estimated based on the derived relative water fractions in the tissue and microvasculature. The potential for in vivo magnetic resonance mapping of water permeability was showed using two diffusion weighted ASL measurements with b = 0 and 50 secs/mm2 in both healthy subjects and a case of brain tumor.
Introduction
Arterial spin labeling (ASL) methods use magnetically labeled blood water as an endogenous contrast agent to measure perfusion (Detre and Wang, 2002). Although water was initially considered a freely diffusible tracer, cumulating evidence from nuclear medicine and magnetic resonance imaging studies have showed that there is limited exchange of water between the vascular (capillary) and tissue space (Ewing et al, 2001; Li et al, 2005; Parkes and Tofts, 2002; Silva et al, 1997a, b ; St Lawrence et al, 2000; Zhou et al, 2001). Particularly, water permeability is an order of magnitude lower in the central nervous system than the systemic circulation, because the structure of the blood—brain barrier (BBB) only allows water molecules to be transported into brain tissue through the plasma membrane of endothelial cells instead of through cellular gaps (Paulson, 2002). With ASL methods, it is generally reasonable to ignore the effects of limited water exchange in the quantification of perfusion, provided that the relaxation rates in tissue and blood are similar (Parkes and Tofts, 2002; St Lawrence et al, 2000; St Lawrence and Wang, 2005). Nevertheless, analyzing ASL data with tracer kinetic models that include both tissue and vascular contributions may improve quantification in tissues, such as white matter, that have significantly different relaxation rates from blood (Li et al, 2005; Parkes and Tofts, 2002; St Lawrence et al, 2000; St Lawrence and Wang, 2005). These models also offer the opportunity to estimate water permeability, which could provide a surrogate index of the integrity of BBB and may reflect the status of microcirculation (Barbier et al, 2002). For instance, permeability of the BBB has been reported to vary with age and may be altered in neurodegenerative diseases, neoplasm, and during central nervous system infections (Larsson and Tofts, 1992; Law et al, 2004; Li et al, 2005; Roberts et al, 2000; Tofts and Kermode, 1991; Wolf et al, 2005). Estimation of water permeability, therefore, is important for improved perfusion quantification using ASL, as well as for assessing the functional status of the BBB.
Existing knowledge on water permeability came from studies that either directly measured the extraction fraction of labeled water (Friis et al, 1980; Paulson et al, 1977), or indirectly by comparison to perfusion values obtained with other tracers (Eichling et al, 1974; St Lawrence and Lee, 1998). Based on these results, several recent studies explored the effect of limited water permeability on perfusion quantification with ASL (Ewing et al, 2001; Li et al, 2005; Parkes and Tofts, 2002; St Lawrence et al, 2000; Zhou et al, 2001). A moderate, yet significant, perfusion error has been shown, which is generally larger in continuous than pulsed ASL methods, at high versus low magnetic field strength, in white matter compared with gray matter, and with high as opposed to low flow rates. Two studies included water permeability as a fitting parameter when analyzing ASL data acquired at multiple delay times (Li et al, 2005; Parkes and Tofts, 2002). However, the estimated water exchange rates from the two studies were considerably different and showed large intersubject variability. These differences could be attributed to the moderate sensitivity of the ASL signal to variations in water permeability because of the similarity of the relaxation rates in blood and brain tissue. In animal experiments, estimation of the water extraction fraction has been attempted with ASL by differentiating the fractions of labeled water in the vascular and tissue compartments (Silva et al, 1997a, b; Zaharchuk et al, 1998). This was achieved by suppressing the vascular signal using either diffusion gradients or a long-lived vascular contrast agent, or by suppressing the tissue signal through magnetization-transfer (MT) effects.
In the present study, we attempted to separate the vascular and tissue compartments in human brain with diffusion-weighted (DW) perfusion magnetic resonance imaging. A series of ASL perfusion scans with varying diffusion weightings were acquired to fit the fractions of ASL signals in the vascular and tissue compartments, which have fast and slow diffusion properties, respectively (Silva et al, 1997a). The single-pass approximation (SPA) model was used to determine the water exchange rate from the vascular and tissue fractions (St Lawrence et al, 2000; St Lawrence and Wang, 2005).
Methods
Imaging Sequence
The DW perfusion sequence was a hybrid of the amplitude-modulated continuous ASL (CASL) technique (Alsop and Detre, 1998; Wang et al, 2005a) and a twice-refocused spin—echo diffusion sequence supplied by the vendor (Reese et al, 2003) (Figure 1). Continuous ASL was performed with a 1.6 mT/m gradient and 2.25 μT RF irradiation applied 8 cm beneath the center of the acquired slices. An amplitude-modulated version of the labeling pulse based on a sinusoid function was used for control labeling with a modulation frequency of 100 Hz and peak amplitude of 3.18 μT. The tagging/control duration was 2.6 secs. Three delay times (0.8, 1.2, and 1.5 secs) between the end of the labeling pulse and image acquisition were used in the experiment. Interleaved images with and without labeling were acquired using a single-shot spin—echo echo-planar imaging (EPI) sequence with two refocusing pulses. Two pairs of bipolar gradients were applied along the slice direction (between the excitation pulse and EPI acquisition), with the RF refocusing pulses dividing each bipolar pair. Bipolar gradients with varying degrees of diffusion weighting were performed, namely b = 0, 25, 50, 100, 150, 200, and 300 secs/mm2 for the delay time of 0.8 secs, and b = 0, 10, 25, 50, 100, and 200 secs/mm2 for the delay times of 1.2 and 1.5 secs. We chose a lower maximum b value for the longer delay times because the perfusion signal relaxes with increasing delay. The durations of the four lobes of the bipolar gradients were optimized to minimize effects of eddy currents during EPI readout, and were 7, 11, 12, and 6 ms for the delay time of 0.8 sec, and 6, 10, 11, and 5 ms for the delay times of 1.2 and 1.5 secs, respectively. The maximum gradient strength was 31 mT/m with a ramp time of 200 μsecs.
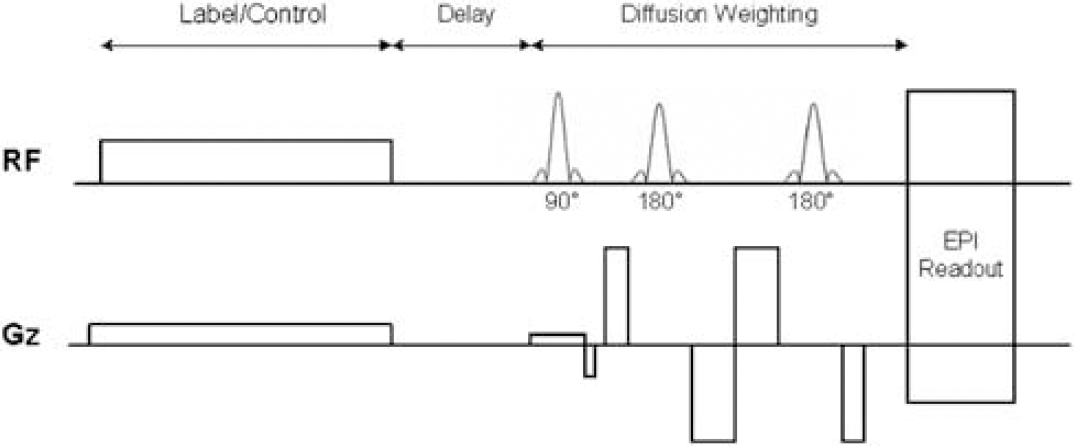
Diagram of the hybrid sequence combining CASL and twice-refocused spin—echo methods. RF and gradients along the slice direction are shown.
Magnetic Resonance Scanning
Magnetic resonance (MR) scanning was conducted on a Siemens 3.0T Trio whole-body scanner (Siemens AG, Erlangen, Germany), using a standard Transmit/Receive (Tx/Rx) head coil. Written informed consent was obtained before all human studies according to a protocol approved by the University of Pennsylvania Institutional Review Board. Thirteen healthy subjects (6 women, aged 22 to 33 years, mean 26.4 years) participated in the experiment, with 5 subjects undergoing perfusion magnetic resonance imaging scanning with the 0.8 sec delay, 4 subjects scanned with the 1.2 secs delay, and the rest 4 subjects scanned with the 1.5 secs delay time. Acquisition parameters were: FOV = 22 cm, matrix = 64 × 64, bandwidth = 3 kHz/pixel, 6/8 partial K-space, TR = 4.0 to 4.5 secs, TE = 60 (delay = 0.8 sec) or 55 ms (delay = 1.2 and 1.5 secs). Four slices (6 to 8 mm thickness with 2 to 3 mm gap) were acquired from inferior to superior in a sequential order, and each slice acquisition took approximately 90 ms. Each CASL scan with 80 acquisitions took 5.5 mins, which was repeated in each subject to acquire series of perfusion images with systematically varied b values (see above). The order of CASL scans with different diffusion weightings was counterbalanced across subjects.
Data Processing
The raw EPI images in each scan acquired at a particular b value and delay time were separated into label and control pairs and then pair-wise subtracted. Temporal fluctuations in the difference ASL image series owing to motion, physiologic noise, and residual eddy currents were minimized using an algorithm based on principal component analysis (Alsop and Detre, 1997), followed by averaging across the image series to form the mean ASL perfusion images (ΔM). The SPM software package was used to segment the raw EPI images into three whole brain regions of interest (ROI): gray matter, white matter, and cerebrospinal fluid. The mean ΔM signals were measured within the gray matter ROIs, which were fitted according to a bi-exponential model with the b value as the independent variable (Silva et al, 1997a):
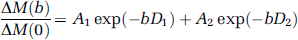
where the weighting factors, A1 and A2, are the fractions of the fast (vascular) and slow (tissue) components of the signal attenuation curve, respectively (A1 + A2 = 1), and D1 and D2 are the corresponding (pseudo-) apparent diffusion coefficients (ADCs). The fitting procedures were performed using the Origin 7.5 software package (OriginLab, Northampton, MA, USA) on each subject's data, as well as on the group ΔM signals averaged across all subjects for each delay time (0.8, 1.2, and 1.5 secs). The SPA model was used to interpret A1 and A2 in terms of water exchange between the vascular and tissue compartments (see the Appendix). Additionally, the raw EPI intensities of the control acquisitions (M) were measured within the gray matter ROIs, and fitted based on the bi-exponential model (equation (1)) as described above (Le Bihan and Turner, 1992). Note the ΔM signal represents the signal of the labeled water alone, whereas the M signal consists of static brain tissue and non-labeled water signals.
Single-Pass Approximation Model Simulation
To estimate water permeability from the fitted weighting factors A1 and A2, simulation was performed based on the SPA model including two compartments for capillary and brain tissue, using a program written in IDL (RSI, Boulder, CO, USA). Arterial and venous compartments were ignored owing to the use of a delay time in our experiment and minimal venous outflow within regular flow range (St Lawrence et al, 2000; St Lawrence and Wang, 2005). A numerical technique was used that divided a single capillary transit of the labeled spins (defined as the capillary volume, Vc, divided by the cerebral blood flow, f) into small, consecutive time segments (n = 400) to allow calculation of exchange effects in a stepwise fashion. Details of the theoretical background were described in our earlier publications (St Lawrence et al, 2000; St Lawrence and Wang, 2005). Assumed T1′s for brain tissue (gray matter) and blood at 3.0 T were 1.26 and 1.49 secs (Wang et al, 2002), and T2′s were 80, 120, and 40 ms for brain tissue (gray matter), arterial, and venous blood, respectively (St Lawrence and Wang, 2005). The arterial transit time (ATT) for the labeled spins to reach capillaries was assumed to be 1.4 secs based on our previous measurement (Wang et al, 2003). The ratio of extravascular (Se) and capillary (Sc) ASL signals was calculated whereas three parameters were systematically varied in the SPA model, that is, the permeability surface-area product (PS, from 20 to 400 in step of 20 ml/100 g min), Vc (from 0.4 to 3.0 in step of 0.2 ml/100 g) and f (from 30 to 105 in step of 15 ml/100 gmin).
Patient Scanning
An improved hybrid technique, which combined a pseudo-CASL (pCASL) method (Garcia et al, 2005) with the twice-refocused spin—echo diffusion sequence, was used for clinical MR scanning on a brain tumor patient (21 years male, grade II oligodendroglioma), using the standard Tx/Rx head coil. Compared with the amplitude-modulated CASL, the pCASL approach provided improved labeling efficiency (~90%) and reduced MT effects (Fernandez-Seara et al, 2006). The pCASL pulse (Garcia et al, 2005) consisted of 1600 selective RF pulses, played sequentially, at equal spacing, for a 1.5-sec labeling duration. Each RF pulse was shaped as a modified Hanning window (peak/average B1 = 5.3/1.8 μT, duration = 500 μsecs, and peak/average G = 6.0/2.3 mT/m). Imaging parameters were: postlabeling delay time = 1.2 secs, TR/TE = 4500/46 ms, 22 cm FOV, 64 × 64 matrix, ten 8 mm slices with 2 mm gap. Two scans (80 acq each) with b = 0 and 50 secs/mm2 were performed on the brain tumor patient. Data analyses followed the steps described above, and ROIs were manually drawn by a neuroradiologist (SW) in the solid part of the tumor, and normal gray matter on the same slices, based on structural MR images (FLAIR and T1 after contrast). Another ROI was also manually drawn in the tumor region manifesting high blood flow in the perfusion images acquired with b = 0 sec/mm2. The mean difference ASL signals (ΔM) acquired with b = 0 and 50 secs/mm2 were extracted in these three ROIs.
Results
Diffusion-Weighted Arterial Spin Labeling Signal Attenuation Curves
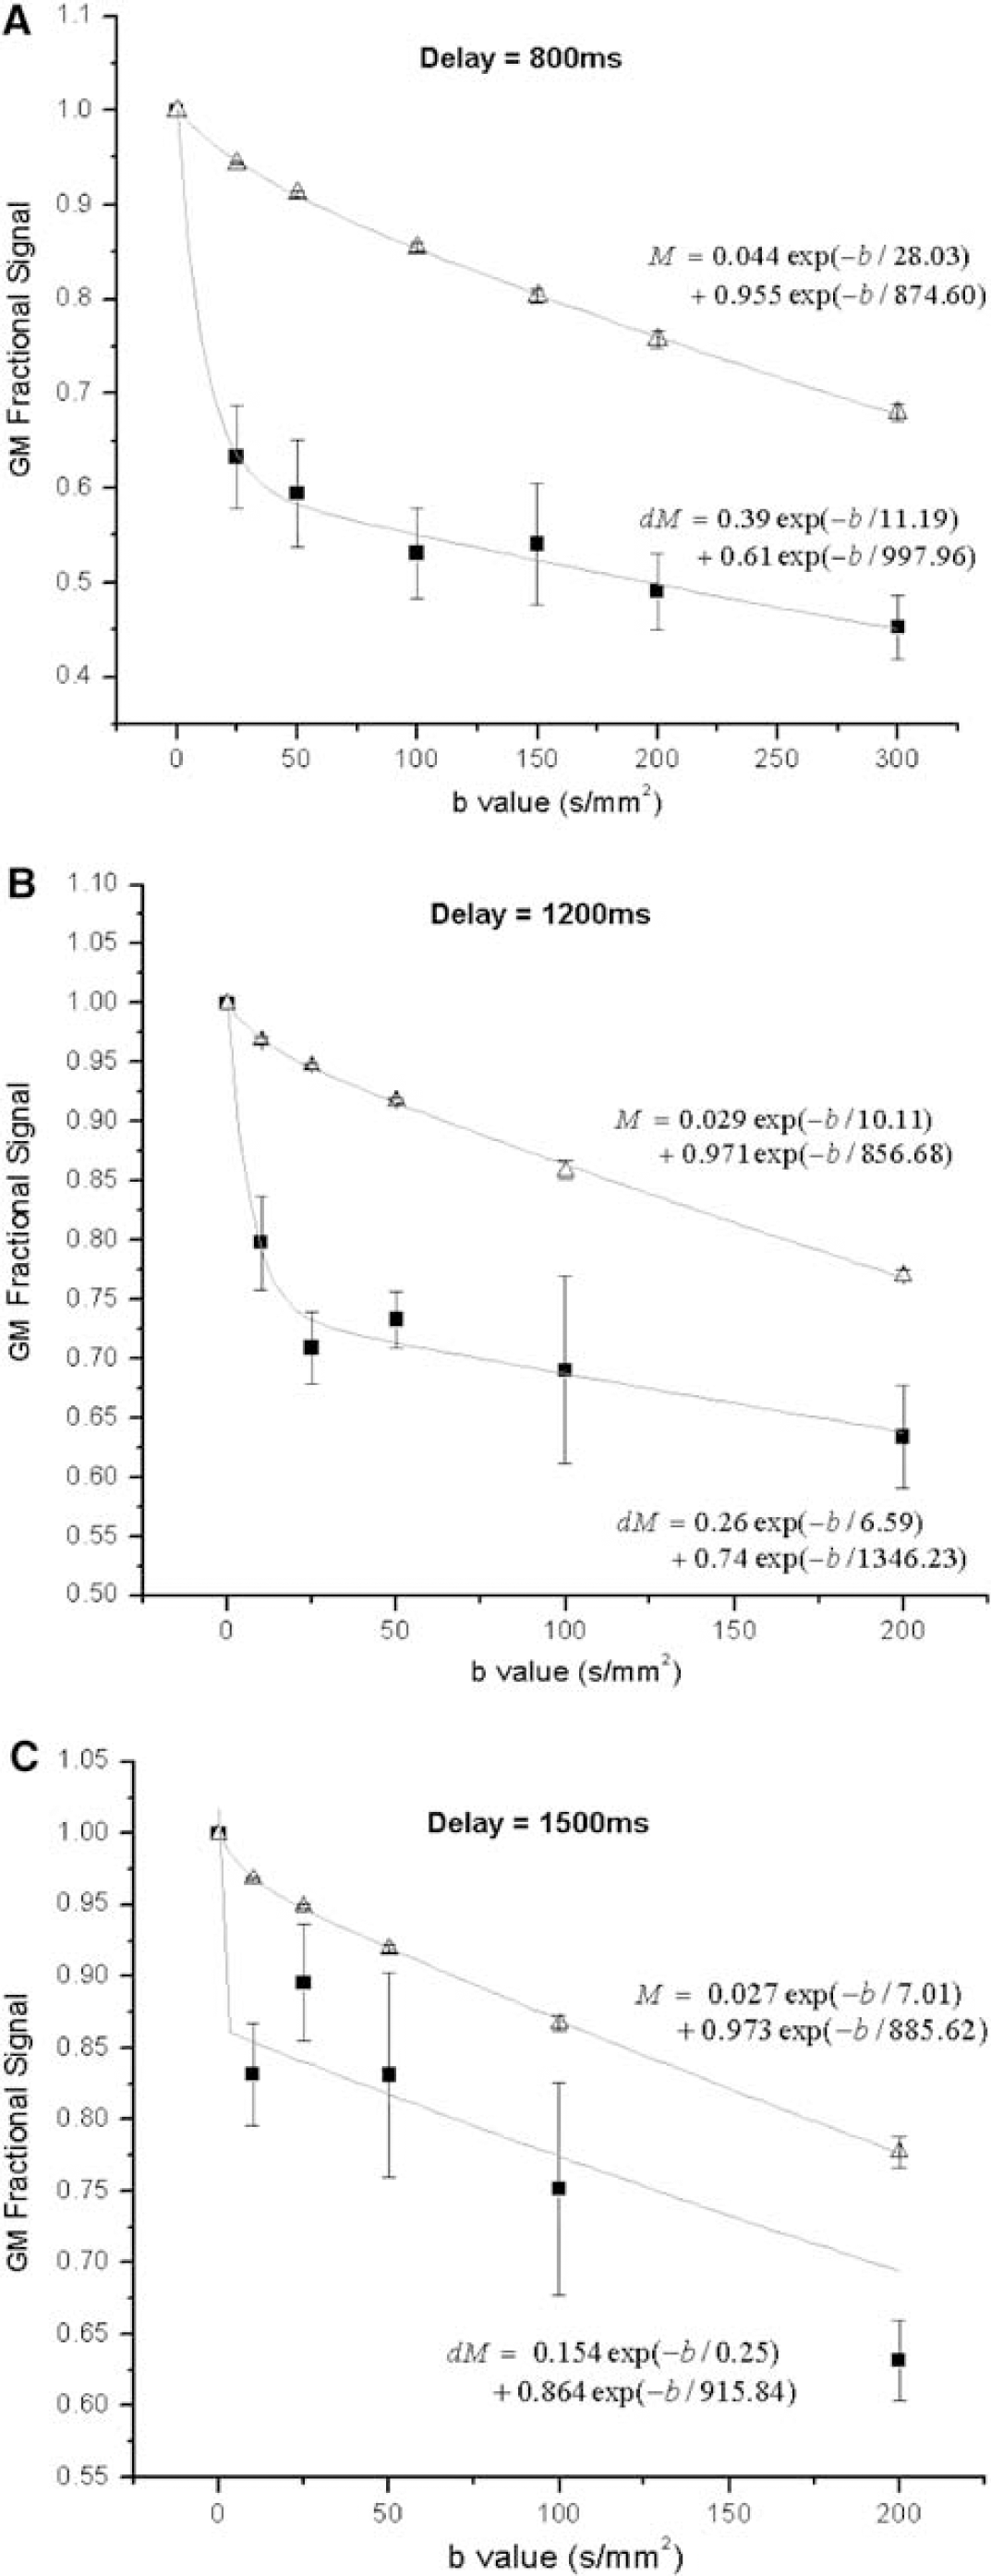
The bi-exponential fitting was successful in all subjects for the gray matter ΔM signals. Figure 2 shows attenuation curves of the mean ΔM and raw EPI (M) signals (within gray matter ROIs) with increasing b values acquired at the three delay times of 0.8 (A), 1.2 secs (B), and 1.5 secs (C). Figure 3 displays representative ΔM images with series of b values acquired at the three delay times. The ΔM signal curves appear to consist of a fast and a slow decaying component. The fast attenuation component becomes less obvious for the prolonged delay of 1.5 secs, as the labeled spins exchange into brain tissue with time. With the delay time of 0.8 secs, the fitted weighting factor for the slow component (A2) was 61%, which increased to 74% and 86% when the delay time was prolonged to 1.2 and 1.5 secs, respectively. A relatively clean separation of the fast and slow components of the ΔM attenuation curve could be achieved with the b value of 50 secs/mm2 at which there was only less than 2% signal of the fast decaying component, whereas the slow component still retained more than 95% of the signal.
The mean ASL signals (ΔM, filled square) and raw EPI intensities (M, open triangle) measured within the gray matter ROIs acquired with the delay time of 800 ms (
The ASL difference (ΔM) perfusion images of three representative subjects acquired with the delay time of 800, 1200, and 1500 ms, respectively. Series of ΔM images with varying diffusion weightings (b values) are shown. Reasonable image quality can be achieved with relatively large b values of 200 or 300 secs/mm2.
Fitted parameters in each individual subject for the gray matter ROIs are listed in Tables 1, 2 and 3. In general, the bi-exponential model accounted well for the experimental data acquired with shorter delays of 0.8 and 1.2 secs, with a minimal correlation coefficient (R) of 0.90 between the estimated and experimental data. For the delay of 1.5 secs, the bi-exponential model accounted moderately well for the experimental data, with a minimal R of 0.68. Although the estimated ADCs (D1 and D2) showed relatively large intersubject variability and large confidence intervals of parameter estimation as listed in Tables 1–3, the fitted fractions (A1 and A2) of the fast and slow decaying components were quite stable. The difference in the estimated A1 and A2 values at the three delay times of 0.8, 1.2, and 1.5 secs reached statistical significance using analysis of variance (F(2, 10) = 7.11, P = 0.011). Post hoc analyses indicated that the difference in A1 and A2 was significant (P < 0.05, unpaired t-test, one-tail) between each pair of the delay times.
Curve fitting results of the ΔM signals within gray matter ROI (acquired with the delay time of 0.8 secs) as a function of b value
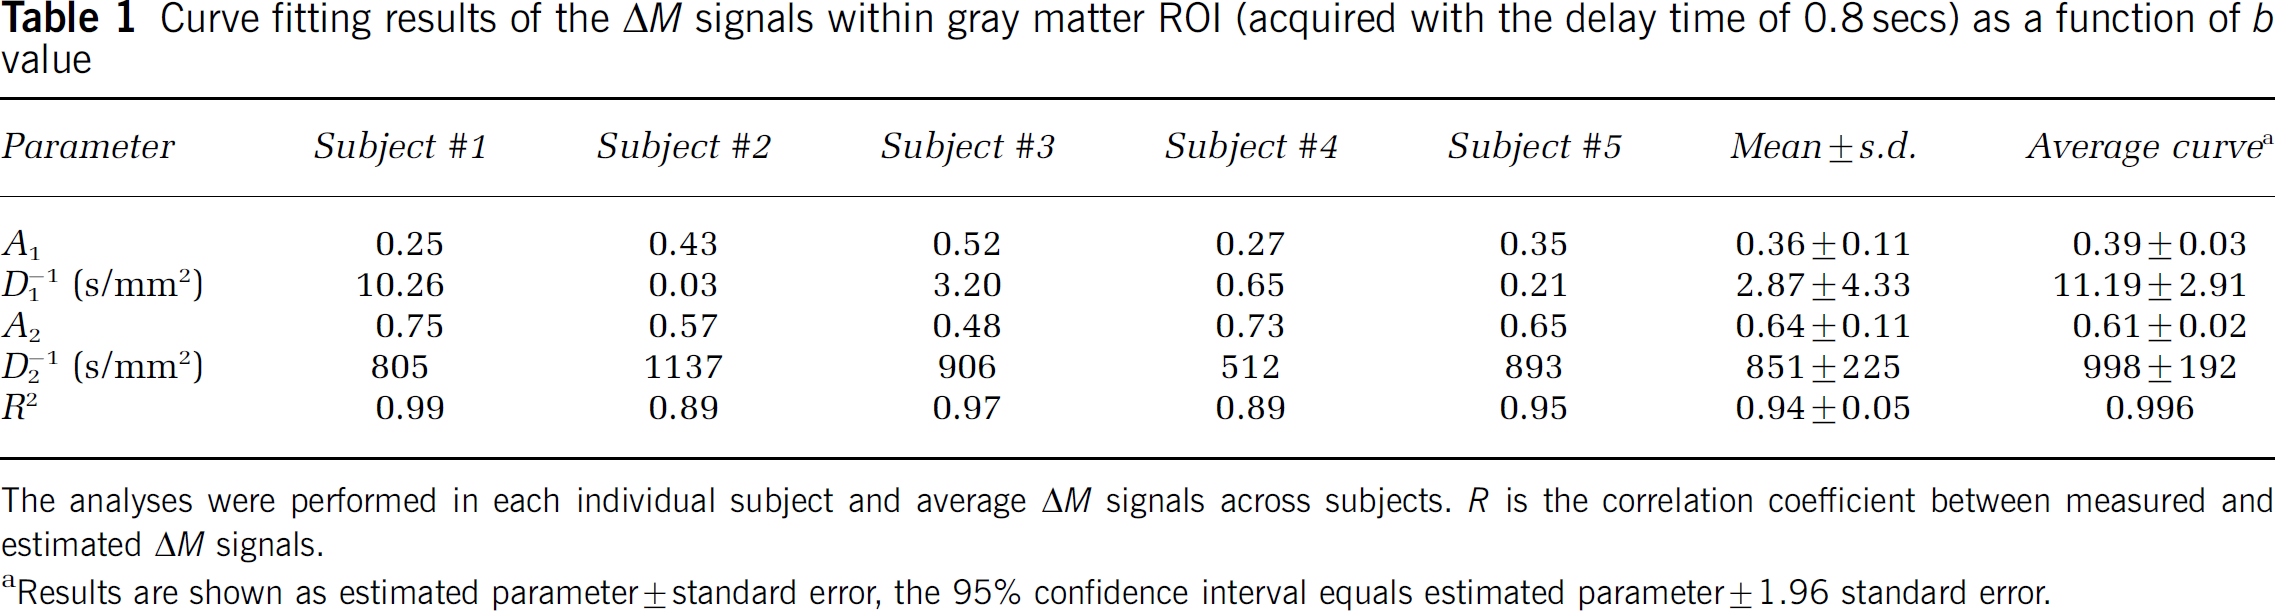
The analyses were performed in each individual subject and average ΔM signals across subjects. R is the correlation coefficient between measured and estimated ΔM signals.
Results are shown as estimated parameter ± standard error, the 95% confidence interval equals estimated parameter ± 1.96 standard error.
Curve fitting results of the ΔM signals within gray matter ROI (acquired with the delay time of 1.2 s) as a function of b value
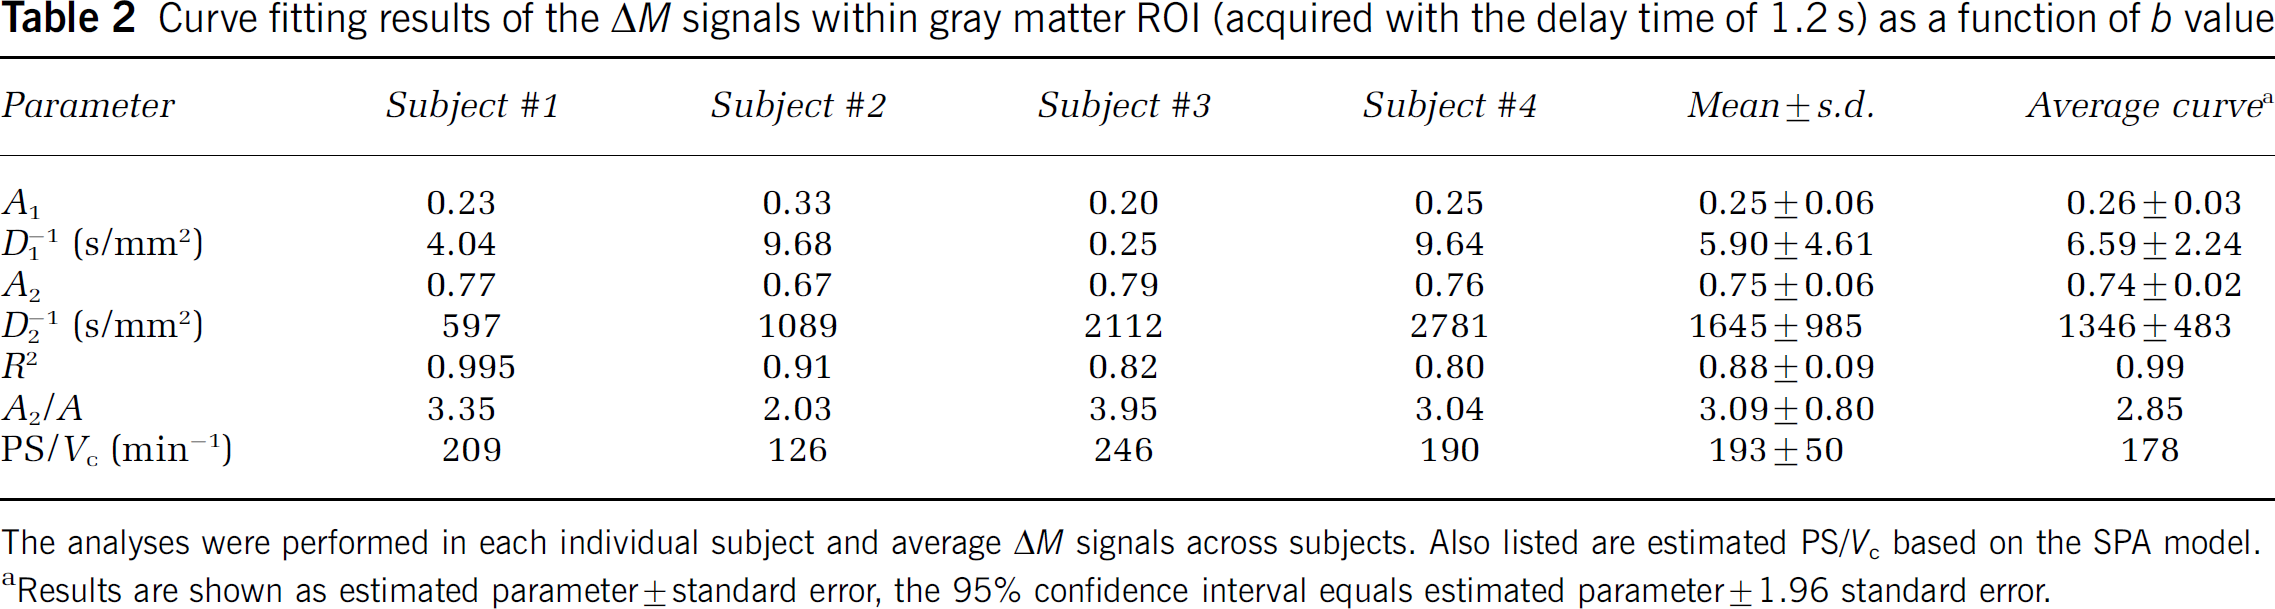
The analyses were performed in each individual subject and average ΔM signals across subjects. Also listed are estimated PS/Vc based on the SPA model.
Results are shown as estimated parameter ± standard error, the 95% confidence interval equals estimated parameter ± 1.96 standard error.
Curve fitting results of the ΔM signals within gray matter ROI (acquired with the delay time of 1.5 secs) as a function of b value
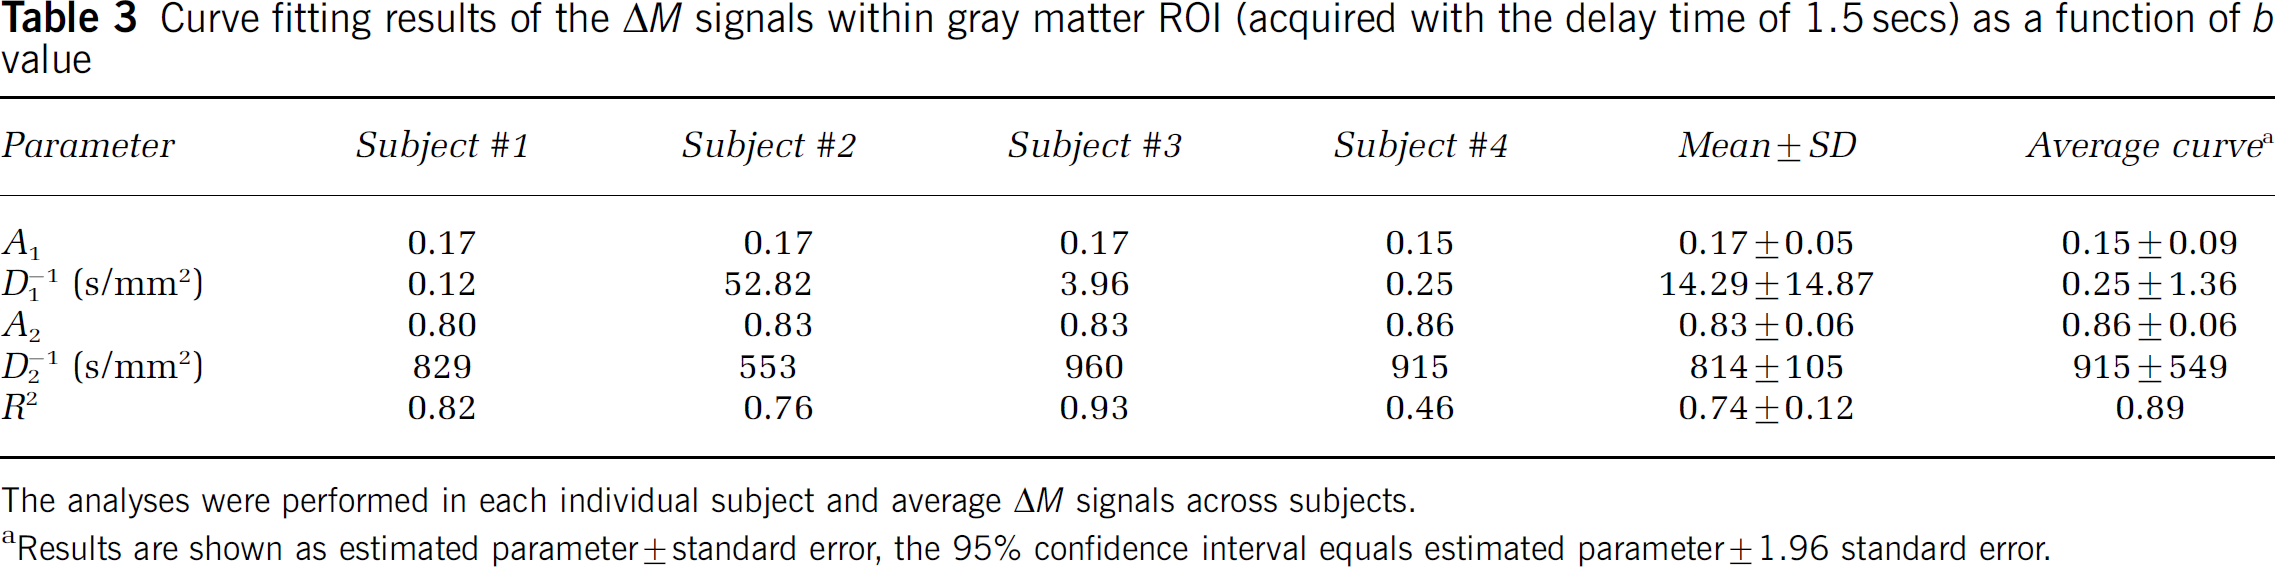
The analyses were performed in each individual subject and average ΔM signals across subjects.
Results are shown as estimated parameter ± standard error, the 95% confidence interval equals estimated parameter ± 1.96 standard error.
The raw EPI signal curves (M) could also be fitted with the bi-exponential decay model, with convergent results in every subject. The proportion of the fast decaying component ranged from 2% to 6%. As can be seen in Figure 2, the ADC of the slow decaying component of the M signal curve (ADC−1 = 875, 857, and 886 secs/mm2 for 0.8, 1.2, and 1.5 secs delay, respectively) seemed higher than the counterparts of the ΔM signal curve (ADC−1 = 998, 1346, and 916 secs/mm2 for 0.8, 1.2, and 1.5 secs delay, respectively). However, no statistically significant difference (P > 0.1) was detected by paired t-test (one-tail), suggesting that the slow decaying components of the ΔM and M signal curves may share common diffusion properties. This result suggests that the ADC values of the slow component of the ΔM and M signal may be interchangeable, thereby may improve the efficiency of parameter estimation to derive A1 and A2 from the ΔM signal curve.
Estimation of Water Permeability
Figure 4A shows the SPA model simulation results (ratio of extravascular and capillary signals, Se/Sc) within wide ranges of Vc and PS (f = 60 ml/100g min in this particular plot). Variations in Vc and PS exerted opposite effects on the ratio of Se and Sc. Although an increased PS facilitated the exchange of labeled spins into brain tissue (higher Se/Sc), a larger Vc retained more labeled spins in the vasculature (lower Se/Sc). As suggested by previous studies (Li et al, 2005; Parkes and Tofts, 2002; Zhou et al, 2001), the water exchange rate constant, defined as PS/Vc, is a critical parameter in the theoretical modeling of the water permeability effect (see Appendix). We therefore plotted the ratio of Se and Sc as a function of PS/Vc at various flow rates (Figure 4B), and a very good linear relationship (Se/Sc = 0.016 PS/Vc, R = 0.998, P < 0.001) was observed. It is worth noting that the above simulation result applies when the used delay time is equal to or slightly shorter than the ATT for the labeled spins to reach capillaries (assumed to be 1.4 secs). If the delay time is considerably shorter than ATT, there will be a significant arterial component in addition to the assumed capillary and tissue compartments in the SPA model. In contrast, if the delay time is longer than ATT, the capillary compartment will not be filled with labeled spins. Consequently, the relationship between Se/Sc and PS/Vc will be nonlinear (see Figure 4C). In our experiment, data acquired with the delay time of 1.2 secs generally satisfied the above presumption (especially considering each slice acquisition took approximately 90 ms). As listed in Table 2, the calculated mean PS/Vc was 193 ± 50 min−1 from four subjects.
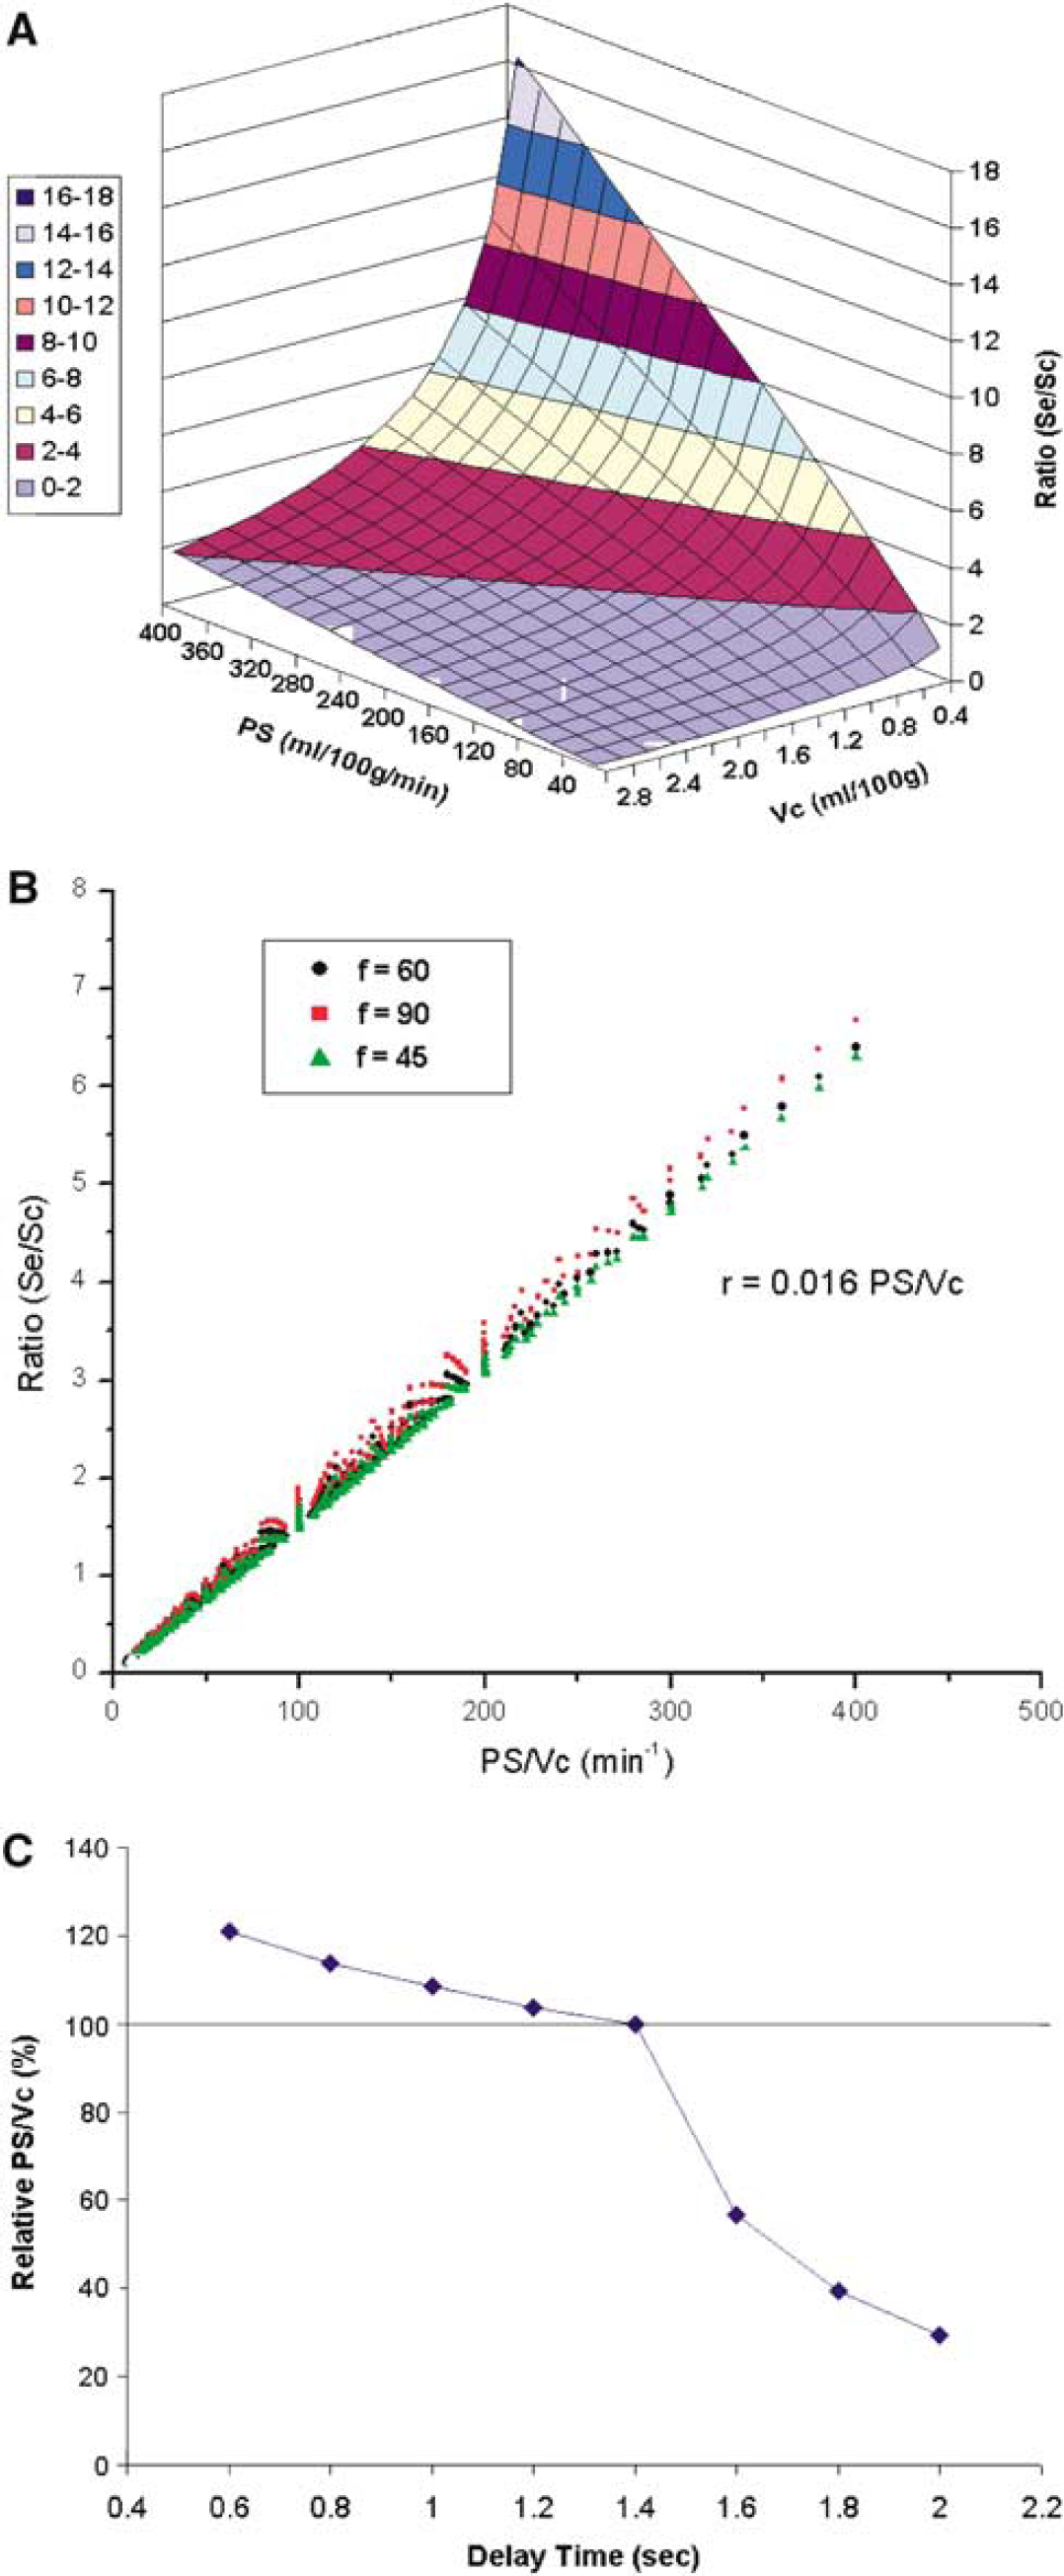
Simulation results based on the SPA model, showing (
From the acquired DW ASL data, it was possible to derive spatially resolved information of water permeability (exchange rate). In particular, a minimum of two-point ASL measurement with b = 0 and 50 secs/mm2 could be used for this purpose (see Figure 2). As shown earlier, the diffusion gradient of b = 50 secs/mm2 spoiled the majority of the fast component (vascular) signal (> 98%), whereas retaining over 95% of the slow component (tissue) signal. The ΔM signal acquired at b = 50 secs/mm2 can be treated as an approximation of the slow component signal, whereas the ΔM signal acquired at b = 0 represents the sum of the fast and slow component signals. The weighting factors A1 and A2 can therefore be directly estimated from the ratio of ΔM signals acquired at b = 0 and 50 secs/mm2. Based on our experimental data acquired with the delay time of 1200 ms (Figure 2B), this simplified method with 2 ASL acquisitions (b = 0 and 50 secs/mm2) may underestimate the PS/Vc by approximately 10% compared with multiple ASL measurements with b values up to 200 secs/mm2. Representative images of PS/Vc, from a single subject are displayed in Figure 5. To improve signal-to-noise ratio, a heavy spatial smoothing (full-width-at-half-maximum of two pixels) was applied to the ΔM images. In this particular subject, the mean PS/Vc in gray and white matter was 189 ± 56 and 166 ± 55 min−1 respectively. This was expected because the ratio of the gray to white matter values for both the PS product and Vc are approximately the same (Herscovitch et al, 1987).
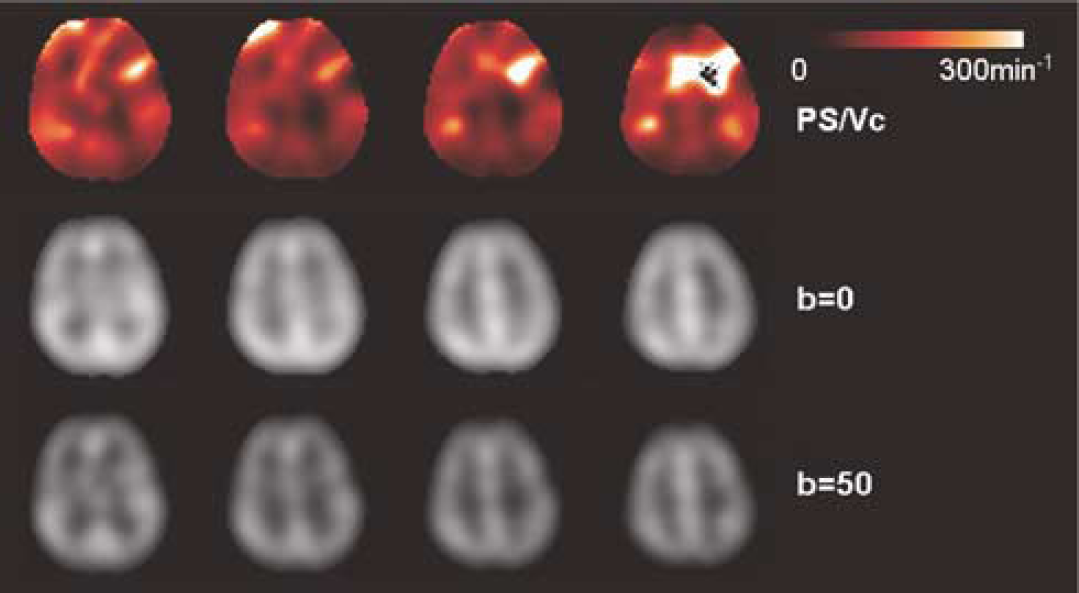
The ASL difference perfusion images of one representative subject acquired with b = 0 (middle row) and b = 50 secs/mm2 (bottom row) (delay time = 1200 ms), and the estimated PS/Vc images (top row). The ASL signals with b = 50 secs/mm2 are considered to only contain signals from brain tissue (slow decaying component), whereas the data with b = 0 represent the sum of vascular and tissue signals.
Clinical Application in Brain Tumor
The ASL images acquired with b = 0 and 50 secs/mm2 of a 21-year-old male with grade II oligodendroglioma are displayed in Figure 6A, along with EPI and postcontrast T1-weighted (3D SPGR) structural images. The ASL images without DW showed focal hyperperfusion in the right frontal tumor region, which was largely preserved during the acquisition with b = 50secs/mm2. In contrast, the perfusion signals in the surrounding gray matter were attenuated to a greater extent when the diffusion gradient of b = 50 secs/mm2 was applied. ROI analyses indicated that the fractional signal spoiled by the diffusion gradient was 16%, 20%, and 28% in the tumor region with high blood flow (blue), the solid part of tumor (red), and the normal gray matter (yellow), respectively (Figure 6). Based on SPA model simulation using the employed imaging parameters, and also assuming a constant ATT of 1.4 secs, the estimated PS/Vc was increased in the tumor region with high flow (generally corresponding to the aggressively growing part) (463.4 min−1) as well as the solid part of tumor (347.8 min−1) compared with the surrounding gray matter (223.6 min−1). This result is consistent with the postcontrast T1 images showing a focal enhancement (moderate degree) within the posterior part of the lesion (arrow). Caution has to be exercised in interpreting increased PS/Vc observed in brain tumor as increased water permeability, given that potential changes in Vc and ATT may lead to similar observations. The confounding effects on quantification of water permeability in brain tumor will be discussed below.
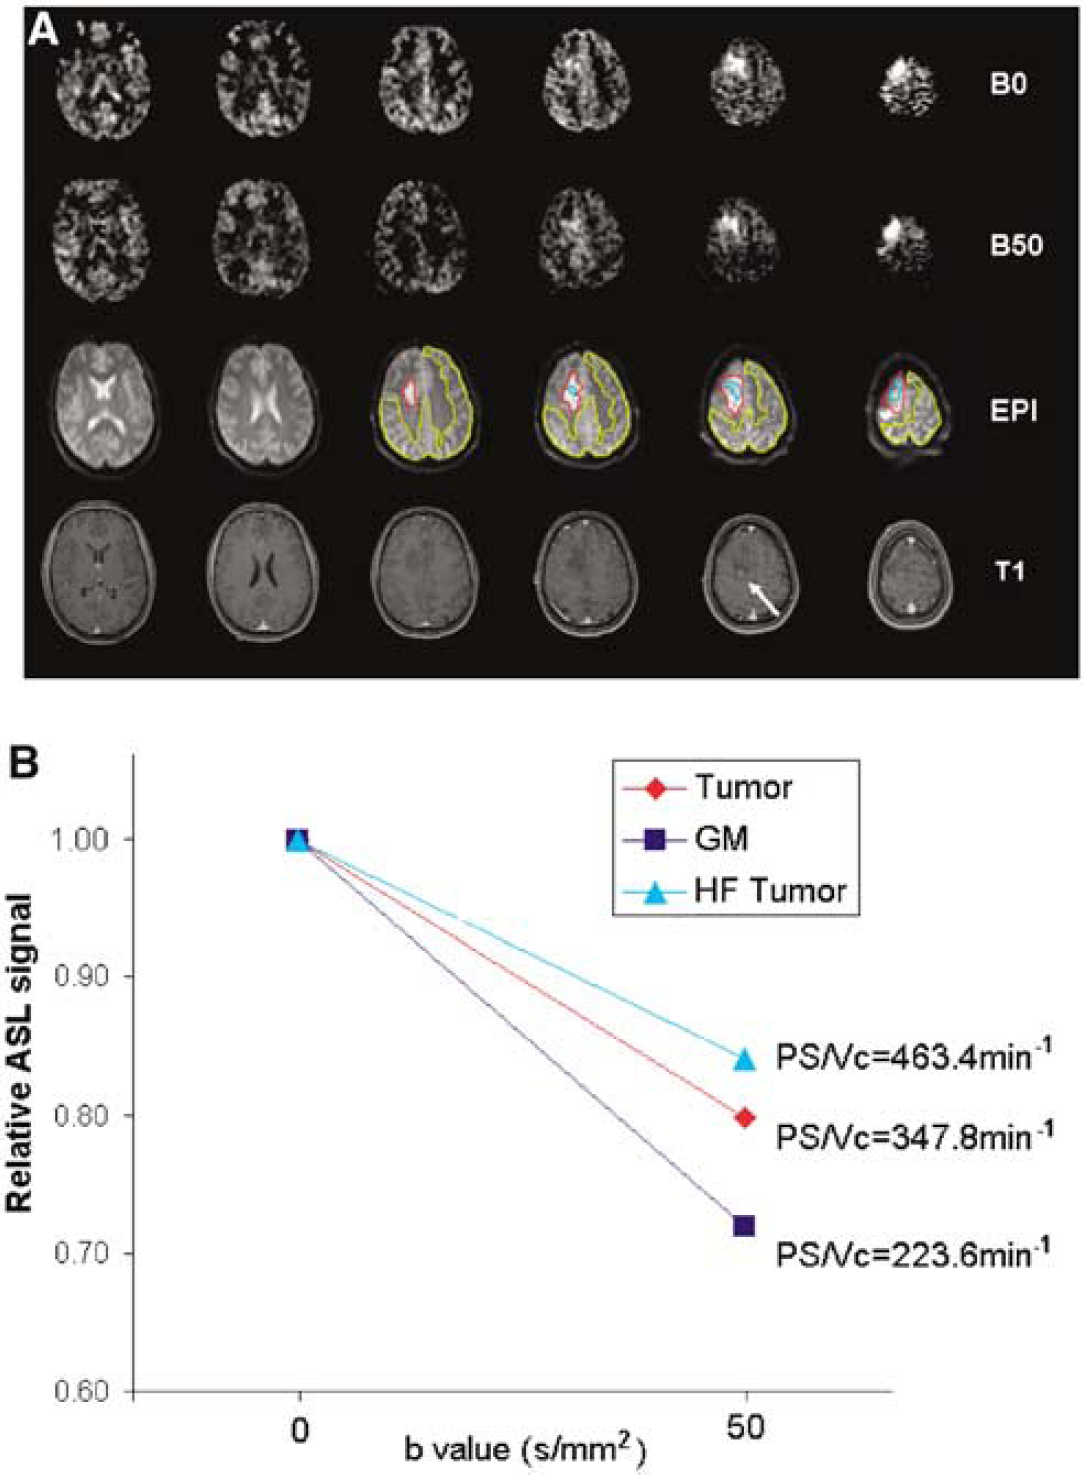
The ASL difference perfusion images of one brain tumor patient (21 year male, grade II oligodendroglioma) acquired with b = 0 and 50 secs/mm2 (delay time = 1200 ms), along with raw EPI and post-contrast 3D T1 weighted SPGR structural images (
Discussion
The present study showed a fast and a slow decaying component in the attenuation curves of ASL signals acquired with varying degrees of diffusion weighting (b value). The results are consistent with earlier animal studies (Silva et al, 1997a, b ), supporting a limited exchange rate of blood water across the BBB. However, in the previous animal study (Silva et al, 1997a), MR signal acquisition was performed immediately after the labeling pulses, leaving the possibility that the observed fast decay may arise primarily from large arteries. In the present study, a delay time was used between labeling pulses and image acquisition to minimize the effect of arterial contributions in the ASL signal (Alsop and Detre, 1996). The fast decay we observed should be attributed primarily to labeled spins in arterioles and capillaries. With a prolonged delay time, the observed tissue fraction of labeled water (A2) was significantly increased compared with that measured at a shorter delay time, suggesting that the labeled spins gradually exchange into brain tissue with time. Nevertheless, even with a relatively long delay time of 1.5 secs, the tissue fraction was still significantly lower than 100% (P < 0.001, unpaired t-test, one-tail), providing further evidence for the limited exchange of blood water (St Lawrence et al, 2000).
The limited exchange of blood water detected using our method is consistent with previous physiologic findings (Paulson, 2002; Paulson et al, 1977). Specifically, two related physical/physiologic processes contribute to the permeability of capillary wall to water molecules: water diffusion (i.e., the passage of water across the capillary wall in consequence of Brownian movements) and water filtration (i.e., the movement of water across the capillary wall in presence of an osmotic or hydrostatic pressure gradient). In capillaries outside the central nervous system, slits and pores between endothelial cells have major influence on water filtration because bulk flow across the capillary wall can take place through these pores and slits. However, pores or slits between the endothelial cells will only have minor influence of water diffusion because the total surface area of these pores and slits is a very small part of the whole capillary surface area. Within the central nervous system, however, aquaporins only allow for water diffusion and not for water filtration because the diameter of aquaporins is on the order of a single water molecule. Therefore, the ratio between water filtration and diffusion across the BBB is close to unity whereas it is fifty or more outside the central nervous system (e.g., muscles).
In the present study, the definitions of the weighting factors A1 and A2 in the bi-exponential model primarily depend on the water exchange rate constant PS/Vc as well as the tissue relaxation rate R1 (see equation (A.4) in Appendix). This is in contrast to previous studies that interpreted these weighting factors in terms of the water extraction fraction (E); that is, A1 = 1 – E and A2 = E (Silva et al, 1997a, b ; Zaharchuk et al, 1998). Their interpretation was based on the assumption that the extraction of labeled water into the tissue is instantaneous and consequently, relaxation of the label in the capillary bed is ignored. However, exchange occurs throughout the passage of water from the arterial to venous side of the capillary bed. Considering that the mean capillary transit time (i.e., Vc/f) is similar in value to T1, both water exchange and relaxation should be accounted for when defining the concentrations of labeled water in the tissue and capillary compartments. Another reason we avoid the use of water extraction fraction is that it depends on several imaging parameters such as the duration of labeling pulses and postlabeling delay time.
One challenge for estimating water permeability using the DW ASL method is to reliably and accurately measure ASL signals in the presence of large diffusion gradients, which spoil a considerable portion of ASL signals. The somewhat inevitable eddy currents magnify the temporal fluctuations of the raw images, thereby affecting the accuracy of perfusion measurements relying on signal averaging across image series. On top of these effects, the signal-to-noise ratio in ASL methods is inherently low. These factors combined probably explain why there has been only one MR study in animals using the DW ASL approach and only FID signals (not imaging data) were recorded during that experiment (Silva et al, 1997a). In the present study, we were able to acquire ASL images with b values up to 300 secs/mm2. This was building on two recent technical advancements including improved signal-to-noise ratio through implementation of ASL at high magnetic field (Wang et al, 2002; Wang et al, 2005a), and minimized effects of eddy currents using the twice-refocused spin—echo diffusion sequence (Reese et al, 2003). The temporal fluctuation level of the raw EPI images acquired with large diffusion gradients (b = 200 or 300 secs/mm2) was about twice that acquired with no diffusion weighting (b = 0). A principal component analysis-based algorithm was used to reduce effects of temporal instability of raw EPI image series on perfusion images (Alsop and Detre, 1997). We were able to reliably measure DW ASL signals at least in large ROIs with relatively high blood flow (e.g., gray matter) in the present study. The image quality of the proposed technique was further improved through implementation of novel spin labeling schemes with improved efficiency (Garcia et al, 2005), as shown in the case of brain tumor. Additionally, the use of array coil for image acquisition in ASL perfusion magnetic resonance imaging has been shown to provide more than twofold signal gain compared with a standard transmit/receive coil (Wang et al, 2005b). Temporal stability of the DW image series may be further improved with background suppression techniques (St Lawrence et al, 2005; Ye et al, 2000).
The methodological scheme of the proposed DW ASL method is analogous to the FEAST (Wang et al, 2003) and other ASL techniques using flow-spoiling gradients (Ye et al, 1997). However, given the main goal was to spoil intravascular signals, the majority of existing ASL methods used bipolar gradients with relatively weak strength (maximum b = 10 to 20 secs/mm2). Additionally, these studies used a short or even no postlabeling delay time so that the effect of intravascular signals was visible. In the present study, a relatively long delay time was applied to allow the majority of labeled spins to reach microvasculature, along with strong diffusion gradients to separate ASL signals in the capillary and tissue compartments. Depending on the choice of these two parameters, that is, delay time and diffusion gradient strength, ASL techniques can be made to be primarily sensitive to signals from one of the arterial, capillary, and tissue compartments. The intrinsic diffusion weighting of the EPI readout echo train has been estimated to be on the order of 10−4 secs/mm2 therefore was ignored in our experiment.
Our estimation of water permeability (PS/Vc = 193 ± 50 min−1) of human brain is in line with literature values in a number of species. It has been reported that capillary space contains approximately 33% of the total blood volume (Sharan et al, 1989; van Zijl et al, 1998). Assuming a total blood volume of 4.5 ml/100 g in the gray matter (Zhou et al, 2001), Vc is on the order of 1.5 ml/100 g, which leads to a PS value of approximately 280 ml/100 g min in our study. Reported PS values in the cortex ranged from 50 to over 170 ml/100 g min in mammals including rat (54 ml/100 g min, Bolwig and Lassen, 1975), monkey (114 ml/100 g min, Eichling et al, 1974; 173 ml/100 g min, Larson et al, 1987), baboon (104 ml/100 g min, Raichle et al, 1983), and human (144 ml/100 g min, Paulson et al, 1977; 104 ml/100 g min, Herscovitch et al, 1987). Our estimation of PS is above the reported range, which may be affected by the choices of Vc, delay time and ATT. Nevertheless, the intersubject variability of the estimated water exchange rate and permeability is considerably smaller than other MR-based approaches (Li et al, 2005; Parkes and Tofts, 2002).
Using an improved DW ASL technique, the brain tumor case showed increased water permeability in either tumor region with high flow or the solid part of tumor, as compared with surrounding gray matter. This result was consistent with postcontrast T1-weighted images showing a moderate degree of signal enhancement. However, the accuracy of PS/Vc quantification may be confounded by potential variations in ATT between tumor and normal tissue, as shown in the simulation results of Figure 4C. Ideally, the FEAST technique needs to be performed for estimation of ATT in brain tumor. Limited by time, this was not possible in our clinical scan. Nevertheless, we showed that DW ASL images (b = 50 secs/mm2) with reasonable quality can be obtained in a clinical setting, which have the potential for quantitative mapping of water permeability. Alternatively, to minimize the effect of variable ATT, we may perform DW ASL scans at a shorter delay time (≤ ATT, e.g., 0.8 secs) with a small b value (e.g., 8 secs/mm2) to spoil the arterial signals. Such scan represents the summation of capillary and tissue signals, which, in conjunction with the b = 50 secs/mm2 scan, can be used for accurate estimation of PS/Vc. This direction is actively being pursued in our lab.
One caveat of the present study is that we assume the fast and slow components correspond to the capillary and tissue compartments for estimation of PS/Vc (with the delay time of 1.2 secs). It is possible that the fast component may contain residual arterial and arteriolar contributions, and that the slow component may contain contributions from capillaries and venules as well. This issue certainly merits further investigation. Another caveat of the present study is the MT effect caused by the long labeling pulses, which may reduce the tissue ASL signal through shortened T1. We assessed the magnitude of the MT effect following the approach proposed by Ye et al. (1997). In the presence of continuous labeling pulses, the T1 of brain tissue reduced from approximately 1.3 to 0.9 secs. However, the majority of tissue ASL signals recovered during the long delay of 1.2 secs, resulting in only 3% reduction in measured ASL signal as indicated by simulation using the SPA model. In the case of pseudo-continuous labeling pulses, the MT-induced signal reduction was even smaller. The MT effect was therefore ignored in our model to estimate water permeability. In the present study, diffusion gradients were applied along the slice direction. Because blood flow in the microvasculature and tissue (perfusion) is generally considered without a preferential direction (i.e., isotropic) (Mchedlishvili, 1986), we expect to replicate the attenuation curves of the ΔM signal when diffusion gradients are applied along the x and y-axis or any other direction. Nevertheless, a potential benefit for applying diffusion gradients simultaneously along two or three directions is a shortened TE, which may lead to improved signal-to-noise ratio.
Conclusion
By marrying diffusion and perfusion magnetic resonance imaging, we were able to differentiate the signal contributions from capillaries and brain tissue in an ASL experiment, which could potentially be used to estimate water permeability of human brain.
Footnotes
Acknowledgements
The authors are grateful to Dr John Detre for his helpful comments, Dr Ronald Wolf for his help with the clinical scan.
Appendix
The amount of labeled water in the tissue volume as defined by the SPA model, ΔMSPA(t), can be separated into two compartments:
where ΔM
SPA
c(t) is the capillary contribution and ΔM
SPA
b(t) is the brain tissue contribution. Because we used a delayed-acquistion approach, arterial contributions were ignored. As well, the venous contribution was assumed negligible because of T1 and T2 relaxation of the labeled blood (St Lawrence and Wang, 2005). In terms of the SPA model, the weighting factors, A1 and A2, in ![]() are defined as
are defined as
For illustrative purposes, we present the definitions of ΔM SPA c(t) and ΔM SPA b(t) under the simplest labeling condition, that is, steady-state continuous labeling:
where f is cerebral blood flow, PS is the permeability surface-area product, Vc is the capillary distribution volume of water, R1 = 1/T1, R1a = 1/(T1 of arterial blood), E* = 1 - e−PS/f-R1aτ
c
, and τc is the capillary transit time (= Vc/f)(St Lawrence et al, 2000). Inserting these definitions into ![]() , the weighting factors are
, the weighting factors are
Equation (A.4) shows the direct relationship between the weighting factors and the water exchange rate constant, PS/Vc, which defines the flux of labeled water from capillaries into tissue. As with previous studies (Li et al, 2005; Parkes and Tofts, 2002), it is not possible to obtain an estimate of the PS product alone because the total flux into the tissue is governed by both PS and Vc.
The simple definitions of A1 and A2 presented in equation (A.4) ignore vacular transit times, the labeling duration, the acquisition delay, T2 weighting and magnetization transfer effects. To determine the exchange rate constant, PS/Vc, from the experimentally determined weighting factors A1 and A2, general solutions for ΔM SPA c(t) and ΔM SPA b(t) that included all of these factors were used (St Lawrence and Wang, 2005). These solutions were solved numerically, as discussed in the Methods section, to determine the the best-fit value for PS/Vc from the experimental values of A1 and A2. This analysis was only conducted on the data collected with a delayed acquisition of 1.2 secs to avoid significant arterial contributions (Wang et al, 2003).