
Abstract
Pseudo-continuous arterial spin labeling (pCASL) is a completely non-invasive method of cerebral perfusion measurement. However, cerebral blood flow (CBF) quantification is hampered by arterial transit artifacts characterized by bright vascular signals surrounded by decreased signals in tissue regions, which commonly appear in patients with reduced cerebral perfusion pressure. The spatial coefficient of variation (CoV) of pCASL CBF images has been proposed as an alternative region-of-interest (ROI)-based hemodynamic measure to predict prolonged arterial transit time (ATT). This retrospective study investigates the utility of spatial CoV by comparison with 15O positron emission tomography (PET). For patients with cerebrovascular steno-occlusive disease (n = 17), spatial CoV was positively correlated with ATT independently measured by pulsed arterial spin labeling (r = 0.597, p < 0.001), confirming its role as an ATT-like hemodynamic measure. Comparisons with 15O PET demonstrated that spatial CoV was positively correlated with vascular mean transit time (r = 0.587, p < 0.001) and negatively correlated with both resting CBF (r = −0.541, p = 0.001) and CBF response to hypercapnia (r = −0.373, p = 0.030). ROI-based spatial CoV calculated from single time-point pCASL can potentially detect subtle perfusion abnormalities in clinical settings.
Keywords
Introduction
Quantitative evaluation of cerebral blood flow (CBF) is indispensable in the assessment of brain pathophysiology and for making decisions about the course of treatment for patients with cerebrovascular steno-occlusive disease.1–3 In clinical practice, positron emission tomography (PET), single photon emission tomography, and bolus tracking techniques with computed tomography or magnetic resonance (MR) imaging have been employed for CBF imaging. 4 Arterial spin labeling (ASL) perfusion MR imaging is a completely non-invasive method that does not require radioactive tracers or contrast agents. 5 The recent advent of pseudo-continuous ASL (pCASL) combined with a 3D rapid readout sequence and a background suppression (BS) technique has enabled the production of high-quality ASL images and accelerated the use of routine clinical CBF examinations.6–10
The most important issue in pCASL imaging is optimization of the post-labeling delay (PLD), which is the time from labeling to image acquisition. PLD should be sufficient for all of the labeled blood to reach brain tissue capillaries, but longer PLD results in longer scan duration and lower signal-to-noise ratio (SNR) of ASL images because of blood’s relatively short T1 (i.e. 1650 ms at 3T). In the consensus paper published in 2015, a PLD of 2000 ms is recommend for adult clinical patients as a compromise between delivery of labeled blood to the imaging region and image SNR. 6 However, with single-PLD acquisition, reliable CBF estimates cannot be obtained for patients with cerebrovascular steno-occlusive disease who present regional delays in arterial transit time (ATT) of the labeled blood because of decreased perfusion pressure. Such brain areas show loss or attenuation of ASL signals caused by incomplete arrival of the labeled blood, or conversely, abnormally high ASL signals caused by stagnant labeled blood in the vasculature prior to entering tissue capillaries; this phenomenon, called arterial transit artifact (ATA), hampers CBF quantification.11,12
One approach to address ATA is to perform multi-timing ASL with analysis of the time-series images. Multi-timing ASL experiments provide both ATT and CBF maps, and their availability for assessing patients’ hemodynamic status has been reported using pulsed ASL (PASL).13–15 Recently, the feasibility of pCASL with multi-PLD acquisition for simultaneous measurement of CBF and ATT was reported for patients with cerebrovascular steno-occlusive disease.16–20 Although research on rapid acquisition is ongoing,21–24 pCASL with multi-PLD acquisition is not presently recommended for routine clinical use because of the additional scanning and complicated data processing required. 6 In addition, vascular crushing gradients are necessary to eliminate or suppress large vascular signals in ASL images, which is a prerequisite for application of the standard ASL kinetic model, which does not consider vascular components.25,26 However, the application of vascular crushing gradients inevitably reduces tissue-originated ASL signals and image SNR and therefore is not recommend in combination with multi-PLD pCASL acquisition. 6
Another possible approach is to evaluate the ATA itself that appears in ASL CBF images. Recently, researchers have proposed the use of the spatial signal distribution of single-PLD pCASL images (i.e. the spatial coefficient of variation (CoV) of CBF images) as a region-of-interest (ROI)-based surrogate measure for prolonged ATT.27,28 A study of subjects with hypertension showed that spatial CoV, which is calculated from the standard deviation in an ROI divided by the ROI mean in single-PLD pCASL images, is strongly correlated with ATT measured by flow encoding arterial spin tagging (FEAST). 27 Another study of healthy adults and patients with cerebrovascular disease reported that spatial CoV from single-PLD pCASL images is inversely correlated with extracranial arterial blood velocity measured by phase-contrast MR imaging. 28 These findings indicate that the spatial CoV contains ATT-related information and that by using only single-PLD pCASL images, we may detect prolonged ATT in clinical settings. However, the utility of spatial CoV for assessment of the hemodynamic status of cerebral circulation has not been systematically investigated in patients with cerebrovascular steno-occlusive disease.
The aim of this study was to demonstrate the applicability of the spatial CoV from single-PLD pCASL images as an ATT-like measure for assessment of hemodynamic status in patients with cerebrovascular steno-occlusive disease. Specifically, we compared the spatial CoV of single-PLD pCASL images with (1) ATT independently measured by additional multi-timing PASL scanning and (2) quantitative hemodynamic measurement by 15O PET, the gold standard: resting CBF, cerebral blood volume (CBV), vascular mean transit time (MTT), oxygen extraction fraction (OEF), and vascular reactivity (VR).3,29 Our hypothesis was that in patients with cerebrovascular steno-occlusive disease, the spatial CoV contains ATT-like information and thus has significant relationships with the PET-based hemodynamic measures.
Material and methods
Subjects
Patients with atherosclerotic steno-occlusive disease who underwent both ASL perfusion MR and 15O PET during their routine examinations from May 2016 to May 2017 were included. Written informed consent was obtained from each patient for enrollment in the study. In this retrospective analysis, we selected patients who met the following inclusion criteria: (1) preoperative examination of indications for revascularization surgery, (2) occlusion or severe stenosis (>70% diameter reduction) of the unilateral internal carotid artery (ICA) or middle cerebral artery (MCA) as documented by MR angiography and (3) not more than one day between MR and PET examinations. One patient who showed almost no ASL signal in one hemisphere in both pCASL and PASL, perhaps because of labeling problems, was removed. Finally, PET and ASL datasets acquired from 17 patients were analyzed. Each patient’s diagnosis is summarized in the Supplemental Table. This study was approved by the Ethics Committee of the Research Institute for Brain and Blood Vessels-Akita (reference number: 15–20) and was performed in accordance with the Declaration of Helsinki.
PET
A SET-3000GCT/M (Eminence SOPHIA; Shimadzu Corp., Kyoto, Japan) whole-body 3D-dedicated PET/CT scanner was used. The details of 15O PET have been described elsewhere.30–32 The 15O PET study included three emission scans performed sequentially with short inhalation of [15O]-CO, short inhalation of [15O]-O2, and injection of [15O]-H2O. CBF, CBV, OEF, and cerebral metabolic rate of the oxygen maps were calculated. MTT values were calculated by dividing CBV by CBF (MTT = CBV/CBF). In addition to resting CBF, CBF under hypercapnia (induced by inhalation of 7% CO2 gas starting 1 min before scanning and continuing until the end of scanning) was also measured for evaluation of VR, calculated as 100% × (CBF under hypercapnia − resting CBF)/resting CBF. 33
ASL
Acquisition was performed on a 3T scanner (MAGNETOM Verio Dot, Siemens) using a 32-channel head receiver array. Each study included two ASL scans using prototype sequences with three-dimensional gradient and spin echo (3D GRASE) readout and BS.34,35 Vascular crushing gradients were not applied. The labeling plane in pCASL and the distal end of the labeling slab in PASL were positioned 20 mm below the imaging volume.
Single-PLD pCASL acquisition: labeling duration (LD) = 1800 ms; PLD = 2000 ms; repetition time (TR)/echo time (TE) = 4600/14.8 ms; EPI factor = 21; number of repetitions (N) = 6 (control−label pairs); scanning time = 4 min 6 s. Multi-timing PASL acquisition: TI1 = 700 ms (FAIR Q2TIPS); TI2 = 470−3770 ms (16 time-points); TR/TE = 4600/21.8 ms; EPI factor = 31; N = 1; scanning time = 5 min 11 s.
Other parameters of 3D GRASE were identical between pCASL and PASL: GRAPPA acceleration factor = 2; turbo factor = 12; field of view = 256 × 256 × 144 mm; voxel size = 4.0 × 4.0 × 6.0 mm3; 24 slices.
For the pCASL data, CBF images were calculated from the mean of the control − label difference images based on the standard equation, 6 assuming label efficiency = 0.85 and efficiency of BS pulses = 0.73. This value of BS pulse efficiency was based on ASL measurements with and without BS pulses for 15 healthy volunteers at our institute (data not shown), but these global scaling factors did not affect the calculation of spatial CoV. 27
For the PASL data, non-linear least squares fitting with the standard kinetic model was applied to calculate the ATT maps. 25 ATT is defined as the time required for the labeled water to arrive at each voxel from the distal end of the labeling slab. PASL CBF images were simultaneously created but not used in the current analysis.
Region-of-interest analysis
First, the ASL images (pCASL CBF and PASL ATT) were rigid-body registered to each subject’s PET CBF image using the SPM8 software package (http://www.fil.ion.ucl.ac.uk/spm, Wellcome Trust Centre for Neuroimaging, UCL, London, UK). In the next step, each subject’s PET CBF image was spatially normalized to the anatomic brain template, and the obtained transformation matrix was applied to the other PET and ASL images. Thus, all subjects’ resultant images had the same anatomic format (isotropic voxel size: 2 mm).
The 3D stereotactic ROI template was used to define large cortical ROIs in bilateral MCA territory.36,37 The MCA ROI was created by combining 5 cortical segments (precentral, central, parietal, angular, and temporal) from the basal ganglia level to the centrum semiovale level, covering 19 axial slices (total 38 mm). ROIs in the ipsilateral and contralateral hemispheres were defined with respect to steno-occlusive lesions (see Figure 1). Contralateral and ipsilateral ROI values were calculated for each patient image.
PET and ASL maps acquired from a patient with occlusion of the right middle cerebral artery and histograms of pCASL CBF values in the ipsilateral and contralateral regions of interest (ROIs) (Patient No. 3). ROIs used in the analysis are overlaid on the maps. An individual, scalp-stripped T1-weighted image is also shown (used only for visualization).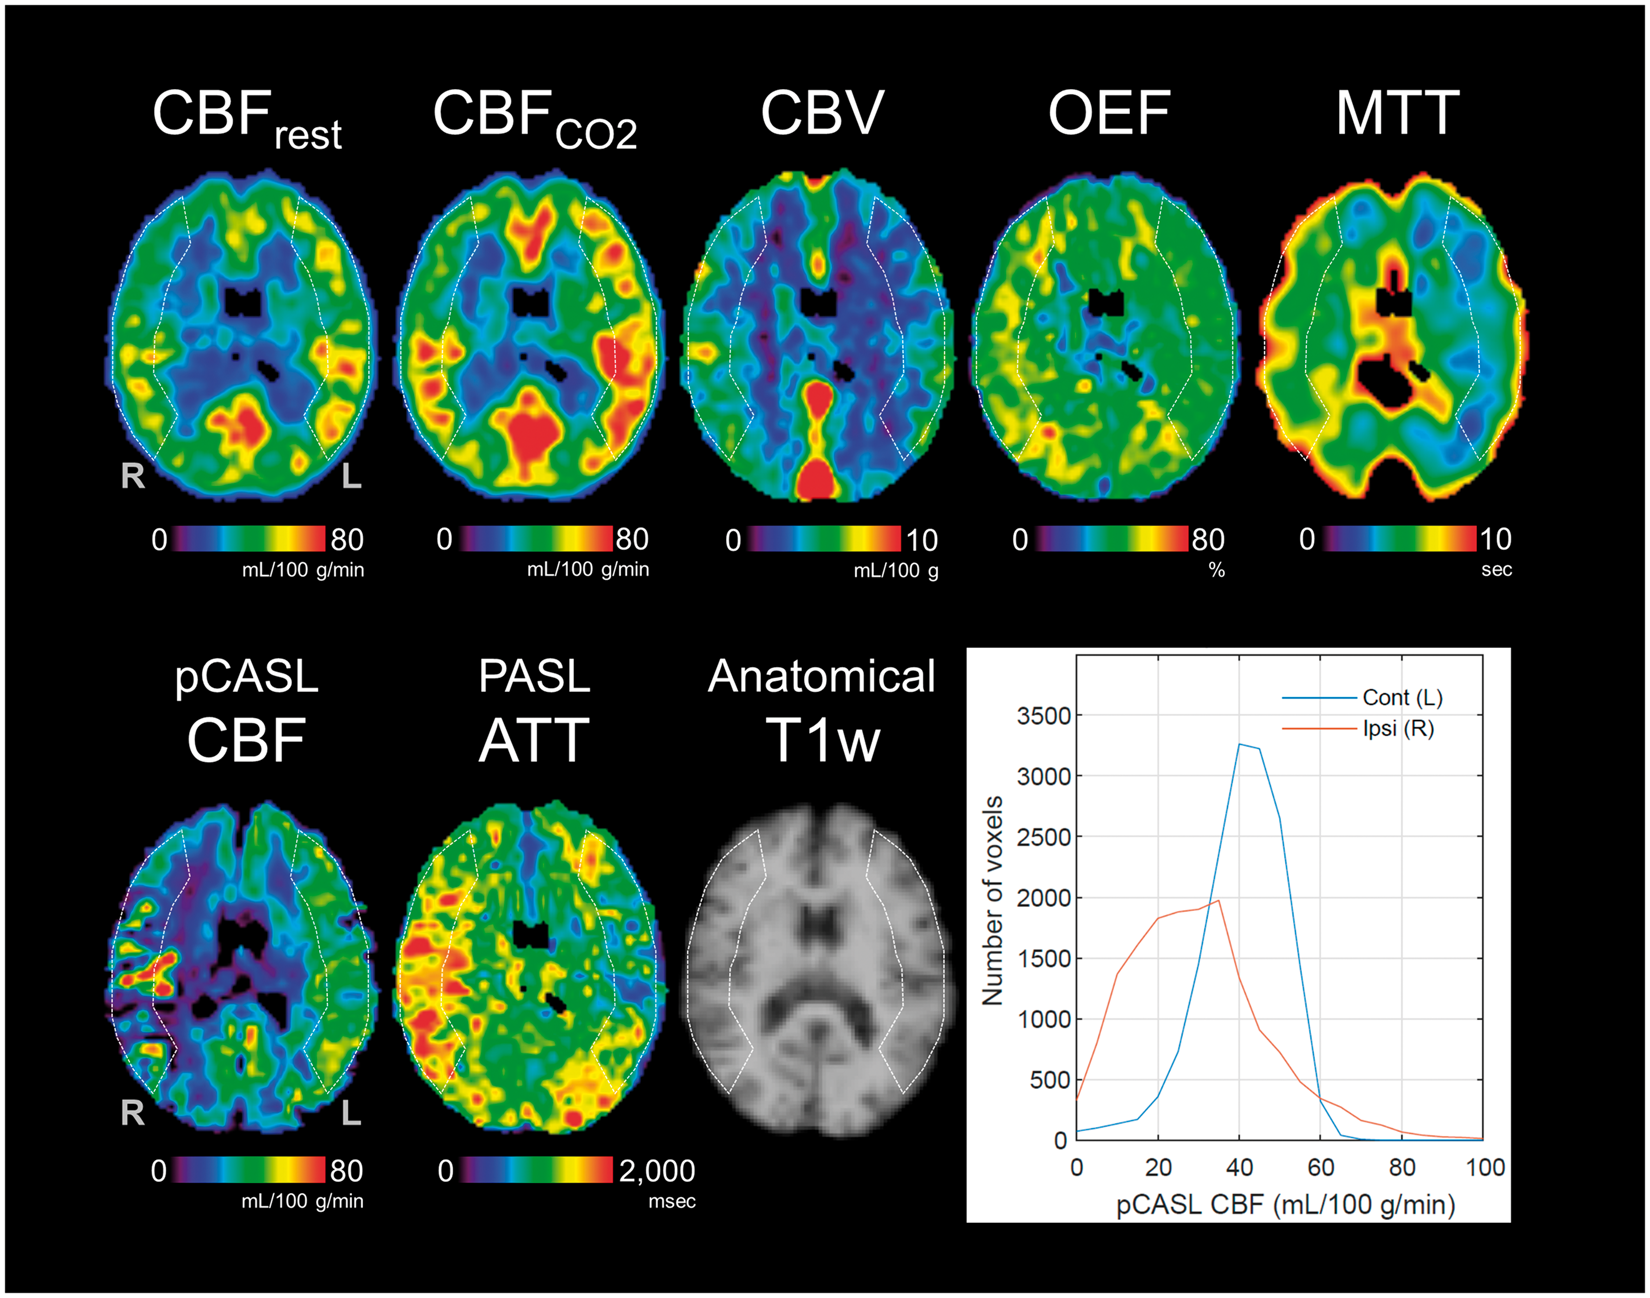
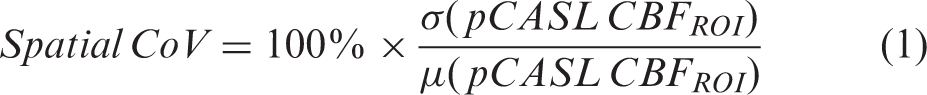
Spatial CoV in the pCASL CBF images was calculated as the standard deviation (SD) of CBF divided by the mean CBF within the MCA ROI
27
For all measures, the differences between contralateral and ipsilateral ROI values were examined by paired t-tests. Correlation analyses were performed between (1) PASL ATT and pCASL spatial CoV and (2) PET-based measures (CBF, CBV, MTT, VR, OEF) and ASL-based measures (PASL ATT and pCASL spatial CoV), with statistically significant correlations subjected to regression analysis. Statistical significance was defined as p < 0.05. R version 3.4.0 (a free software environment for statistical computing and graphics, available from http://www.R-project.org) was used.
Results
Summary of results.
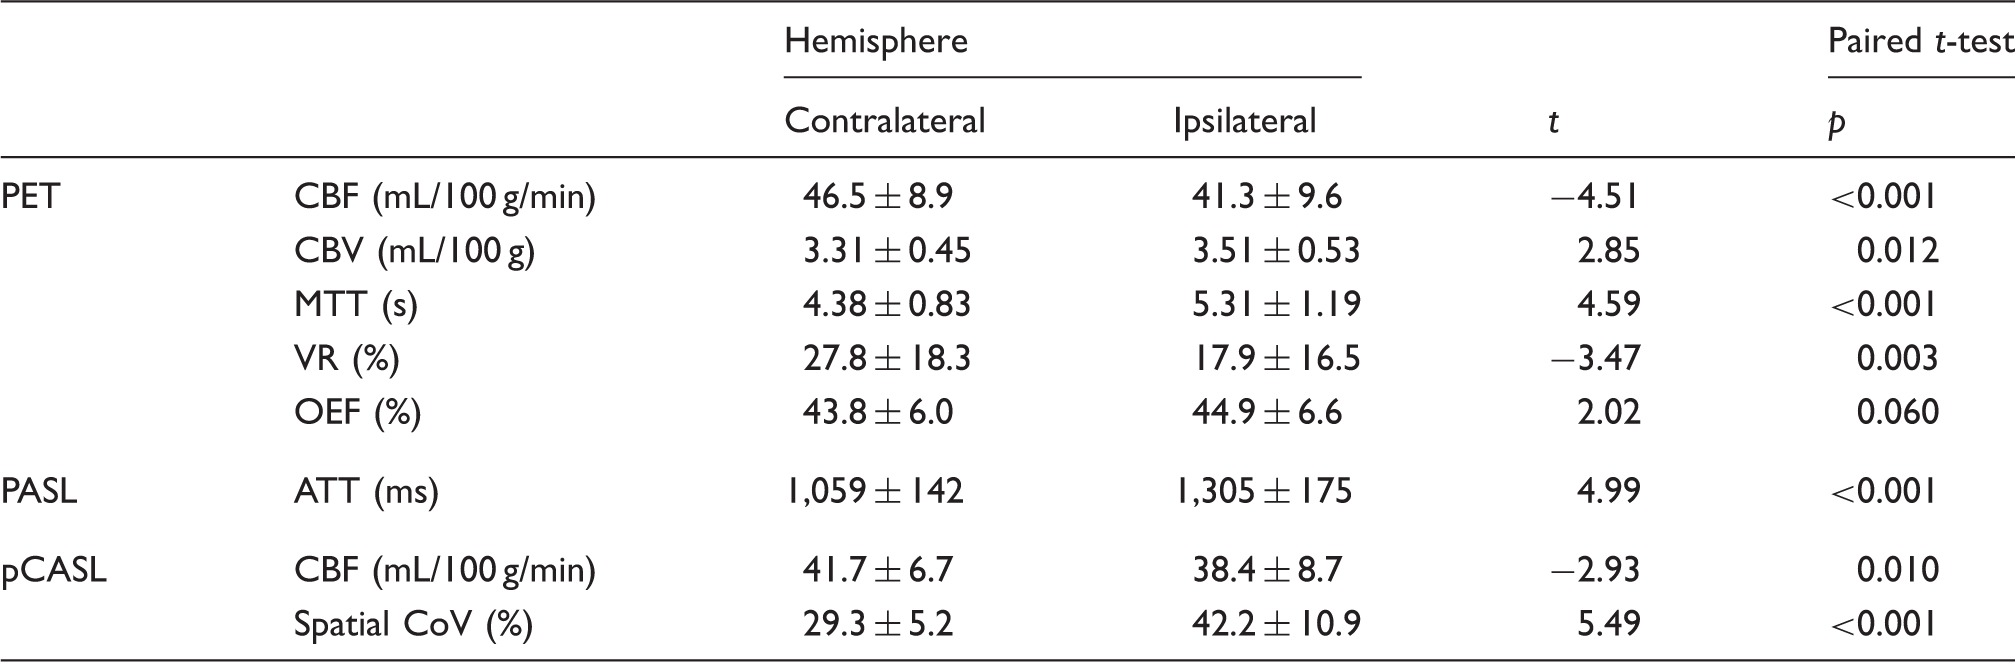
ATT: arterial transit time; CBF: cerebral blood flow; CBV: cerebral blood volume; CoV: coefficient of variation; MTT: mean transit time; OEF: oxygen extraction fraction; PASL: pulsed arterial spin labeling; pCASL: pseudo-continuous arterial spin labeling; PET: positron emission tomography; VR: vascular reactivity. Values are means and standard deviations.
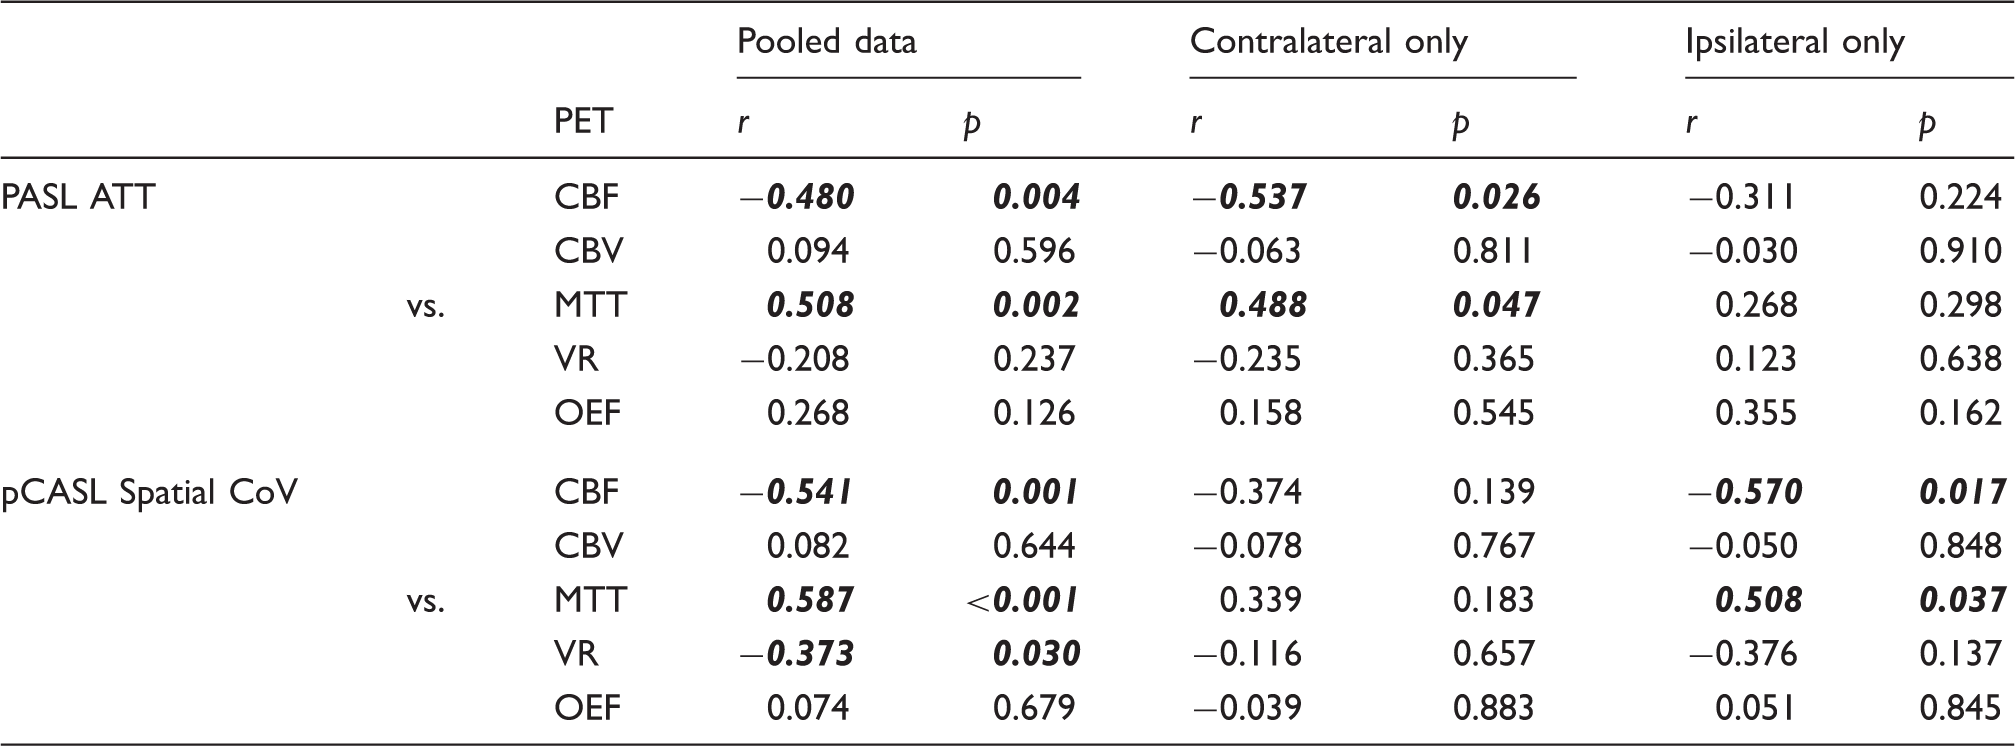
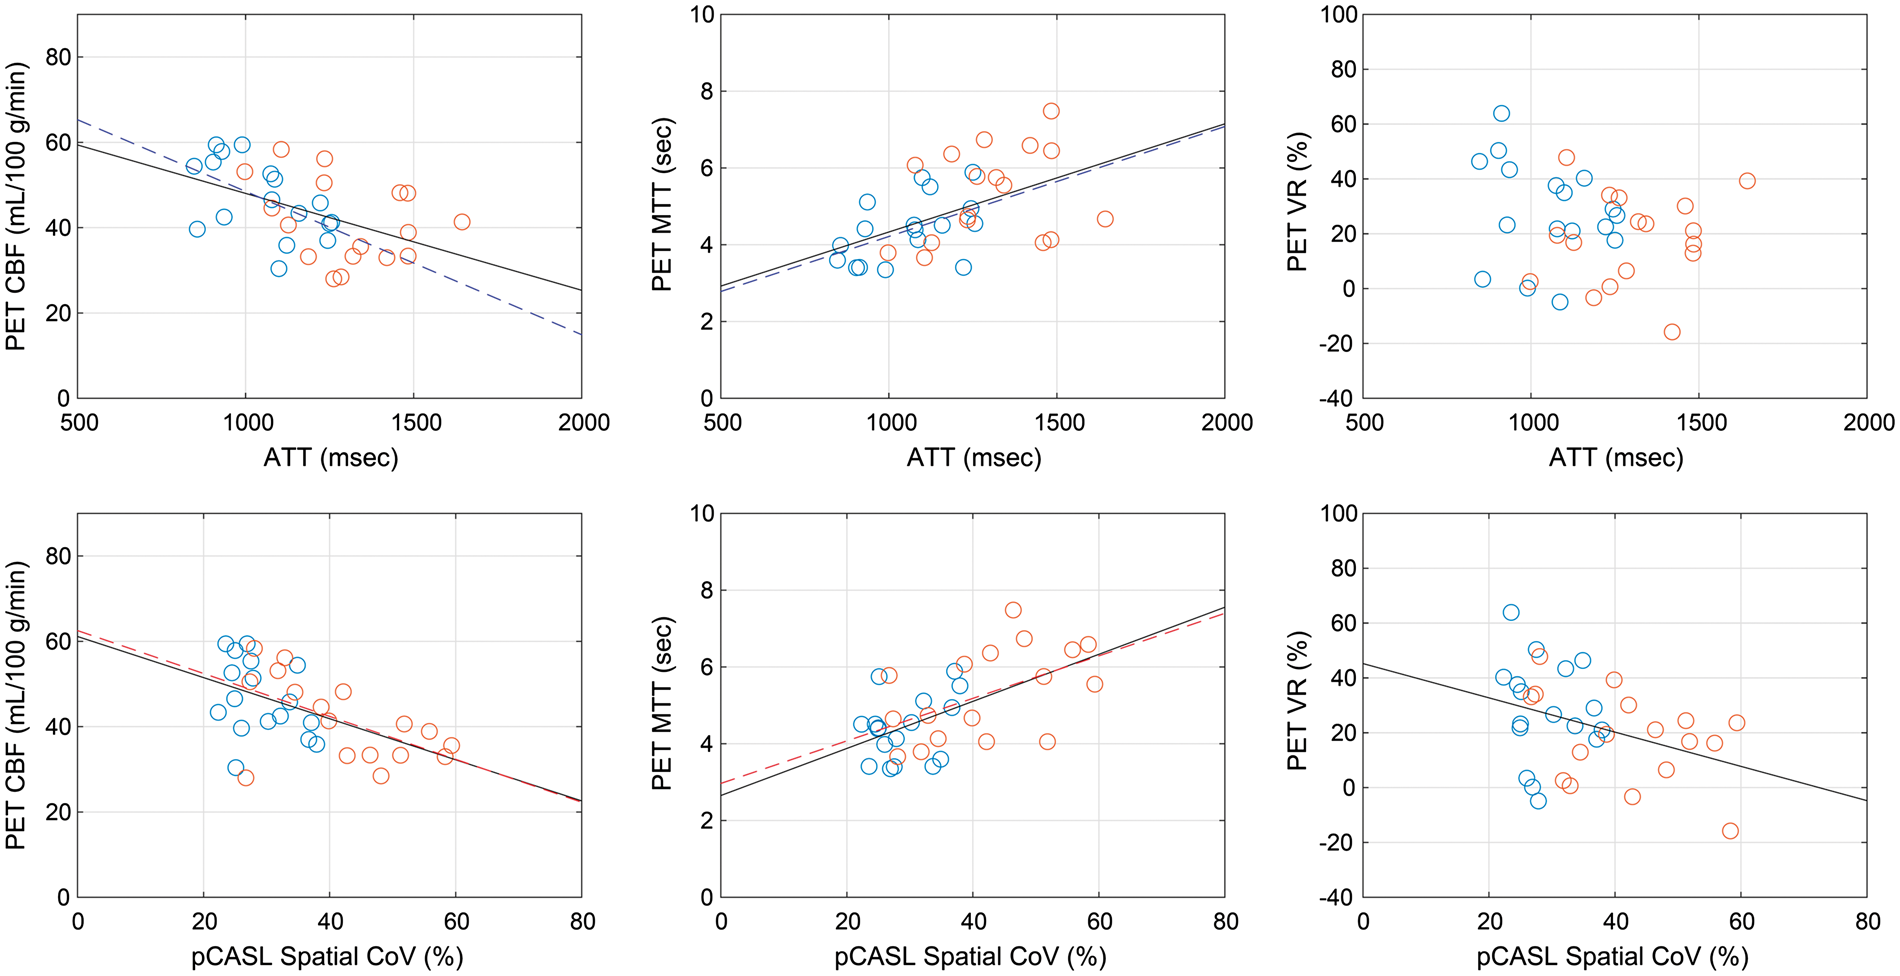
Figure 2 shows the inter-subject relationship between the spatial CoVs from pCASL images and ATT measured by multi-timing PASL, presenting a statistically significant correlation (r = 0.597, p < 0.001). When the data were analyzed separately for ipsilateral and contralateral ROIs, no statistically significant correlation was found between spatial CoV and ATT (r = 0.358, p = 0.158 for contralateral; r = 0.358, p = 0.159 for ipsilateral). The results of correlation analysis with the PET-based measures are summarized in Table 2. Among the PET-based measures, CBF and MTT showed significant correlations with both spatial CoV and ATT. When the data were analyzed separately for ipsilateral and contralateral ROIs, ATT was significantly correlated with PET CBF and MTT only for the contralateral ROI, in contrast to spatial CoV, which was significantly correlated only for the ipsilateral ROI. The correlation coefficients with PET VR were statistically significant only for spatial CoV when the pooled data were used. Scatter plots between ASL and PET-based measures, CBF, MTT, and VR, are shown in Figure 3. The remaining PET-based measures, CBV and OEF, showed no significant correlations with either ATT or spatial CoV (Table 2).
Correlation between arterial transit time (ATT) measured by PASL and spatial coefficient of variation (CoV) in pCASL CBF images. Blue and red circles represent data from contralateral and ipsilateral ROIs, respectively. The black line is the result of regression analysis using the pooled data. Correlation coefficients between ASL and PET-based measures. Note: Numbers in bold italic represent significant correlations (p < 0.05). ATT: arterial transit time; CBF: cerebral blood flow; CBV: cerebral blood volume; CoV: coefficient of variation; MTT: mean transit time; OEF: oxygen extraction fraction; PASL: pulsed arterial spin labeling; pCASL: pseudo-continuous arterial spin labeling; PET: positron emission tomography; VR: vascular reactivity. Scatter plot of arterial transit time (ATT) measured by PASL [upper] and spatial coefficient of variation (CoV) in pCASL CBF images [lower] versus PET-based measures: CBF [left], mean transit time (MTT) [middle], and vascular reactivity (VR) [right]. Blue and red circles represent data from contralateral and ipsilateral ROIs, respectively. When correlations are statistically significant (p < 0.05), regression lines are also presented in blue (contralateral ROI only), red (ipsilateral ROI only), or black (pooled data).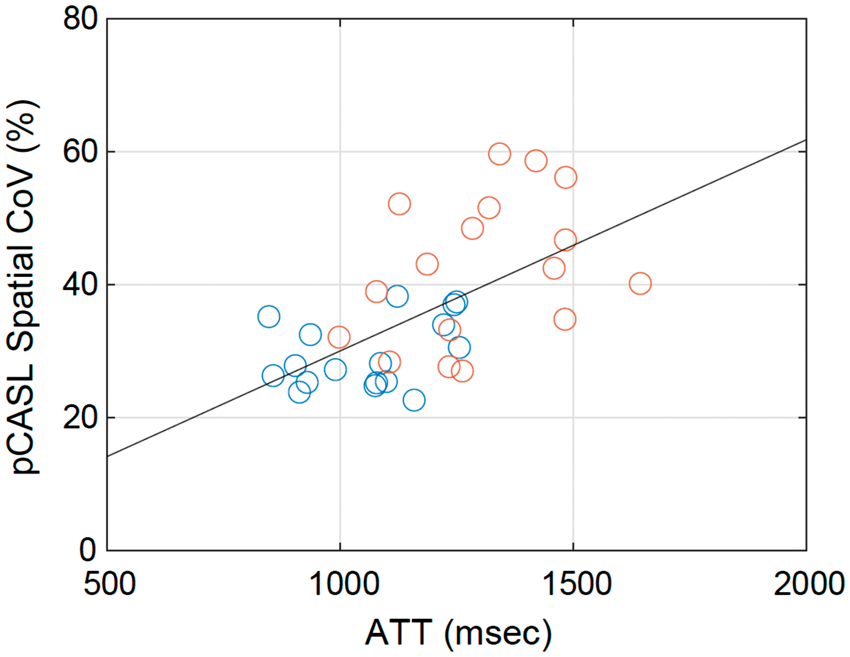
Discussion
Spatial CoV of pCASL CBF images
The present method provides spatial CoV as alternative ATT-like information based on single-PLD pCASL acquisition only. We have demonstrated that in patients with cerebrovascular steno-occlusive disease, spatial CoV is positively correlated with ATT, which is the expected direction, even though the correlation coefficient remains only moderately strong. Spatial CoV in lesioned hemispheres represents the appearance of abnormally high intravascular signals, ATA. In contrast, by definition, spatial CoV in normal hemispheres depends mainly on local CBF variations, which are strongly governed by CBF differences between gray and white matter when using large ROIs, as in this study. In other words, spatial CoV has a different meaning for lesioned and normal hemispheres and should not be regarded as an actual physiological variable. In the consensus paper, single-PLD pCASL without vascular crushing gradients is recommended for clinical CBF scanning in terms of acquisition time and image SNR. 6 However, with the recommended settings, ATA hampers CBF quantification in some patients, as exemplified in Figure 1. The present method, which provides spatial CoV as a ROI-based hemodynamic measure, will gain importance in clinical perfusion studies.
Spatial CoV as a hemodynamic measure was first introduced and compared with ATT by Mutsaerts et al. 27 They used FEAST ASL acquisition, with which ATT was estimated indirectly from two pCASL images with and without flow-crushing gradients (CBFcrushed and CBFnon-crushed), and found a strong correlation between the spatial CoV of CBFnon-crushed images and FEAST-estimated ATT in older adults with hypertension. 27 A problem with ATT measurements by FEAST is that ATT estimates depend on pre-defined velocity cutoff values and PLD setting and should be considered as relative ATT.38,39 A strength of the present study is that ATT was directly determined from multi-timing ASL acquisition, the standard method for estimating ATT, and we explicitly confirmed the significant relationship between ATT and spatial CoV in patients with cerebrovascular steno-occlusive disease.
Comparisons with PET
In the present study, the spatial CoV of pCASL CBF images and ATT measured by multi-timing PASL were compared with the gold standard, 15O PET. Spatial CoV and ATT showed correlations in the expected directions: they were positively correlated with PET MTT and negatively correlated with PET CBF. These results signify that slow flow due to reduction of cerebral perfusion pressure results in incomplete arrival of labeled blood and prolonged MTT and reduced CBF as measured by PET, which causes the appearance of ATA and increases the spatial CoV of pCASL CBF images. The correlations of both spatial CoV and ATT were stronger with PET MTT than with PET CBF. The stronger correlation with PET MTT is not surprising, considering that MTT is a timing measure that directly relates to vascular flow velocity, indicating the validity of spatial CoV. However, the correlation coefficient with MTT has only moderate strength; therefore, spatial CoV should not be used to estimate MTT in individual patients but rather as an alternative hemodynamic variable of flow velocity or transit time. In addition to PET CBF and MTT, VR measured by CBF response to hypercapnia was correlated negatively with spatial CoV but not significantly with ATT. For patients with cerebrovascular steno-occlusive disease, VR can decline even with mild reduction of cerebral perfusion pressure, under which CBF is maintained within a normal range.40,41 The present results imply that spatial CoV is more sensitive to perfusion abnormality than ATT and is useful for detection of more subtle decreases in cerebral perfusion pressure. The superiority of spatial CoV as a hemodynamic measure is also supported by the analyses using data from the ipsilateral and contralateral hemispheres separately. In the ipsilateral hemisphere, the correlations with PET-based measures were significant only for spatial CoV, suggesting that spatial CoV represents the severity of hemodynamic compromise more appropriately than does ATT.
Limitations
Spatial CoV calculated from pCASL CBF images is inevitably dependent on various scanning parameters. First, pCASL acquisition with different PLD settings provides different spatial CoV results. When a shorter PLD is applied in pCASL acquisition, ATA appears in some regions even in normal hemispheres, resulting in decreased contrast of spatial CoV values between the hemispheres. However, longer PLD alleviates the appearance of ATA in the lesioned hemisphere, similarly resulting in decreased contrast of spatial CoV values between the hemispheres. Considering the role of spatial CoV as a hemodynamic measure for detection of perfusion abnormalities, a PLD of 2000 ms (as used in the present study) may be the optimal setting, although we currently have no data to verify this. Second, we acquired pCASL images without the vascular crushing gradients recommended in the consensus paper. 6 The application of vascular crushing diminishes intravascular high signals to varying degrees, depending on a velocity cutoff value, consequently precluding the use of spatial CoV as a hemodynamic measure. Third, the type of readout sequence in pCASL acquisition is a potential determinant of spatial CoV. In the consensus paper, 3D segmented readouts such as 3D multiecho (RARE) stack of spirals or 3D GRASE (used in the present study) are recommended. These sequences have been reported to show different image characteristics in terms of in-plane blurring and distortion.6,9 This difference possibly influences the spatial characteristics of pCASL images and thus spatial CoV.
Another limitation of the current approach is that the calculation of spatial CoV is completely ROI-based, not voxel-based. In other words, spatial CoV is calculated only for relatively large ROIs and its calculation naturally depends on the ROI setting. Although the present study applied large cortical MCA ROIs covering many axial slices, more selective ROI settings that confine the slices to highly lesioned brain areas may be preferred, and further investigation is needed to optimize the ROI setting. Care should be taken when applying smaller ROIs because abnormally high intravascular signals are more likely to drop. In such a situation, spatial CoV is not a proper hemodynamic measure for the detection of perfusion abnormalities. This method is also applicable to brain areas other than cortical regions, such as deep MCA territory and watershed areas, which are vulnerable to hemodynamic impairment; however, the utility of spatial CoV should be further evaluated because compared with the cortical regions, such areas lack the large vasculature that originates ATA. Possible candidates for assessment of ATA on a smaller regional level include automated image processing approaches, such as texture analysis, 42 which warrant further research.
Conclusion
ATT-like information can be extracted by calculating the spatial CoV from pCASL CBF images with single-PLD acquisition. The present study demonstrated the correlations between the spatial CoV determined by pCASL and PET-based measures for a patient group with cerebrovascular steno-occlusive disease. This method, although it is currently an ROI-based assessment, is feasible in clinical settings without the need for time-consuming, multi-timing ASL scans and can potentially detect subtle perfusion abnormalities.
Supplemental Material
Supplemental material for Spatial coefficient of variation in pseudo-continuous arterial spin labeling cerebral blood flow images as a hemodynamic measure for cerebrovascular steno-occlusive disease: A comparative 15O positron emission tomography study
Supplemental material for Spatial coefficient of variation in pseudo-continuous arterial spin labeling cerebral blood flow images as a hemodynamic measure for cerebrovascular steno-occlusive disease: A comparative 15O positron emission tomography study by Masanobu Ibaraki, Kazuhiro Nakamura, Hideto Toyoshima, Kazuhiro Takahashi, Keisuke Matsubara, Atsushi Umetsu, Josef Pfeuffer, Hideto Kuribayashi and Toshibumi Kinoshita in Journal of Cerebral Blood Flow & Metabolism
Footnotes
Funding
The author(s) disclosed receipt of the following financial support for the research, authorship, and/or publication of this article: This work was supported by JSPS KAKENHI Grant Number 2315K09942.
Acknowledgements
We thank the staff of the Akita Research Institute of Brain and Blood Vessels for data acquisition. We thank Richard Lipkin, PhD from Edanz Group for editing a draft of this manuscript.
Declaration of conflicting interests
The author(s) declared the following potential conflicts of interest with respect to the research, authorship, and/or publication of this article: JP and HK are employed by Siemens Healthcare. The other authors declare no conflicts of interest.
Authors’ contributions
Concept and design: MI, KN, TK; acquisition of data: MI, KN, HT, KT, JP, HK, TK; data analysis: MI; data interpretation: MI, KN, KM, AU, TK; drafting the manuscript: MI; revising the manuscript: all authors; approval of the final version: all authors.
References
Supplementary Material
Please find the following supplemental material available below.
For Open Access articles published under a Creative Commons License, all supplemental material carries the same license as the article it is associated with.
For non-Open Access articles published, all supplemental material carries a non-exclusive license, and permission requests for re-use of supplemental material or any part of supplemental material shall be sent directly to the copyright owner as specified in the copyright notice associated with the article.