
Abstract
Intracerebral hemorrhage (ICH) is associated with high mortality and disability, and there is no widely approved clinical therapy. Poor outcome after ICH results mostly from a mass effect owing to enlargement of the hematoma and brain swelling, leading to displacement and disruption of brain structures. Cerebral mast cells (MC) are resident inflammatory cells that are located perivascularly and contain potent vasoactive, proteolytic, and fibrinolytic substances. We previously found pharmacological MC stabilization and genetic MC deficiency to be associated with up to 50% reduction of postischemic brain swelling in rats. Here, we studied the role of MC and MC stabilization in ICH using in vivo magnetic resonance imaging and ex vivo digital imaging for calculating brain edema and hematoma volume. In a rat ICH model of autologous blood injection into the basal ganglia, four groups of Wistar rats received either saline or sodium cromoglycate (MC stabilizer, two groups) or compound 48/80 (MC degranulator). Evaluated 24 h later, MC stabilization had resulted in highly significantly better neurologic scores (P < 0.001), decrease mortality (P = 0.002), less brain swelling (P < 0.001), and smaller hematoma volume growth (P < 0.001) compared with saline and compound 48/80. Moreover, to support our hypothesis, we induced ICH in MC-deficient rats and their wild-type littermates (WT). MC-deficient rats responded with significantly better neurologic scores (P < 0.001), decrease mortality (0% versus 25%), less brain swelling (P < 0.05), and smaller hematoma growth (P < 0.05) than WT. The role of MC deserves a close evaluation as a potential target in the development of novel forms of ICH therapy.
Introduction
Intracerebral hemorrhage (ICH) accounts for 15% of all strokes in the Western countries and for 20% to 30% in Asian and black populations (Qureshi et al, 2001). Intracerebral hemorrhage is associated with high mortality and disability, with only 38% of the patients surviving through the first year (Dennis et al, 1993), many of them with chronic disability. Poor outcome results from direct tissue damage, especially in deep brain structures such as basal ganglia, and a mass effect of the growing hematoma surrounded by a perihematomal ischemic zone. These factors contribute to expansive brain edema and lead to displacement and disruption of brain structures and often to increased intracranial pressure. Currently, no widely approved effective acute medical treatment exists, and surgical evaluation of ICH was recently found not to be beneficial (Mendelow et al, 2005).
In addition to the mass effect, the hematoma itself induces a number of early secondary changes in the surrounding tissue: (1) neuronal and glial cell death owing to apoptosis (Felberg et al, 2002) and inflammation and (2) vasogenic edema caused by disruption of the blood—brain barrier (Power et al, 2003; Qureshi et al, 2003). Early edema formation is believed to be related to exudation of serum proteins into the periphery of the hematoma (Gebel et al, 2000; Xi et al, 2001). Perihematomal edema may lead to secondary failure of microcirculation (edema-mediated secondary ischemic injury owing to the mass effect and compression of the blood vessels surrounding the hematoma) and enlargement of the ischemic damage caused by ICH (Mendelow, 1993; Nath et al, 1987), although it is still controversial as to whether such a perihematomal penumbra exists (Zazulia et al, 2001).
Mast cells (MC) are stationary inflammatory cells, which typically reside at perivascular locations in the central nervous system of different species, including humans (Hough, 1988). They appear to be concentrated in the diencephalic parenchyma, the thalamus, the cerebral cortex, and the meninges (Florenzano and Bentivoglio, 2000; Silver et al, 1996; Theoharides, 1995). Mast cells contain metachromatic granules with potent preformed vasoactive (histamine, bradykinin), anticoagulant (heparin), proteolytic (tryptase and chymase), and chemotactic (prostaglandins, platelet-activating factor and leukotrienes) factors. On degranulation, these constituents trigger an immediate phlogistic (vasodilation, permeability increase) response, which we found to be relevant for acute blood—brain barrier permeability changes also in the brain (Strbian et al, 2006). In our previous work, MC stabilization with cromoglycate and genetic MC deficiency led to up to 50% reduction of brain swelling in ischemic stroke in rats. As edema is an obvious therapeutic target in ICH (Carhuapoma et al, 2002), we hypothesized that MC blocking may also exert a therapeutic effect in experimental ICH. This led us to examine the potential role of MC and the effect of MC blocking on the volume of experimental cerebral hematoma and the amount of edema associated with acute ICH in magnetic resonance imaging (MRI) experiments. Both MC stabilization and MC deficiency induced by genetic manipulation led to significantly better outcomes compared with controls.
Materials and methods
Animals
We used adult male Wistar rats (Harlan Nederland, Horst, The Netherlands), MC-deficient WsRcWs/Ws rats (Niwa et al, 1991), and their wild-type (WT) control WsRc+/+ rats (Japan SLC, Inc., Tokyo, Japan) weighing 290 to 340 g. Mast cell-deficient WsWs rats carry a defective gene for the c-kit (ligand for stem cell factor required for MC differentiation). The animals were anesthetized by an intraperitoneal injection of ketamin hydrochloride (50 mg/kg, Ketalar, Parke-Davis, Sweden) and a subcutaneous injection of medetomidine hydrochloride (0.5 mg/kg, Domitor, Orion, Finland). A PE-50 polyethylene tube was inserted into the left femoral artery for continuous monitoring of blood pressure (Olli Blood Pressure Meter 533, Kone Oy, Espoo, Finland) and for measurement of arterial pH, blood gases, and blood glucose (AVL OPTI, Roche Oy, Helsinki, Finland) at baseline, after ICH induction, and after MRI. Another tube was inserted into the left femoral vein for drug infusions. Rectal temperature was maintained at 37°C during the operation with a heating blanket and a thermo-regulated heating lamp. Before and during the experiments, the rats were housed under diurnal lighting conditions and allowed free access to food and water. The relevant Animal Research Committee had approved the study protocol.
Intracerebral Hemorrhage Model
To mimic ICH, we used the autologous whole blood injection model described elsewhere (Lee et al, 1996). The head of the animal was fixed into a stereotaxic frame (Stoelting Co., IL, USA) and a midline scalp incision was made to disclose the calvarium of the skull. A burr hole was drilled for intraventricular drug administration on the left side of the skull: 0.9 mm posterior and 1.6 mm lateral to the bregma. A 27-gauge needle attached to a Hamilton syringe was then inserted into the left lateral brain ventricle (at 3.4 mm depth from the skull surface), and drug or saline was slowly injected more than 3 mins. A second burr hole 1 mm in diameter was drilled on the right side of the cranium: 0.2 mm anterior and 3.0 mm lateral to the bregma. Another 27-gauge needle attached to a Hamilton syringe was inserted into the core of the right basal ganglia (at 6.0 mm depth from the skull surface), and 50 μL of freshly collected homologous arterial blood was injected into the brain slowly more than 5 mins, after which the needle was kept in place for 3 mins. The burr holes were sealed with bone wax, and the scalp was sutured.
Pharmacological Protocols and Animal Grouping
First, the animals were divided into four groups. Two groups received sodium cromoglycate (a clinically used specific inhibitor of MC degranulation) either intracerebroventricularly (i.c.v.) (n = 11, 750 μg dissolved in saline, final volume 10 μL) or intravenously (i.v.) (n = 10, 100 mg/kg, 0.2 mL). The third group received compound 48/80, a well-known MC degranulating agent (Dimitriadou et al, 1990), i.v. (n = 11, 0.5 mg/mL, 0.2 mL). The control group (n = 11) received 10 μL of saline into the left lateral ventricle. I.c.v. administration of cromoglycate was used to overcome its presumed minimal crossing of the blood—brain barrier (Shapiro and Koning, 1985). However, some authors (Esposito et al, 2001) have found cromoglycate to be effective even when administered i.v., which led us to administer cromoglycate via both routes. All treatments were administered 5 mins before the induction of ICH. All drugs were obtained from Sigma-Aldrich (Steinheim, Germany). In the second part of the study, we induced ICH in MC-deficient WsRcWs/Ws rats (n = 8) and their WT littermates (n = 8). All experiments were masked.
Magnetic Resonance Imaging Studies
Magnetic resonance imaging scanning was performed with a 4.7T scanner (PharmaScan, Bruker BioSpin, Germany) using a linear birdcage RF coil with an inner diameter of 38 mm. After shimming and scout images, coronal T2*-weighted images were acquired with a gradient echo sequence (TR = 277ms, TE = 8 ms, flip angle = 35°, matrix size = 256 × 256, field-of-view = 40 × 40 mm, number of averages = 4, slice thickness = 1 mm). Afterwards, coronal T2-weighted images were acquired using rapid acquisition with a relaxation enhancement (RARE) sequence (TR = 5257 ms, TEeff = 64 ms, echo train length = 16, matrix size = 256 × 256, field-of-view = 40 × 40 mm, number of averages = 2, slice thickness = 1 mm).
The rats underwent MRI immediately after ICH induction. The survivors were reanesthetized 24 h later, and MRI data were collected using the same sequences. Core body temperature during imaging was maintained at 37°C by using a MRI-compatible heating pad and pump (Gaymar Industries, Orchard Park, NY, USA).
Neurologic Evaluation
We scored neurologic performance at 24 h, before reanesthesia, on a 6-point scale (
Tissue Processing
After the second round of MRI, the animals were terminated with an overdose (60 mg) of sodium barbiturate (Pentobarbital, 1 mL, intraperitoneal) and underwent cardiac perfusion with 200 mL of ice-cold saline. Afterwards, the brains were harvested, cut through the site of the intracerebral blood injection into two blocks (to examine the hematoma at its largest epicenter), and photographed with a digital camera (Sony Mavica, Japan).
Magnetic Resonance Imaging Analysis of Hematoma, Brain Swelling, and Edema Volume
Hematoma volume measurements: Measurements of hematoma volume at 30 mins and 24 h were made based on their specific signal intensity on T2*-weighted images (Figure 1). The boundaries of the hematoma were tracked manually (Paravision, Bruker BioSpin, Ettlingen, Germany), the surface area on each slice was multiplied by the slice thickness, and the values were summed up to yield the total hematoma volume.
Brain swelling measurements: We used T2*-weighted images for the quantitative measurement of brain swelling, as the hematoma volume was also calculated from T2* images. We first outlined and calculated the area of both hemispheres on each slice (Paravision), and the areas were then multiplied by the slice thickness, yielding the total volume of the two hemispheres. Absolute brain swelling was then calculated as the volumetric difference between the right and left hemispheres. In another approach, we calculated the percentage of hemispheric expansion, which was derived from the volumetric increase of the ICH hemisphere compared with the intact one (% of hemispheric expansion = ((right hemisphere's volume/left hemisphere's volume)–1) × 100). The reliability of this approach was recently reported (Gerriets et al, 2004; Huang et al, 1999).
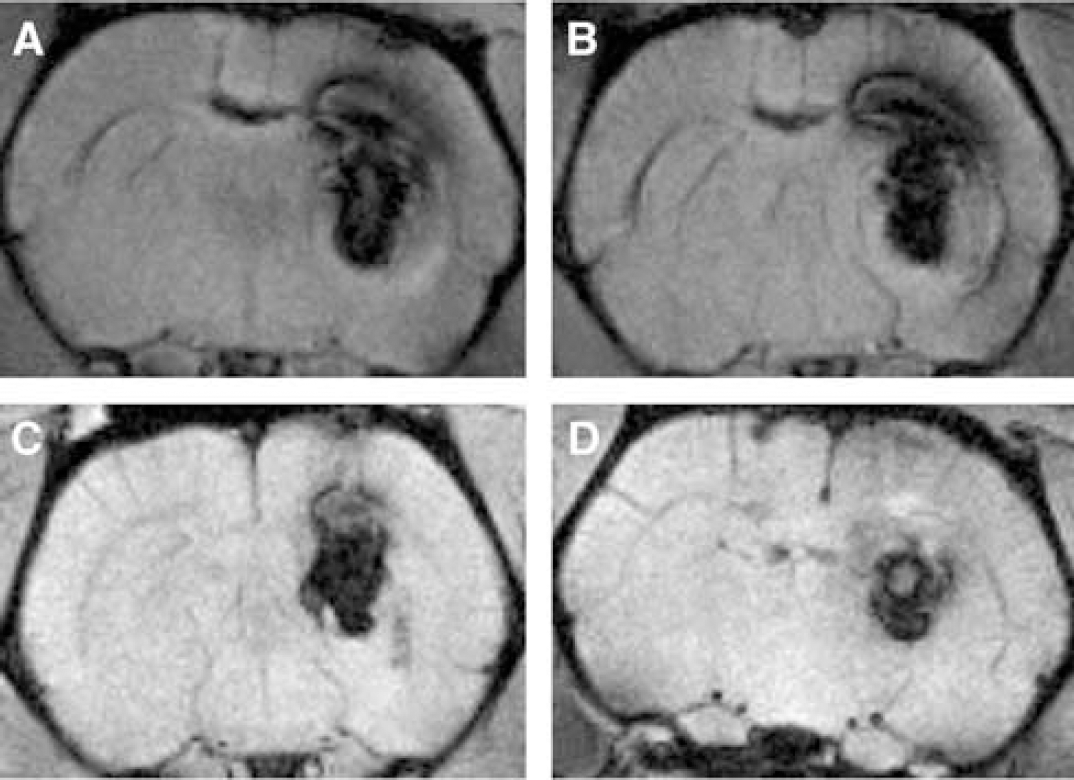
Representative T2*-weighted MR images of hematoma. (
Edema measurements: The hyperintense area (Figures 4 and 5) from each T2-weighted image slice was multiplied by slice thickness, and the values were summed up to yield the total volume of brain edema. Furthermore, we calculated the T2 ratio by dividing the mean T2 signal intensity of the hyperintense areas by a reference point outside the brain tissue, a method adopted from Del Bigio et al (1996). The T2 ratio is reported as an average of all hyperintense areas and an average of the perihematomal hyperintense rim. Data are reported for baseline (40 to 50 mins after ICH induction) and 24 h later, and the change in the ratio at 24 h has been calculated (Table 2).
Ex vivo-based hematoma area and brain swelling
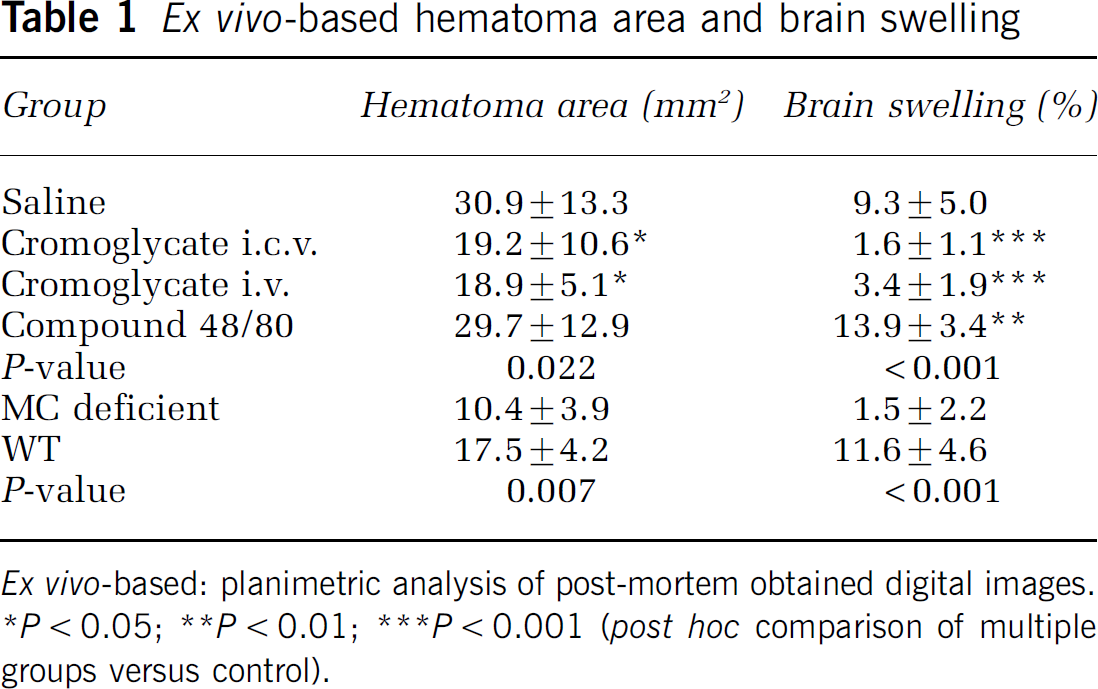
Ex vivo-based: planimetric analysis of post-mortem obtained digital images.
P < 0.05
P < 0.01
P < 0.001 (post hoc comparison of multiple groups versus control).
Edema volume quantified according to T2-weighted MRI
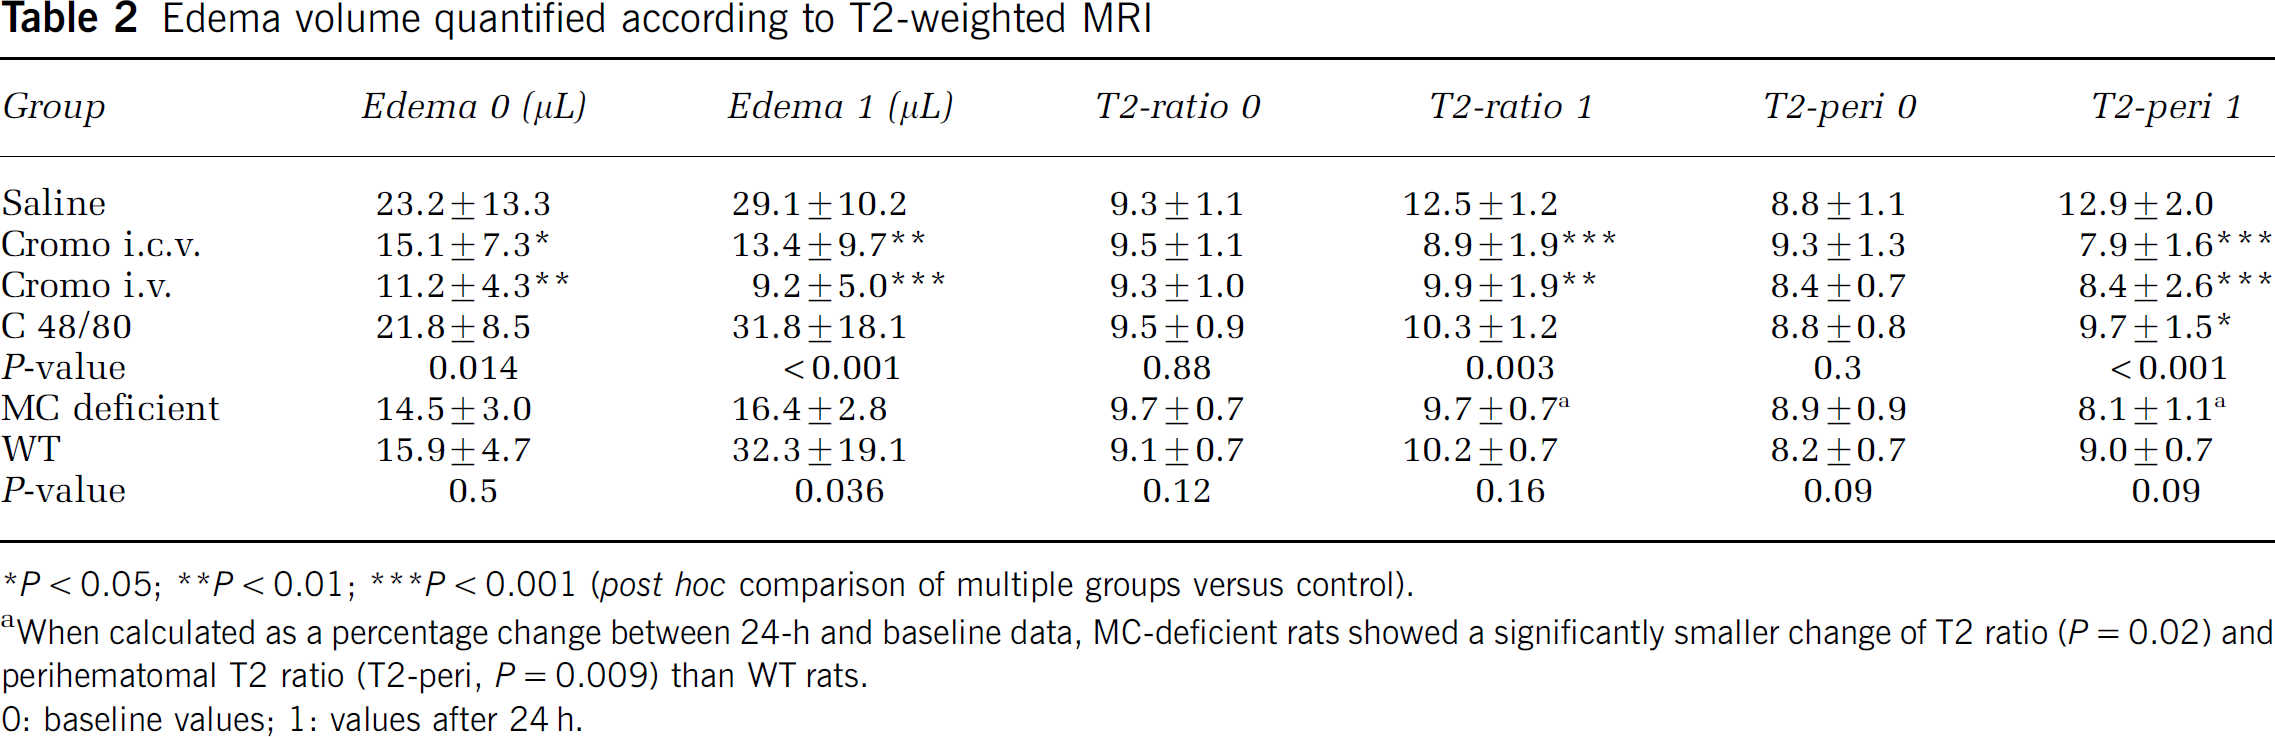
P < 0.05
P < 0.01
P < 0.001 (post hoc comparison of multiple groups versus control).
When calculated as a percentage change between 24-h and baseline data, MC-deficient rats showed a significantly smaller change of T2 ratio (P = 0.02) and perihematomal T2 ratio (T2-peri, P = 0.009) than WT rats.
0: baseline values; 1: values after 24 h.
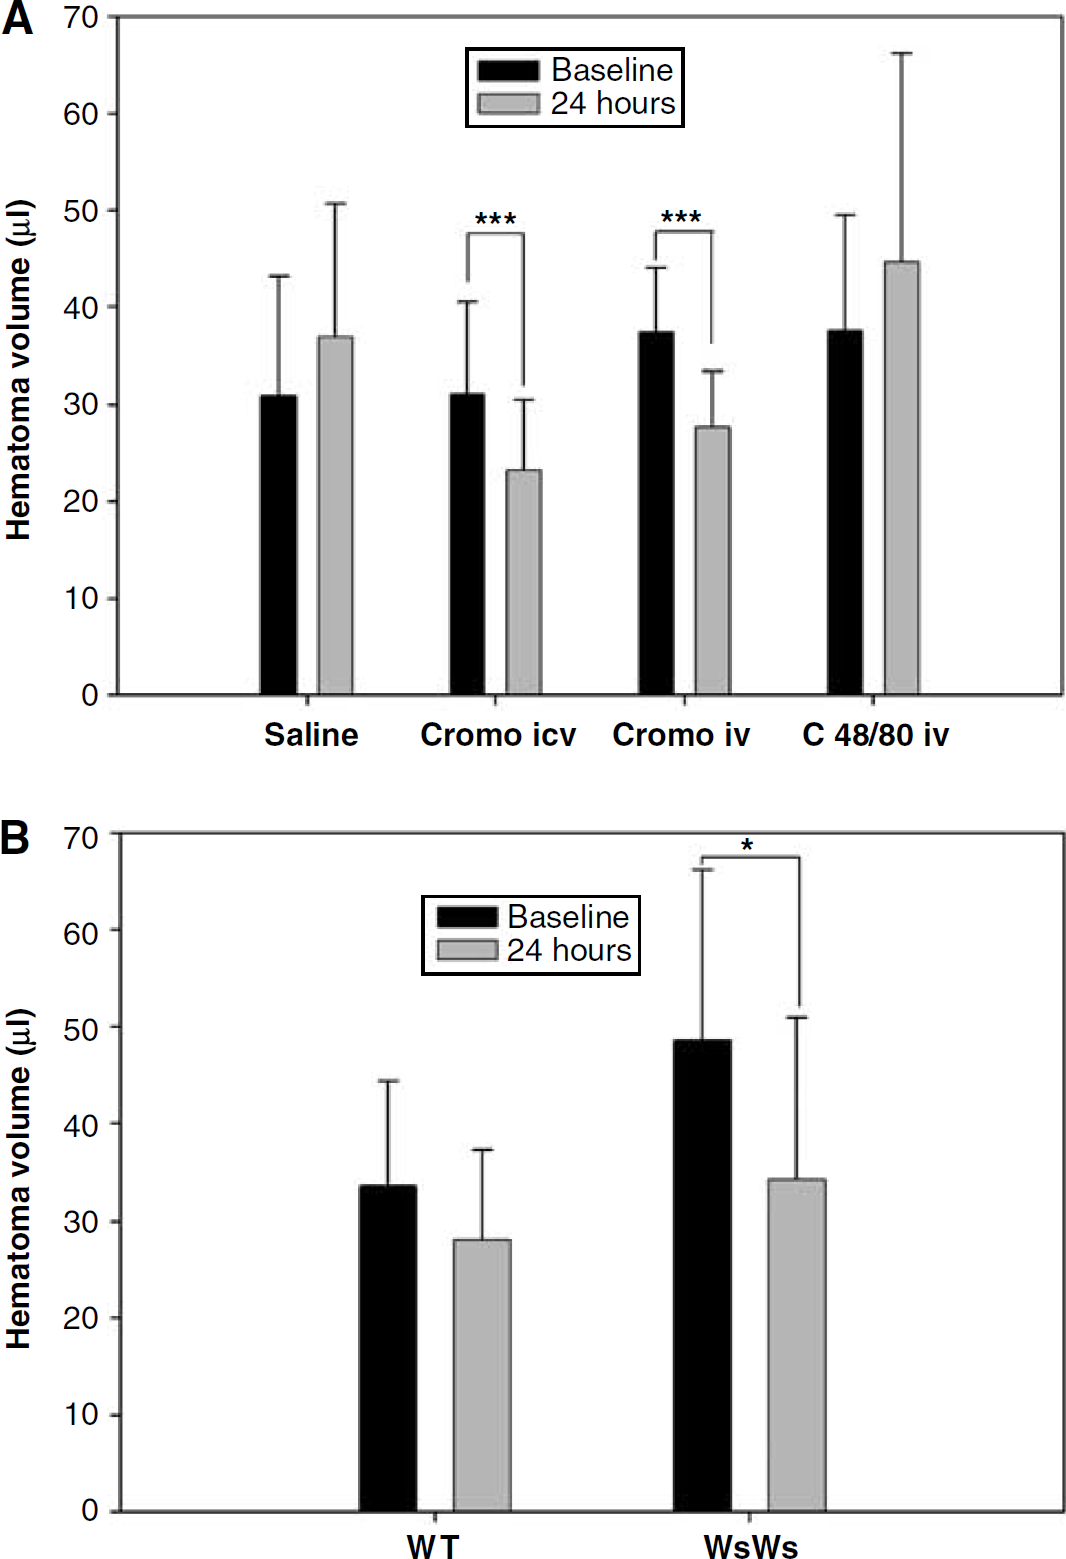
Change of hematoma volume. Significantly less extensive growth of hematoma volume occurred during 24 h in (
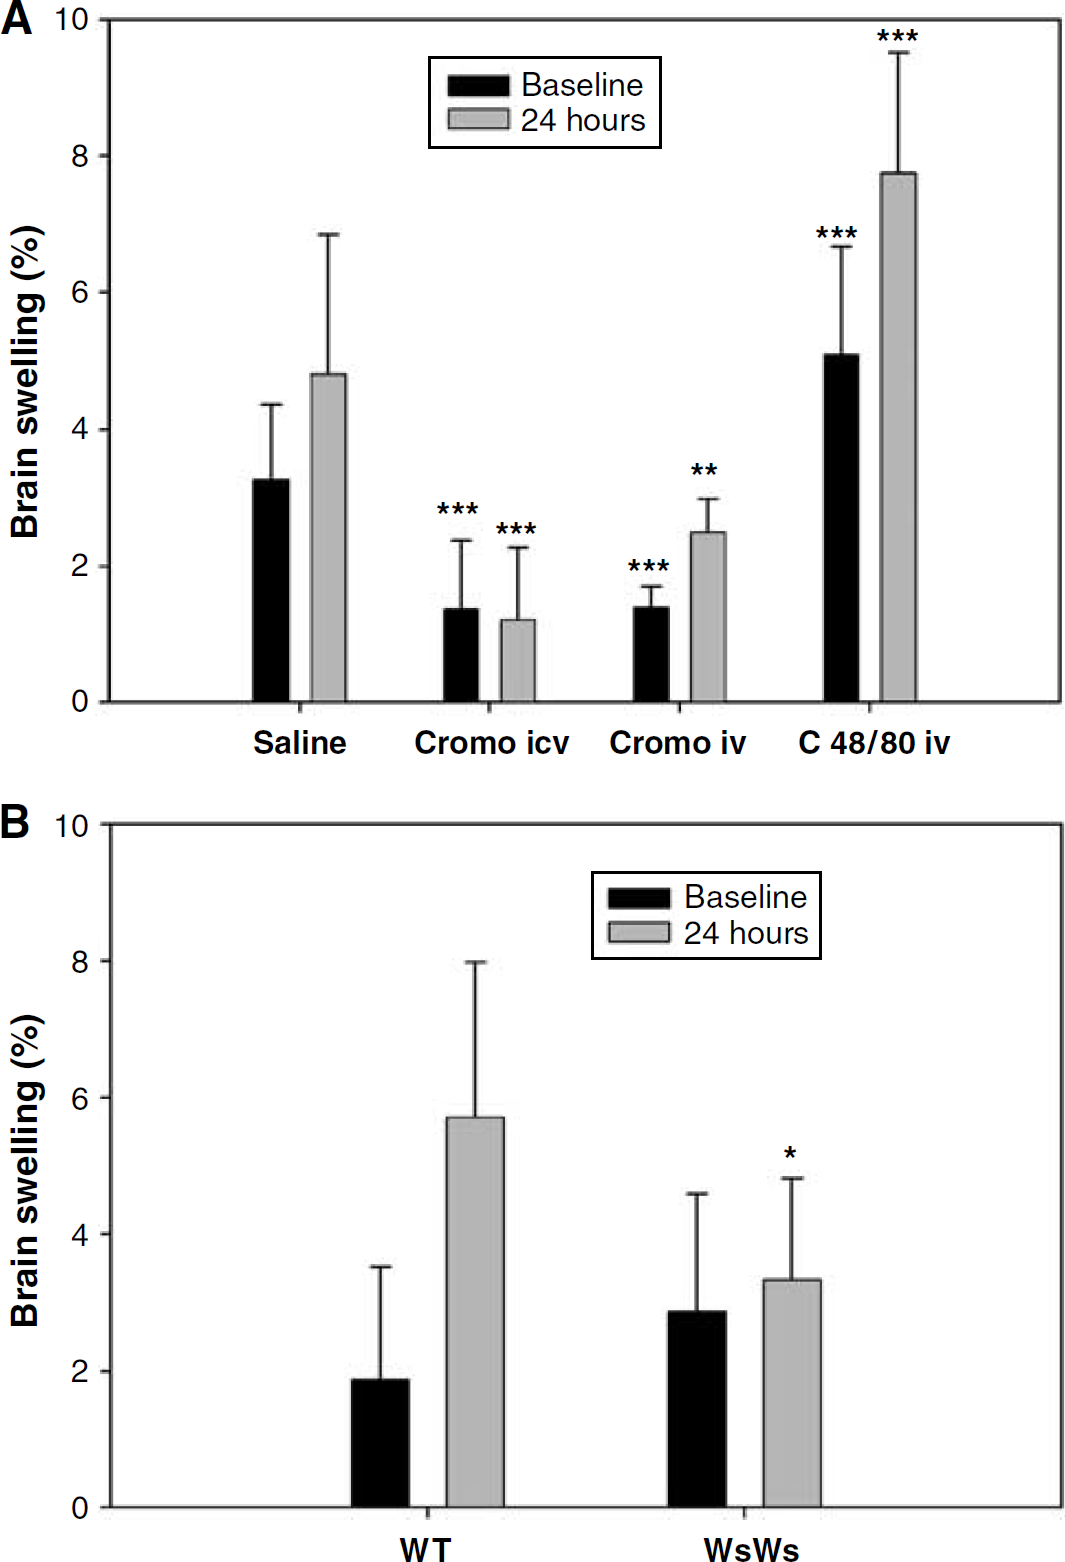
Change of brain swelling in (
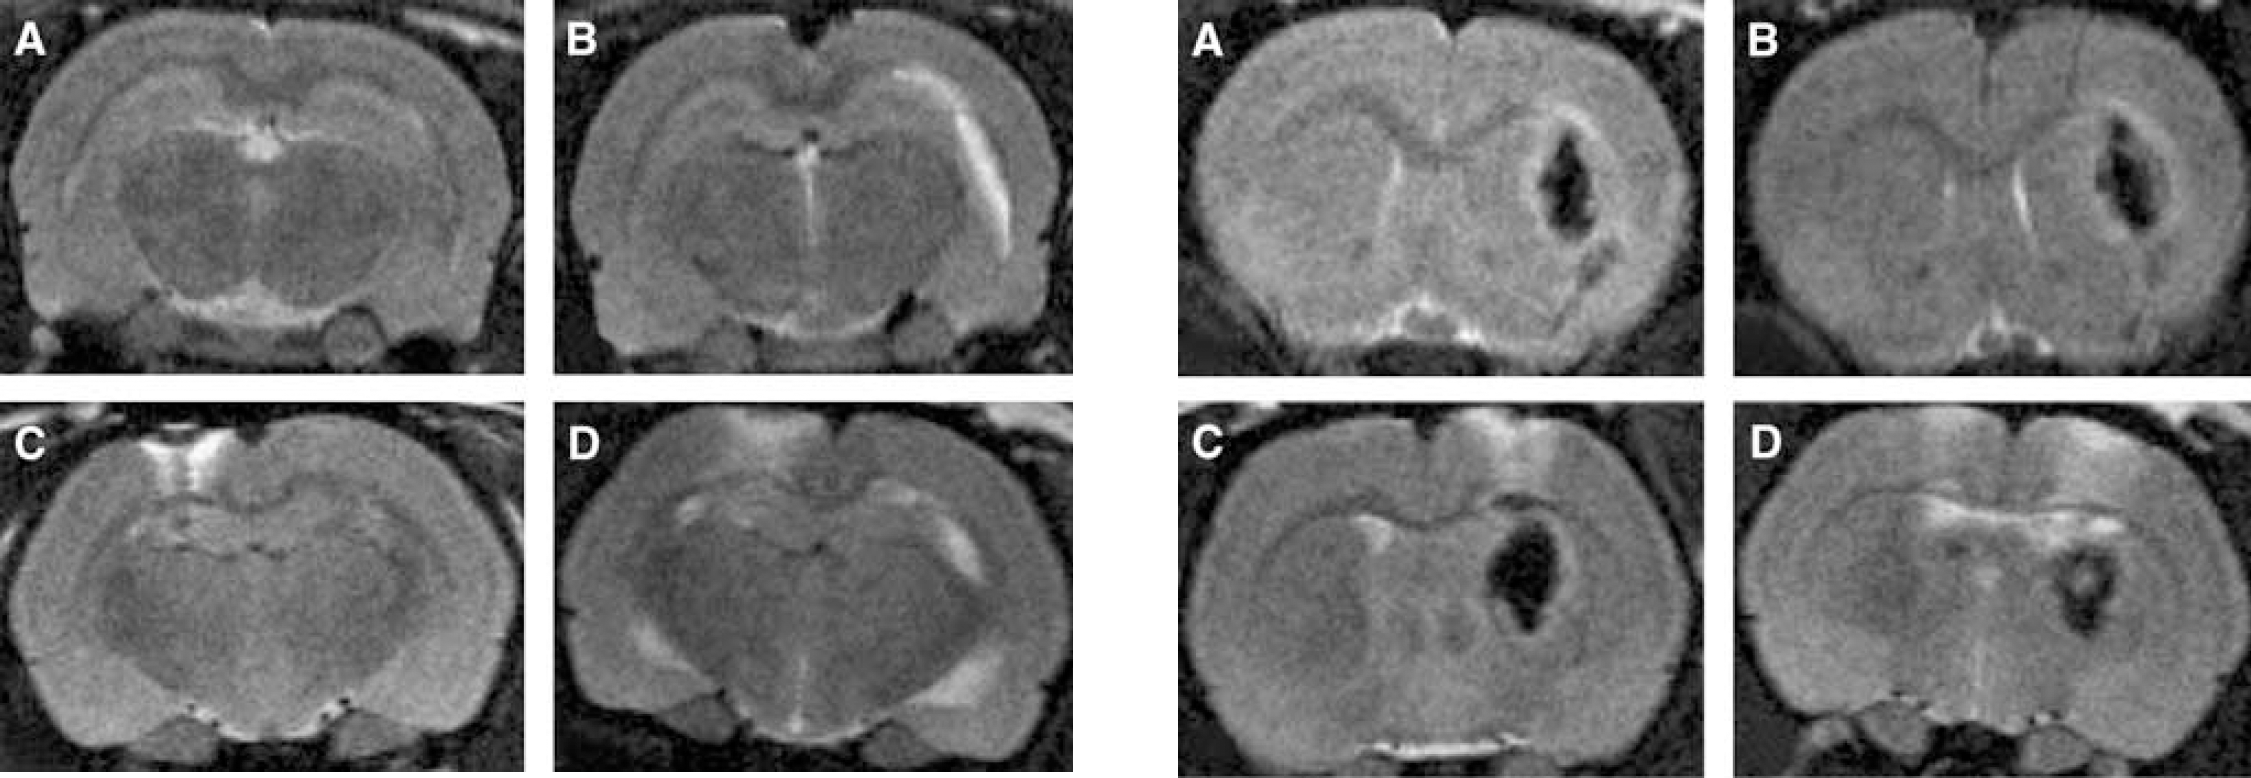
Representative T2-weighted MR images of edema. (

Representative T2-weighted MR images of perihematomal edema. (
Macroscopic Ex Vivo Analysis of Hematoma and Brain Swelling Area
Hematoma area measurements: We also calculated the maximum hematoma area ex vivo from two digital images obtained 24 h after ICH induction. The hematoma areas on the surfaces of both brain slices were outlined and summed up (Image J, NIH, Bethesda, MD, USA).
Brain swelling measurements: The percentages of hemispheric expansion were calculated from digital images obtained ex vivo at 24 h similarly to MR images.
Statistics
Data are presented as mean ± s.d. Neurologic scores are reported individually for each animal. Statistical analysis of multiple groups was performed with one-way analysis of variance for continuous variables followed by Holm—Sidak post hoc test and with Kruskal—Wallis one-way analysis of variance on ranks followed by Dunn's post hoc test for comparing the neurologic scores. For the comparison of two groups, unpaired t-test was used for continuous variables and Mann—Whitney rank sum test for the neurologic scores. Comparison of mortality versus the control group was performed with Fisher's exact test. A two-tailed value of P < 0.05 was considered significant.
Results
Physiologic Variables
There were no significant differences in the physiologic parameters (mean arterial blood pressure, temperature, blood glucose, pH, partial pressure of carbon dioxide, partial pressure of oxygen) between the study groups (data not shown).
Hematoma Area and Volume
Baseline data (30 mins after ICH induction) were not different between the pharmacologically modulated groups (P = 0.27, Figure 2A), but there was a statistically significant difference in both MRI (P = 0.007, Figures 1 and 2A) and ex vivo data (P = 0.02, Table 1) obtained 24 h later. Importantly, the percentage change of hematoma volume at 24 h compared with the baseline data was significantly smaller in the cromoglycate groups (P < 0.001, Figure 2A).
Hematoma volume in the MC-deficient rats, although almost significantly larger at the baseline than in the WT rats (P = 0.059, Figure 2B), showed significantly smaller growth at 24 h compared with the baseline data (P = 0.041, Figure 2B). Similarly, based on the data from ex vivo images, hematoma volume was larger in the WT than in the MC-deficient rats (P = 0.007, Table 1).
Brain Swelling
In the pharmacologically modulated groups, brain swelling was already significantly different at baseline and also 24 h later (P < 0.001, Figure 3A). Edema at 24 h was least extensive in the cromoglycate-i.c.v. group, being even significantly less extensive than in the cromoglycate-i.v. group (P < 0.05, Figure 3A). When the percentage change of brain swelling between the 24 h and baseline data were calculated, only the cromoglycate-i.c.v. (and not cromoglycate-i.v.) group showed significantly less growth than the controls (P < 0.001, Figure 3A). In line with the MRI-derived observations, planimetric data from the digital images of ex vivo tissue slices revealed a substantial difference in the progression of brain swelling in the treatment groups as compared with the controls (P < 0.001, Table 1).
Furthermore, brain swelling at 24 h was significantly less extensive in the MC-deficient rats than in the WT rats (P = 0.035, Figure 3B). The percentage change of brain swelling between the baseline and 24-h values was significantly smaller in the MC-deficient rats than in the WT ones (P < 0.05, Figure 3B). Ex vivo-based calculations also showed significantly less brain edema in the MC-deficient rats compared with the WT ones (P < 0.001, Table 1).
Brain Edema Volume
The brain edema volumes calculated from the hyperintense areas of T2 images at 24 h were significantly smaller in both cromoglycate groups than in the saline and compound 48/80 groups (P < 0.001, Table 2, Figures 4 and 5). Similarly, the T2-based brain edema volume recorded at 24 h was significantly smaller in the MC-deficient rats than in the WT ones (P = 0.036, Table 2). In the pharmacologically modulated groups, T2 ratios averaged over the hyperintense areas were similar at baseline (P = 0.88), but significantly different at 24 h (P = 0.003, Table 2). When the T2 ratio was evaluated in the perihematomal area only, no significant differences existed at baseline (P = 0.30), but major differences were seen at 24 h (P < 0.001, Table 2). The MC-deficient rats showed significantly smaller changes between the baseline and 24-h data of T2 (P = 0.02) and the perihematomal T2 ratios (P = 0.009) than the WT rats (Table 2).
Neurologic Scores and Mortality
Neurologic scores at 24 h were highly significantly better in both cromoglycate-treated groups than in the control or compound 48/80 rats (P < 0.001, Figure 6). Furthermore, the MC-deficient rats responded with highly significantly better neurologic scores than the WT ones (P < 0.001, Figure 6). Mortality at 24 h was 45% in the control group, 0% in both cromoglycate groups, and 55% in the compound 48/80 group. No deaths occurred in the MC-deficient group, whereas the WT rats experienced 25% mortality.
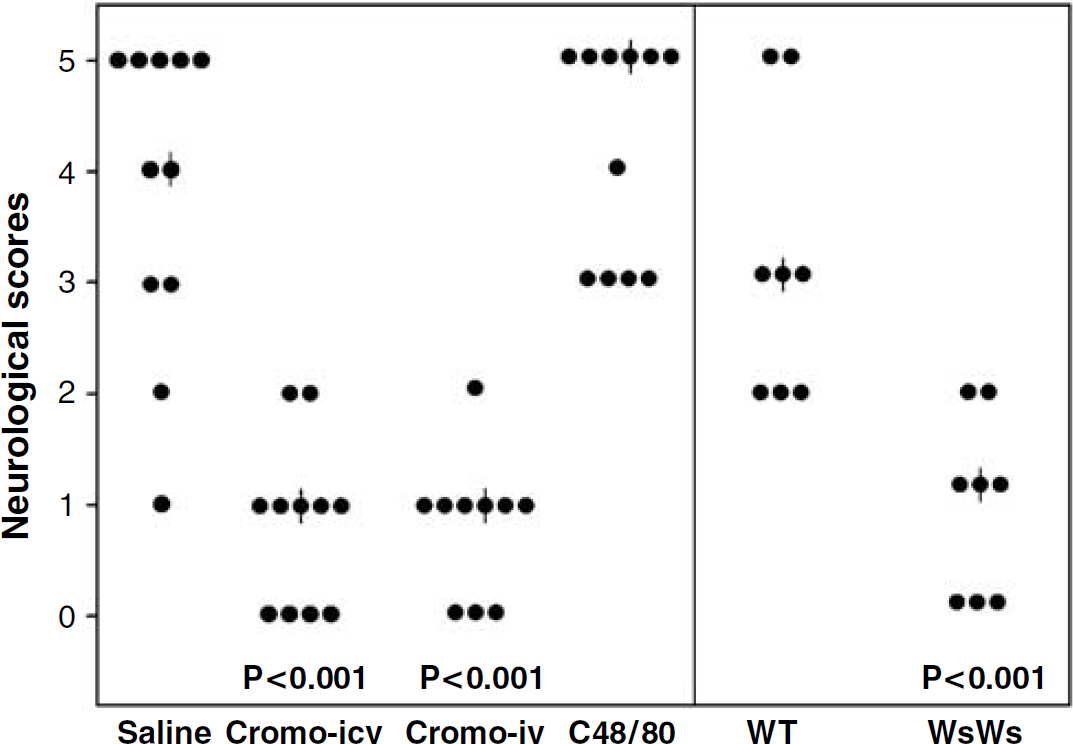
Neurologic scores in all individual animals. |: Median. Cromo i.c.v: cromoglycate i.c.v.; cromo i.v: cromoglycate i.v.; C48/80: compound 48/80; WT: wild-type littermates, WsWs: MC-deficient rats.
Discussion
This work showed that pharmacologically induced inhibition of MC degranulation led to significant reductions in ICH volume (P = 0.007, Figures 1 and 2A, Table 1) and brain swelling (P < 0.001, Figure 3A, Tables 1 and 2) 24 h after the induction of experimental ICH. Stimulation of MC degranulation by compound 48/80, however, led to larger hematomas (Figure 2A, Table 1) and brain swelling (Figure 3A, Tables 1 and 2). The specific role of MC in this response was supported by experiments with MC-deficient rats, which showed significantly less extensive hematoma growth (P = 0.04, Figure 2B, Table 1) and reduced brain swelling (P = 0.03, Figure 3B, Tables 1 and 2) than WT rats at 24 h. Importantly, MRI confirmed that the baseline hematoma volumes were not different between the pharmacologically modulated groups (P = 0.27, Figure 2A). MC-deficient rats responded with better outcomes than WT despite having almost significantly larger baseline hematoma volumes (P = 0.059, Figure 2B), which support the assumption of MC having an influence on the outcome of experimental ICH.
The volumetric changes caused by the MC-targeted interventions also translated into the outcome. The less marked brain expansion after cromoglycate administration was associated with a highly significant improvement in the functional neurologic state at 24 h (P < 0.001, Figure 6), whereas compound 48/80 treatment significantly impaired the functional outcome compared with controls (P < 0.001, Figure 6). Furthermore, MC-deficient rats had significantly better neurologic scores at 24 h than their WT counterparts (P < 0.001, Figure 6). These findings are in line with our previous studies, where a similar pharmacological approach and MC deficiency induced by gene knockout led to significant reductions in early postischemic brain swelling (Strbian et al, 2006) and postthrombolytic hemorrhage formation in a rat model of focal ischemia-reperfusion (Strbian et al, unpublished data). Together with these observations, the present data suggest a critical role for MC in promoting blood—brain barrier failure in the context of ischemic and hemorrhagic stroke.
Clot formation has been described to induce brain edema as early as 1 h after ICH (Wagner et al, 1996), and edema increases progressively during the first 24 h (Lee et al, 1996). Progressive cerebral edema is considered to cause the neurologic deterioration occurring within 24 to 48 h after ICH (Qureshi et al, 2001), and this often leads to a fatal outcome through herniation. In support of the results obtained elsewhere (Gebel et al, 2002), we confirmed that brain swelling corresponds to functional outcome at 24 h. The precise cellular pathomechanism of brain edema formation after ICH is not well established, but this study adds degranulation of MC and the ensuing liberation of vasoactive, anticoagulant, and proteolytic substances to the list of potential causes of hazardous expansive tissue displacement and mortality from ICH.
The pathophysiologic basis of MC-dependent brain edema and swelling during ICH is uncertain. It may depend on the release of a host of MC-derived vasoactive substances (histamine, bradykinin) and proteolytic enzymes (tryptase, chymase), which may increase vascular permeability and even disrupt the basal lamina of the vasculature along with the surrounding extracellular tissue matrix, leading to secondary aggravation of extravasation of blood cells and spreading of serum proteins. Our previous studies (Strbian et al, 2006) seem to support the concept of MC-dependent evolution of local breaches in blood—brain barrier and associated permeability for particles the size of albumin in perihematomal edema formation. Hematoma expansion has been attributed to continued bleeding from the primary source and to mechanical disruption of the surrounding vessels (Qureshi et al, 2001), which is a possible stimulus for local MC activation and degranulation. This view is compatible with the recent evidence suggesting that secondary growth of ICH may result from bleeding into a peripheral zone around ICH (Rosand et al, 2002). On activation, MC release heparin, an endogenous anticoagulant synthesized and released solely by MC. This may lead to impaired hemostasis and prolonged extravasation of red blood cells and promote secondary hemorrhage formation. This hypothesis is in line with the present data showing a significant growth of hematoma in the saline and compound 48/80 groups (Figures 1 and 2A) and a lack of hematoma growth in both cromoglycate-treated groups of rats (Figures 1 and 2A) and in MC-deficient rats (Figure 2B). These antihemostatic effects superimposed on the vasculopathic proteolytic capacity make MC, indeed, a largely fibrinolytic cell type in the microvascular milieu.
Intracerebral hemorrhage often leads to death or morbidity, and death is most commonly caused by the mass effect of the hematoma and the surrounding edema. As surgical interventions do not seem to improve outcome in these patients (Mendelow et al, 2005), pharmacological interventions are urgently needed. The present work demonstrates that MC inhibition can simultaneously attenuate both edema formation and hematoma expansion. While this is a proof-of-concept study showing the potential role of MC and especially MC blocking in the modulation of perihematomal edema and brain swelling, the present data do not establish a pharmacological protocol for therapeutic MC blocking in treating ICH. Further studies with variable timing of drug administration are necessary. However, the fact that the degree of brain swelling and edema corresponded with mortality, and that all cromoglyca-tetreated and MC-deficient rats survived with good outcome through the next 24 h, while those treated with saline or compound 48/80 and WT rats had mortality rates of 45%, 55%, and 25%, respectively, suggests that MC blocking is a potentially interesting novel avenue for the development of therapies against the life-threatening consequences of ICH.