
Abstract
In dynamic susceptibility contrast (DSC) perfusion-weighted imaging, effects of recirculation are normally minimized by a gamma-variate fitting procedure of the concentration curves before estimating hemodynamic parameters. The success of this method, however, hinges largely on the extent to which magnetic resonance signal is altered in the presence of a contrast agent and a temporal separation between the first and subsequent passages of the contrast agent. Moreover, important physiologic information might be compromised by imposing an analytic equation to all measured concentration curves. This investigation proposes to exploit independent component analysis to minimize effects of recirculation in DSC. Results obtained from simulation, normal healthy volunteers, and acute stroke patients show that such a technique can greatly minimize the effects of recirculation despite a substantial overlap between the first passage and recirculation. This in turn should improve estimation of cerebral hemodynamics particularly when an overlap between the first passage and recirculation is suspected as in an ischemic lesion.
Keywords
Introduction
Dynamic susceptibility contrast (DSC) approaches have been widely utilized in the study of tissue perfusion (Aronen et al, 1995; Guckel et al, 1996; Østergaard et al, 1996a, 1996b; Rempp et al, 1994; Rosen et al, 1998; Schellinger et al, 2003; Sorensen et al, 1997). In a DSC experiment, a bolus of paramagnetic contrast agent (for example, Gd-DTPA) is injected intravenously, and its passage through blood vessels induces signal reduction when a T2∗/T2-weighted sequence is used. By rapidly acquiring images before, during, and after the injection of a contrast agent, temporal signal changes induced by the presence of the contrast agent can be measured. Magnetic resonance (MR) signal changes are subsequently converted to a relative concentration time course. Finally, various postprocessing approaches such as singular value decomposition deconvolution (Østergaard et al, 1996b) are used to estimate cerebral blood flow, cerebral blood volume (CBV), and mean transit time. Although the approaches to estimate these physiologic parameters differ, they share a common goal of removing the effects of recirculation so that a more accurate estimate of cerebral hemodynamics may be obtained. To this end, fitting the concentration time curves to a gamma-variate function (Davenport, 1983; Thompson et al, 1964) has been proposed. This approach however has two major limitations. One primary limitation is that the success of this approach hinges largely on the extent to which MR signal is altered in the presence of a contrast agent and on a temporal separation between the first and subsequent passages of the contrast agent. When normal and young volunteers are studied, these two requirements are easily fulfilled, making it straightforward to separate the first passage from the recirculation. In contrast, substantially broadened concentration curves with a reduced signal change may be present in patients with cardiovascular and/or cerebrovascular diseases. Under such condition, it can be a challenge to effectively minimize recirculation by fitting a gamma-variate function to the concentration time curve. Another limitation of this approach is that important physiologic information may potentially be lost by imposing an analytic equation to all measured concentration time curves. New approaches capable of minimizing effects of recirculation while preserving the original characteristics of the concentration time curves are therefore warranted.
Independent component analysis (ICA) has been widely used to determine underlying independent signal sources from observed data with minimal knowledge of the sources (Bell and Sejnowski, 1995; Cardoso, 1998; Comon, 1994; Hyvärinen, 1999; Hyvärinen et al, 2001; Hyvärinen and Oja, 1997, 2000). This blind source separation method has previously been used to identify regions of activation in functional magnetic resonance imaging (Arfanakis et al, 2000; Biswal and Ulmer, 1999; McKeown et al, 1998a, 1998b, 2003; McKeown and Sejnowski, 1998; Moritz et al, 2000), remove large vessel effects (Carroll et al, 2002) and define local arterial input functions (Calamante et al, 2004) in DSC magnetic resonance images, segment different tissues (Fukao et al, 1999), and remove artifacts and random noise in diffusion tensor images (Arfanakis et al, 2002). Assuming that the concentration time curves are a linear superposition of MR signal changes arising from contributions such as arteries, veins, tissue, recirculation, and noise, we propose to use ICA to minimize effects of recirculation in DSC experiments. Results from simulation, normal volunteers, and acute stroke patients will be provided to show the effectiveness of this ICA approach.
Materials and methods
Images were acquired from three healthy volunteers (one male, two female, age 24 to 33 years) at a 3 T scanner (Allegra, Siemens Medical Systems Inc.) and five acute stroke patients (three male, two female, age 63 to 83) at 1.5 T (Vision, Siemens Medical Systems Inc.). All experimental protocols were approved by the institutional review board and written informed consent was obtained before imaging studies. The acute stroke patients were recruited as part of the clinical trials for neuroprotective agents. For the normal volunteer study, a single shot T2∗-weighted echo planar imaging sequence was used to acquire DSC images. The imaging parameters were as follows: repetition time (TR)=1.5 secs; echo time (TE)=28 ms; field-of-view (FOV)=220 × 220 mm2; acquisition matrix=64 × 64; slice thickness (TH)=5 mm; and interslice gap=1.5 mm. A total of 12 slices were acquired. This sequence was also used for patient studies with the exception that TR and TE were 2 secs and 54 ms, respectively. The DSC perfusion sequence was repeated 60 and 40 times for the normal volunteer and patient studies, respectively. The contrast agent (Gd-DTPA, 0.1 mmol/kg) was injected by hand, at a rate of ∼2 mL/sec, after the completion of fifth scan while subjects laid still inside the magnet.
In addition to DSC images, diffusion-weighted and T2-weigthed images were also acquired for acute stroke patients. Diffusion-weighted images with b=0 and b=1,000 secs/mm2 along all three main axes were acquired and subsequently trace apparent diffusion coefficient maps were calculated. The imaging parameters for the diffusion-weighted image sequence were as follows: TR=2 secs; TE=100 ms; TH=7 mm; FOV=240 × 240 mm2; and 20 slices. All patients were imaged three times with the first time point (tp1) occurring within 6 h, the second time point (tp2) within 3 to 5 days, and the third time point (tp3) taking place 3 months after symptom onset. The follow-up T2-weighted images consisted of 12 slices (TH=6 mm, interslice gap=1 mm, FOV=220 × 220 mm2, and acquisition matrix=256 × 256). The DSC and diffusion-weighted images acquired at tp1 and tp2 were spatially coregistered to the follow-up tp3 T2-weighted images with an automated image registration software package, AIR 5.2.5 (University of California at Los Angeles) (Woods et al, 1992, 1998) using an affine, 12-parameter transformation model and trilinear interpolation.
Simulation Studies
The ICA approach is only valid when the signal sources are independent of each other and at most one source is normally distributed. In the current study, ICA analysis based on a standard Infomax algorithm was used, and this approach is effective only when the distributions of these source signals are super-Gaussian. Simulation studies were conducted to examine the statistical dependence between the first passage and the recirculation, as well as the distributions of concentration curves to determine the validity of the proposed ICA approach in discerning the first passage from recirculation. In addition, the sum of squared differences (SSDs) between the estimated and the ‘true’ first passage were studied to determine the effectiveness of this approach. Detailed discussion of these simulation studies is given below.
Statistical independence
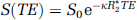
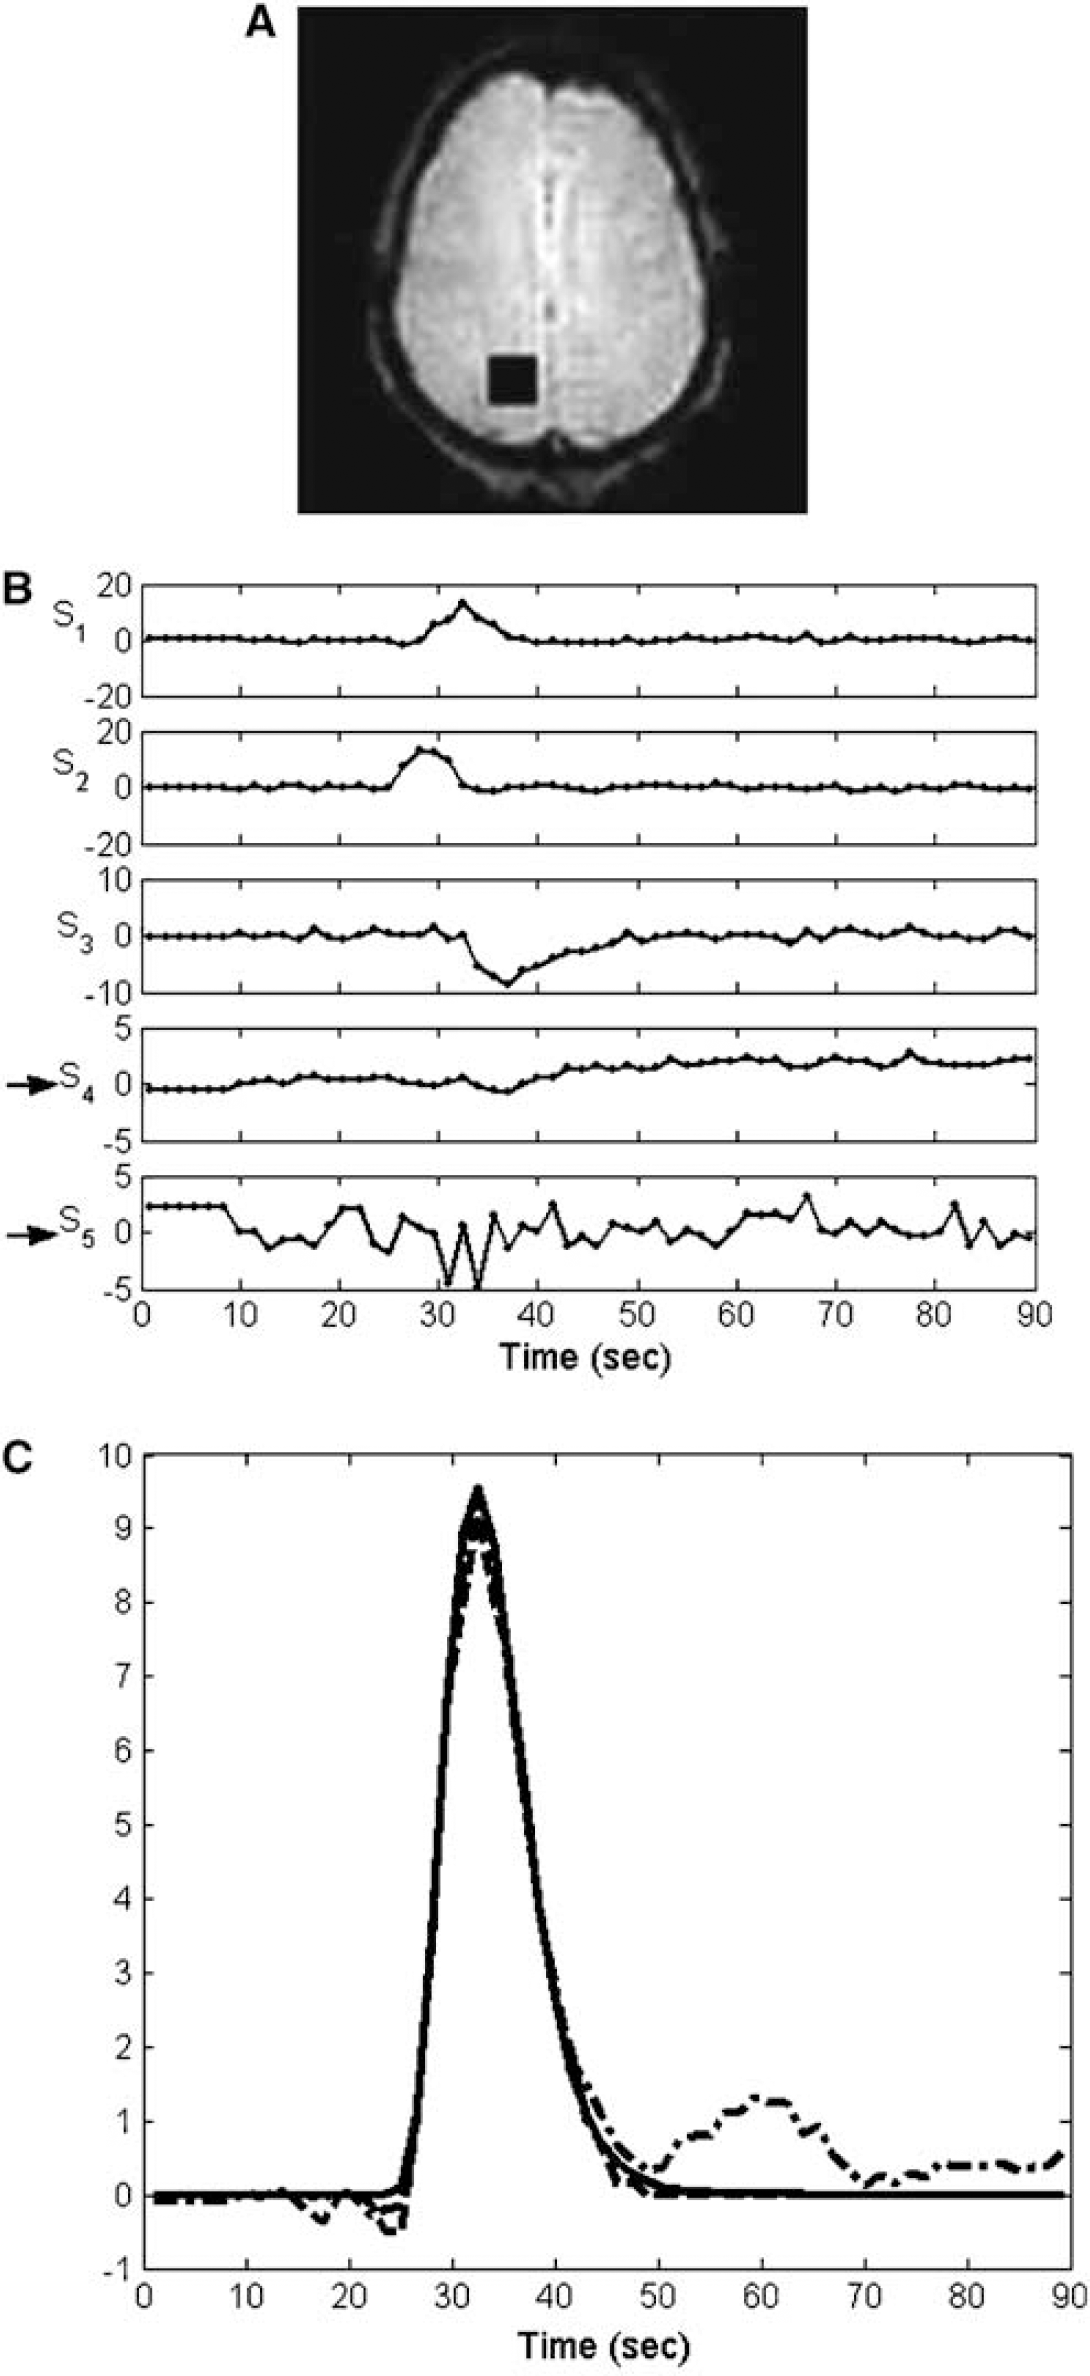
One of the main assumptions for the proposed ICA is that the first passage and recirculation are statistically independent. It is therefore imperative to determine the validity of such assumption. A 5 × 5 region of interest (ROI) was chosen from one slice of a normal subject (Figure 1A). Time to arrival (TTA) was estimated for each voxel using the corresponding MR susceptibility signal change and a cutoff time was manually determined based on the operator's subjective judgment for each corresponding concentration time course within the ROI in order to best separate the putative first passage and recirculation (Figure 1B). With the aim of determining the degree of statistical independence between the first-pass and recirculation even when they are overlapped to each other, the maximum concentration of the operator-defined recirculation was first scaled to approximately half of the corresponding operator-defined first-pass and was then artificially left shifted in time with respect to the first passage ranging from 1.5 to 10.5 secs with an increment of 1.5 secs. Subsequently, a Spearman rank coefficient test was used to the tissue curves to determine the degree of statistical independence between the first-pass and recirculation.
Distribution of concentration curve
The kurtosis of each first-pass and the associated recirculation component was calculated to determine whether the sources are super- or sub-Gaussian.
Effectiveness of the proposed ICA approach
Realistic synthetic concentration time curves were simulated for 90 secs similar to that by Østergaard et al (1996a, 1996b) to investigate the effectiveness of both gamma-variate fitting and ICA analysis under different signal-to-noise (SNR) values. First, tissue concentration during the first bolus passage was modeled as a gamma-variate function, that is,
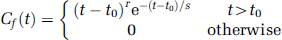
where t0 is the TTA and r and s are shape parameters. To simulate different degrees of overlap and to increase the ambiguity between the first passage and recirculation, effects of recirculation were simulated by using the above function (equation (1)) but with a delay of t d ranging from 4.5 to 10.5 secs with an increment of 1.5 secs and was convolved with an exponential function with a time constant τ r . Parameters used in this study were t0=20 secs, r=3.0, s=1.5 secs, TR=1.5 secs, and τ r =30 secs representing normal adult volunteers (Østergaard et al, 1996b). Second, the MR signal intensity was modeled as
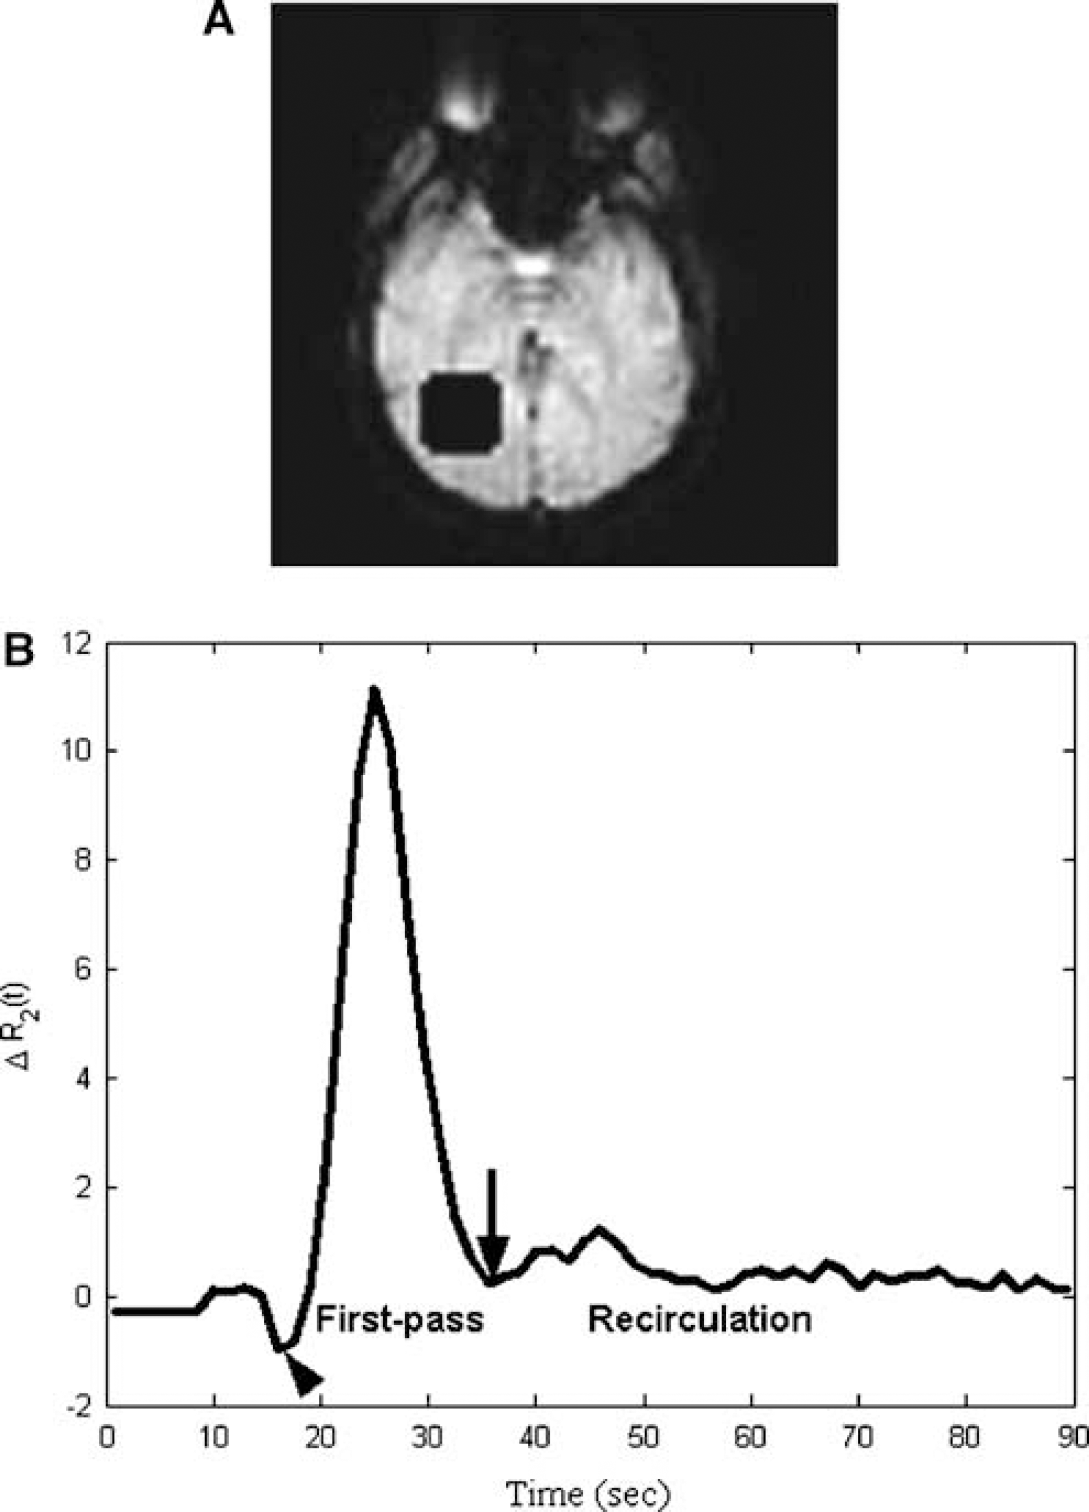
where R2∗ and TE are respectively the reciprocal of T2∗ and the echo time, and κ is a proportionality constant. For the simulation, S0 and TE were set as 400 and 28 ms, respectively. The proportionality factor κ was scaled to yield 40% bolus passage signal drop at a flow rate of 60 mL/100 g min and CBV=4%, corresponding to values typically found in human gray matter (Østergaard et al, 1996b). The signal intensity curves were then duplicated into 25 copies, representing 25 voxels. Gaussian noise was generated from normally distributed random numbers with zero mean and was added to each curve, such that all resulting susceptibility signal curves in the synthetic 5 × 5 ROI have the same desired SNR value (defined as the baseline MR susceptibility signal intensity divided by the standard deviation of the random Gaussian noise). Susceptibility signals were then transformed to new concentration curves. Figure 2A shows the averaged simulated concentration curve of the first-pass with the recirculation delayed by 4.5 secs and SNR=8.
An example for assessing statistical independence between the first-pass and recirculation is illustrated. The anatomic image is displayed in (
An ICA analysis example using simulated broadened curves where the synthetic recirculation time courses were delayed by 4.5 secs at SNR=8 is illustrated. With the resulting averaged simulated concentration time courses shown in (
Synthetic concentration curves with different degrees of overlap between the first-pass and recirculation at SNR values ranging from 4 to 20 with an increment of 4 were first obtained as aforementioned. Both the proposed ICA and the gamma-variate fitting methods were used to extract the first-pass from the synthetic concentration curves. Since the synthetic first-pass was available, the SSD between the estimated first-pass using either the proposed ICA approach or the gamma-variate fit and the simulated true first-pass was calculated to test the effectiveness of each method. A Monte Carlo simulation of 500 runs was performed for each set of delay t d and SNR condition.
Independent Component Analysis
In the current study, Infomax (Bell and Sejnowski, 1995), one of the most widely used ICA algorithms, was used to reveal different temporal components in the concentration time curves. The temporal Infomax algorithm with a maximum likelihood formulation analysis (ICAML) was applied to concentration time curves of each 5 × 5 ROI throughout the entire brain parenchyma as shown in the following equation:
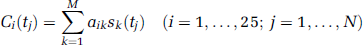
where C i (t j ) is the concentration time curve of voxel i at time t j , a ik is the mixing coefficient, s k (t j ) is the kth temporal independent component (IC) at t j , N is the number of measurements, and M is the number of sources.
Since the number of latent components, M, is unknown, the Bayesian information criterion (BIC) method was used to estimate the number of sources (Hansen et al, 2001). By estimating the posterior probability of the model containing M components, the model order may be determined. Matlab code for BIC-based ICAML analysis is available through the website (ICAML Matlab code).
Identification of Recirculation Components
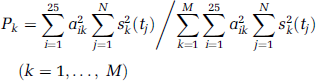
To determine the potential components contributed by recirculation, the following procedures and criteria were used. First, the relative energy of each IC, P k (k=1, …, M), was calculated as in the following equation:
Second, the full-width at half-maximum (FWHM) of the major dip/peak of each component was obtained. Third, the TTA of the major dip/peak of each component was defined as the time when the component reaches the half-maximum. Fourth, the components with the earliest TTA were first excluded, and the mean TTA of the remaining components was used as a threshold such that any component with a TTA later than this threshold was determined to be a late arrival component. Fifth, the late arrival ICs with a relative energy less than 20% of the total energy and the largest FWHM, which also needs to be at least 10.5 secs for normal subjects and 14 secs for acute stroke patients, were considered as recirculation components. If no recirculation associated IC was found, M was increased and ICA analysis was repeated. Sixth, after determining the recirculation components, other late ICs with relative energy smaller than that of the recirculation components were considered as noise components. Finally, both recirculation and noise components were excluded and concentration time courses were then reconstructed using the remaining ICs.
Gamma-Variate Fitting
Based on the assumption that the first-pass of the contrast agent conforms a gamma-variate shape (Davenport, 1983; Thompson et al, 1964), curving fitting is one of the techniques used by many investigators to remove recirculation in DSC approaches (Barbier et al, 2001; Chan and Nelson, 2004; Heiland, 2003; Jackson, 2004; Padhani, 2002; Rosen et al, 1991; Sorensen and Reimer, 2000). By fitting the tissue curve using a gamma-variate function, it has been shown that the fitting not only smoothes the data, but also effectively reduces noise and eliminates the effects of recirculation (Barbier et al, 2001; Benner et al, 1997; Calamante et al, 1999, 2000; Li et al, 1998; Rosen et al, 1990). Therefore, to determine the effectiveness of the proposed approach, we have elected to compare our results with those obtained using the gamma-variate approach. Each concentration time course was fitted by a gamma-variate function as proposed by Davenport (1983) and Thompson et al (1964) as well as utilized the ICA approach to minimize the effects of recirculation.
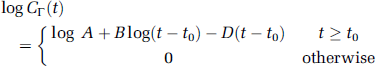
For better efficiency and less computation complexity, a logarithm transformation was first applied to each concentration time course before fitting. The time to the peak (TTP) was then estimated as the transformed concentration time course reaches its maximum. A linear model of log CΓ(t) defined in equation (5) up to the right turning point was obtained in the least square sense using the Levenberg—Marquardt method. The left and right turning points of transformed concentration time course were estimated to lie in the half-maximum before and after TTP, respectively. The initial estimates for the fitting parameters were obtained as follows: an initial guess for the TTA of the bolus, t0(0), was estimated by searching from TTP backward for two successive values, which were smaller than 10% of the maximum. Fitting parameters, log A(0), B(0), and D(0), were estimated such that the maximum and turning points of log CΓ(t) correspond to the maximum and turning points of the logarithm transformed concentration time course. On convergence, the fitted curve was extrapolated from the right turning point to the end, and then was transformed back using an exponential transformation to obtain the fitted forward concentration time course:
Relative Regional CBV Analysis
If recirculation components were not effectively removed from the first passage, relative regional cerebral blood volume (rrCBV), calculated as the area beneath each concentration time curve (Axel, 1980; Belliveau et al, 1990), may be overestimated. An ROI approach was used to obtain quantitative measures of rrCBV to assess effectiveness of minimizing recirculation. In the normal subject group, mean rrCBV encompassing both hemispheres in one slice was determined for comparison. For acute stroke patients, however, two ROIs were defined to obtain estimates of rrCBV based on the 3-month follow-up T2-weigted images with one ROI encompassing the T2 lesion and the other at a similar anatomic region in the contralateral hemisphere. The rrCBV was defined as the area underlying each concentration curve with recirculation minimized using ICA (rrCBV(i)), gamma-variate fitting (rrCBV(f)), or without recirculation removal (numerical integration, rrCBV(wo)). In addition, normalized percentage rrCBV difference map was also generated, which is defined as the rrCBV difference between the gamma-variate fitting and the ICA approach and normalized to that obtained using gamma-variate fitting.
Statistical Analysis
Statistical analyses based on right-tailed paired t-test were used to compare the performance of ICA and gamma-variate fitting using SSD in simulation studies and rrCBV in stroke patient studies. A P-value less than 0.05 was considered significantly different.
Results
The BIC procedure shows that the number of ICs, M, varies at different anatomic locations and among different subjects. Nevertheless, BIC reveals M ranging between 5 and 7 components. Therefore, an M of 5 was typically used in our study. If none of the ICs fulfilled the criteria as a recirculation component, M was increased up to 7, and the entire process was repeated. This approach has proven to be robust in identifying the recirculation components.
Simulation Studies
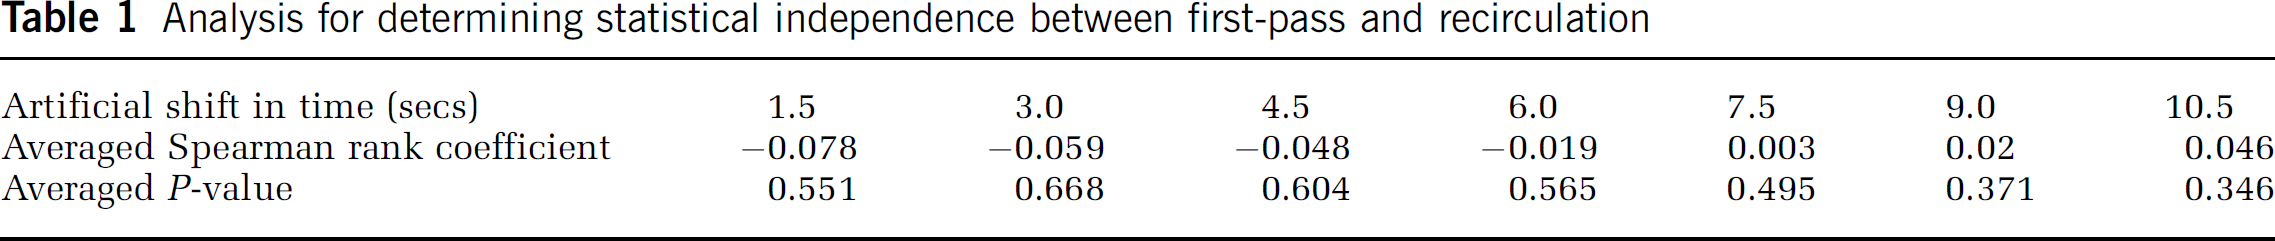
The Spearman rank coefficient test for the composite concentration curves with different degrees of overlaps between the first-pass and recirculation is summarized in Table 1. Although the Spearman rank coefficients are nonzero, they are relatively small (ranges from −0.078 to 0.046). Moreover, even when a substantial overlap is present (time shift=10.5 secs), an average Spearman rank coefficient of 0.046 (P>0.3) is obtained, suggesting that the first-pass and recirculation remain statistically independent.
Analysis for determining statistical independence between first-pass and recirculation
Standard Infomax algorithm may fail when the sources are sub-Gaussian. The averaged kurtosis for the putative first-pass and recirculation for the predefined 5 × 5 ROI in Figure 1A are 6.68 and 0.42, respectively. Because both the first-pass and recirculation have positive kurtosis, they are likely to be super-Gaussian and thus the standard Infomax algorithm may be used.
Figure 2A shows an averaged synthetic concentration curve of the simulated 25 voxels. Although all of the procedures outlined in the Materials and methods section were performed on a voxel-by-voxel basis, the average of the 25 concentration curves is shown for better illustration (this convention is used hereafter unless otherwise mentioned). The delay between the first passage and recirculation was 4.5 secs and the SNR was 8. Five ICs are observed (Figure 2B) and IC3, IC4, and IC5 (marked by black arrows) are identified as recirculation or noise components (relative energies of 7.53%, 5.28%, and 3.36%, respectively). The simulated first-pass (solid line), the averaged gamma-variate fit (dash-dotted line), and the averaged ICA reconstructed time course (dashed line) after removing IC3, IC4, and IC5 are shown in Figure 2C. The gamma-variate fit substantially overestimates the first-pass, whereas the ICA result is more comparable to the true synthetic first passage.
Monte Carlo simulation results are provided in Figure 3. The averaged SSDs between the estimated first-pass using either the proposed ICA approach (circles) or the gamma-variate fit (pluses) and the simulated first-pass with different time delays (4.5 to 10.5 secs) are shown in Figure 3A for various SNRs. For an SNR smaller than 16, statistical analysis reveals that the SSD values obtained using the gamma-variate fit are significantly larger than those using ICA (P<0.005), whereas the SSD values are comparable (P>0.05) between the two approaches for SNR≥16. In addition, the averaged rrCBV values calculated using the concentration curves without recirculation removal (numerical integration, squares), with either the proposed ICA approach (circles) or the gamma-variate fit (pluses) and the simulated first-pass (dashed line) with different time delays (4.5 to 10.5 secs), are shown in Figure 3B for various SNRs. The rrCBV values computed without recirculation removal are clearly significantly larger than the remaining approaches, whereas ICA yields rrCBV values most close to those computed using the true first-pass. Similarly, fitting yields statistically larger rrCBV values than ICA analysis at SNRs less than 16. These findings suggest that the proposed ICA approach is more effective than the gamma-variate fitting approach in separating first-pass from recirculation at low SNR (<16), even when a substantial overlap between the first-pass and the recirculation is present.
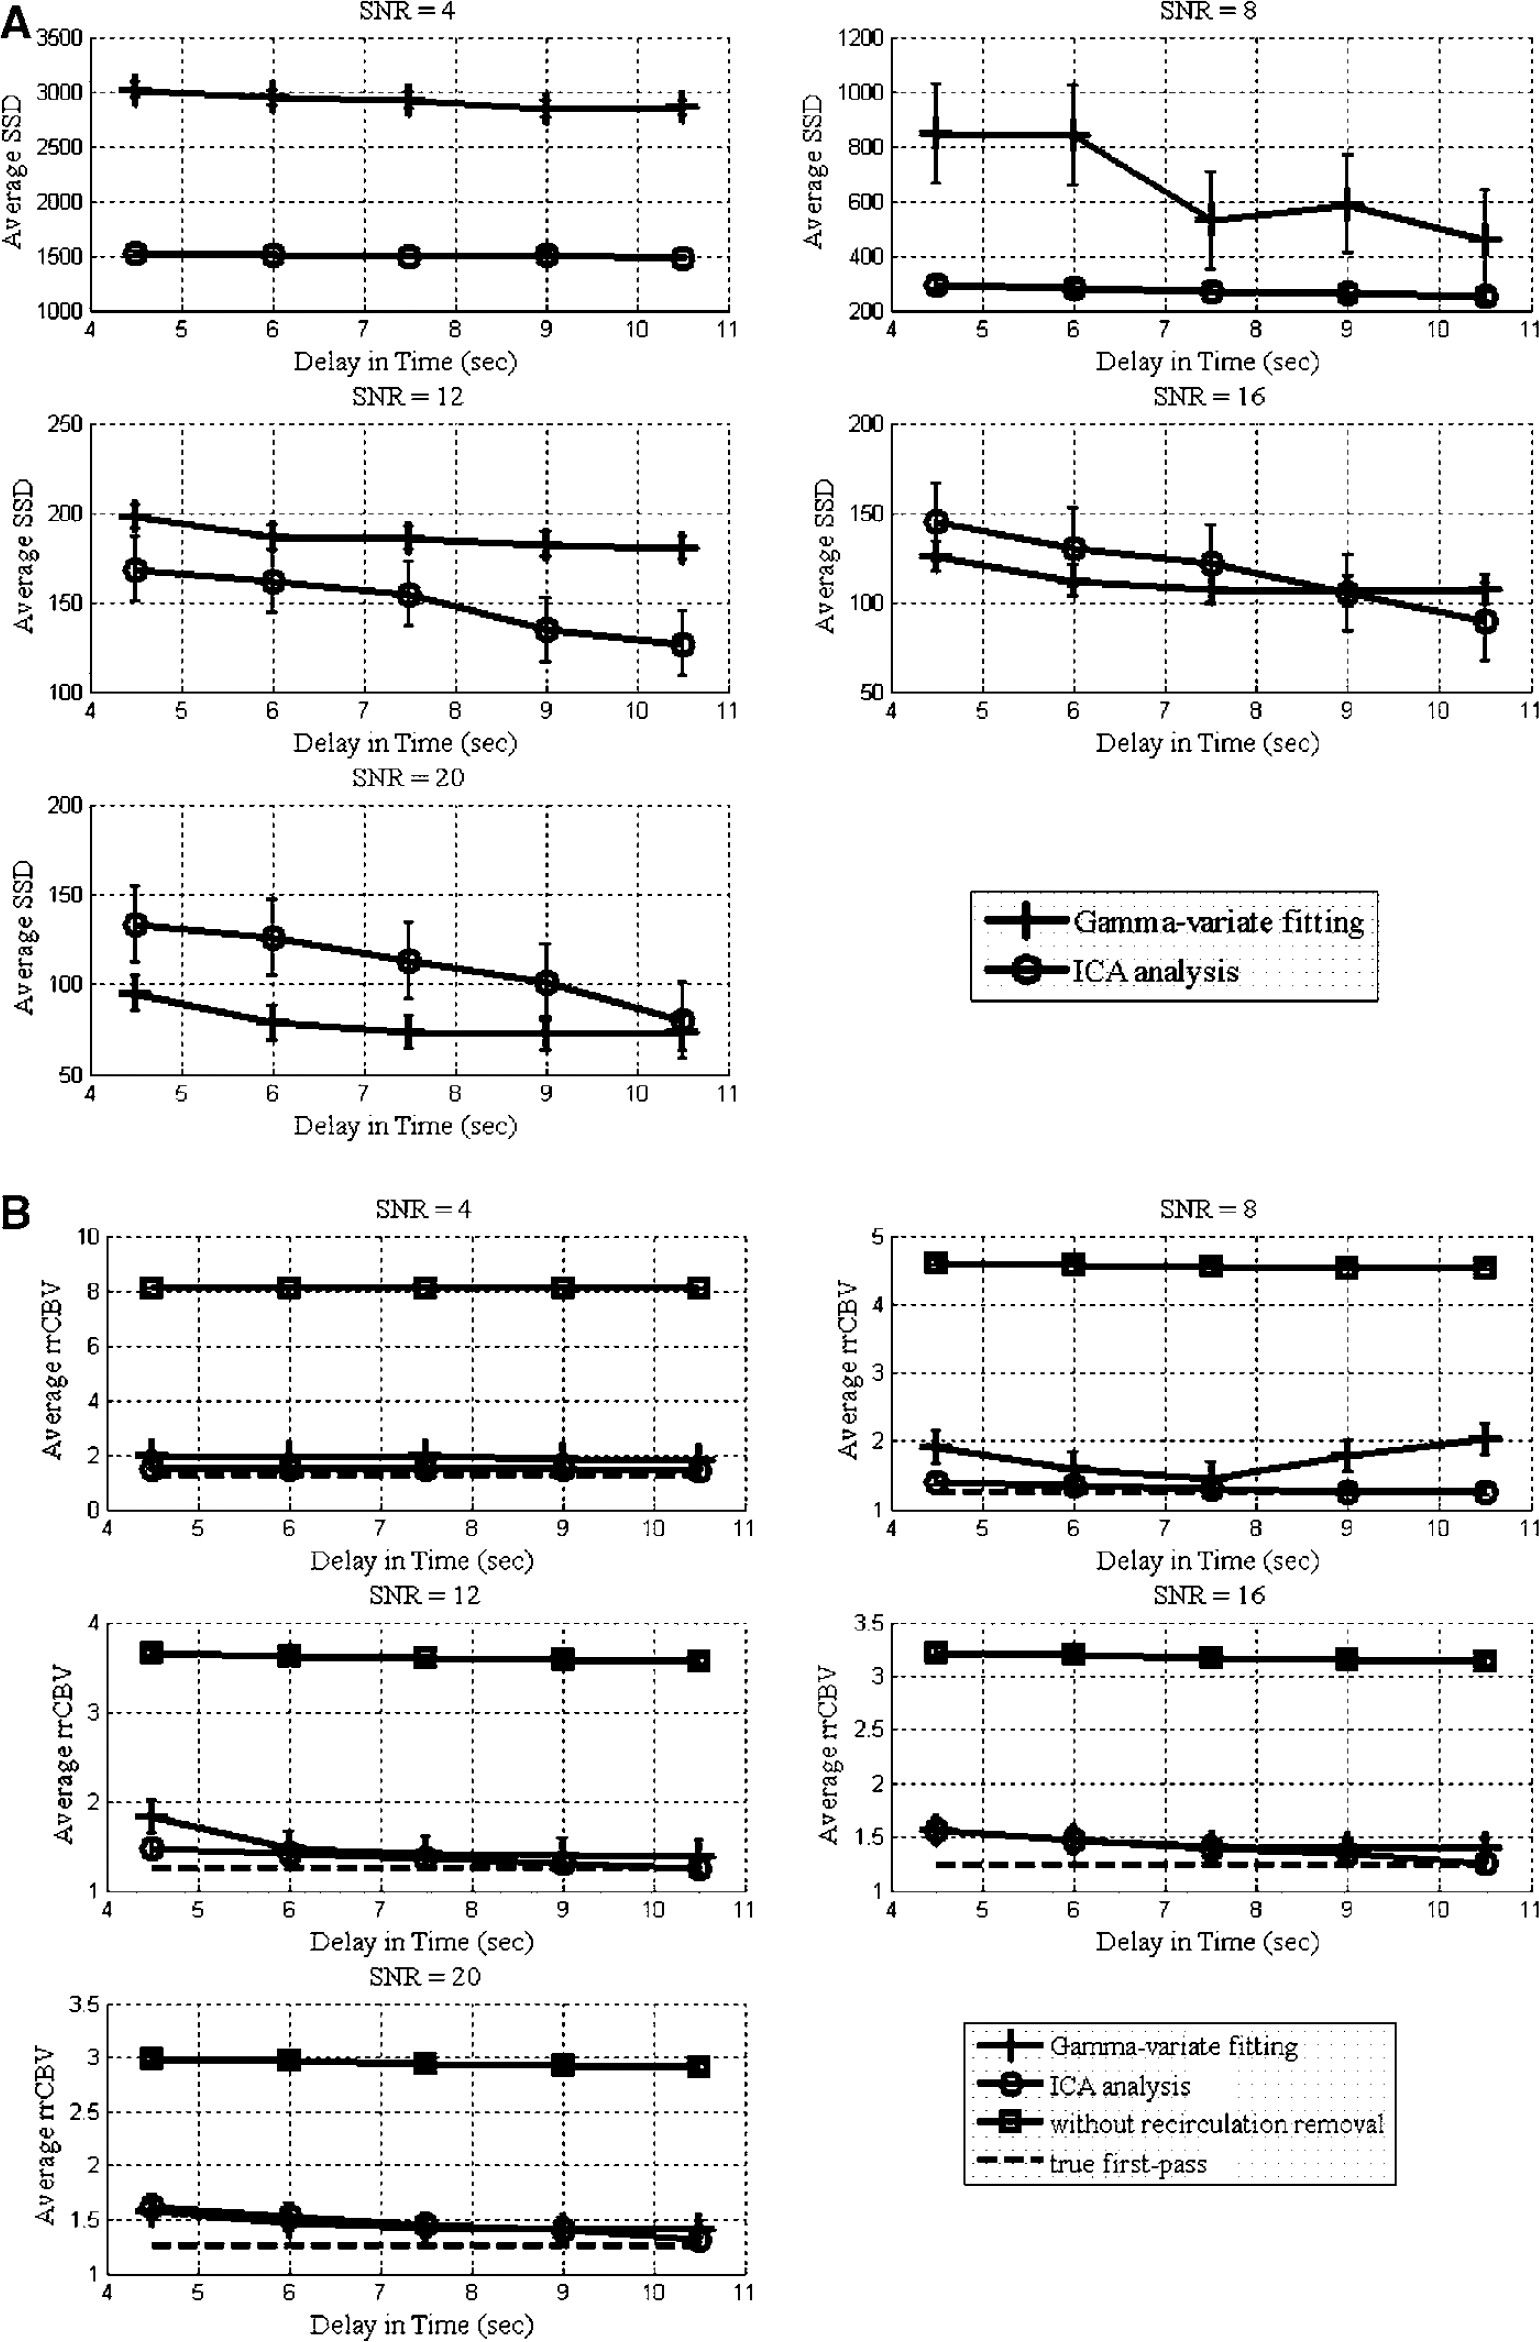
The average SSDs between the simulated first-pass and that obtained using the gamma-variate fitting or ICA analysis at different SNRs are shown in (
Normal Volunteer Study
In Figure 4A, a representative image from a normal volunteer is shown. The square indicates the 5 × 5 ROI used to illustrate the effectiveness of the proposed ICA approach. Five ICs are observed in Figure 4B where IC4 and IC5 (marked by the black arrows) are identified as the recirculation component (relative energy of 1.09%) and the noise component (relative energy of 0.33%), respectively. A direct comparison between the original concentration curve (dash-dotted line) and those obtained using gamma-variate fitting (solid line) or ICA (dashed line) is shown in Figure 4C.
An ICA analysis example for a 5 × 5 ROI chosen from a normal volunteer is shown. The anatomic image is shown in (
A direct comparison of the normalized rrCBV maps for all three volunteers is shown in Figure 5. Consistent with that observed in Figure 4, similar rrCBV values are obtained using gamma-variate fitting and ICA. In addition, as anticipated, rrCBV values obtained using unfitted concentration curves are almost always larger than those obtained after recirculation removal (using either gamma-variate fitting or ICA) by 30% across the whole brain (data not shown). These findings suggest that gamma-variate fitting and ICA are equally effective in minimizing the effects of recirculation for normal volunteers.
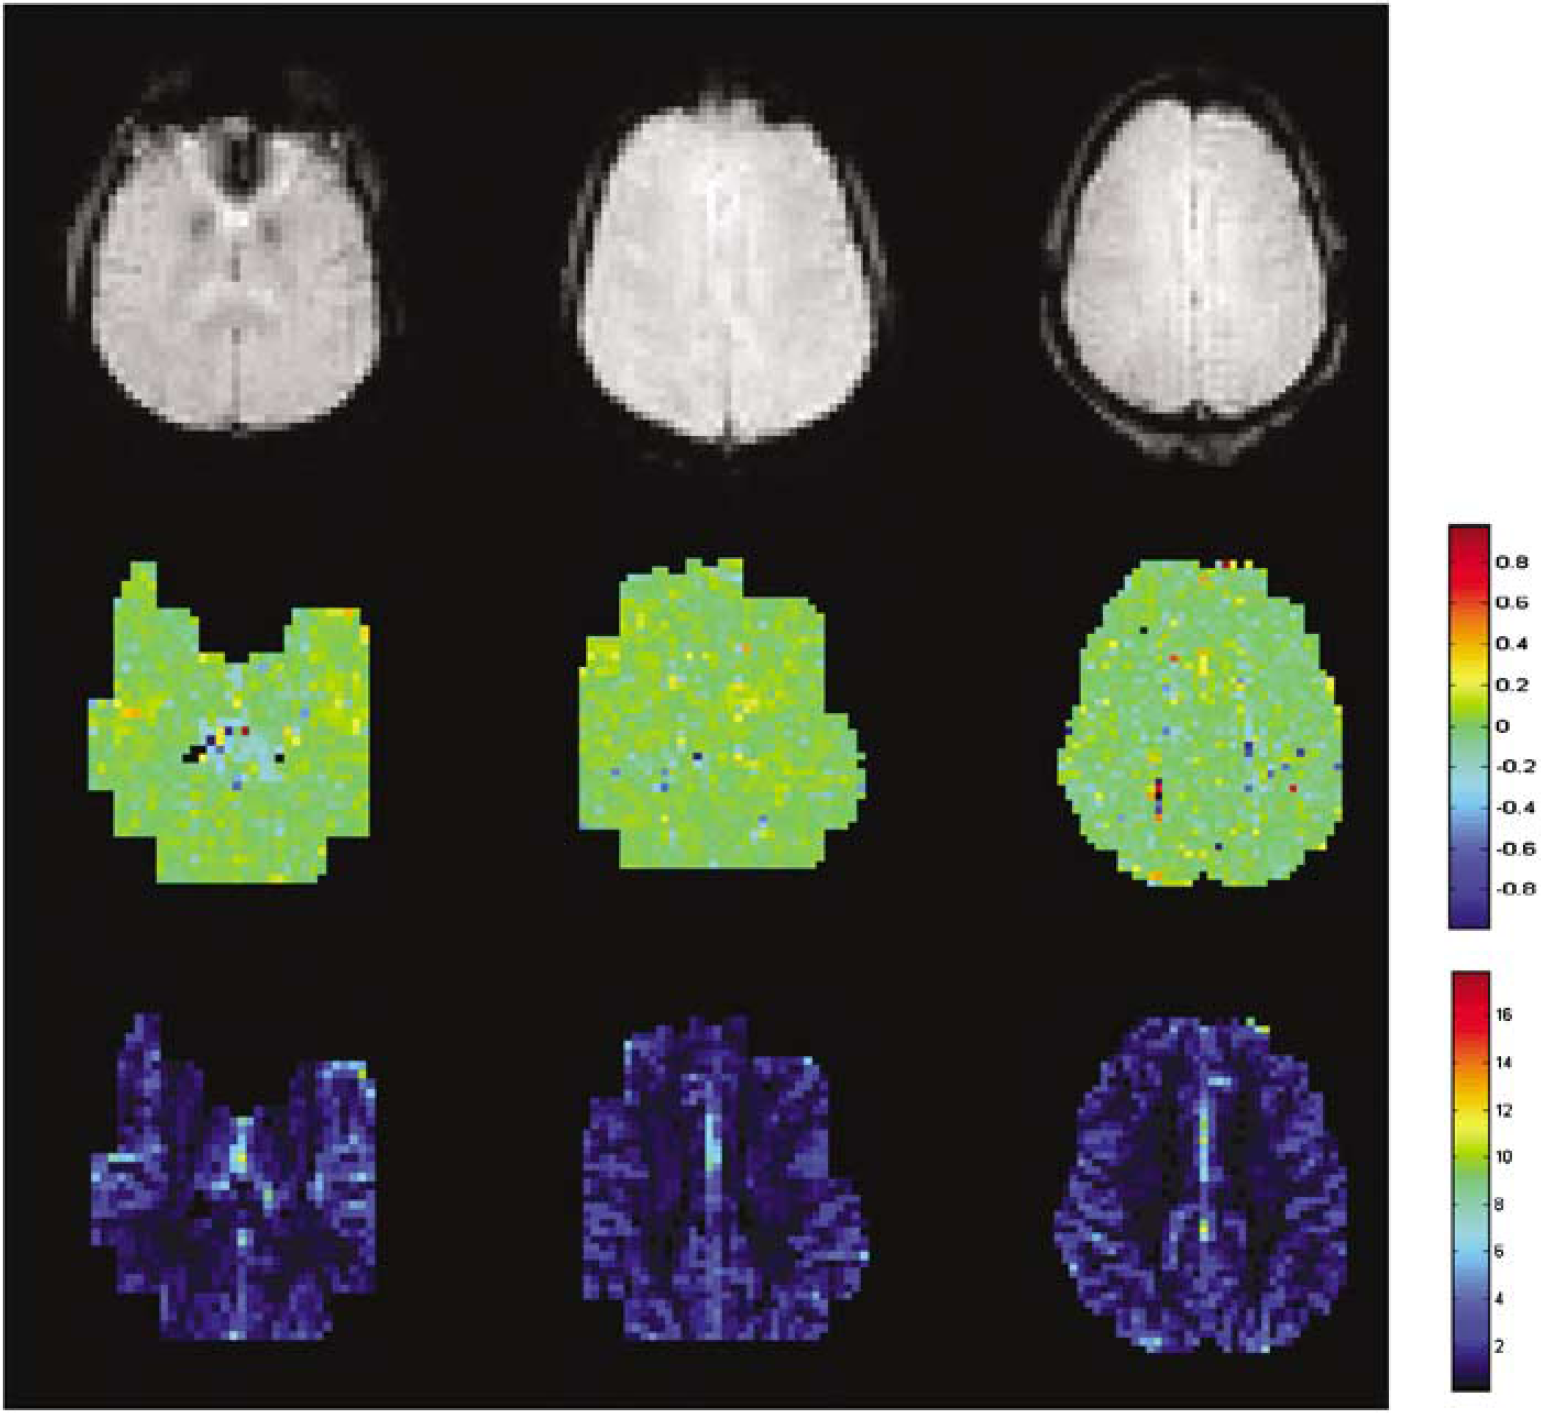
The upper row shows the anatomic images for all three volunteers. The middle row shows the associated normalized rrCBV maps obtained as the rrCBV differences between the gamma-variate fitting and the ICA approach and normalized to that obtained using the gamma-variate fitting. In addition, the rrCBV maps obtained using ICA analysis are also shown (bottom row).
Acute Stroke Patient Study
In Figure 6A, a representative T2-weighted image from an acute stroke patient is shown, delineating the presence and extent of an ischemic lesion. To illustrate the efficacy of the proposed ICA method in minimizing recirculation at different regions with respect to the ischemic lesion, three ROIs were chosen: one at the center of the ischemic core (black square), one at the peri-infarct area (white square), and the other in the contralateral hemisphere (white square). For the ROI in the contralateral hemisphere, five ICs are observed (Figure 6B) and IC5 (marked by the black arrow) is identified as the recirculation component (relative energy of 1.57%). For the ROI containing primarily the core, six ICs are observed (Figure 6C) and IC4 (marked by the black arrow) is identified as the recirculation component (relative energy of 9.33%). In contrast, for the peri-infarct region, five ICs are observed (Figure 6D) and IC4 (marked by the black arrow) is identified as the recirculation component (relative energy of 8.25%). A direct comparison of the unprocessed concentration time curves (dash-dotted line), gamma-variate fitting-processed (solid line), and ICA-processed (dashed line) to minimize recirculation effects for the three ROIs is shown in Figures 6E–6G, respectively. Consistent with the normal volunteer studies, similar results are obtained between the gamma-variate fitting and ICA approach in the contralateral hemisphere (Figure 6E), whereas the ICA approach is consistently more effective than the gamma-variate fitting in minimizing the contribution of recirculation in both the core (Figure 6F) and peri-infarct regions (Figure 6G).
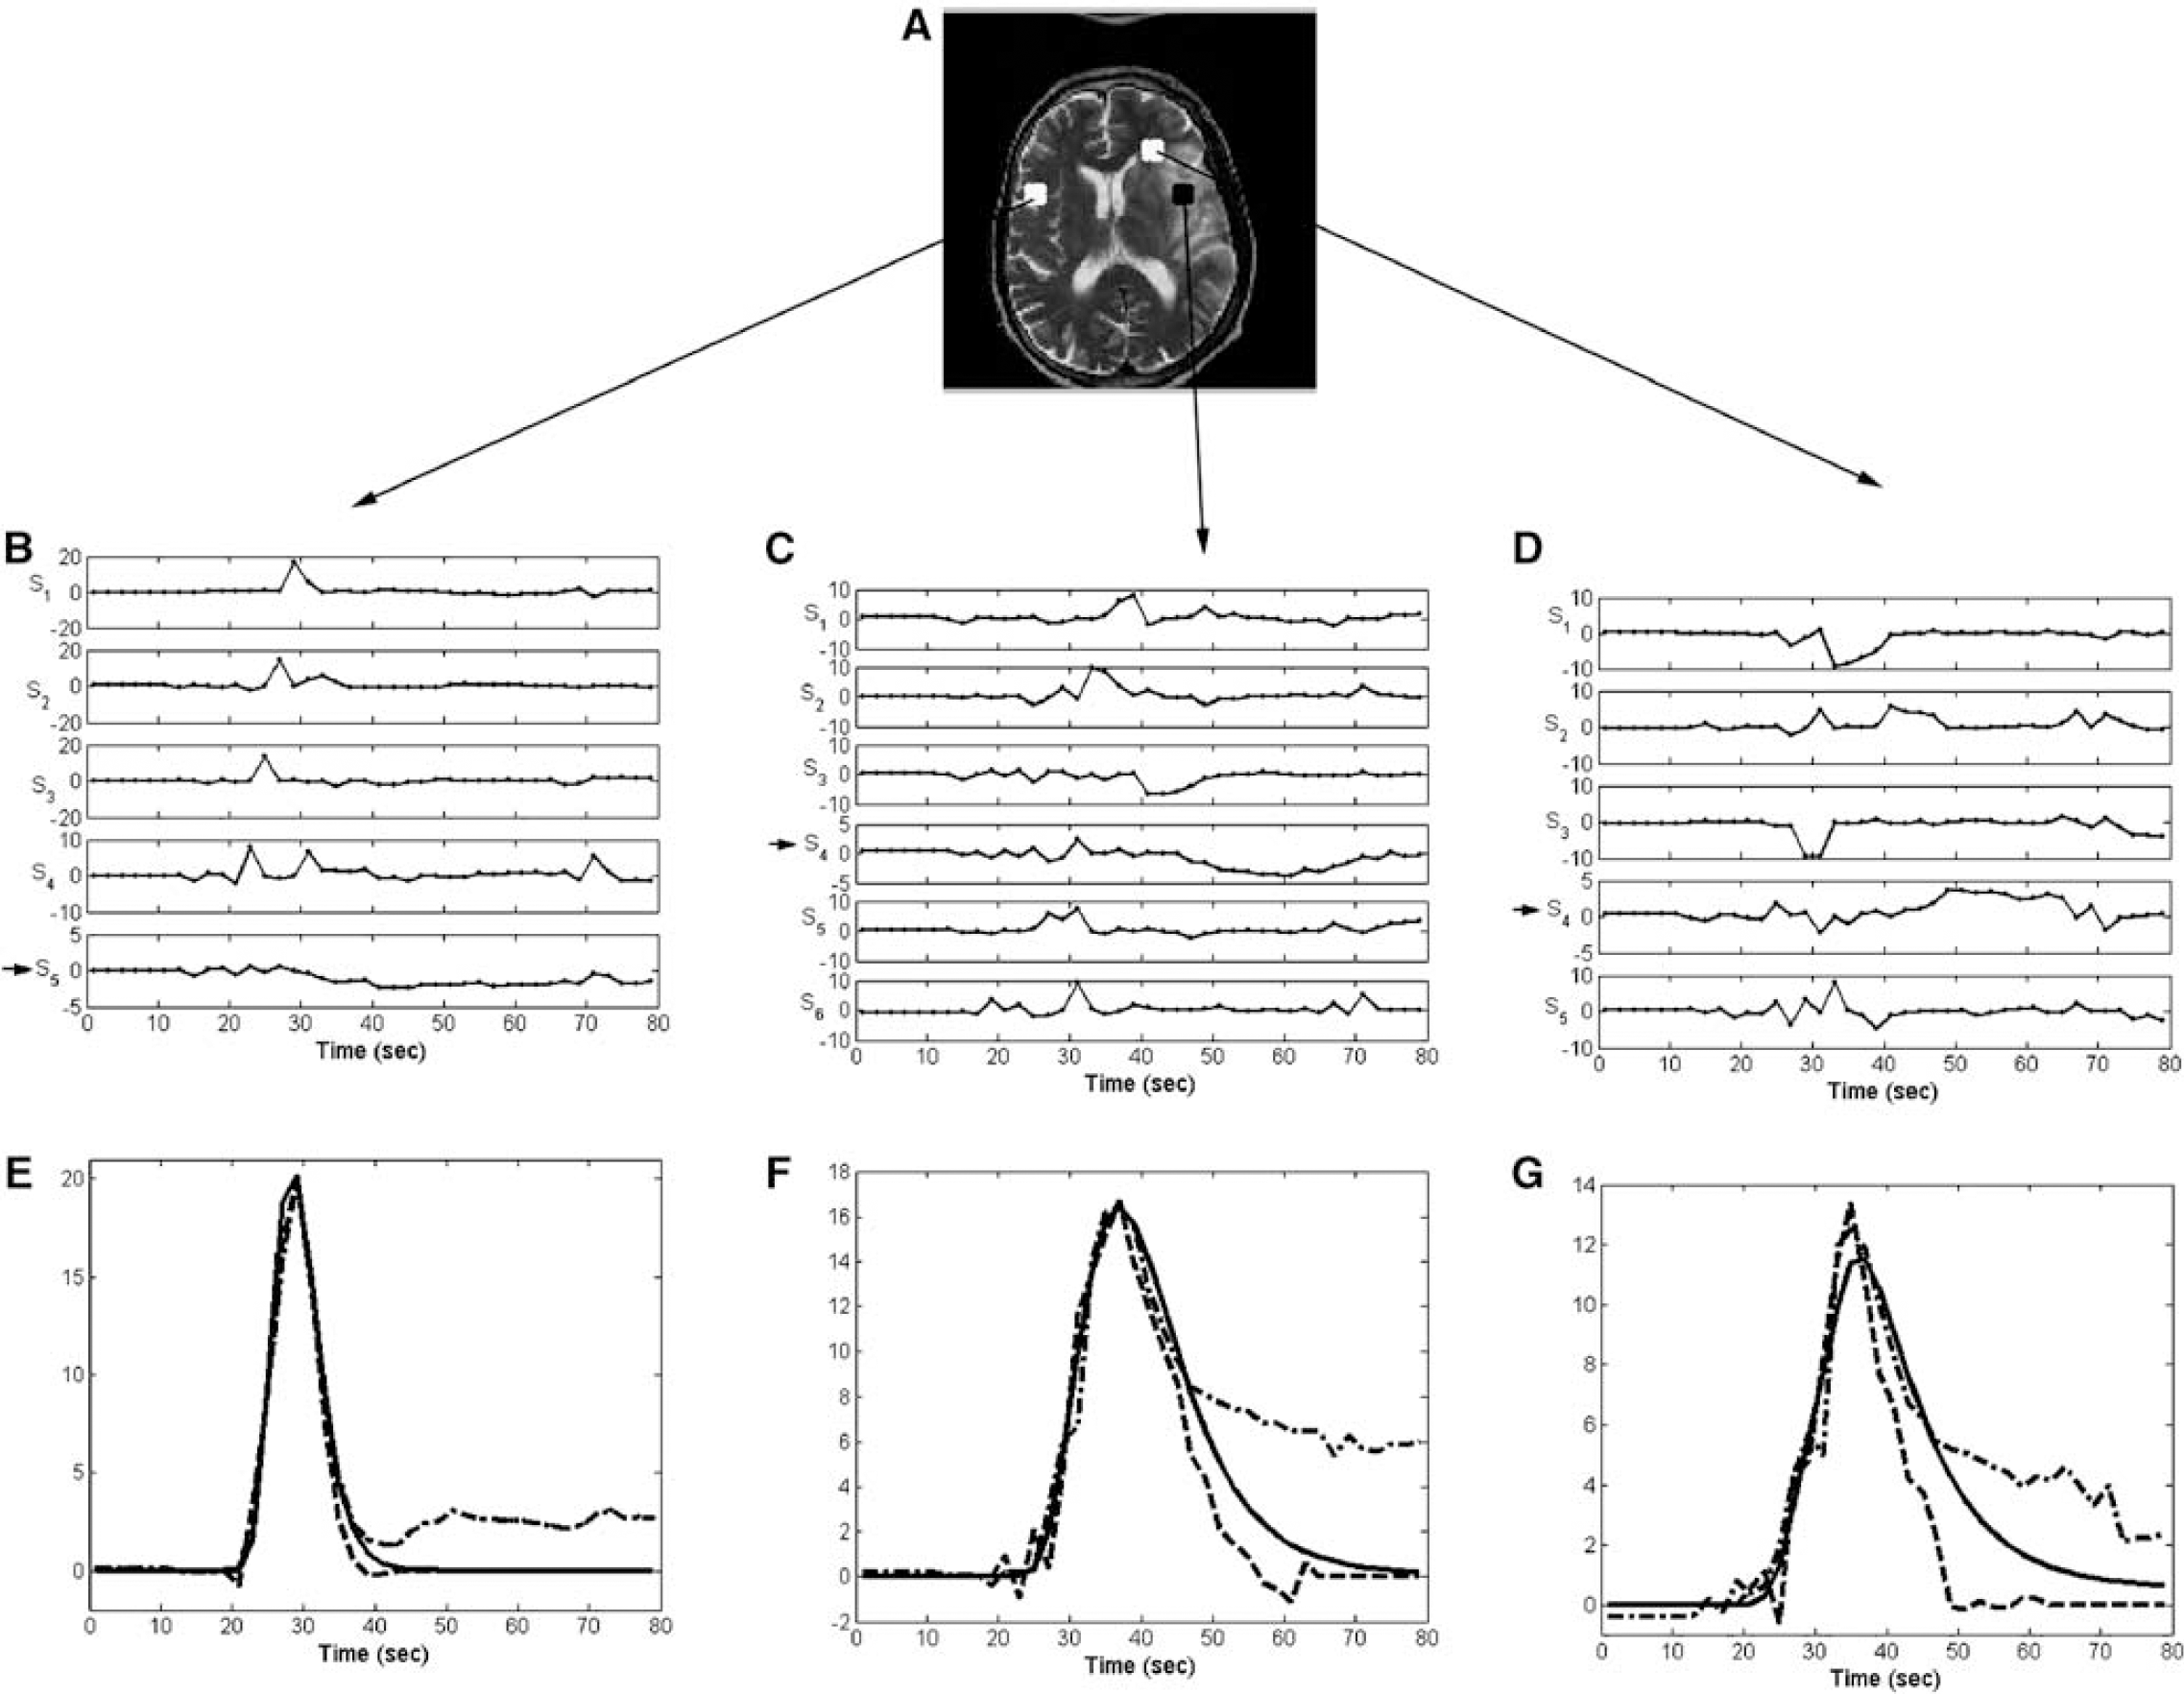
An ICA analysis example of an acute stroke patient is shown. A representative T2-weighted image obtained at the chronic phase depicts the extent of the final lesion (
Figure 7 shows the normalized rrCBV maps for all five acute stroke patients (left to right). For each patient, a follow-up T2-weighted image (top row), delineating the presence and extent of the final ischemic lesions, and the corresponding normalized rrCBV map are shown (middle row). A marked overestimation of rrCBV using the gamma-variate fitting is observed in regions of ischemic lesions (red areas). Interestingly, some regions exhibit a higher rrCBV using the ICA approach when compared with that obtained using the gamma-variate fits (blue areas). Also notable is that because of the differences coming from the alternative bolus dispersion pathways, the normalized rrCBV differences between gamma-variate and ICA in normal ROIs of stroke patients are greater than those in the normal subjects. In addition, similar to that observed in normal subjects, on average, the rrCBV values obtained using concentration curves without recirculation removal are larger than those obtained after recirculation removal using either gamma-variate fitting (data not shown) or ICA (bottom row) by 39% (data not shown).
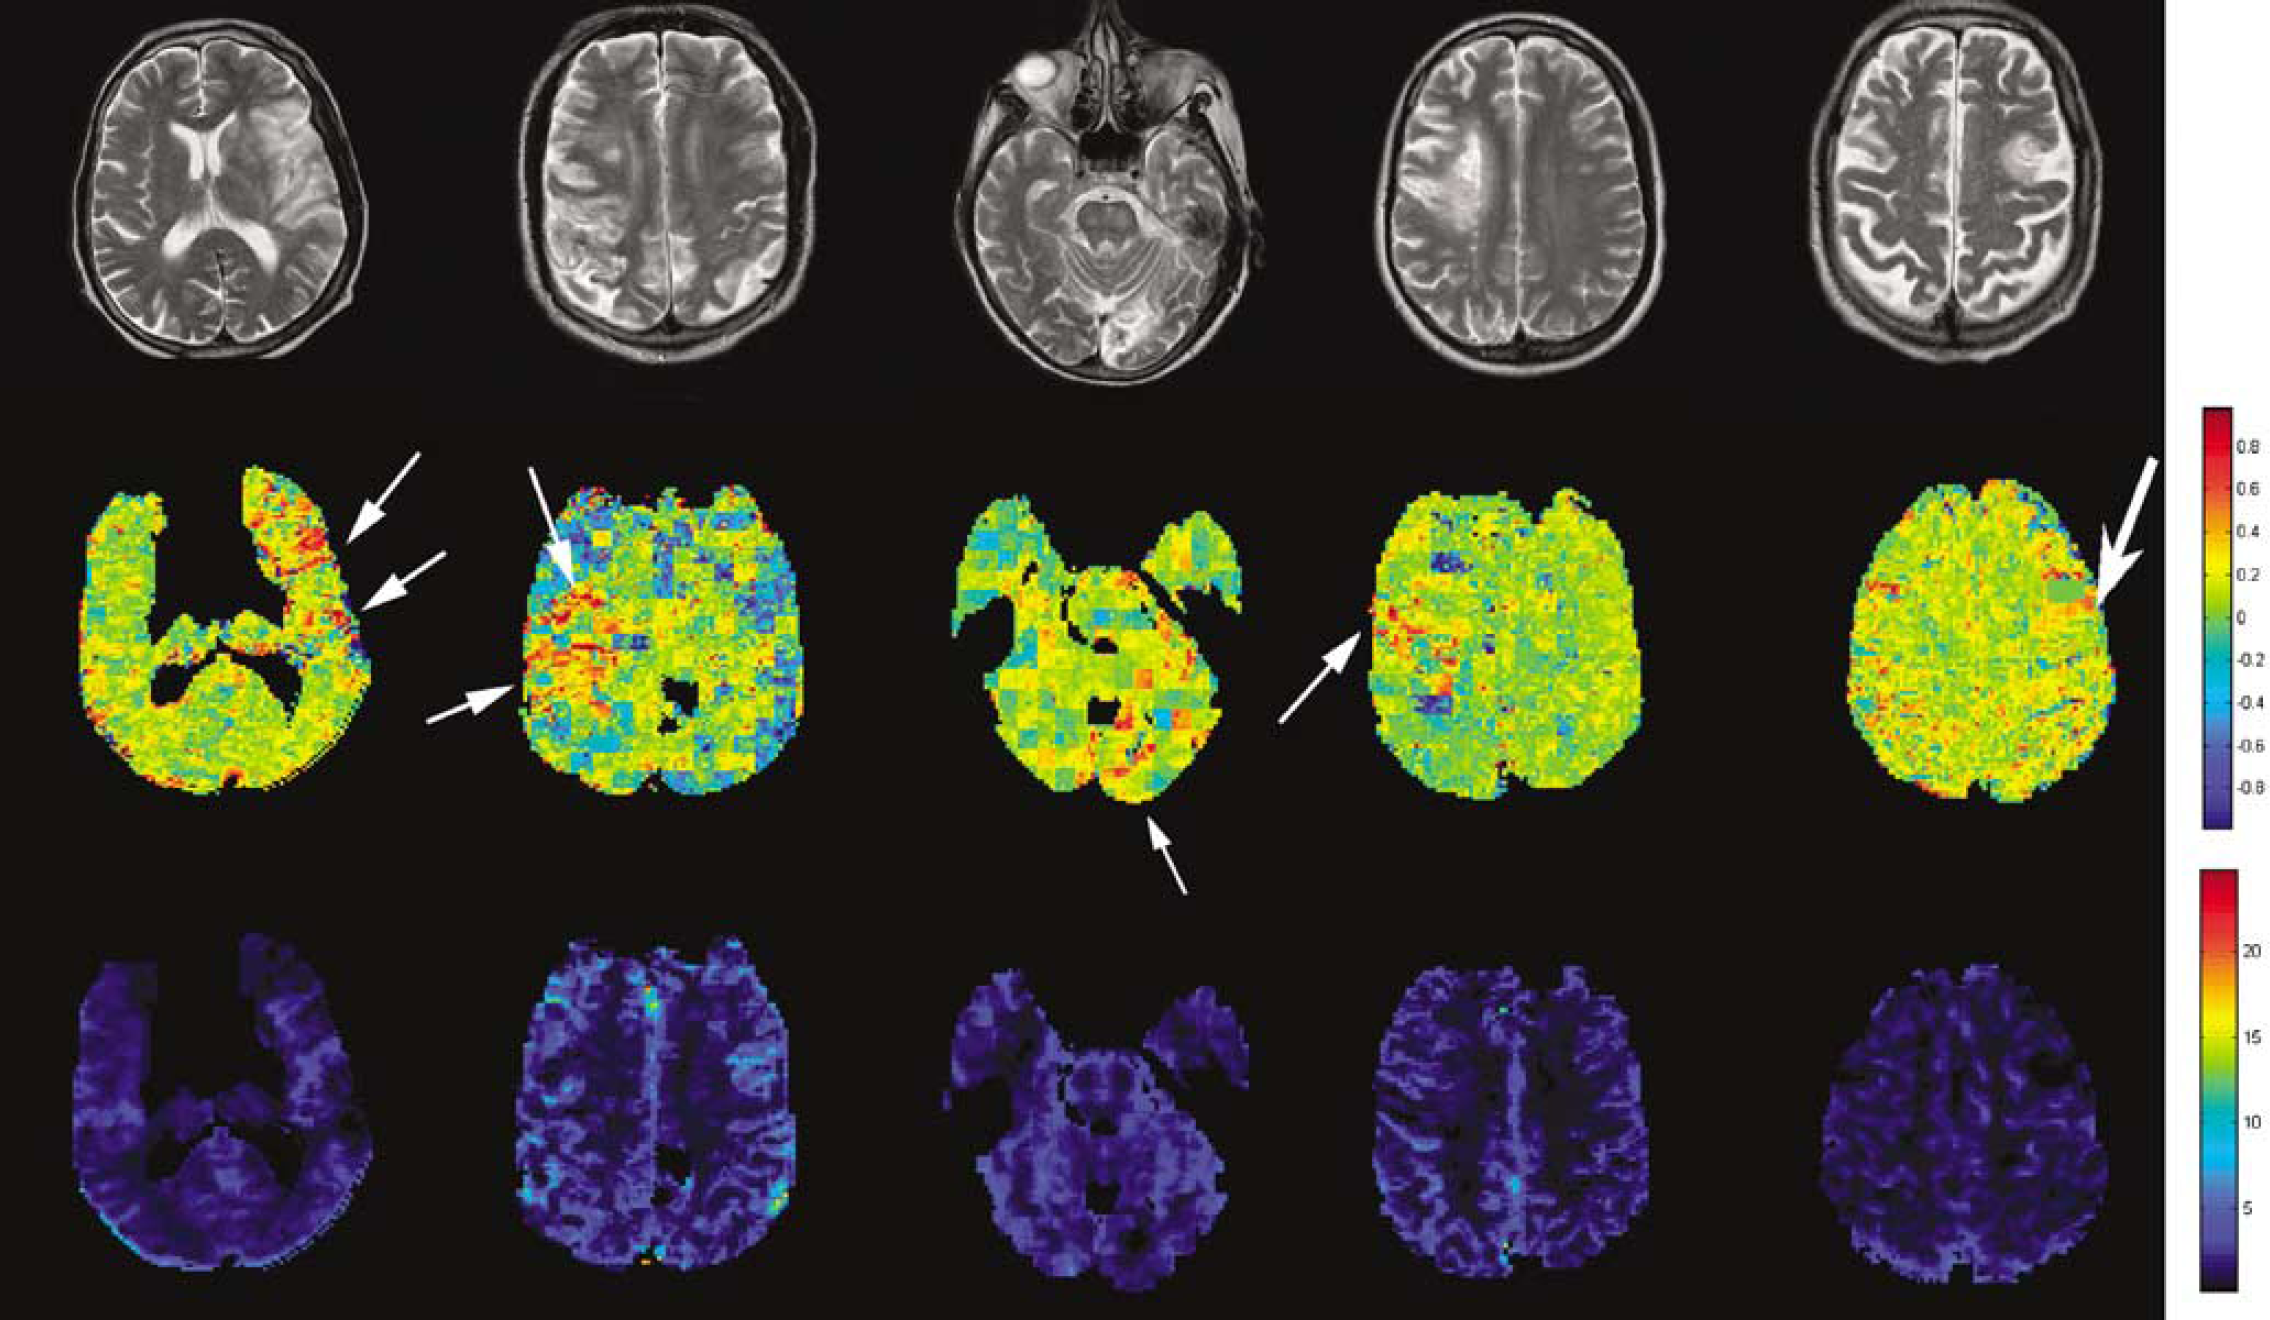
The rrCBV comparisons for all of the stroke patients (left to right) are shown. A representative T2-weighted image acquired at the chronic phase of each patient is shown (top row). The rrCBV differences between gamma-variate fitting and ICA were normalized by the gamma-variate fitted rrCBV (middle row). The rrCBV maps obtained using ICA analysis are also shown (bottom row).
Region of Interest Analysis
Results obtained from the ROI analysis are summarized in Figure 8 for both the normal volunteer and the acute stroke patient studies. For the normal subject study, the rrCBV values obtained using the gamma-variate fitting are comparable to those obtained using the ICA method. In contrast, for acute stroke patient study, even in the contralateral hemisphere, the normalized percent rrCBV difference between gamma-variate fits and ICA ranges from −0.54% to 14.1%, not to mention that in the final T2 lesion regions, it ranges from 16.1% up to 21.1%. Statistical analysis reveals that the averaged percent rrCBV differences (19%±2%) between the gamma-variate fitting and ICA methodology in T2 lesion tissue are significantly larger (P<0.005) than those obtained from the contralateral tissue (8%±5%).
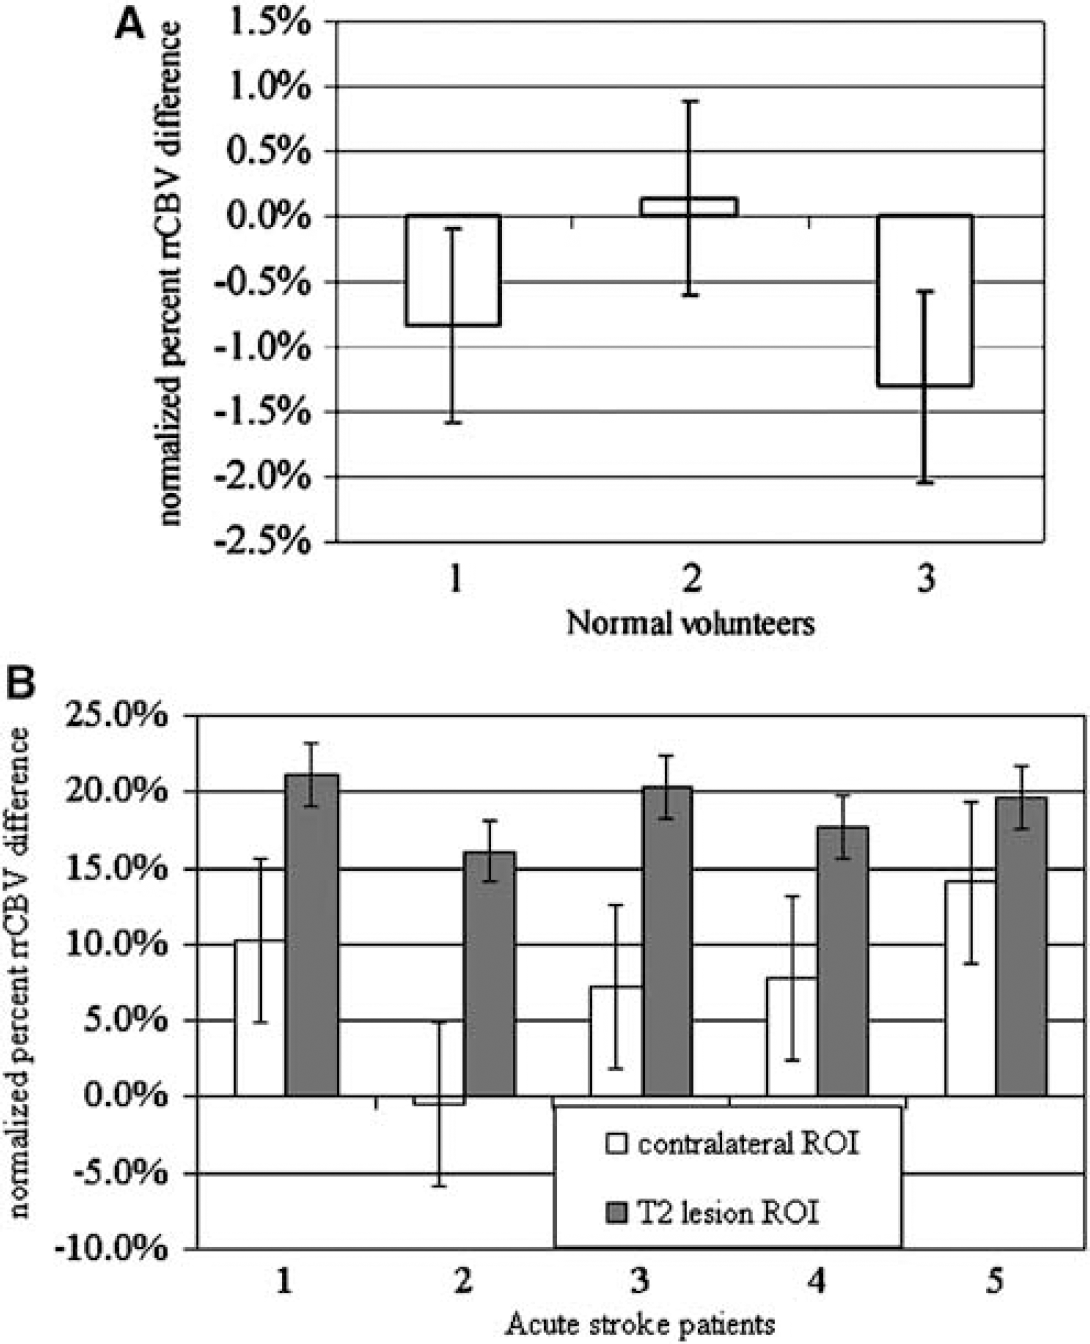
The rrCBV differences between the gamma-variate fitting and the proposed ICA and normalized to that obtained using the gamma-variate fitting for both normal volunteers (
Discussion
A new methodology to minimize recirculation effects for DSC perfusion-weighted imaging (PWI) is proposed. It entails the decomposition of concentration time courses into temporally and statistically independent sources, and the identification and subsequent minimization of the recirculation components. This methodology was tested on simulated concentration time curves, normal volunteers, and acute stroke patients with various degrees of ischemic abnormalities.
Temporal ICA assumes temporal and statistical independence among the components. Although it is possible to consider that the first-pass and recirculation concentration time courses are temporally shifted from one another and conceivably highly correlated, by and large, the paths through which the contrast agent reaches the brain can be different. From a physiologic point of view, one could consider that the main path through which the contrast agent reaches the brain during the first-pass is from the injection site, the heart, and the carotid/vertebral arteries. In contrast, the sources/paths during recirculation are far more complicated. They include, from a very simplistic view, the originally observed contrast agent during the first-pass but traveling through the intracranial venous system, back to the heart and then again reaching the brain as well as the contrast agent, which was not observed during the first-pass because it initially traveled through the peripheral circulation. Therefore, first-pass and recirculation are not very likely to be highly dependent.
Using the Spearman rank coefficient test and the composite concentration curves with a varying degree of overlap, a rather small Spearman rank coefficient was obtained, independent of the degrees of overlaps between the first-pass and recirculation. This finding suggests that the first-pass and recirculation are weakly dependent. In addition, both the first-pass and recirculation have positive kurtosis, indicating they are super-Gaussian. Together, these findings indicate that the ICA with the standard Infomax algorithm should be appropriate to discern the first-pass from recirculation. These findings are further augmented by the simulation results. Realistic synthetic concentration curves with various degrees of overlaps between the first-pass and recirculation were simulated at various SNRs. At the same SNR, when the first-pass and the recirculation are well separated, both the gamma-variate fitting and ICA methods successfully minimize recirculation effects. In contrast, as the overlap between the first-pass and recirculation increases, the gamma-variate fitting approach fails to minimize the effects of recirculation (Figures 2 and 3). This finding is not surprising because the success of gamma-variate fitting greatly hinges on the temporal separation between the first-pass and recirculation. As a result, when a substantial overlap between the first-pass and recirculation is present, ICA outperforms the gamma-variate fitting method. These simulation results suggest that the proposed ICA technique is capable of minimizing recirculation even with a broadened curve, underscoring the potential significance and impacts for future clinical studies such as cerebral ischemia.
Consistent with the simulation results, both gamma-variate fitting and ICA perform quite well in minimizing the effects of recirculation in normal volunteers as well as the putative normal brain regions of acute stroke patients. However, in regions of ischemic lesions, a substantially higher rrCBV is observed using the gamma-variate fitting approach when compared with that obtained using ICA. This finding is likely to be explained by the inability of the gamma-variate fitting approach to minimize effects of recirculation when the concentration curves are broadened. The use of the proposed ICA method should therefore improve, in principle, the quantification of cerebral hemodynamics such as CBV, cerebral blood flow, and mean transit time especially in case of ischemic stroke. The investigation of how recirculation will affect the estimates of cerebral blood flow is beyond the scope of this study. Nevertheless, this direction is currently under extensive investigation in our Lab.
While the proposed ICA approach is highly effective in minimizing effects of recirculation, it should be noted that the reconstructed concentration time courses after removing the recirculation and noise components are slightly different from the simulated first passages (Figure 2C). Several potential factors could account for the observed discrepancies, including the choice of the number of ICs, the size of ROI for ICA analysis, and the criteria for identifying recirculation components. We will separately discuss these potential factors below. First, with the BIC model selection, it suggests that an optimal number of ICs between five and seven can account for most of the temporal MR signal variation. Therefore, in this study, the number of ICs was predefined to be within five to seven components. One of the potential pitfalls associated with this predefined number of ICs is that if the number of ICs is too large, ICA analysis can split the same information into several temporal components. As a result, it may lead to suboptimal temporal decomposition of the concentration time curves. In addition, when using a large number of components, it will become more difficult to interpret each IC in terms of its underlying physiologic origin(s). Although choosing five to seven components appears to be robust in minimizing the recirculation effects in the current study, contributions coming from the first-pass and the recirculation may not be fully separated in some cases. Some contributions of the first-pass may also be removed, and/or the recirculation effects may not be completely removed (blue regions in the middle row of Figure 7). Nevertheless, in contrast to the large errors observed with gamma-variate fitting for broadened curves, the minor ICA imperfection should not greatly affect the estimation of cerebral hemodynamics.
Second, temporal ICA was applied for each 5 × 5 ROI throughout the brain parenchyma. Such choice of the ROI size represents a balance between SNR and ICA performance. With a smaller ROI size, SNR may not be acceptable to depict components statistically different from noise. However, if the spatial coverage of the ROI is large, many ICs may result, making it difficult to discern first-pass and recirculation components and leading to inaccurate estimation of cerebral hemodynamics. Furthermore, especially in the acute stroke patient study, a large ROI may encompass both normal and diseased tissues. Therefore, an ROI of 5 × 5 was chosen in our study to provide an acceptable SNR while minimizing partial volume effects especially for acute stroke patient studies. Nevertheless, this choice of the size of ROI could also contribute to the observed discrepancies between the putative and the ICA estimated first-pass. The evaluation of an optimal choice the ROI size is, unfortunately, beyond the scope of our current studies.
Third, a set of criteria was established to identify recirculation components, including the requirement that the component has a relative energy lower than 20% of the total, a late arrival time, and the largest FWHM, which also needs to be greater than 10.5 secs for normal subjects and 14 secs for acute stroke patients. Although these criteria may not be the most optimal set of parameters to identify recirculation components, and hence may contribute to the observed discrepancies between the estimated and putative first-pass, both simulation and normal volunteer studies have shown that these criteria are highly effective in minimizing recirculation while preserving the general shape of the first-pass. More importantly, despite extensive overlap between first-pass and recirculation using the simulated concentration curves, the SSDs remain small using the proposed ICA. This finding has major ramifications for acute stroke studies where a substantial overlap between the first-pass and recirculation is commonly observed, particularly in regions of ischemia. As shown in Figures 6F and 6G, the proposed ICA approach outperforms the commonly used gamma-variate fitting approach within the core as well as peri-infarct regions. One may, nevertheless, question the choice of the late arrival time as one of the criteria for identifying recirculation components in stroke patients, as even the first-pass will be delayed because of the compromised cerebral hemodynamics. This ambiguity should, however, not affect our ability to determine the components arising from recirculation. This is because the comparison of the arrival time is made for each 5 × 5 ROI separately. When the ROI is located within or close to the lesion, all of the components will be delayed; the first-pass component should, however, remain the first to arrive in the ROI and thus the criteria should remain effective. One potential problem is in regions that have no or very low flow, leading to minimal MR signal changes. In this circumstance, ICA may not be able to identify any statistically significant sources. This is, however, a common problem associated with the DSC approach, and the proposed approach is unlikely to overcome this difficulty.
Finally, it may be possible to further improve the proposed ICA method. For example, constraint PCA, probabilistic PCA, expectation maximization (EM)-ICA, or independent factor analysis may also be used for blind source separation. Although the probability PCA model uses a more sophisticated noise model compared with the standard PCA, it still assumes Gaussian source distributions. Whereas ICA searches for independent projections of the data, in EM-ICA (Welling and Weber, 2001), both the demixing matrix and source distributions are also estimated. In addition, independent factor analysis (Attias, 1999) is an extension of EM-ICA where more general Gaussian noise is modeled. Although the methodology proposed herein may not be the only alternative, its direct comparison with other methods strays us away from our goal of providing a more viable alternative to a well-accepted solution, and is hence beyond the scope of this study.
In conclusion, a temporal ICA approach to minimize the recirculation effects in DSC perfusion was described and compared with one of the most commonly used approaches, gamma-variate fitting. Although a comparison of the ICA approach and gamma-variate fitting suggests that they are equally effective in normal subject study, ICA is superior to gamma-variate fitting in minimizing recirculation and in preserving the characteristics of the first-pass of contrast agent in both simulated and acute stroke patient studies when the concentration time courses are broadened. This finding indicates that the effects of recirculation can be minimized by the ICA approach even in the presence of a substantial overlap between the first-pass and recirculation. Therefore, the proposed approach may lead to a more accurate estimation of CBV, cerebral blood flow, and mean transit time in patients with cerebrovascular diseases.
Footnotes
Acknowledgements
We thank Dr Katie D Vo and Dr Jin-Moo Lee from Washington University at St Louis for providing the stroke patient data.