
Abstract
Accumulating experimental and clinical data suggest that albumin may be neuroprotective for stroke. Here, we use functional magnetic resonance imaging (fMRI) to evaluate the therapeutic efficacy of albumin and its effects on the recovery of stimuli-induced cerebral hemodynamics. For this purpose, fMRI activity in the ipsilesional somatosensory (SS) cortex was assessed using a well established rat model of transient 90 min focal ischemia and electrical forelimb stimulation. Rats were treated with either saline or albumin via intracerebroventricular injections at 12 h poststroke onset. Despite this delayed treatment time, when compared to the saline-treated rats (n = 7), there were significant enhancements of the fMRI activation in the albumin-treated rats (n = 6) for both blood oxygenation level dependence (BOLD) and functional cerebral blood volume (fCBV) responses. Interestingly, the temporal characteristics of the ipsilesional SS BOLD responses in the albumin-treated rats appeared considerably altered compared to those of contralesional responses while such temporal alterations were not pronounced for the fCBV responses. These characteristic fMRI temporal profiles of the albumin-treated brains may be due to altered neuronal responses rather than altered integrity of neurovascular coupling, which implies an unusually fast habituation of neuronal responses in the lesional SS cortex. The correlation between various MRI-derived structural parameters and the fMRI response magnitude was also characteristic for albumin and control groups. Taken together, these data suggest that restoration of fMRI response magnitudes, temporal profiles, and correlations with structure may reveal the extent and specific traits of albumin treatment associated stroke recovery.
Introduction
Pharmacological intervention of ischemic damage is critically important for controlling neuronal deterioration. However, the use of clinically available antiischemic agents for treating poststroke brains has been largely limited due to the narrow treatment time window and the abnormal physiological states of ischemic tissue. Among previously proposed treatment regimens, intravenous administration of albumin has been reported to ameliorate neuronal damage during the acute phase of stroke (Belayev et al, 1998, 1999a, b, 2001). Similar to other agents such as basic fibroblast growth factor (bFGF) (Kawamata et al, 1997), albumin treatment has been proposed to preserve the blood–brain barrier and contribute to stroke recovery via neuroprotective properties. In particular, albumin has been clearly shown to improve microvascular hemodynamics and to exert proendothelial effects (Belayev et al, 2002). In this study, we test whether delayed-albumin treatment improves the overall outcome of recovering ischemic brains using functional magnetic resonance imaging (fMRI) to characterize the treatment efficacy.
Previously, we reported that two fMRI reporters, blood oxygenation level dependent (BOLD) and cerebral blood volume weighted (CBVw) signal changes, are differently affected during the recovery phase of stroke (Kim et al, 2005). Using transient focal ischemic rat models (∼2 h) and electrical forelimb stimulations, we have shown that, 2 weeks after the stroke induction, the BOLD and CBVw percent signal changes were significantly reduced in the ipsilesional somatosensory (SS) cortex. In particular, when normalized to the activation in the contralesional hemisphere, BOLD percent signal change in the ipsilesional SS cortex was significantly lower than the percent signal change acquired using the CBVw technique. The basis for such a mismatch is not yet unambiguously determined; however, it is likely that the restoration of specific fMRI activation characteristics is closely related to the recovery processes and could provide a wide range of information for medicinal evaluations.
The goal of this study was to understand the effects of intracerebroventricularly administered albumin on fMRI responses using transient focal ischemic rat models, 2 weeks after the 90 mins occlusion of the middle cerebral artery (MCAO). Specifically, we examined the therapeutic efficacy of bovine serum albumin (BSA), using intracerebroventricular (i.c.v.) administration, to directly access brain tissue (bypassing the blood–brain barrier) and to allow access to the contralesional hemisphere, which may also aid in the stroke recovery processes (Jones and Schallert, 1992, 1994). In particular, both BOLD and functional changes in cerebral blood volume (fCBV) fMRI techniques were used to investigate the effects of the highly delayed (∼ 12 h) administration of albumin on the stroke-altered hemodynamic parameters. The delay was designed for investigating an elongated treatment time window that is clinically relevant. We then modeled the observed temporal profiles of BOLD and the relatively normal fCBV fMRI responses in the responsive SS cortex of the albumin-treated rats as the convolution of an fMRI impulse response function (IRF) and a time-dependent neural function. Additionally, various MRI-derived structural parameters were acquired from the SS region in ischemic hemispheres to elucidate if structural correlations could be established with the quantified fMRI results. We hypothesized that the fMRI response in the sensorimotor cortex near the ischemic core would reveal the extent of neurovascular functionality as well as the specific recovery characteristics that could be used to assess overall ischemic damages.
Materials and methods
Experimental protocols were institutionally approved in accordance with the National Institutes of Health Guide for the Care and Use of Laboratory Animals. The animals had free access to standard laboratory chow and water throughout the experiments. Thirteen male Sprague-Dawley rats (Charles River, MA, USA), weighing 275 to 325 g, were kept under diurnal lighting condition. Before surgery, the animals were assigned to either treatment with saline (n = 7) or albumin (n = 6) by randomization. All i.c.v. injections, behavioral testing, and subsequent MRI signal analyses were performed by an investigator masked to the treatment assignment of each animal.
Animal Surgery and Treatment
Temporary stroke was induced by 90 mins occlusion of the right middle cerebral artery (MCAO) by advancing an intraluminal filament up into the internal carotid artery. Detailed surgery procedures were as described previously (Dijkhuizen et al, 2003). At 12 h after the focal cerebral ischemia, these rats received a single i.c.v. injection of BSA solution alone (1 μg/10 μl/rat), or the same volume of normal saline (0.9% NaCl 10 μl). Every day rats were weighed, and if they were losing more than 20% of the initial weight, received injections of 2.5 ml 0.9% NaCl solution and 2.5 ml 10% Dextrose solution subcutaneously. The injection was continued daily until they gained weight. At 2 weeks after the temporary MCAO in right hemispheres of rats, fMRI was performed.
Before MRI acquisition, both left and right femoral veins (for infusion of anesthetics and contrast agent administration, respectively) and right femoral artery (for blood pressure monitoring and blood gas analysis) were catheterized. Thereafter, animals were tracheotomized and mechanically ventilated with 1.5% halothane in O2/air (1:1). Body temperature was measured with a rectal probe. Thin copper wires were subcutaneously inserted into both forepaws at the level of the wrists for electrical stimulation. A constant current generator was used, and the threshold current for stimulation was determined by detecting the onset of muscle contraction. To ensure supramaximal stimulation, the applied current during fMRI was approximately 0.1 mA higher than the threshold current, which ranged from 1.0 to 1.2 mA. The stimulus duration and frequency were 0.3 ms and 3 Hz, respectively. Prior to the MRI experiment, the anesthetic regimen was switched from the halothane gas mixture used for surgery to continuous infusion of α-chloralose (30 mg/kg/h), preceded by a loading bolus (∼ 20 mg/kg). Concurrently with α-chloralose administration, rats were paralyzed with an intravenous bolus of pancuronium (1 mg/kg), which was followed by continuous infusion (∼1.25 mg/kg/h) of pancuronium. Body temperature, blood oxygen saturation level, heart rate, blood gas, and blood pressure were monitored and carefully maintained within normal ranges throughout the experiment. A sufficient time (1 to 2 h) was allowed for the anesthetic transition before fMRI measurements.
Moreover, to show whether i.c.v. injections of either saline or albumin affect the baseline states, healthy rats (i.e., without stroke) administered with the saline (n = 3) and albumin (n = 4) doses described above were subjected to fMRI experiments 2 weeks after the administration. Additionally, fMRI activities of healthy normal rats (i.e., without injection and without stroke: n = 5) were acquired and compared with those of healthy rat groups with the i.c.v. injections.
Magnetic Resonance Imaging Acquisition
Functional magnetic resonance imaging activations with BOLD and fCBV techniques were measured sequentially. Functional images (Gradient Echo Planar Imaging, TR/TE = 3700/15 ms for BOLD, TR/TE = 3700/11 ms for CBV, FOV = 2.5 × 2.5 cm2; nine contiguous 1 mm slices, and 80 × 80 matrix zero filled to 128 × 128) were acquired on a horizontal bore 9.4T Bruker/Magnex system, equipped with a home-built rat head surface RF transmit and receive coil with an approximate diameter of 3 cm. An unilateral electrical stimulation paradigm, consisting of three periods of 37 secs ‘stimulation on’ separated by 185 secs ‘stimulation off,’ was alternated between the left and right forepaw, and this paradigm was repeated three to five times each for BOLD and fCBV images. Following BOLD fMRI, the blood pool T2 contrast agent (MION) was intravenously administered (36 mg/kg), and the above stimulation paradigm was repeated.
Before the contrast agent administration, T2* and T2 maps were created using multiple echoes for conventional gradient echo (TR/TE = 1000/4, 7, 10, and 13 ms) and spin echo (TR/TE = 3000/15, 30, 45, 60, 75, and 90 ms) pulse sequences. Lesion volumes were calculated from the multislice T2 data sets with the use of image analysis software AFNI (Cox and Hyde, 1997). T2 lesion volume was defined as the ipsilateral parenchymal volume with T2 values that differ by + 2 standard deviations (s.d.) from the mean T2 values of the contralateral tissue. Cortical and subcortical lesion volumes were independently calculated and correlated with the acquired functional measurements. For further structural analysis, apparent diffusion coefficient (ADC) maps were created with a diffusion weighted echo planar image (EPI) pulse sequence with TR/TE = 3700/40 ms and b = 5, 300, 800, and 1200secs/mm2. To obtain fractional anisotropy (FA), diffusion tensor imaging was performed with the acquisition of a reference image (b = 0) and six gradient directions, each of which used a total b = 1200 secs/mm2. Twice-refocused spin echo EPI (TR/TE = 10,000/40 ms) was used to reduce eddy-current-induced distortion (Reese et al, 2003).
After intravenous MION administration, T2 and T2* maps were created again as described above for the calculation of blood volume (BV), microvascular volume (MVV) (Zaharchuk et al, 1999), and the vessel size index (VSI), which is the ratio of gradient- and spin-echo relaxation rate changes in the presence of MION (Dennie et al, 1998).
Data Analysis and Simulation
The fMRI Data were analyzed using the standard general linear model approach (Friston et al, 1995), in which the stimulus paradigm is convolved with the respective hemodynamic response function for the BOLD or fCBV response to generate a maximum likelihood estimator. Functional activation maps were computed voxel by voxel using an equivalent t-test between the on and off stimulus periods. For the presentation of fMRI activity across the subjects, rat images from each session were aligned relative to a template using 9 degrees of freedom (three translations, three rotations, and three inflations) and multiple runs within each session were averaged into a single paradigm consisting of 3 stimulus/rest epochs for each rat. Thereafter, each of averaged BOLD (or fCBV) paradigm per animal was concatenated across animals for detecting overall group functional activations (see Figure 1). The statistical threshold for significant activation response was P < 0.0001 with a Bonferroni correction for multiple comparisons throughout the measured brain volume.
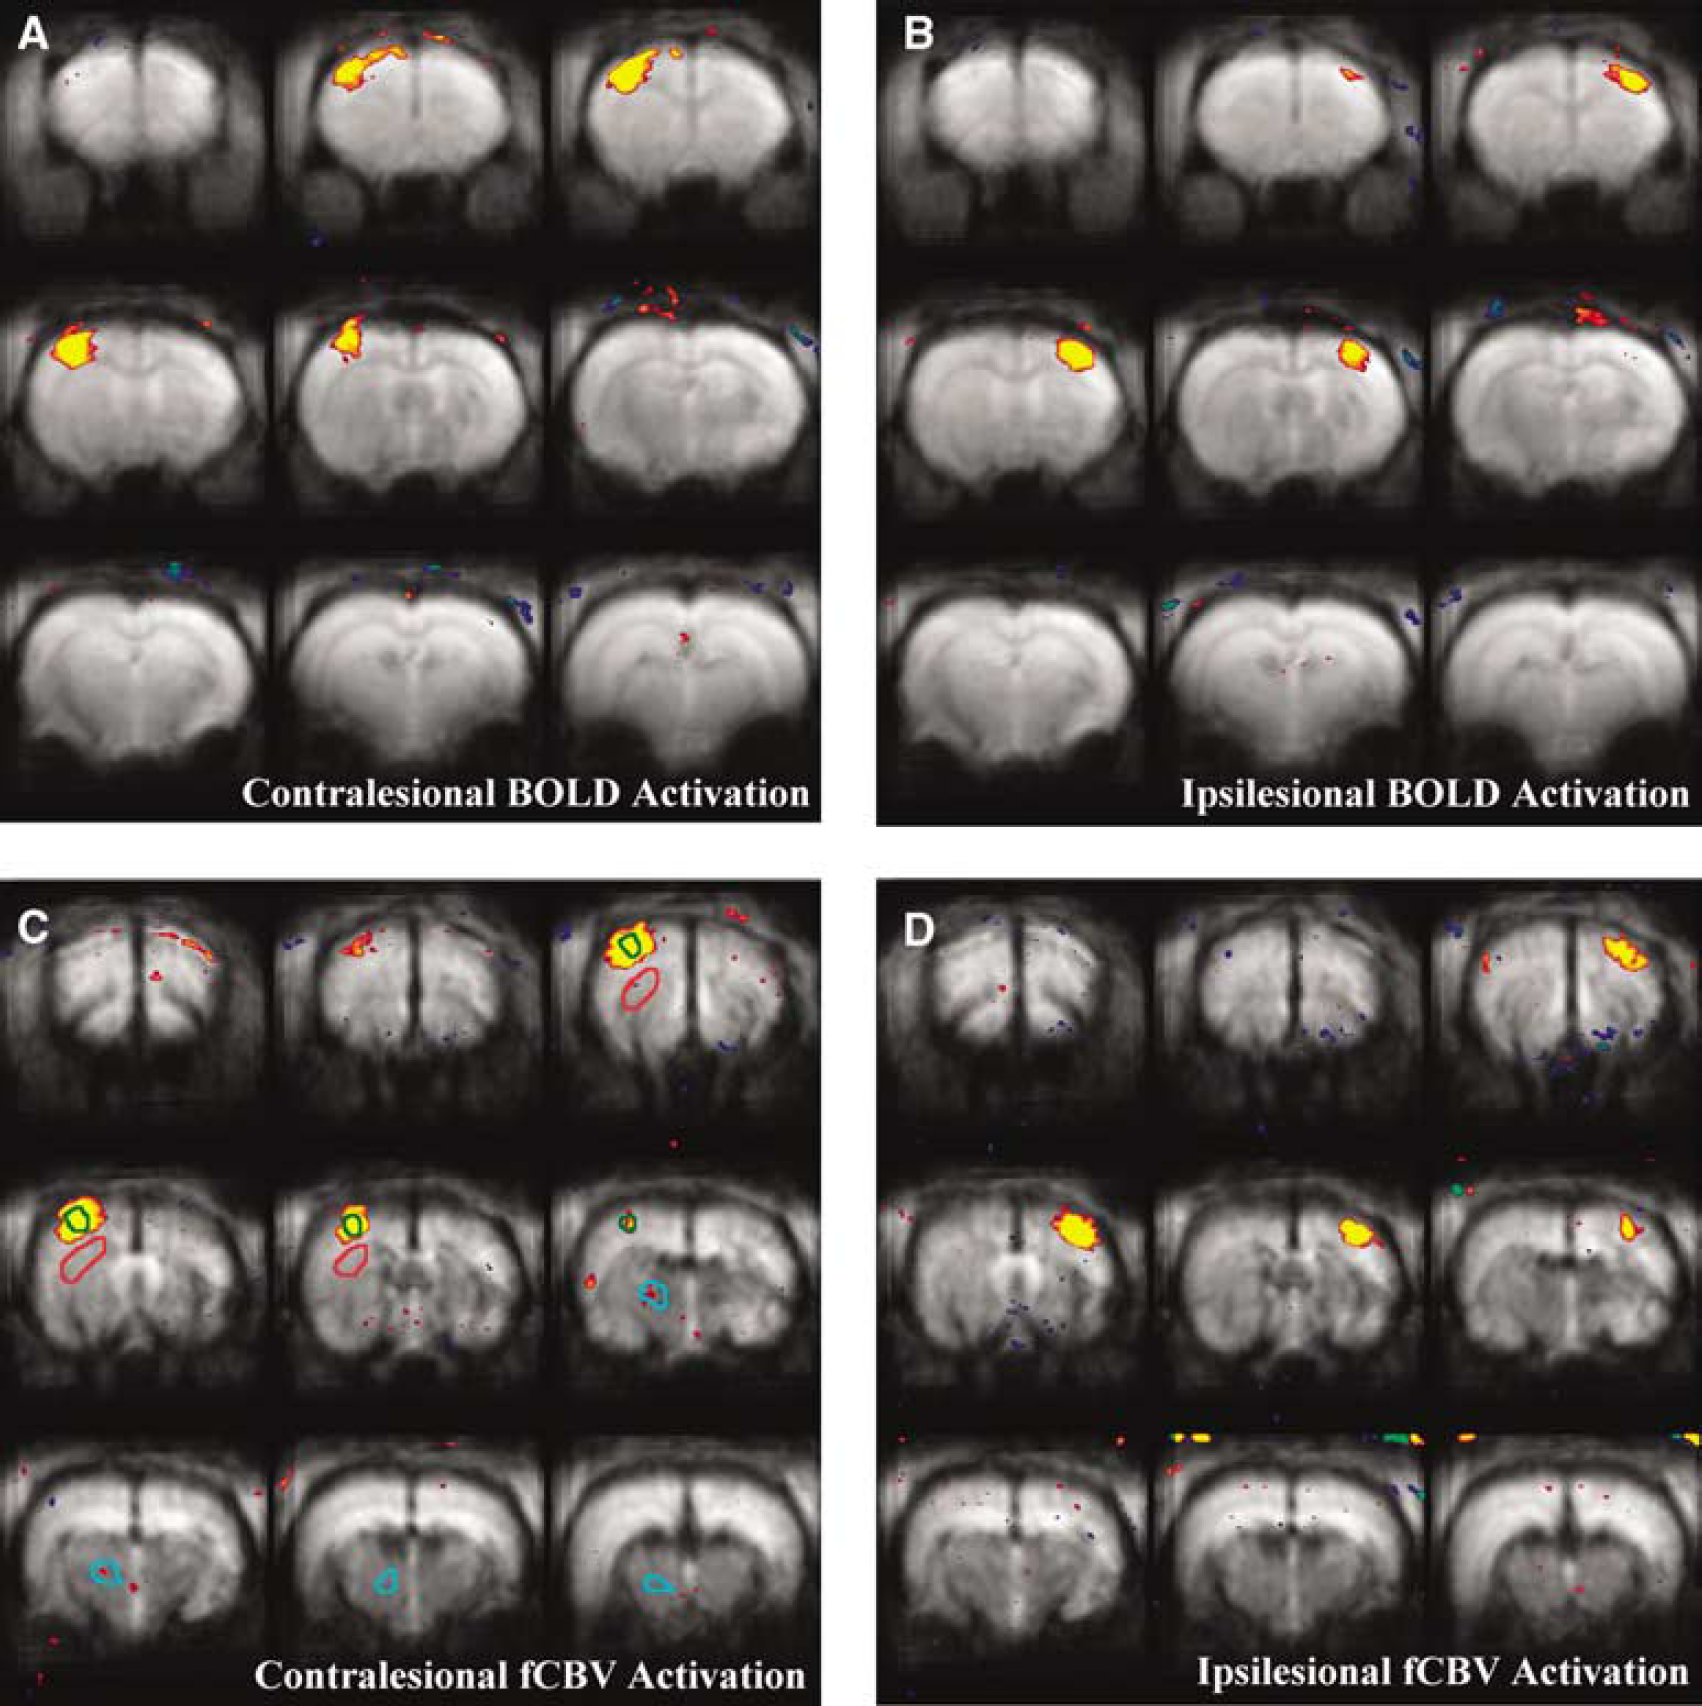
fMRI activation maps of the concatenated albumin-treated rats (n = 6) 2 weeks after the ischemic insult using BOLD (
For all the structural and percent signal change analyses, ROI's were placed over regions identified as primary motor cortex (M1) and forelimb sensory areas (S1fl) based on the rat brain atlas of Paxinos (Paxinos and Watson, 1998). From these assigned voxels, the stimulus/rest epochs (i.e., activation epoch) were averaged across rats. The data from each hemisphere were individually analyzed and combined for the presentation. For the analysis of fMRI activation in SS cortices, the acquired fMRI responses were divided into two categories: (1) contralateral to the stimulated forepaw and (2) ipsilateral to the stimulated forepaw. The contralateral stimulus (i.e., ‘contrastimulus’) was defined as a pair of fMRI activations in the ipsilesional and contralesional SS cortices due to the left and right forelimb stimulations, respectively. Error bars in all the fMRI time course figures show standard errors of the mean across animals.
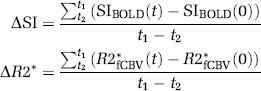
The tissue mean percent signal change (ΔSI) and relative CBV change (ΔR2*) in the SS cortex were acquired for BOLD and fCBV responses, respectively. The ASI was defined (see Equation (1)) as a temporally averaged signal intensity for a duration of 20 secs starting 5 secs after the initiation of each contralateral-stimulus for BOLD while the ΔR2* represents a temporally averaged BV change for 20 secs, starting 15 secs after the initiation of stimulus for the fCBV responses, unless specified otherwise (e.g., ΔSI(t1–t2); t1–t2 = time period used for averaging signal intensity in an activation epoch).
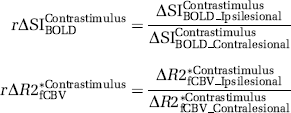
The averaging window for fCBV responses was delayed with respect to the BOLD window to account for the slower fCBV response (Mandeville et al, 1998). Moreover, to reduce the influence of individual variations on the quantification of fMRI activity, the ipsilesional activation magnitude was normalized to the contralesional activation by taking a ratio. The ASI ratios (rΔSI) and ΔR2* ratios (rΔR2*) between contralesional and ipsilesional cortices were calculated as follows:
In addition, time courses of the contralesional and ipsilesional SS cortices were created, and the temporal dependencies were both quantitatively and qualitatively analyzed. Particularly, the percent signal changes of BOLD responses acquired from different regions of the brain and the different time points were normalized to the averaged percent signal change magnitude of the contrastimulus response in the contralesional SS cortex.
For the comparison of MRI-derived structural parameters, each ROI within a slice was analyzed by comparing the ipsilesional value to the contralesional counterpart to minimize any possible variations across slices. Percent differences (i.e., (Contralesional–Ipsilesional)/Contralesional) of ADC, FA, BV, VSI, and microvascular volume (MVV) were calculated for both the SS cortex and the thalamus (Dennie et al, 1998; Le Bihan et al, 2001; Sorensen et al, 1999; Zaharchuk et al, 2000). For the analysis of thalamus, all the MRI-derived structural and functional measurements were performed on the ROI's placed over anatomically defined regions by comparing the acquired MR images to the rat atlas. In particular, the stimulus-dependent bilateral thalamic activity was analyzed (i.e., affected versus unaffected forelimbs). Unless specified otherwise, all the statistical analyses for the ROI's presented in the study were performed using a twotailed t-test. For correlation analyses we applied the Pearson product moment correlation test (and linear regression). All the numerical data were presented as averages ± one s.d. Statistical significance was accepted at a confidence level of 0.95.
Simulations of the fMRI time courses (S(t)) were performed using Matlab (The Mathworks Inc., Natick, MA) by convolving an assumed fMRI IRF (Leite et al, 2002) with the time-dependent neural transfer function as follows:
where * denotes convolution and h(t) and n(t) represent impulse response and neural transfer functions, respectively. As described previously by Leite et al (2002), the BOLD and fCBV IRF's were assembled from a series of exponential basis functions, h(t) = Σκaκ/τκ exp (-t/τκ), by fitting them to the experimentally acquired IRFs from the healthy normal brains. The neural transfer function (n(t)) was modified from a step function in which n(t) is assumed to be exponentially decreasing during the stimulus with varying time constant (τc):
Results
The fMRI results of both BOLD and fCBV responses acquired using the healthy normal rats without the injection of exogenous agents have been previously reported (Kim et al, 2005), and were used in this study to compare with the fMRI measurements of other healthy rat groups that were intracerebroventricularly injected with exogenous agents (i.e., saline and albumin). In general, the fMRI activities of the healthy normal rats were not differentiable from the healthy rat groups, which received the i.c.v. injections of either saline or albumin. These control experiments using healthy normal rats (n = 5) and healthy rats with the injection of either saline (n = 3) or albumin (n = 4) did not reveal any detectible differences either between left and right hemispheres or among different rat groups. Moreover, the SS BOLD and fCBV activities of these animals were not differentiated from the contralesional SS fMRI responses of the stroke animals.
Effects of Albumin Treatment on Functional Magnetic Resonance Imaging Response
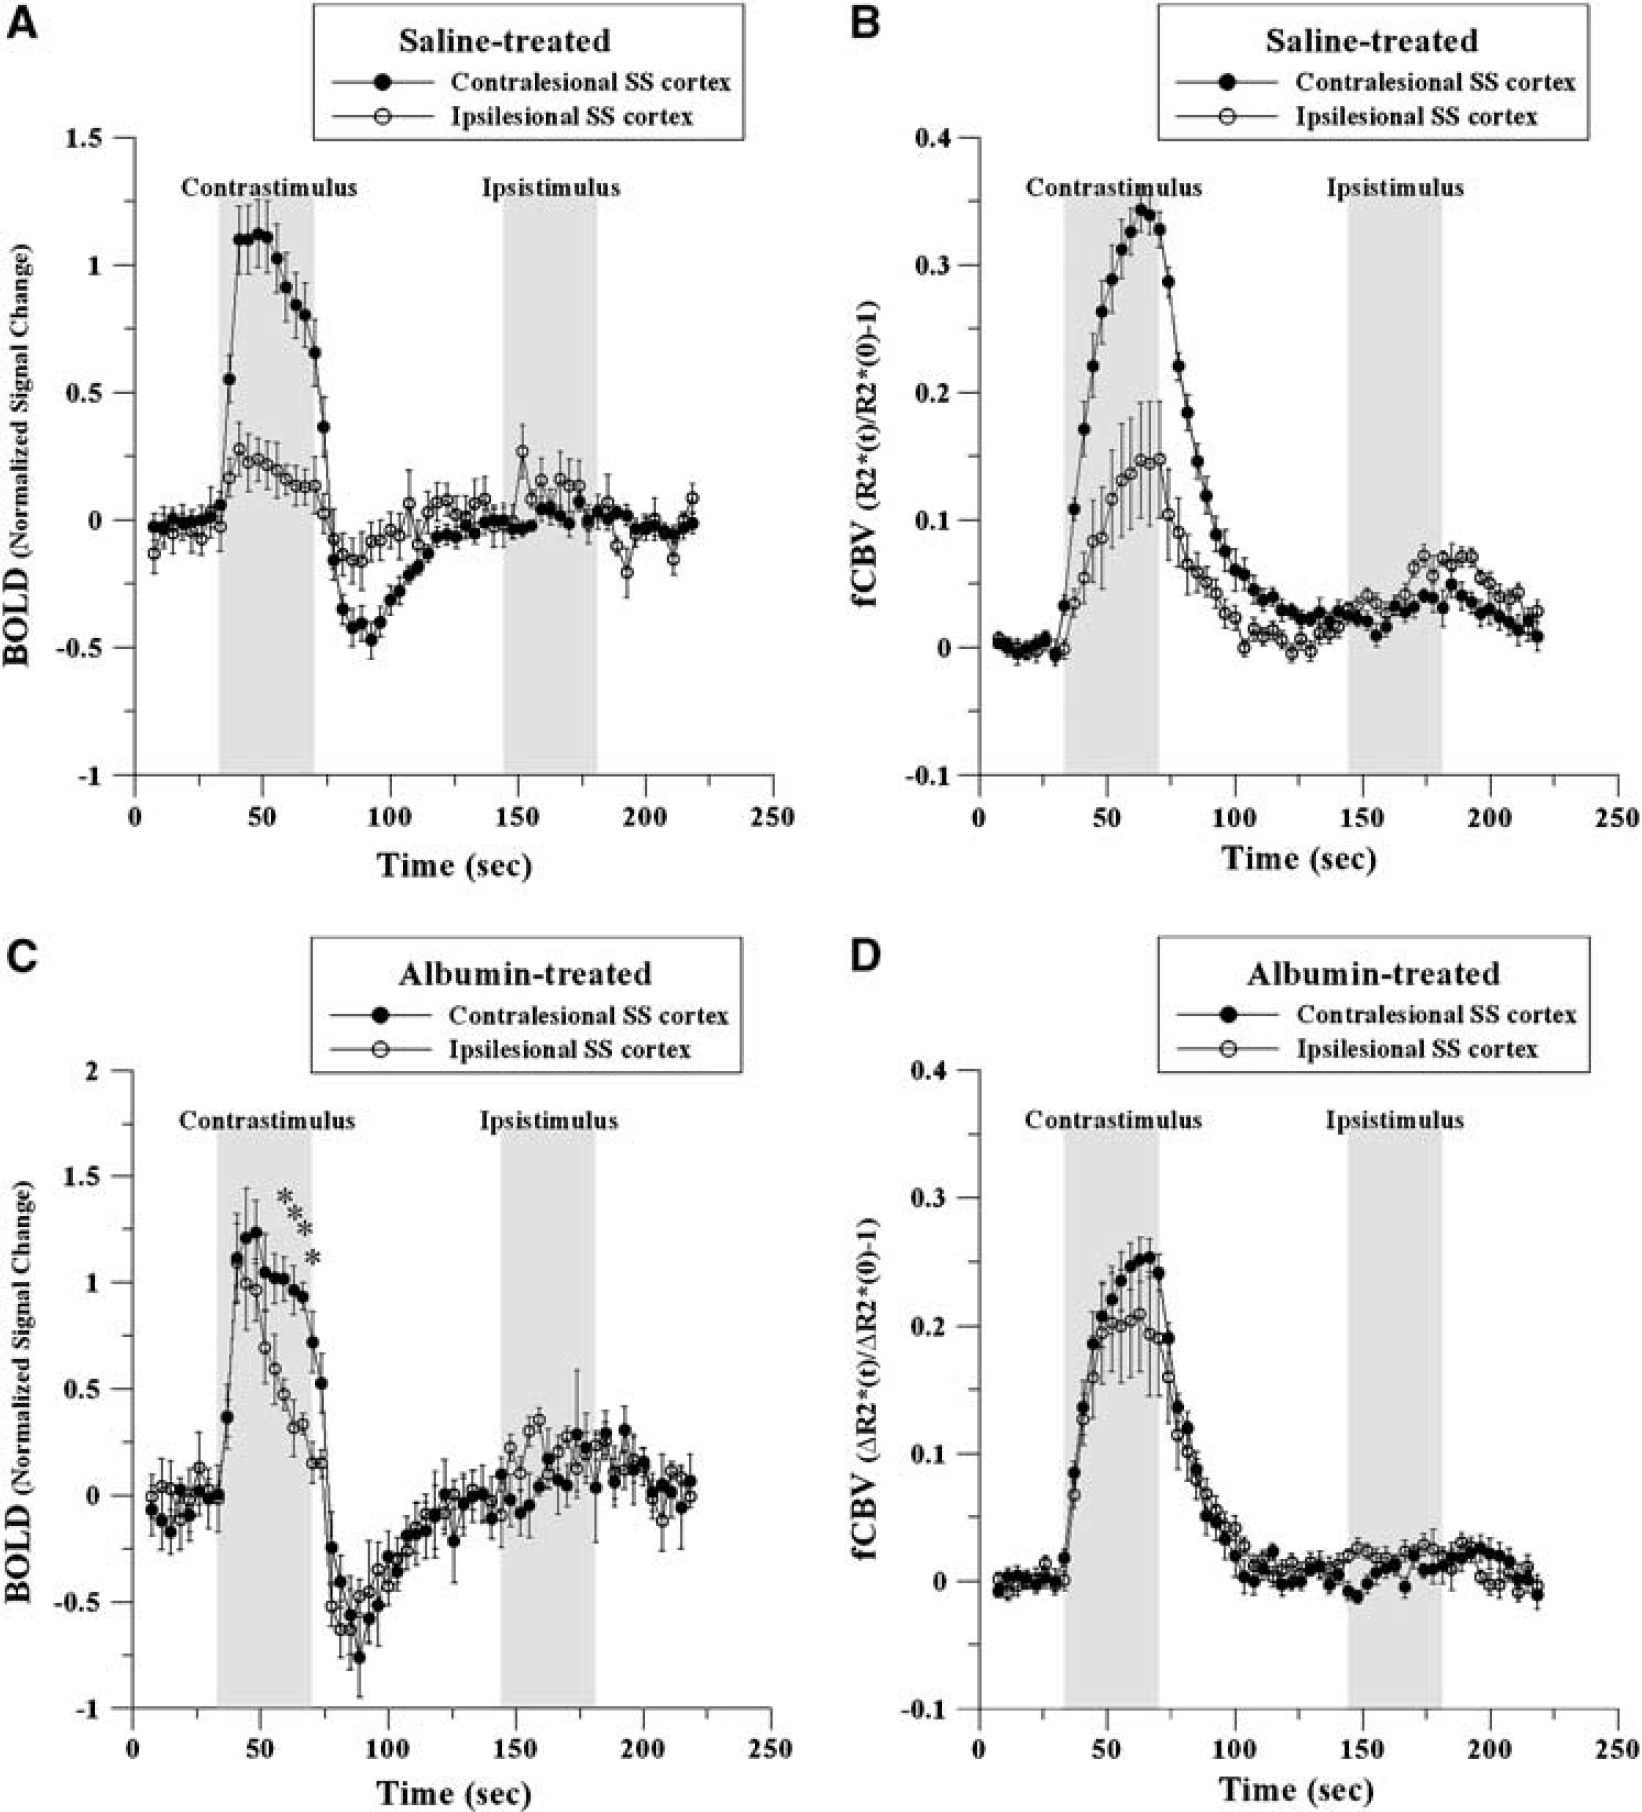
Figure 1 shows the fMRI activation maps generated from the spatially realigned MR images using either BOLD or fCBV method and ROI's that were used for the functional and structural quantification. The mean response magnitude ratio between ipsilesional/contralesional SS cortices (i.e., rΔSI and rΔR2*) provides one means to assess the effect of albumin treatment. For both the albumin-treated and the saline-treated control rats, this ratio was not significantly different using BOLD or fCBV methods. As shown in Figures 2 and 3A, for albumin-treated rats, both rΔSI and rΔR2* were significantly greater than those of the saline-treated rats and nearly recovered to those of normal rats (i.e., ∼1).
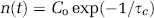
Averaged time courses of fMRI activation responses for saline-treated (
Activation magnitude ratio between the contralesional and ipsilesional sensorimotor cortices (
For saline-treated rats, bi-thalamic activation was observed when stimulating the unaffected forelimbs. An attenuated response was seen when the affected forelimbs were stimulated. While less intense than the control group, forelimb-selective thalamic response was observed in the albumin treated group. Although the mean thalamic activation ratio (i.e., affected/unaffected forelimb stimulation) slightly increased with the albumin treatment (Figure 3B), the reduced thalamic activation during the stimulation of affected forelimb did not improve significantly with the albumin treatments, only revealing a trend towards limited recovery in the thalamic fMRI activation magnitude.
Normalized activation volume (i.e., ipsi/contralesional activation volume) provides another means of assessing albumin treatment. Normalized activation volumes for albumin-treated rats were greater than those for the saline-treated animals when using P < 0.0001 as a threshold for determining the activated region (Figure 3C). Both the BOLD and fCBV methods, activation volume ratios of albumin-treated rats were significantly greater than the activation volume ratios of saline-treated controls. As depicted in Figure 1, the fMRI activation maps of the albumin-treated rats show approximately equivalent activation volumes between the contralesional and ipsilesional cortices.
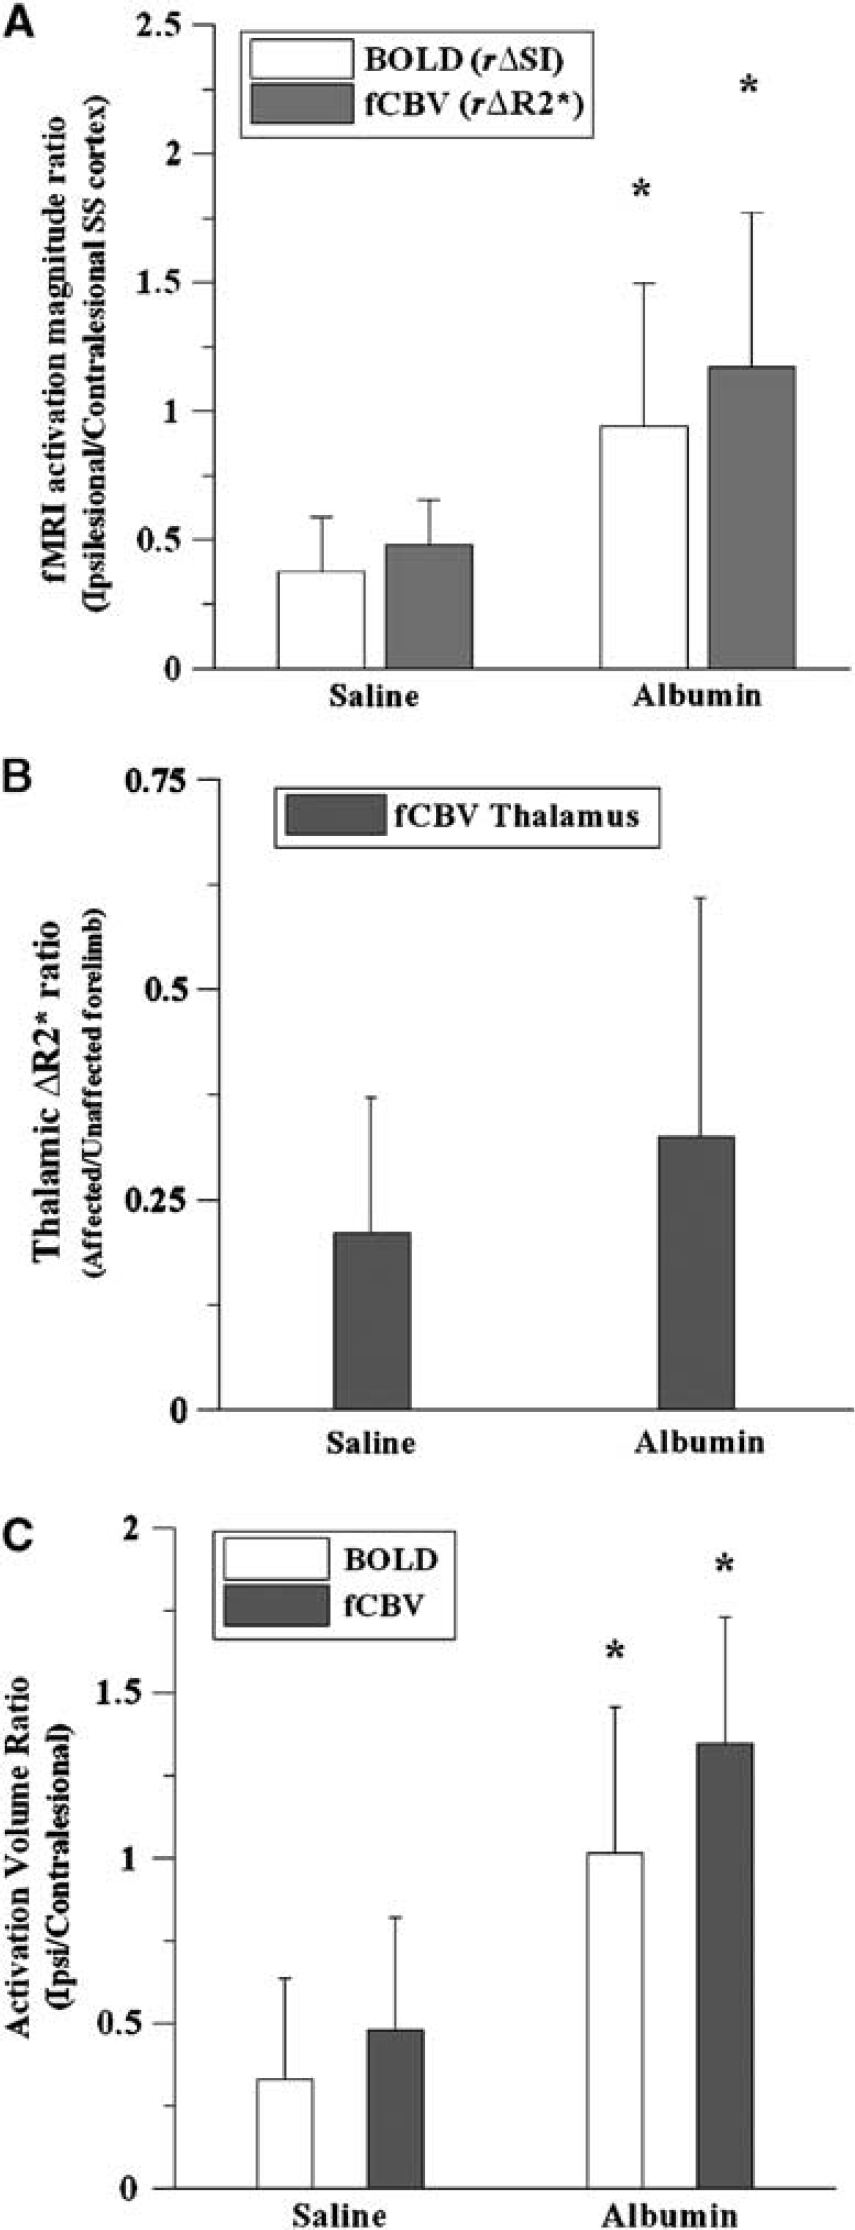
For both animal groups, subtle negative responses were observed using both the BOLD and fCBV fMRI techniques in the region corresponding to the caudate nucleus, mostly when unaffected forelimbs were stimulated (see Figure 4). In general, the negative response magnitude in the basal ganglia was approximately 25% of the positive BOLD and fCBV response magnitudes that were acquired from the SS cortex. The caudate fCBV response amplitude was significantly correlated with the SS cortex fCBV activation amplitude of each rat (data not shown). For fCBV response, the rise time to the nadir of the negative response differed from the time to reach the apex in the positive SS response. The average caudate response reached a plateau approximately 11 secs after the onset of stimulation (Figure 4), while the fCBV response curve acquired from the SS cortex reached the highest point approximately 30 secs after the onset of stimulation (Figure 1). Moreover, it appears that the BOLD negative response curve in the caudate area mirrors the positive BOLD response curve: the percent signal change decreased during the stimulus in the caudate area while it increased in the SS cortex. However, the negative response did not contain the temporal dependence that corresponds to the poststimulus dip, which is apparent in the SS cortex (see Figures 1A and 1C).
BOLD and fCBV caudate responses normalized to the SS responses for the saline-treated rats during stimulation of unaffected and affected forelimbs: CC, contralesion-contrastimulus and CI, contralesion-ipsistimulus (n = 7).
Relationship Between Ipsilesional Functional Magnetic Resonance Imaging Activation Magnitude and Magnetic Resonance Imaging-Derived Structural Parameters
Various MRI-derived maps were used for the structural quantification of albumin-treated rats: the calculated structural parameters were ADC, FA, CBV, MVV, and VSI (Kim et al, 2005). The total lesion size, quantified from the T2 map (Figure 5), was not significantly different between animal groups. Moreover, no other MRI-derived structural improvements (i.e., lesion volume, ADC and FA) were found with the albumin treatment in comparison to those of saline controls. For saline-treated rats, no significant correlation was found between MRI-derived structural parameters (i.e., ADC and FA) and fMRI activation magnitude, whereas a negative correlation between fMRI activation and ADC was observed for albumin-treated rats (Table 1). For the structural parameters, lesion volume, ADC, and FA were significantly correlated between each other in both animal groups. However, the correlation pattern between ADC, FA, CBV, VSI, MVV, and lesion volume was different between the albumin- and saline-treated rat groups. As shown in Table 1, the resting CBV significantly correlated with ADC and total lesion volume for the saline-treated rats, while these correlations were not significant for the albumin-treated animals. The correlation pattern between VSI, MVV, and other structural parameters was also differentiable between two animal groups.
Correlation coefficient (r) between MRI-measured structural parameters and functional activities (CS—contrastimulus) using somatosensory ROIs for albumin-treated (a) and saline-treated (b) rats
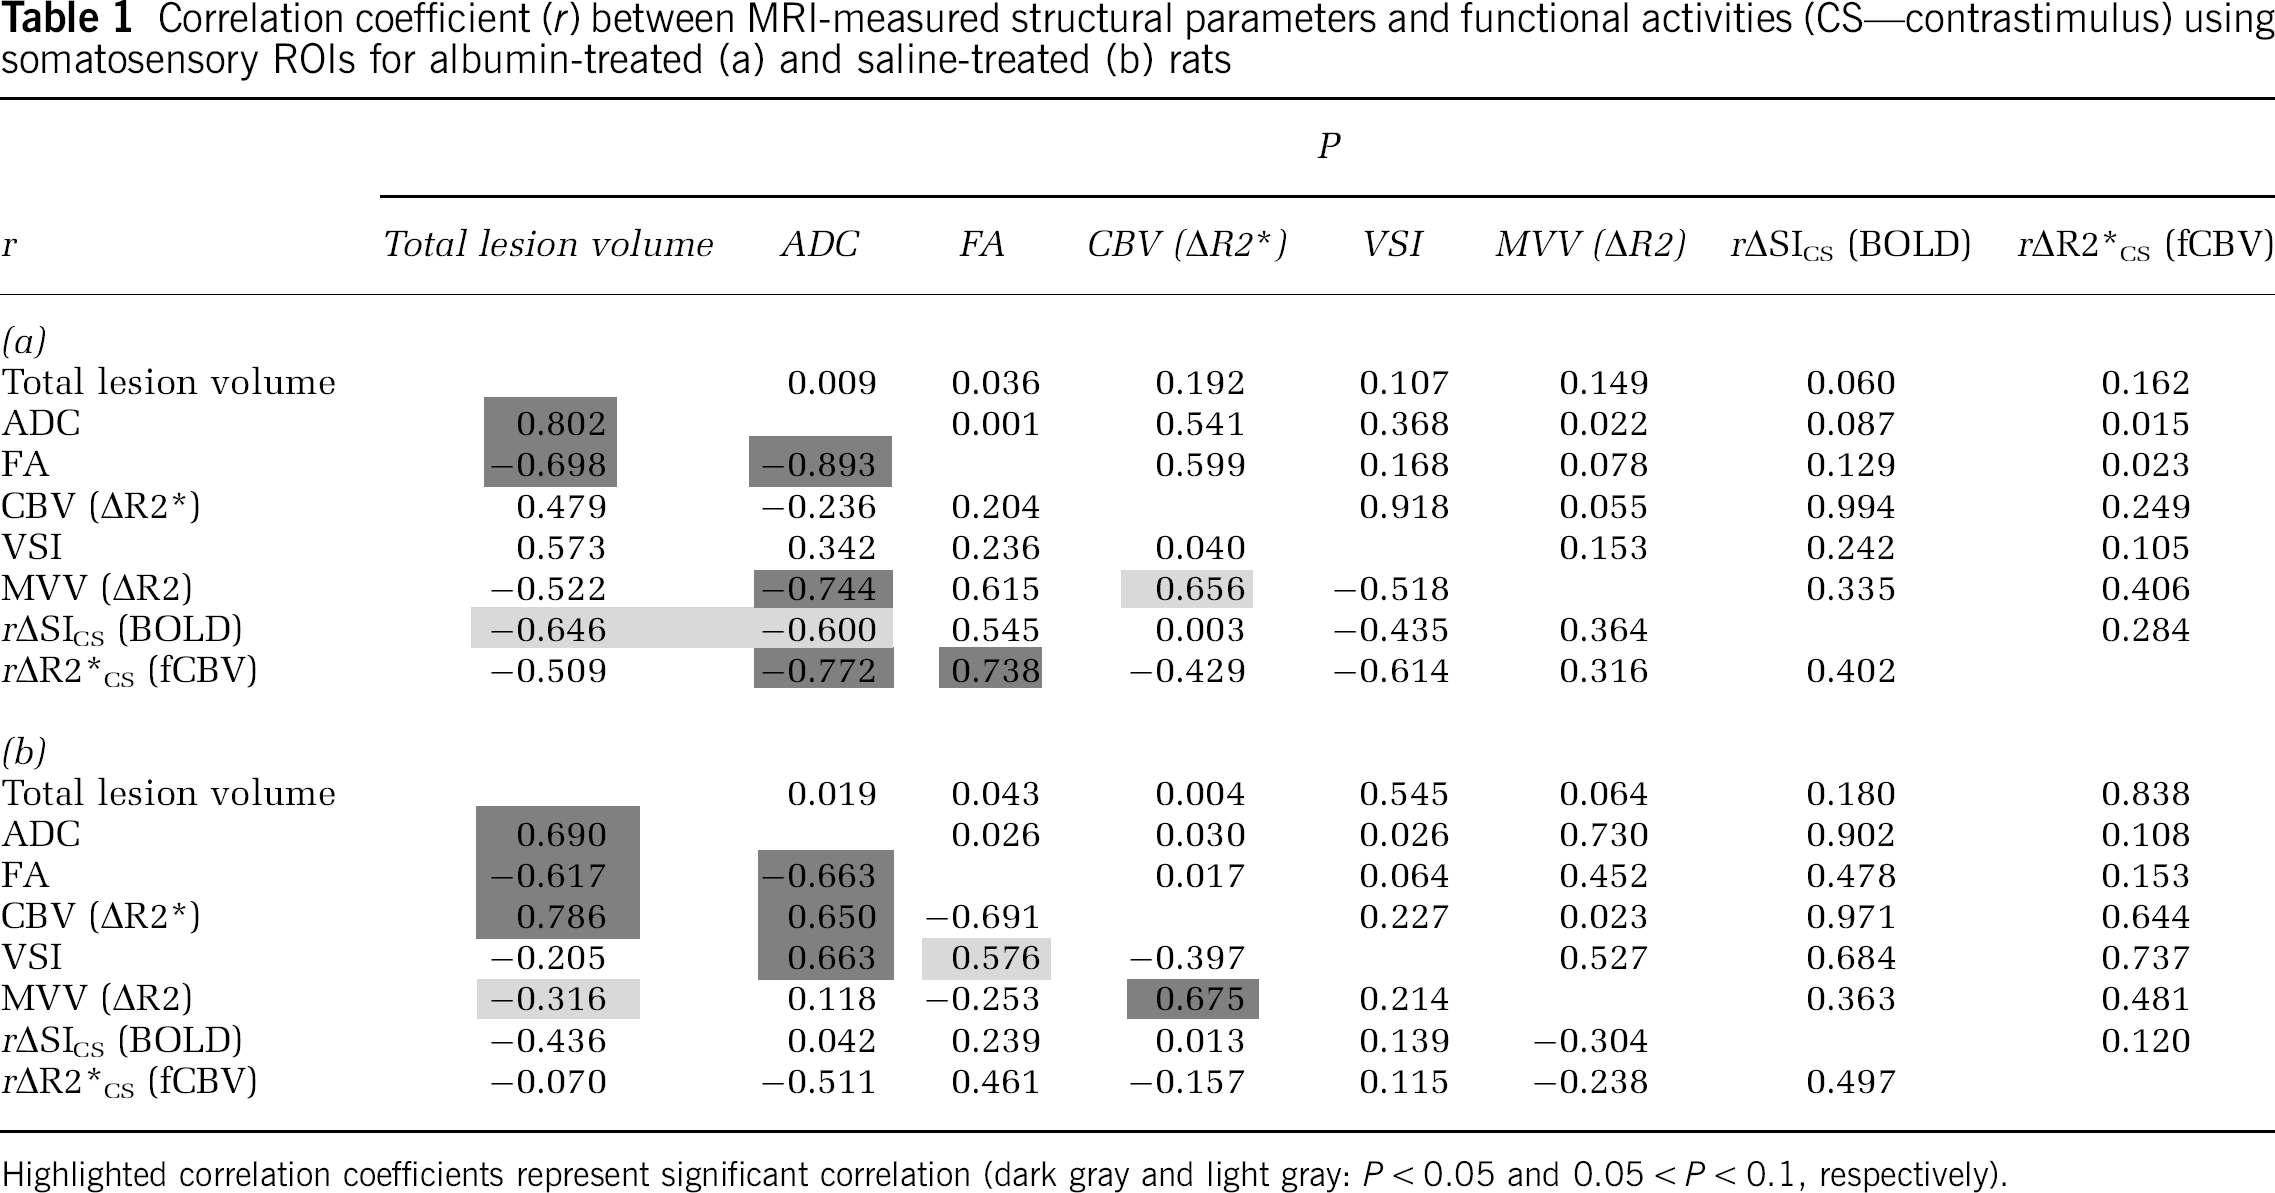
Highlighted correlation coefficients represent significant correlation (dark gray and light gray: P < 0.05 and 0.05 < P < 0.1, respectively).
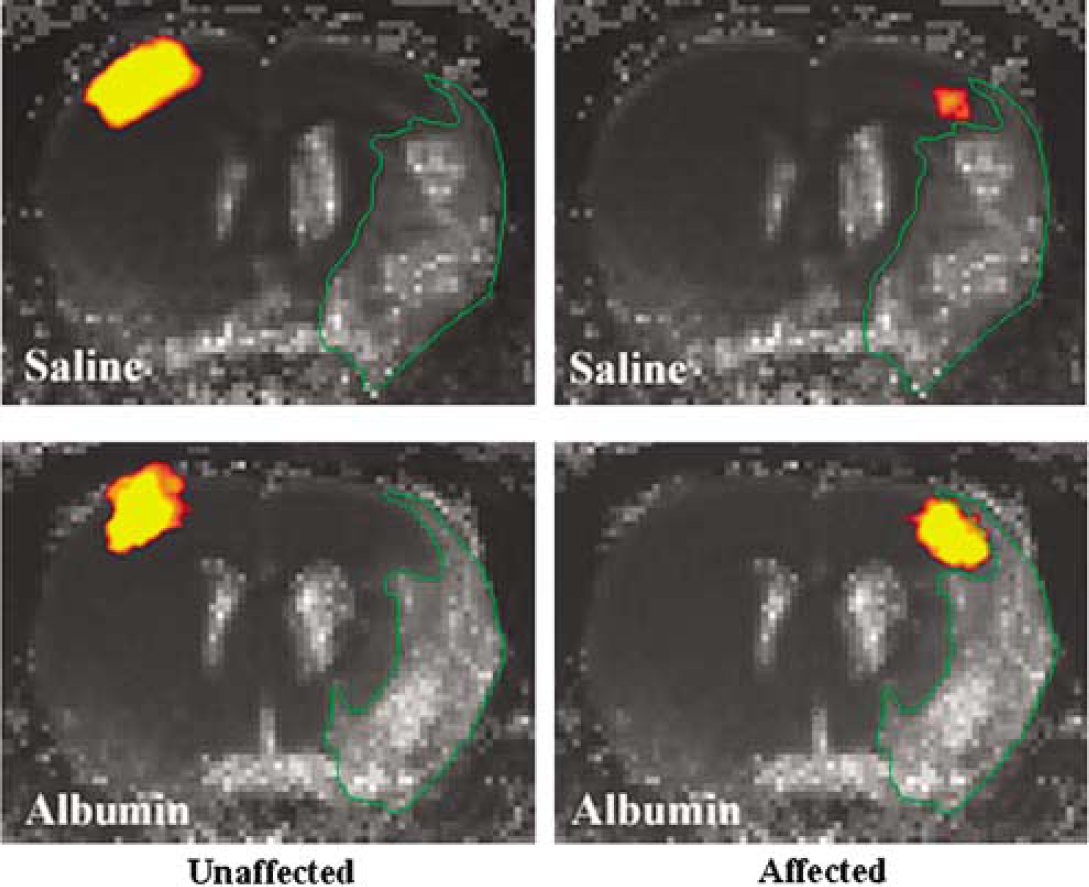
fCBV activation overlays on the averaged T2 maps for the stimulation of unaffected (left column) and affected (right column) forelimbs in the saline-(top row: n = 7) and albumin-(bottom row: n = 6) treated rats: Lesion is outlined in green.
Differences Between Functional Magnetic Resonance Imaging Reporters (Blood Oxygenation Level Dependence and Functional Cerebral Blood Volume)
In general, time-dependent signal intensity characteristics were similar between contralesional and ipsilesional responses. However, the temporal pattern of the ipsilesional BOLD response in albumin-treated rats (Figure 2C) was altered when compared with that of the contralesional–contrastimulus response. The ipsilesional response exhibited a sharp decrease of BOLD response signal after maximal activation during the period of continued electrical simulation. In contrast, the fCBV responses from the ipsilesional cortex and contralesional SS cortex of albumin-treated rats remained nearly identical (Figure 2D). While the observed differences in the BOLD and fCBV temporal responses in the albumin-treated animals could indicate an altered neural-hemodynamic coupling in the ipsilesional region, an alternative explanation is that only the neural response is altered, but this is reflected differently by the two methods due to the slower response of fCBV relative to BOLD signal. To test the latter hypothesis, we performed linear model calculations.
The convolution of simulated BOLD and fCBV IRFs (see Equation (3) and Figure 6A) with exponentially decreasing neural transfer functions of differing time constants (Equation (4) and Figure 6B) resulted in fMRI time courses that are similar to the observed BOLD and fCBV responses acquired from albumin-treated brains, as shown in Figures 6C and 6D. The IRF created from the exponential basis of τk (secs) = (6,17) yielded the best-fit results for the contralesional BOLD and fCBV time courses with ak = (4, −3) and ak= (0.2,0.8), respectively. Using an exponentially-decreasing neural transfer function with τc = 200 secs (see n1(t) in Figure 6B), the generated time course fits were similar to the BOLD and fCBV time courses acquired from the contralesional SS cortex (Figure 6C). The convolution with a rapidly decreasing neural transfer function with τc = 50 secs (see n2(t) in Figure 6B) generated a BOLD time course similar to that acquired from the ipsilesional albumin-treated brain (Figure 6C). By replacing n1(t) with n2(t), the negative slope of the BOLD signal response (which usually starts ∼ 8 secs after the onset of stimulus) intensified while the magnitude of the ‘postdip’ is slightly smaller than that measured in the contralesional cortex. As for the simulated fCBV fMRI time course, the plateau of the maximum fCBV was reached earlier using n2(t) than n1(t) (Figure 6C). Similar to the simulated BOLD results, this ipsilesional fCBV response of the albumin-treated rat was generated by convolving the IRF with a rapidly decreasing neural transfer function (i.e., n2(t)). As a result, these findings support that the neuro-hemodynamic coupling was not affected in the albumin-treated brains while the temporal profile of the neuronal response was independently altered, suggesting a rapid habituation of the neuronal response during the electrical forelimb stimulation in the ipsilesional SS cortex.
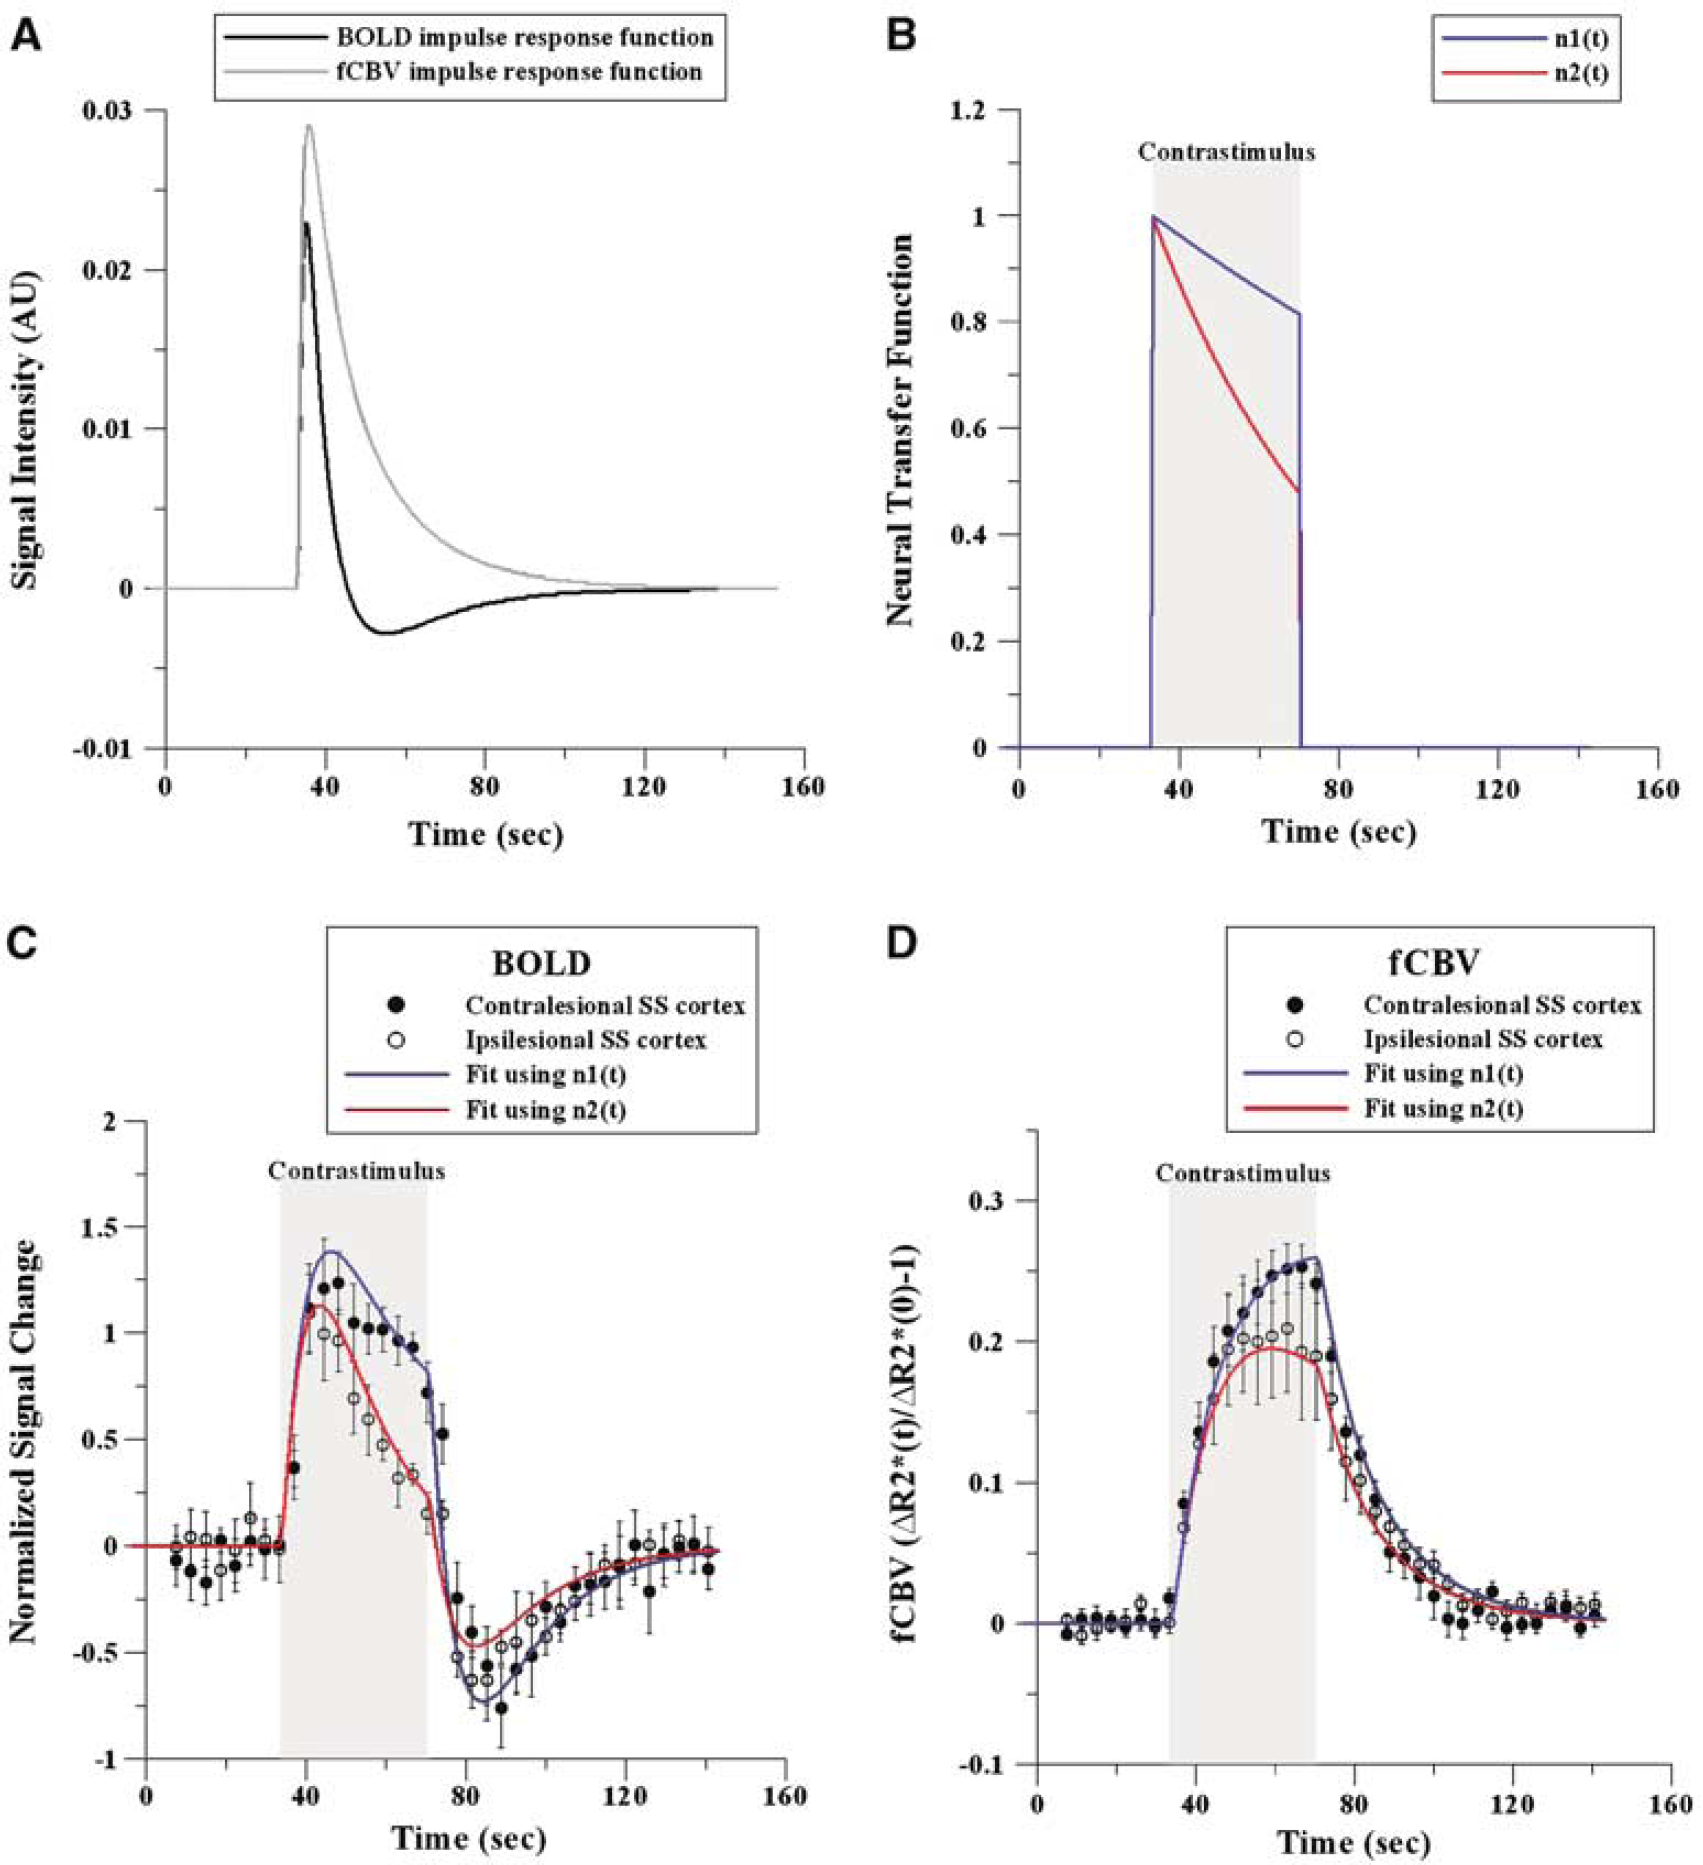
BOLD and fCBV IRFs (
Discussion
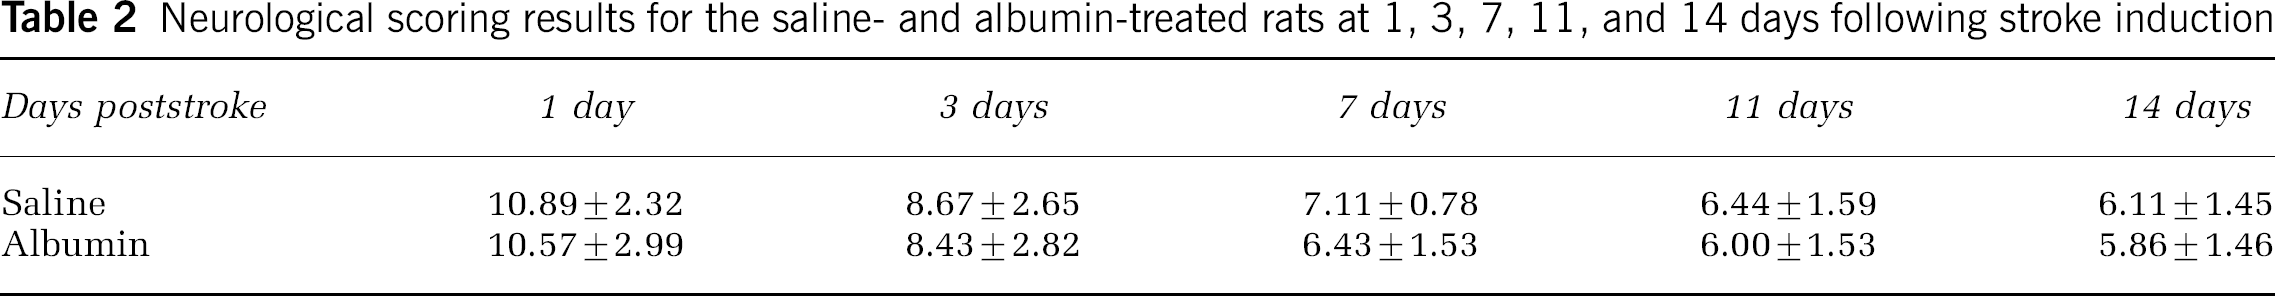
Previously, we reported an alteration of the fMRI response amplitude and its dependence on measurement techniques in transient focal ischemic models (Dijkhuizen et al, 2001, 2003; Kim et al, 2005). In the current study, we examined the effects of pharmaceutical intervention with albumin on the fMRI signal characteristics and whether the quantified fMRI response could contribute to understanding of the recovery processes. Specifically, we characterized and evaluated the fMRI response change induced by highly delayed i.c.v. administration of BSA. Our results revealed administration of an albumin solution had a significant influence on the fMRI response of ischemic brains although there was no apparent improvement either in total lesion size or in neurologic scores (Table 2). We speculate that the fMRI activation-neurologic status mismatch of the current study is reflected on the limited recovery of fMRI activity as shown in the only partially restored ipsilesional BOLD SS response (see Figure 2C).
Neurological scoring results for the saline- and albumin-treated rats at 1, 3, 7, 11, and 14 days following stroke induction
As reported previously, it is probable that the administration of an exogenous neuroprotective agent produces certain recovery responses and patterns that are detectible by fMRI and possibly unique to the therapeutic agent (Kim, 2005). As shown in the Figure 3A, the fMRI response magnitude ratios (i.e., rΔSI and rΔR2*) were significantly elevated after treating with albumin in comparison to the saline control. Despite the lack of reduction of lesion volume and apparent behavioral recovery, it was surprising that the fMRI response magnitude (i.e., area under the curve), albeit highly variable across subjects, was nearly restored to the normal value even after such a long treatment delay. However, as previously reported (Kim et al, 2005), the bithalamic activity was reduced in both stroke animal groups (albumin- and saline-treated) when the affected forelimb was stimulated in comparison to the bithalamic activity during the stimulation of the unaffected forelimb. Although the activation magnitude ratio (affected/unaffected) slightly recovered with the albumin treatment, the improvement was not statistically significant. The implication of varying bithalamic thalamic activity during the electrical forelimb stimulation is currently not well understood. However, considering the conventional role of thalamus, a suggestion can be made that the neural connectivity is hampered by stroke-induced damages affecting the overall functional recovery (e.g., neurologic scoring). These findings may provide a basis for the study of albumin as a therapeutic agent in the clinical treatment of stroke patients, who missed the effective time window of thrombolytic therapy (Dijkhuizen et al, 2002).
In addition to the phenotypic outcomes of albumin treatments, which revealed a strong dependency on the treatment time window, the half-life of albumin in blood, and the administered dose (Belayev et al, 1999a, b, 1997), Belayev et al (2004) recently have shown in transient focal ischemic rat models that delayed-albumin administration at 19 h after the onset of ischemia does not produce adverse effects when evaluated by either infarct volume or neurologic scoring. In fact, neurologic scores appeared positively influenced even with such a delayed application of albumin (Belayev et al, 2004). Similarly, delayed therapeutic effects were found from the use of bFGF, in which a mismatch was apparent between the therapeutic time window, evaluated by infarct volume, and the prolonged endogenous progenitor cell activity (Wada et al, 2003). Despite the lack of a clear understanding of the mechanisms, these observations suggest that neuroprotective agents can retain functional effectiveness well beyond the apparent time window of structural preservation and that the quantified fMRI response may reveal subtle changes in brain function that are not reflected by the anatomic status, rather than merely confirming the reduction in structural degradation or behavioral indices in animal model studies. The implication of our current findings is that fMRI may assist in understanding and validating the recovery process of in vivo neurovascular functionality, which may not be facile to explore with other available techniques.
Since the delayed-albumin treatment did not affect the overall MRI-derived structural parameters, it appeared that the improvement of fMRI response could not be related to local lesion volume and severity alone. As shown in Figure 5, the lesion volume of the saline-treated rats was equivalent to that of the albumin-treated rats. Figure 5 specifically depicts that the activation does not occur within the T2-defined lesion area. The fMRI activation is also excluded by the lesion in the albumin-treated rats, despite the significant increase of ipsilesional responses. When the structural parameters of the SS cortex were compared with the functional response amplitude, it was notable that no significant correlation between the functional and structural parameters was found for the saline-treated group, while such correlations were found for the albumin (Table 1). Specifically, for the albumin-treated rats, there were significant correlative relationships between the diffusional MRI measurements (ADC and FA) and the fCBV activation magnitude. It can be suggested that the difference of the structure-function correlation coefficients between two animal groups is probably due to the improved fMRI activation magnitude in the albumin-treated brains, which resulted in a greater dynamic range for more reliable correlation analysis. Therefore, it could be inferred that although there were no statistically significant therapeutic improvements in local structural MRI parameters, the recovered fMRI activation magnitude was influenced by the degree of structural degradation. However, the correlation pattern among structural parameters (i.e., ADC, FA, CBV, VSI, MVV, and lesion volume) was different between two animal groups. Specifically, the correlation coefficients among parameters referring to brain tissue degradation (i.e., ADC and total lesion volume) and vascular (i.e., CBV, VSI, and MVV) parameters, which were statistically significant in the albumin-treated rats, were not significant in the saline-treated rats, and vice versa. This difference suggests that albumin may aid in the structure-dependent vascular transformation during the recovery phase of stroke.
Another peculiar aspect of the fMRI response was that the temporal dependencies were differentiable between two groups and that this difference was also dependent on the measurement technique. In particular, a striking difference in the temporal dependence was observed between contralesional and ipsilesional BOLD responses of the albumin-treated rats (see Figure 2C). Interestingly, the corresponding ipsilesional fCBV response was not clearly differentiable from the contralesional response (see Figure 2D). Assuming no long-term variation of fMRI responses (i.e., the BOLD experiment was always performed before fCBV experiment), these results imply unusual changes in the cerebral metabolic rate of oxygen and/or cerebral blood flow during the stimulation in the recovering ipsilesional SS cortex of albumin-treated rats (Mandeville and Marota, 1999).
In order to better understand the temporal characteristics of the observed BOLD and fCBV responses, we numerically simulated fMRI time courses. The model assumes that there is a linear relationship between the neuronal and hemodynamic responses, independent of stroke or other related factors. By varying the temporal dependence of the neural transfer function (n(t)) without changing the IRF (h(t)) (see Equation (3)), we constructed fMRI responses that are similar in time and magnitude to those of both BOLD and fCBV time courses acquired from the contralesional and ipsilesional albumin-treated brains. The simulation results show that the fMRI response could be significantly transformed independent of h(t) and that changes in n(t) could introduce selectively altered temporal characteristics, which are heavily dependent on the fMRI reporter (i.e., BOLD and fCBV). While we cannot prove that the actual neuronal response is modified in such a way, the fMRI results are consistent with a modified neural response function in this study. This outcome cautions against an interpretation that the integrity of neuro-hemodynamic couplings is modified and further indicates that the use of unbiased IRFs should be considered for such experiments. These results show that analysis of fMRI responses using two distinctive reporters (i.e., BOLD and fCBV) can reveal more detailed descriptions of neuronal function.
Although shown in the current study, the similarity between rΔSI of BOLD and rΔR2* of fCBV methods has not been the case for the stroke models used in the previous study (Kim et al, 2005), where rΔSI was significantly smaller than rΔR2*. The mismatched finding between the untreated animals used in the previous study and the current saline-treated rats could have resulted from the difference in duration of occlusion (90 min ‘current study’ versus 120 min ‘previous study’) and/or the parenchymal trauma due to the i.c.v. injection of exogenous agent. Since these factors could complicate the experimental outcomes, it is not evident which factor could have contributed more to this trend. It will be informative to investigate in a controlled setting whether the BOLD signal is reduced by the duration of ischemic insult or whether the vasogenic response, due to trauma, elevated the BOLD related hemodynamic responses. Although we may speculate that the recovery process of albumin-treated rats differs from that of the control animals, the direct reason for this recovery difference remains to be determined.
In addition to primary sensorimotor (M1/S1fl) responses, fMRI studies of forepaw stimulation have reported activations in other brain areas including secondary sensory cortex (Keilholz et al, 2004; Kim et al, 2005), thalamus (Dijkhuizen et al, 2001, 2003; Kim et al, 2005), and cerebellum (Van Camp et al, 2005). In the current study, a negative response in the contralesional caudate area was detected by both BOLD and fCBV techniques and in both albumin- and saline-treated animals. Similar to the thalamic response (Figure 3B), the negative responses in the caudate area were detected mostly when the unaffected forelimb was stimulated (Figure 4), although this may simply reflect a larger generalized response for unaffected forelimb. Moreover, the temporal profiles of the caudate negative responses do not exactly mirror the SS fMRI responses. In this regard, the negative caudate response may not be dependent on a simple mechanistic link (e.g., ‘steal effect’) to the hemodynamic changes in the SS cortex. As such, the nature of this negative response could be intrinsically different from the fMRI responses that are directly induced by the stimulus and may be related to the local reduction of functional metabolism. The cause of such responses is not known; however, the negative caudate response appears similar to the receptor-mediated negative activation (Marota et al, 2000). Furthermore, we posit that the nonselective electrical stimulation of nerve bundle (both sensory and motor) may have evoked the net effect composed of localized positive and negative activations.
In summary, we have shown that ischemic brains responded to the delayed i.c.v. administration of albumin, as assessed by fMRI measurements. A dramatic restoration of fMRI response in the ipsilesional SS cortex was detected in albumin-treated animals as compared with saline-treated controls. Further evidences suggest that the neurohemodynamic linkage was not altered in ipsilesional cortex, but restoration of activation was accompanied by a stronger neural habituation in the temporal domain. In conclusion, we showed that quantified fMRI responses can be used for defining recovery traits of albumin-treated stroke animal models and for providing insights into the detailed recovery process of neurovascular function.
Footnotes
Acknowledgements
The authors gratefully acknowledge Dr Christian Farrar for reviewing the manuscript.